


Abstract
Background: The current enormous differences in international health expenditure are related to disparities in national economic resources. Over the past two decades, reducing health inequalities and progressing towards universal health coverage have been international priorities. We investigated whether between-country differences in health expenditure narrowed and whether the cross-country association between health expenditure and national economic resources weakened. Methods: We analyzed annual World Health Organization data on current health expenditure (CHE) per capita and gross domestic product (GDP) per capita for nearly all countries and territories worldwide from 2000 through 2023. Current purchasing power parity (PPP) was the primary monetary metric; current-US-dollar analyses were complementary sensitivity analyses. We quantified between-country dispersion, estimated annual cross-sectional GDP-CHE scaling, tested secular change using pooled country-year models with country-clustered standard errors, and assessed persistence of country-level deviations. Results: In current-PPP analyses, CHE inequality declined modestly by Gini (0.608 in 2000 to 0.588 in 2023) and CV, while P90/P10 and the standard deviation of log CHE did not show comparable secular narrowing. GDP Gini declined more (0.592 to 0.546). The mean annual GDP-CHE scaling exponent was 1.065 (SD 0.027). In the pooled model, there was no statistically detectable secular weakening of this relationship after accounting for the 2020–2021 period (annual change in exponent +0.0013; p = 0.354). A flexible temporal sensitivity showed a nonlinear trajectory without a statistically detectable net 2000–2023 gradient decline. The 2020–2021 slopes were the highest in the series and exceeded the specified linear-trend expectation (+0.0306; p < 0.001). Country deviations from GDP-predicted CHE were highly persistent, as follows: consecutive-year residual correlations averaged 0.963, and residuals in 2000 remained correlated with those in 2023 (r = 0.671). Current-US-dollar analyses supported the absence of detectable weakening of the GDP-CHE gradient and persistent country positioning, but did not reproduce the PPP comparison of relative CHE-versus-GDP inequality declines. Conclusions: International differences in per capita health expenditure narrowed modestly by some measures in the primary current-PPP analysis, but the extent of narrowing depended on the dispersion measure and monetary metric. By contrast, the strong cross-country GDP-CHE association showed no detectable secular weakening over 2000–2023.
1. Introduction
Differences in the resources available for health care across countries remain enormous and are strongly associated with national income. The relationship between national income and health expenditure has been recognized for decades [1,2,3], but its interpretation has long been debated. At the aggregate national level, estimated income elasticities range from below to above unity depending on the level of analysis, country group, model specification, and treatment of heterogeneity [2,3]. National income is therefore a dominant correlate of health spending, but not its only determinant, as follows: demographic structure, medical technology, relative prices, financing arrangements, and health-system policies and institutions also contribute to cross-country differences [4,5,6].
Since the beginning of this century, reducing health inequalities, expanding access to health care, and progressing toward universal health coverage (UHC) have become explicit international priorities. UHC, however, is principally concerned with access to needed services and protection from financial hardship; it does not require convergence in national health expenditure per capita, nor does it imply that health spending should become independent of national income [7,8]. The distinction is important for the present study, as follows: changes in service coverage or financial protection can occur without a corresponding transformation of the cross-country economic structure of health expenditure.
During the same period, countries experienced substantial economic development, health systems expanded, domestic public financing evolved, and international development mechanisms sought to improve access to health services in resource-constrained settings. WHO global expenditure reports document marked changes in both the level and composition of health financing [9,10,11]. Previous work also shows that policies, institutions, demographic change and technological adoption can account for persistent differences in health spending beyond income alone [4,5,6]. Global analyses have additionally documented that large health-spending gaps can persist despite faster spending growth in some lower-income groups [12], while convergence studies in OECD and ASEAN settings show that results vary by sample, expenditure component, and convergence concept [4,13]. These observations make the temporal stability of the global GDP-CHE relationship and the evolution of between-country dispersion empirical questions rather than assumptions.
To address this issue, we focused on two questions. First, did between-country dispersion in CHE per capita narrow between 2000 and 2023? We use narrowing descriptively to mean a reduction in cross-sectional dispersion over time and do not treat it as evidence of beta-convergence, stochastic convergence, convergence clubs, or a common long-run growth path [4,13]. Second, was any narrowing accompanied by progressive weakening of the cross-sectional GDP-CHE relationship? We addressed these questions using annual data from nearly all countries worldwide, comparing multiple dispersion measures for CHE and GDP, examining annual GDP-CHE scaling, assessing temporal change in that scaling, and measuring persistence of countries’ positions around the global relationship.
Throughout this study, we use the term “decoupling” specifically to denote a progressive weakening over calendar time of the cross-sectional, between-country association between GDP per capita and CHE per capita. This definition does not refer to within-country income responsiveness of health expenditure.
2. Materials and Methods
2.1. Data and Study Population
We analyzed country-level data for 2000–2023 obtained from the World Health Organization (WHO) Global Health Expenditure Database (GHED) [14,15]. The variables were current health expenditure (CHE) per capita and gross domestic product (GDP) per capita. Data were extracted from the GHED Data Explorer [14]. The primary analyses used current PPP international dollars per capita, and all principal analyses were repeated using current US dollars. Current PPP was selected because the principal models compare countries cross-sectionally within each calendar year while accounting for contemporaneous differences in purchasing power. These values are not constant-price PPP series; consequently, temporal changes in cross-country dispersion can also reflect changes in relative price structures and PPP conversion factors. Current-US-dollar analyses provide a complementary sensitivity to monetary valuation but do not remove this limitation. Accordingly, longitudinal inequality comparisons in this study refer to changes in the cross-country dispersion of annual current-PPP estimates and should not be interpreted as constant-price changes in real expenditure volumes.
Years 2000–2023 were retained; 2024 was excluded because only a small subset of countries had paired observations. For each year and monetary metric, countries or territories were included when both CHE and GDP values were present and strictly positive; missing values were not imputed. The exact workbook filenames and software/package versions used for the reproducibility workflow are documented in the Supplementary Materials.
Depending on year and monetary metric, 186–195 countries had paired GDP and CHE observations. Each annual analysis used all countries with non-missing, positive values for both variables. Missing values were not imputed. Inequality analyses were additionally repeated in balanced panels restricted to countries with complete observations throughout 2000–2023.
2.2. Between-Country Inequality
Countries were the unit of analysis and were equally weighted. Between-country dispersion in CHE and GDP was quantified annually using the Gini coefficient. The coefficient of variation (CV), P90/P10 ratio, and standard deviation of natural-log expenditure were examined as complementary measures. Linear trends in annual dispersion measures were estimated with Newey–West heteroskedasticity- and autocorrelation-consistent (HAC) standard errors (lag 2). These measures capture different aspects of the cross-sectional distribution; no single measure is treated as a formal test of a universal convergence process.
To characterize the distributional changes underlying dispersion trends, we compared the 10th, 25th, 50th, 75th, and 90th percentiles of CHE per capita in 2000 and 2023, together with the ratios of each non-median percentile to the median (Supplementary Table S12).
The evolution of CHE inequality was compared with that of GDP inequality. Because the study questions concern national health-system resource environments, no population weighting was applied.
Equal weighting was chosen because the unit of inference is the country as a national health-system resource environment. Population weighting would answer a different question—how unequally health-expenditure resources are distributed across the world population—and would give disproportionate influence to a small number of very populous countries.
2.3. GDP-CHE Relationship and Temporal Change
GDP and CHE span several orders of magnitude across countries and were natural-log transformed. For each calendar year t, we estimated the following cross-sectional model:
ln(CHEit) = αt + βt ln(GDPit) + εit
Annual beta estimates and R-squared values were used descriptively. Formal inference on temporal change used the pooled country-year model shown below with year fixed effects, log(GDP)-by-linear-time and log(GDP)-by-2020/2021 interactions, and standard errors clustered by country. Linear time was coded as calendar year minus 2000 (2000 = 0, …, 2023 = 23); the log(GDP)-by-time coefficient therefore estimates annual secular change in the cross-country scaling exponent, with negative values indicating progressive weakening. The model does not estimate within-country income responsiveness of CHE.
In the annual model, αt is the year-specific intercept, βt is the annual scaling exponent describing the slope of the cross-country log-GDP/log-CHE relationship, and εit is the country-year residual, i.e., the part of log CHE not explained by GDP in that year. A value of βt = 1 represents proportional cross-country scaling; values above 1 indicate that fitted CHE rises slightly more than proportionally across increasing GDP.
For an intuitive health-financing interpretation of the scaling exponent, we also calculated CHE as a percentage of GDP for each country-year (100 × CHE/GDP), summarized annual distributions, and examined the ratio across GDP quintiles. Under the fitted log-scale relation CHE = A·GDP^β, CHE/GDP = A·GDP^(β−1); thus, β > 1 corresponds to a CHE/GDP share implied by the fitted relationship that increases with GDP. This is a cross-sectional interpretation and does not estimate how an individual country’s health-spending share responds to its own GDP over time.
As focused diagnostics and sensitivity analyses, for each annual log-linear regression we examined a quadratic log(GDP) term, the Koenker studentized Breusch–Pagan test for heteroscedasticity, and Cook’s distance as an influence diagnostic. We also repeated the primary pooled temporal model after excluding each country in turn. These analyses assess whether the principal temporal conclusion depends on functional-form departures, heteroscedasticity, or a single influential country.
ln(CHEit) = αt + β ln(GDPit) + γ[timet × ln(GDPit)] + δ[I(2020–2021)t × ln(GDPit)] + εit
As a complementary sensitivity analysis, the 24 annual beta estimates were also regressed on calendar year using Newey–West HAC standard errors.
In a focused temporal sensitivity analysis, we interacted log(GDP) with a natural cubic spline of calendar time (3 degrees of freedom), while retaining year fixed effects, the log(GDP)-by-2020–2021 interaction, and country-clustered standard errors. The linear-time specification remained the primary analysis. The sensitivity excluding 2020–2021, already reported in Supplementary Table S3, was retained and summarized alongside the new spline results in Supplementary Table S11B.
2.4. Persistence of Country-Level Deviations
For each country-year, we retained the residual from the corresponding annual GDP-CHE regression. Positive residuals indicate CHE above that predicted from GDP in that year, and negative residuals indicate lower-than-predicted expenditure. Pearson correlations between residuals in consecutive years and selected longer intervals quantified persistence of countries’ relative positions around the global relationship.
We additionally examined whether these deviations represented a persistent country-specific component. For each country, we calculated its mean residual position across observed years and the proportion of years spent on the same side of the annual GDP-CHE relationship. A same-side proportion of at least 80% was used as a descriptive indicator of persistent direction. A random-intercept variance-component model applied to annual residuals provided a descriptive ICC under that model. Because a random-intercept-only model does not separately parameterize serial correlation, we additionally fitted a sensitivity covariance model containing both a country random intercept and an AR(1) residual structure. We also described the association between the absolute magnitude of countries’ mean residuals and their mean GDP level. The near-zero association between signed mean residuals and GDP was retained only as a descriptive quantity, because annual residuals are constructed after adjustment for GDP. All analyses were repeated using current US dollars; detailed specifications are provided in the Supplementary Materials.
2.5. COVID-19 Period
The 2020–2021 interaction was interpreted descriptively as a calendar-period departure from the specified linear temporal trend, not as a causal effect of the pandemic. Detailed specifications, full annual estimates, and sensitivity analyses are provided in the Supplementary Materials.
2.6. Use of Generative Artificial Intelligence
OpenAI ChatGPT (OpenAI, https://chatgpt.com; accessed on 30 October 2026) was used during preparation of this study and manuscript as an interactive research assistant for code development and checking, interpretation, and presentation of statistical results, figure preparation, and drafting/editing of portions of the manuscript and Supplementary Material. The public WHO GHED workbooks were uploaded to ChatGPT as part of this AI-assisted workflow; they contain country-level aggregate data and no individual-level, identifiable, confidential, or sensitive personal information. All reported statistical estimates were generated by executable Python scripts applied directly to the source workbooks, and additional cross-checks used separately implemented calculations from the same raw data. Results were not accepted solely from conversational AI output. The research questions, analytical decisions, interpretation of findings, and final manuscript content were determined and critically reviewed by the authors. The complete reproducibility code and computational environment information are provided in the Supplementary Material. The reproducibility workflow is documented for Python 3.11 or later version (Python Software Foundation) and uses NumPy 2.3.5, pandas 2.2.3, SciPy 1.17.0, statsmodels 0.14.6, matplotlib 3.10.8, openpyxl 3.1.5 and Patsy 1.0.2. These versions are pinned in the submitted requirements_analysis.txt.
3. Results
3.1. Large International Differences in Health Expenditure
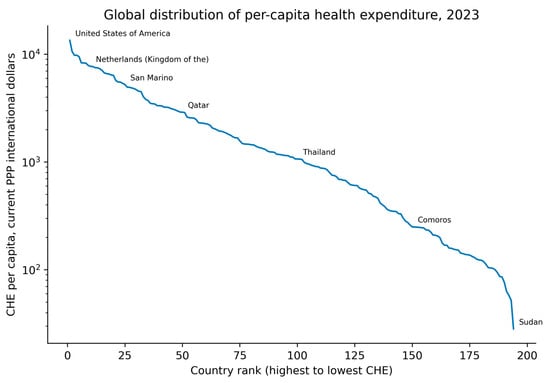
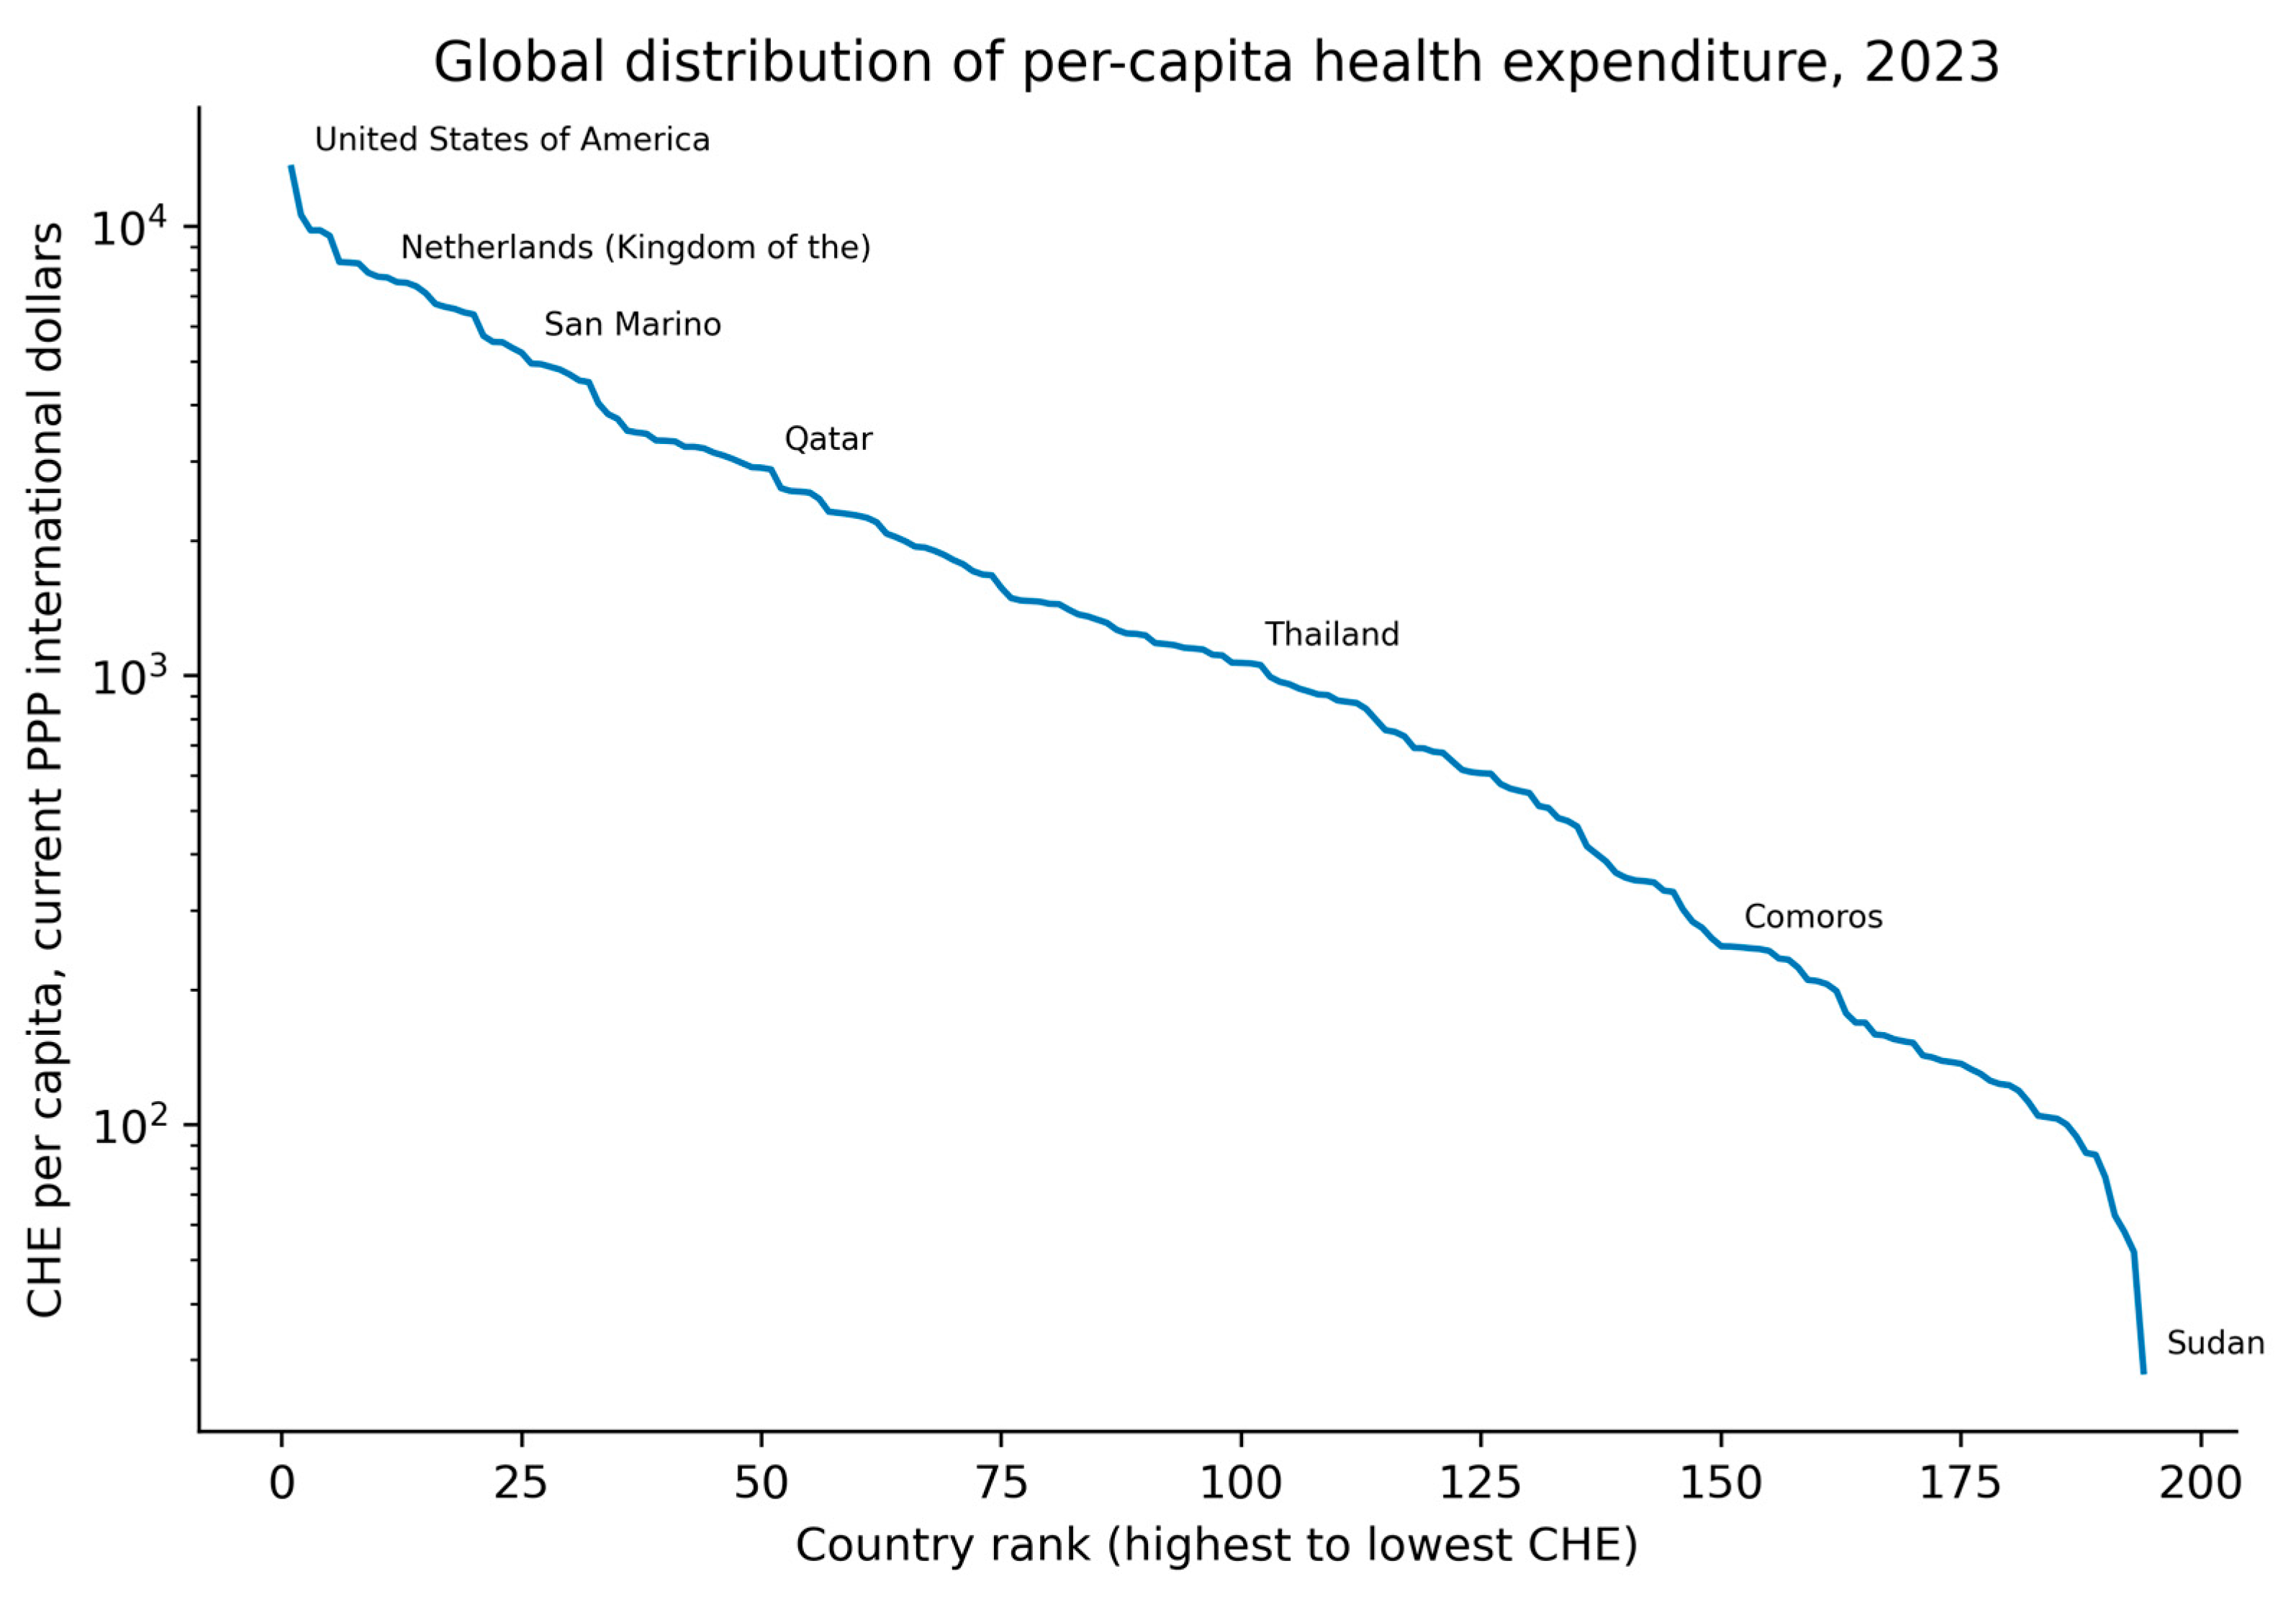
Per capita health expenditure differed enormously across countries, as shown for 2023 in Figure 1. Using current PPP per capita, expenditure ranged from 13,473 international dollars in the United States to 28 international dollars in Sudan, approximately a 477-fold difference. When countries were ranked from highest to lowest expenditure, values declined approximately exponentially, as follows: the ranked distribution was close to linear on a logarithmic scale (R2 = 0.987). Of the 194 countries with available 2023 data, 74 (38%) spent less than 5% of the amount spent per capita in the highest-expenditure country, and 19 (10%) spent less than 1%. This striking cross-sectional dispersion provides the descriptive starting point for the longitudinal analyses below.
Figure 1.
Global distribution of per capita health expenditure in 2023. Current health expenditure per capita, expressed in current purchasing power parity (PPP) international dollars, for 194 countries ranked from highest to lowest and displayed on a logarithmic scale. Selected country labels are shown for orientation; the x-axis represents rank for all 194 countries.
3.2. Between-Country Health-Expenditure Differences Narrowed Modestly by Some Measures
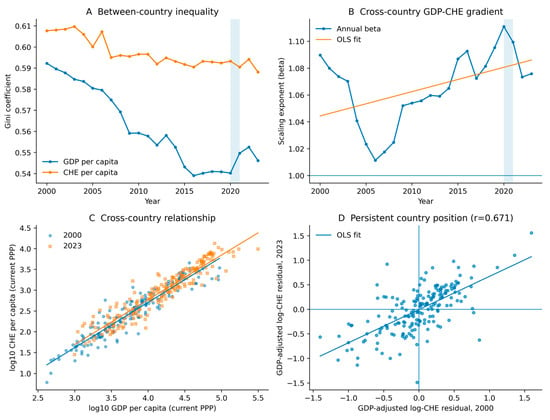
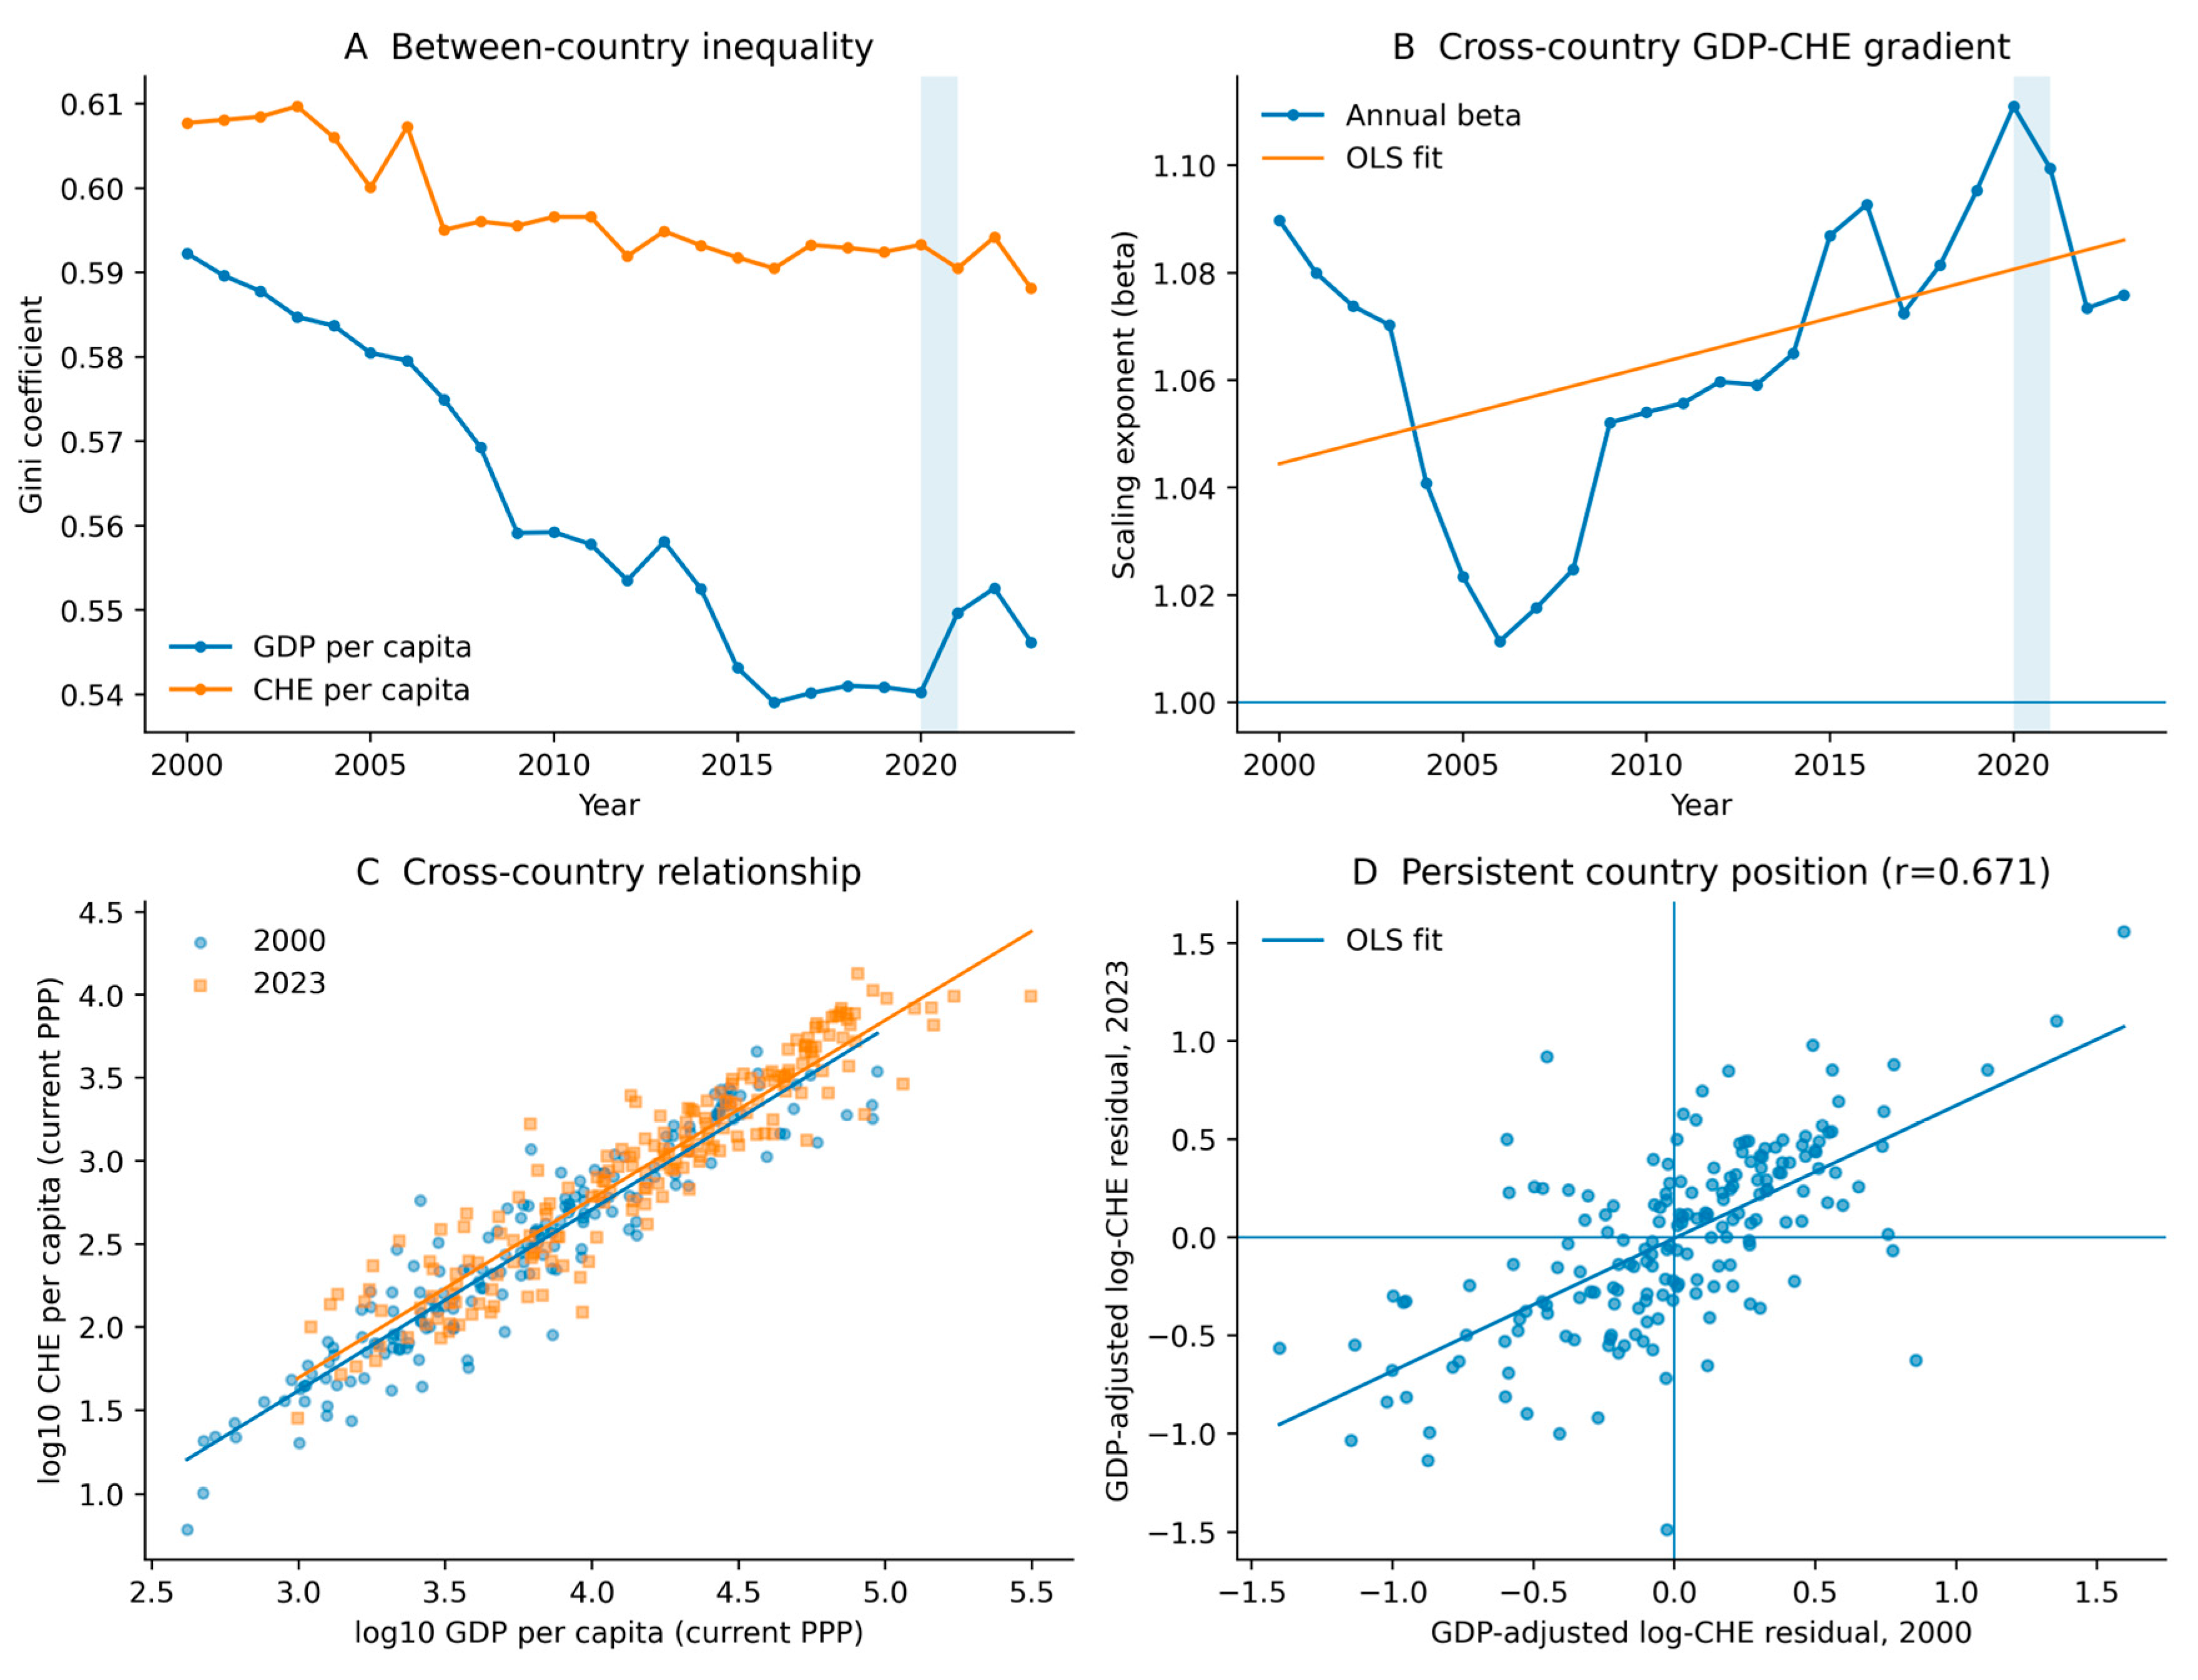
In current-PPP terms, the CHE Gini coefficient declined from 0.608 in 2000 to 0.588 in 2023, a relative reduction of 3.2% (Figure 2A; Supplementary Table S4). The annual Gini trend was downward (HAC p < 0.001), and the CHE CV similarly declined from 1.270 to 1.207. However, this narrowing was not uniform across dispersion measures, as follows: the P90/P10 ratio showed no significant downward trend (approximately 43 in 2000 and 45 in 2023), and the standard deviation of ln(CHE) changed from 1.399 to 1.385 with no significant 2000–2023 trend (HAC p = 0.759).
Figure 2.
Evolution and persistence of the global relationship between economic resources and health expenditure, 2000–2023 (all in current PPP). (A), Annual between-country inequality in GDP per capita and CHE per capita, measured by the Gini coefficient. (B), Annual cross-sectional GDP-CHE scaling exponent (beta); beta = 1 represents proportional scaling. The solid fitted line in panel B is an unadjusted descriptive OLS fit to the 24 annual beta estimates; formal temporal inference is based on the pooled model described in Methods. Shading in panels (A,B) indicates the 2020–2021 period. (C), Cross-sectional relationship between GDP and CHE per capita in 2000 and 2023 on logarithmic scales. (D), Persistence of country-specific deviations from GDP-predicted CHE between 2000 and 2023 (r = 0.671). In panel (D), the solid line denotes the ordinary least-squares fit.
Current-US-dollar CHE Gini also declined, from 0.727 in 2000 to 0.691 in 2023. Balanced-panel analyses showed similar endpoint directions within each monetary metric. Taken together, these results indicate modest narrowing by some measures, rather than uniform narrowing across the entire cross-country distribution.
Endpoint quantiles showed that the observed narrowing was distributionally uneven. In current PPP, P90/P50 declined from 6.35 in 2000 to 5.55 in 2023, whereas P10/P50 declined from 0.147 to 0.123: the upper part of the distribution moved relatively closer to the median, while the lower tail moved relatively farther below it. In current US dollars, P90/P50 declined from 15.12 to 9.78 and P90/P10 from 120.7 to 98.1, unlike the PPP endpoint pattern (Supplementary Table S12).
3.3. Relative Narrowing of CHE and GDP Inequality Depended on the Monetary Metric
In current-PPP terms, GDP inequality declined more markedly than CHE inequality. GDP Gini fell from 0.592 in 2000 to 0.546 in 2023, a relative reduction of 7.8%, compared with 3.2% for CHE (Figure 2A). Consequently, the CHE-to-GDP Gini ratio increased from 1.026 to 1.077, with a significant upward trend (HAC p < 0.001). This relative pattern was metric-dependent, as follows: in current US dollars, CHE Gini declined by 4.9% (0.727 to 0.691) and GDP Gini by 4.3% (0.686 to 0.657), while the CHE-to-GDP Gini ratio showed no significant trend (HAC p = 0.482). Thus, the finding that CHE inequality narrowed less than GDP inequality is specific to the primary current-PPP analysis.
3.4. No Statistically Detectable Progressive Weakening of the GDP-CHE Gradient
The GDP-CHE association remained strong throughout 2000–2023 (Figure 2B,C). In PPP analyses, the mean annual scaling exponent was 1.065 (SD 0.027; range 1.011–1.111), and annual models explained on average 89.0% of cross-country variation in log CHE. In intuitive terms, beta describes how steeply health expenditure rises across countries as national economic resources increase, as follows: beta = 1 would mean that CHE rises in direct proportion to GDP, whereas beta > 1 means that the gap in health expenditure widens slightly faster than the gap in GDP. Thus, the observed beta of approximately 1.07 indicates a modestly more-than-proportional increase in CHE across the global income range.
The same scaling result can be expressed in terms of the share of national resources devoted to health. Across countries, the median CHE/GDP ratio increased from 4.85% in 2000 to 5.75% in 2019, rose to 6.65% in 2020 and 6.67% in 2021, and was 6.34% in 2023 (Supplementary Table S9). Cross-sectionally, median CHE/GDP shares were generally higher in upper GDP quintiles; in 2023, quintile medians were 4.7%, 5.8%, 5.6%, 7.1%, and 8.6%, and the rank correlation between GDP and CHE/GDP was 0.250 (p < 0.001; Supplementary Table S10). This is consistent with β > 1 as a property of the fitted cross-country relationship, not with a longitudinal elasticity within countries.
Annual beta estimates nevertheless showed some short-term fluctuation, including a transient decline during the mid-2000s, from 1.070 in 2003 to 1.011 in 2006, followed by recovery to 1.052 by 2009 (Figure 2B). This pattern was not explained by changes in country composition and was also observed using current US dollars, although less pronounced. It therefore represents a temporary narrowing of the cross-country expenditure gradient rather than a sustained change in the GDP-CHE relationship.
In the pooled temporal model that separated the secular trend from the 2020–2021 period, the annual change in the GDP-CHE exponent was +0.0013 (95% CI −0.0015 to 0.0042; p = 0.354). Thus, there was no statistically detectable progressive weakening under the specified temporal model; the confidence interval does not establish equivalence or the complete absence of change.
The cross-sectional plots for 2000 and 2023 illustrate the same point directly, as follows: despite large changes in absolute GDP and CHE over two decades, the overall economic gradient remains visually similar at the beginning and end of the study period (Figure 2C).
The current-US-dollar analysis yielded a mean annual exponent of 1.082 (SD 0.016) and the same conclusion regarding secular change (+0.0006 per year; p = 0.588). The annual beta series derived from PPP and current-US-dollar data were strongly correlated (r = 0.972).
A sensitivity analysis based only on the 24 annual beta estimates, with Newey–West HAC standard errors, reproduced the previously observed absence of a significant linear trend (PPP p = 0.099; current US dollars p = 0.167).
The flexible temporal sensitivity revealed a non-linear trajectory (joint nonlinearity test: current PPP p = 0.00025; current US dollars p = 0.0144; Supplementary Figure S2 and Table S11), with a decline in the mid-2000s, subsequent recovery, elevation during 2020–2021, and a post-2021 decline toward the earlier range. The fitted 2023-minus-2000 difference was −0.0215 (95% CI −0.0819 to 0.0390; p = 0.487) in current PPP and −0.0141 (95% CI −0.0618 to 0.0335; p = 0.561) in current US dollars. These spline endpoint estimates were negative in sign, unlike the positive 23-year changes implied by the primary linear trends, but their confidence intervals included zero. Thus, the flexible analysis did not establish a statistically detectable sustained net weakening or temporal equivalence. Excluding 2020–2021 from the primary linear-time model left the secular interaction essentially unchanged (PPP +0.00134/year, p = 0.352; current US dollars +0.00059/year, p = 0.585; previously reported in Supplementary Table S3 and reproduced in Table S11B).
Additional diagnostics supported use of the log-linear specification for the present descriptive purpose. A quadratic log(GDP) term was statistically detectable in 3 of 24 annual PPP models and 1 of 24 current-US-dollar models, but gains in explained variance were small (PPP median ΔR2 = 0.0007, maximum 0.0055; current-US-dollar maximum 0.0026). The Koenker studentized Breusch–Pagan test indicated heteroscedasticity in 8 of 24 PPP and 2 of 24 current-US-dollar annual models. The maximum annual Cook’s distance was 0.334 in PPP and 0.322 in current US dollars; neither exceeded 1. In leave-one-country-out analyses of the primary pooled model, the PPP secular interaction ranged from +0.0010 to +0.0018 per year and remained non-significant in every exclusion; the 2020–2021 interaction remained positive and statistically significant throughout. Current-US-dollar analyses showed the same qualitative robustness (Supplementary Tables S7 and S8).
3.5. Countries Retained Persistent Positions Around the Global Relationship
Economic resources did not explain all international differences in CHE, but the remaining differences were highly persistent (Figure 2D). In PPP analyses, the mean correlation between country residuals in consecutive years was 0.963. Residuals in 2000 remained correlated with those in 2005 (r = 0.866), 2010 (r = 0.805), 2015 (r = 0.725) and 2023 (r = 0.671).
Current-US-dollar analyses showed a closely similar pattern (mean consecutive-year r = 0.960; 2000 vs. 2023 r = 0.645). Thus, countries retained durable relative positions above or below the global economic gradient.
This persistence reflected a substantial country-specific component. In PPP analyses, 145 of 195 countries (74%) remained on the same side of the annual GDP-predicted CHE relationship for at least 80% of their observed years. In the random-intercept-only model, the descriptive ICC was 0.84. Because this model does not separately parameterize serial correlation, we fitted an additional random-intercept plus AR(1) sensitivity model. Under that specified covariance model, the estimated AR(1) parameter was 0.865 and country-intercept variance represented approximately 72.6% of marginal residual variance; the corresponding current-US-dollar values were 0.866 and 70.7%. These fractions are model-based summaries rather than assumption-free estimates of permanent country effects. As expected given that annual residuals are defined after adjustment for log GDP, countries’ mean signed residual position showed essentially no association with mean GDP (r = 0.008); this is not interpreted as an independent test. More informatively, the absolute magnitude of countries’ mean deviations showed no clear monotonic association with GDP (Pearson r = 0.112, p = 0.120; Spearman rho = 0.129, p = 0.072), and descriptive GDP-decile patterns were non-monotonic. Mean country residuals derived from PPP and current-US-dollar analyses were highly concordant in relative position (r = 0.993).
3.6. The 2020–2021 Period Showed the Highest Cross-Country Slopes in the Series
The highest annual scaling exponent occurred in 2020 in both monetary metrics (Figure 2B). In PPP terms, mean beta increased from 1.060 during 2000–2019 to 1.105 during 2020–2021 and declined to 1.075 during 2022–2023. Year-specific PPP beta values were 1.111 in 2020, 1.099 in 2021, 1.073 in 2022, and 1.076 in 2023.
In the pooled model, 2020–2021 was associated with an additional +0.0306 in the cross-country scaling exponent relative to the specified linear temporal trend (95% CI 0.0127 to 0.0486; p < 0.001). The current-US-dollar analysis showed a similar model-based departure (+0.0227, 95% CI 0.0067 to 0.0388; p = 0.006).
The 2020–2021 period therefore coincided with the highest slopes in the series, followed by a decline in 2022–2023. The interaction quantifies departure from the specified linear-trend counterfactual and should not be interpreted as a causal effect of the pandemic or as evidence that all alternative temporal comparisons would yield the same magnitude.
4. Discussion
Our findings show two related but distinct features of the global health-expenditure distribution. First, between-country differences in CHE narrowed modestly according to Gini and CV in the primary current-PPP analysis, but the pattern was not uniform across dispersion measures or monetary metrics. Second, the cross-country GDP-CHE gradient showed no statistically detectable sustained secular weakening, although its temporal trajectory was non-monotonic. We therefore characterize the pattern as modest, measure-dependent narrowing of international expenditure differences without evidence of sustained secular weakening of the cross-country economic gradient.
The association between national income and health expenditure is not new [1,2,3], and the longstanding necessity-versus-luxury debate illustrates why the level of analysis matters. Getzen emphasized that income elasticity can differ fundamentally between individual and national levels [2], while global panel analyses that model within-country dynamics and heterogeneity have reported estimates below unity [3]. Those estimands are not directly comparable with our annual cross-sectional scaling exponent of approximately 1.07. Our contribution is instead near-global evidence on the temporal evolution of the between-country gradient, considered alongside changes in cross-sectional dispersion.
The world economy changed substantially; many low- and middle-income countries experienced major economic growth; health systems and financing arrangements evolved; UHC and the Sustainable Development Goals became central international policy objectives; and the pandemic generated exceptional health expenditure [9,10,11]. Prior work shows that national health spending also reflects technology, demographic structure, relative prices, financing design, policies, and institutions [4,5,6]. Global spending analyses have documented persistent gaps between low- and high-income countries [12], while convergence studies in OECD and ASEAN settings report heterogeneous or subgroup-specific patterns depending on the convergence concept and expenditure component [4,13].
4.1. Changes in Between-Country Dispersion and the Economic Gradient
In current PPP, Gini and CV measures of CHE dispersion declined modestly, whereas P90/P10 and the standard deviation of ln(CHE) did not show comparable secular narrowing. Moreover, the PPP finding that CHE Gini declined less than GDP Gini was not reproduced in current US dollars. Together, these results show that the observed narrowing was not uniform across measures or monetary metrics.
The endpoint quantiles further indicated that the modest reduction in dispersion was distributionally uneven: in current PPP, the upper part of the distribution moved relatively closer to the median, whereas the lower tail moved relatively farther below it. The direction and extent of the pattern also depended on the monetary metric.
Previous convergence studies have reached heterogeneous conclusions because they use different samples and concepts. Nghiem and Connelly found no overall convergence across OECD countries but evidence of convergence within subgroups [4], while work in ASEAN countries reported different patterns for public and private health expenditure [13]. Our analysis does not test convergence clubs, beta-convergence, or stochastic convergence. It instead describes how several measures of global cross-sectional dispersion changed over time and asks a separate question about whether the GDP-CHE gradient weakened.
The scaling exponent provides a complementary interpretation. A value of β = 1 implies proportional cross-country scaling of fitted CHE with GDP; β > 1 implies that fitted CHE rises somewhat faster than GDP across countries and that the CHE/GDP share implied by the fitted log-scale relationship increases with GDP as GDP^(β−1). The GDP-quintile summaries support this cross-sectional interpretation. This does not imply that health care is intrinsically a “luxury good” or that the same elasticity applies within countries over time [2,3,6].
The flexible temporal sensitivity further indicated that absence of a statistically detectable sustained secular weakening should not be mistaken for a strictly linear or unchanging gradient: the mid-2000s decline was followed by recovery, and the 2020–2021 elevation was transient. The overall fitted endpoint contrast did not establish a net decline or equivalence across the study period.
4.2. Relationship to Global Health Progress
During the study period, the international health agenda increasingly emphasized UHC, equity, and financial protection. The WHO-World Bank monitoring framework evaluates UHC through access to essential health services and exposure to financial hardship, not through equalization of national CHE per capita [7,8]. Our results should therefore not be interpreted as evidence that UHC policies, international development assistance, or health-system reforms have failed. Health outcomes can improve, service coverage can expand, financial protection can change, and health systems can become more efficient without a uniform narrowing of CHE per capita.
Our analysis addresses a narrower question, as follows: has more than two decades of global health development been accompanied by a weakening of the cross-country association between national economic resources and health expenditure? At the aggregate between-country level examined here, we found no statistically detectable secular weakening of this gradient under the specified model. This does not estimate within-country income responsiveness, nor does it imply that progress toward UHC should have produced expenditure convergence. Improvements in service coverage, financial protection, efficiency, or outcomes can occur without requiring detectable weakening of the cross-country relationship between GDP and CHE.
4.3. A Durable Country Component
The strong persistence of country-level deviations adds another layer to this picture. GDP accounts for most of the cross-sectional variation in log CHE, but countries with similar economic resources can occupy persistently different positions around that relationship. Previous research provides plausible contexts for such heterogeneity, as follows: demographic structure, technology, relative prices, public/private financing arrangements, provider-payment and organizational features, and broader health-system policies and institutions have all been associated with cross-country expenditure differences [4,5,6,12]. The present study does not determine which mechanisms explain individual countries’ residual positions.
Persistent deviations were observed across the economic spectrum. Because signed residuals are constructed after adjustment for GDP within each year, their near-zero association with mean GDP is partly built into the analysis and is not treated as independent evidence of GDP-independence. More informatively, the absolute magnitude of countries’ mean deviations showed no clear monotonic association with GDP. Approximately three quarters of countries remained on the same side of the GDP-predicted relationship for at least 80% of observed years. Under the fitted random-intercept plus AR(1) covariance model, country-intercept variance represented approximately 72.6% of marginal PPP residual variance. This model-based fraction, together with the observed long-interval residual correlations, supports durable country positioning while leaving its determinants unresolved.
4.4. The 2020–2021 Period
WHO reported sharp changes in government and total health expenditure during 2020–2021 [9,10,11]. In our data, the annual cross-country GDP-CHE slopes were highest during this period and subsequently declined. The pooled interaction indicates that the 2020–2021 slopes exceeded the expectation from the specified linear temporal model, but its magnitude depends on that counterfactual. Differential fiscal responses, GDP contractions, emergency borrowing, external financing, health-system organization, and the composition of pandemic-related expenditure could all have contributed. We therefore interpret this only as a calendar-period association, not as a causal effect of COVID-19 itself.
4.5. Strengths and Limitations
The principal strength of this analysis is its breadth and temporal consistency, as follows: nearly all countries and territories worldwide were examined annually over 24 years, with complementary current-PPP and current-US-dollar analyses and balanced-panel sensitivities.
A further strength is the use of publicly available data from the WHO Global Health Expenditure Database. Although national estimates inevitably simplify complex realities and may involve some measurement uncertainty, their standardized, transparent, and investigator-independent nature provides a robust basis for comparisons across countries and over time.
This is an ecological and descriptive analysis. It cannot establish that GDP causally determines health expenditure or evaluate the causal effects of WHO, UHC, development assistance, or any specific policy. Countries were treated as equally weighted units; thus our inequality estimates describe differences between national health-system resource environments rather than inequality between individuals worldwide. CHE measures financial resources devoted to health rather than access, quality, efficiency, equity, or health outcomes. Country-specific deviations are descriptive, and their causes require a different analytical design. The equal weighting of countries is intentional and reflects the country-level unit of inference; these estimates should not be interpreted as population-weighted inequality among individuals worldwide. A population-weighted analysis would address a distinct estimand and would be strongly influenced by a small number of very populous countries.
The longitudinal inequality comparisons also require caution because the primary monetary metric is current PPP rather than a constant-price PPP series. Current PPP is appropriate for contemporaneous cross-country comparisons of purchasing power, but changes in annual dispersion can partly reflect changes in relative price structures and PPP conversion factors as well as changes in underlying expenditure. They therefore describe changes in the dispersion of annual current-PPP estimates rather than constant-price changes in real expenditure volumes. Current-US-dollar analyses supported the conclusions concerning the temporal GDP-CHE gradient and residual persistence, but did not reproduce the PPP ordering of relative CHE-versus-GDP Gini declines. Thus, conclusions about changes in inequality should be interpreted as metric- and measure-dependent.
Finally, repeated observations from the same countries create temporal dependence, and some annual cross-sectional regressions showed heteroscedasticity. We addressed temporal dependence in the primary pooled country-year models using country-clustered standard errors and used HAC standard errors for analyses based on annual summary series. Functional-form diagnostics showed only small gains from quadratic terms, Cook’s distance and leave-one-country-out analyses did not indicate dependence on a single country, and the central temporal conclusion was unchanged. For residual persistence, the random-intercept-only ICC is descriptive; the additional random-intercept plus AR(1) model provides a model-based variance decomposition rather than an assumption-free estimate of a permanent country component.
5. Conclusions
Between 2000 and 2023, international differences in health expenditure per capita narrowed modestly by some dispersion measures, particularly in the primary current-PPP analysis, but the extent of narrowing depended on the dispersion measure and monetary metric. The endpoint quantiles indicated relative compression in the upper part of the current-PPP distribution while the lower tail moved relatively farther below the median. The cross-country GDP-CHE gradient varied non-monotonically, with a mid-2000s decline followed by recovery and a 2020–2021 elevation, but neither the primary nor flexible temporal analysis detected sustained secular weakening. These findings do not establish equivalence across years or imply changes in access, quality, efficiency, or health outcomes.
Supplementary Materials
The following supporting information can be downloaded at: https://www.mdpi.com/article/10.3390/medsci14070799/s1, Supplementary METHODS and RESULTS (PDF); Figure S1: Magnitude of persistent country-specific deviation across the economic spectrum; Figure S2: Flexible temporal GDP–CHE gradient; Table S1: Annual PPP results; Table S2: Annual current-US-dollar results; Table S3: Temporal-model results and sensitivity analyses; Table S4: Selected inequality results and sensitivity analyses; Table S5: Persistence of country-level residuals; Table S6: Persistent country-specific component; Table S7: Annual functional-form, heteroscedasticity and influence diagnostics; Table S8: Leave-one-country-out sensitivity of the primary pooled temporal model; Table S9: Descriptive current health expenditure as a percentage of GDP; Table S10: CHE/GDP share by GDP quintile in selected years (current PPP); Table S11A: Natural-cubic-spline temporal sensitivity (country-clustered inference); Table S11B: Pandemic-period departure under spline and sensitivity excluding 2020–2021; Table S12: Unweighted CHE per-capita quantiles and ratios, 2000 versus 2023. The accompanying supplementary ZIP also contains the four original WHO GHED workbooks (RAW DATA FILES), Python code and pinned software requirements (CODE for data analysis), final figure files, analysis outputs, and country-year exclusion inventories.
Author Contributions
Conceptualization, N.F.; Methodology, N.F. and R.F.; Validation, N.F. and R.F.; Writing—Original Draft Preparation, N.F.; Writing—Review and Editing, N.F. and R.F.; Supervision, N.F. All authors have read and agreed to the published version of the manuscript.
Funding
This research received no external funding.
Institutional Review Board Statement
Not applicable.
Informed Consent Statement
Not applicable.
Data Availability Statement
All raw data and processing code used are provided in Supplementary Materials.
Acknowledgments
AI was used as described in detail in Methods. The authors take full responsibility for the accuracy and integrity of the work.
Conflicts of Interest
The authors declare no conflicts of interest.
References
- Newhouse, J.P. Medical-care expenditure: A cross-national survey. J. Hum. Resour. 1977, 12, 115–125. [Google Scholar] [CrossRef] [Scilit]
- Getzen, T.E. Health care is an individual necessity and a national luxury: Applying multilevel decision models to the analysis of health care expenditures. J. Health Econ. 2000, 19, 259–270. [Google Scholar] [CrossRef] [Scilit] [PubMed]
- Baltagi, B.H.; Lagravinese, R.; Moscone, F.; Tosetti, E. Health care expenditure and income: A global perspective. Health Econ. 2017, 26, 863–874. [Google Scholar] [CrossRef] [Scilit] [PubMed]
- Nghiem, S.H.; Connelly, L.B. Convergence and determinants of health expenditures in OECD countries. Health Econ. Rev. 2017, 7, 29. [Google Scholar] [CrossRef] [Scilit] [PubMed]
- de la Maisonneuve, C.; Moreno-Serra, R.; Murtin, F.; Oliveira Martins, J. The role of policy and institutions on health spending. Health Econ. 2017, 26, 834–843. [Google Scholar] [CrossRef] [Scilit] [PubMed]
- Pammolli, F.; Riccaboni, M.; Magazzini, L. The sustainability of European health care systems: Beyond income and aging. Eur. J. Health Econ. 2012, 13, 623–634. [Google Scholar] [CrossRef] [Scilit] [PubMed]
- World Health Organization; International Bank for Reconstruction and Development/The World Bank. Tracking Universal Health Coverage: 2023 Global Monitoring Report; World Health Organization: Geneva, Switzerland, 2023. [Google Scholar]
- World Health Organization. Universal Health Coverage Global Monitoring Report 2023: Questions and Answers; World Health Organization: Geneva, Switzerland, 2024. [Google Scholar]
- World Health Organization. Global Spending on Health: Rising to the Pandemic’s Challenges; World Health Organization: Geneva, Switzerland, 2022. [Google Scholar]
- World Health Organization. Global Spending on Health: Coping with the Pandemic; World Health Organization: Geneva, Switzerland, 2024. [Google Scholar]
- World Health Organization. Global Spending on Health: Emerging from the Pandemic; World Health Organization: Geneva, Switzerland, 2024. [Google Scholar]
- Dieleman, J.L.; Templin, T.; Sadat, N.; Reidy, P.; Chapin, A.; Foreman, K.; Haakenstad, A.; Evans, T.; Murray, C.J.L.; Kurowski, C. National spending on health by source for 184 countries between 2013 and 2040. Lancet 2016, 387, 2521–2535. [Google Scholar] [CrossRef] [Scilit] [PubMed]
- Li, Z.Z.; Liu, G.; Tao, R.; Lobont, O.R. Do Health Expenditures Converge Among ASEAN Countries? Front. Public Health 2021, 9, 699821. [Google Scholar] [CrossRef] [Scilit] [PubMed]
- World Health Organization. Global Health Expenditure Database (GHED): Data Explorer. World Health Organization: Geneva, Switzerland. Available online: https://apps.who.int/nha/database/Select/Indicators/en (accessed on 20 August 2026).
- World Health Organization. Methodology for the Update of the Global Health Expenditure Database; World Health Organization: Geneva, Switzerland, 2025; ISBN 978-92-4-011200-1. [Google Scholar]
Disclaimer/Publisher’s Note: The statements, opinions and data contained in all publications are solely those of the individual author(s) and contributor(s) and not of MDPI and/or the editor(s). MDPI and/or the editor(s) disclaim responsibility for any injury to people or property resulting from any ideas, methods, instructions or products referred to in the content. |
© 2026 by the authors. Licensee MDPI, Basel, Switzerland. This article is an open access article distributed under the terms and conditions of the Creative Commons Attribution (CC BY) license.