


Abstract
Background/Objectives: Gastric cancer (GC) is one of the most prevalent malignancies worldwide, highlighting the need for minimally invasive and highly accurate screening methods for its early detection. We evaluated the utility of salivary polyamine-based metabolomic analysis for distinguishing individuals with GC from those without GC. Methods: A total of 53 patients with GC and 37 non-GC controls were included. Participants were recruited from individuals who underwent upper gastrointestinal endoscopy at Tokyo Medical University Hospital between March 2020 and May 2025 and provided saliva samples on the same day. Participants with factors known to affect polyamine levels were excluded. Salivary metabolites quantified by liquid chromatography–mass spectrometry were statistically compared between groups. Acetylated-to-non-acetylated polyamine ratios were used as features to construct a logistic regression-based machine learning model, and discriminative performance was evaluated using receiver operating characteristic analysis. Results: The GC group showed significantly higher concentrations of salivary metabolites. Among individual polyamines, N1-acetylspermine demonstrated the highest discriminative ability (AUC = 0.845). When acetylated-to-non-acetylated polyamine ratios were analyzed, significant differences between groups were observed for N1,N8-diacetylspermidine/spermidine and N1-acetylspermine/spermine. A logistic regression model constructed using six such ratios achieved strong predictive performance in the test dataset (AUC = 0.807), with a sensitivity of 68.8% and a specificity of 72.7%. Conclusions: Our results demonstrate that salivary polyamine analysis, particularly using acetylation ratios, enables accurate and minimally invasive discriminative ability of GC and represents a promising adjunctive tool for GC screening.
1. Introduction
In Japan, gastric cancer (GC) was once the leading cause of cancer-related mortality. Owing to advances in early detection techniques and the widespread implementation of Helicobacter pylori eradication therapy, the mortality rate has decreased in recent years. According to the national cancer statistics for 2023, GC ranked third among men and fifth among women in site-specific cancer mortality [1]. Nevertheless, the incidence of GC remains relatively high, partly due to population aging. In 2021, approximately 70,000 men (fourth among all cancers) and 30,000 women (also fourth) were newly diagnosed with GC [2]. Globally, approximately 960,000 new cases of GC were reported in 2022 [3], and this number is expected to increase to approximately 1.82 million by 2050 [4]. Currently, the diagnosis of GC is primarily based on upper gastrointestinal endoscopy, often supplemented by tumor markers testing. However, endoscopy is a relatively invasive and costly procedure with limited cost-effectiveness. Moreover, although the commonly used tumor markers for GC, namely, carcinoembryonic antigen (CEA) and carbohydrate antigen 19-9 (CA19-9), show high specificities of 99.1% and 96.2%, respectively, they have low sensitivities of 17.4% and 20.8% [5], rendering them unsuitable for effective screening. Therefore, to further increase the rate of detection of GC at an early stage, there is a pressing need for a screening method with higher accuracy than these tumor markers and with lower invasiveness than the current screening procedures.
In recent years, liquid biopsy has attracted considerable attention as a minimally invasive diagnostic approach using biological samples such as blood, urine, and saliva. Body fluids contain a variety of components, including proteins, DNA fragments, various cells, and microorganisms. Metabolome analysis is a comprehensive analytical technique that enables the detection and quantification of low-molecular-weight metabolites such as amino acids and sugars. A growing number of studies have reported attempts to detect diseases at an early stage by performing metabolomic profiling of diverse biological specimens, including blood, saliva, and urine [6,7,8,9,10,11]. Among these sample types, saliva is particularly suitable for screening tests owing to its ease of collection and hence the low physical and psychological burden on patients.
Amino acids and polyamines have been reported as metabolites in body fluids that show altered concentrations in response to cancer development [6,7,8,9,10,11]. In the present study, we focused on polyamines because their salivary concentrations remain more stable than those of amino acids when saliva is stored at room temperature, and if samples are frozen within 30 min of collection, the effect on analytical results can be minimized [12].
On the other hand, there are also challenges associated with the use of biomarkers in saliva. Metabolite concentrations in saliva can fluctuate substantially depending on hydration status and other physiological factors, in contrast to in blood, where metabolite concentrations are tightly regulated [12]. Such variability may mask disease-specific signals and reduce diagnostic accuracy when absolute concentrations are used as biomarkers. To mitigate this issue, we hypothesized that normalizing the target metabolite concentration in saliva by dividing it by an endogenous reference would be effective. However, no established endogenous reference equivalent to creatinine in urine has been identified for saliva. To address this, we focused on the acetylation status of polyamines. Previous studies have reported changes in the expression of spermidine/spermine N1-acetyltransferase (SSAT; Enzyme Commission (EC) 2.3.1.57), an enzyme responsible for polyamine acetylation, in multiple cancer tissues [13,14]. In GC tissue, decreased expression of histone deacetylase 10 (HDAC10; EC 3.5.1.48), which mediates the deacetylation of N8-acetylspermidine, has been reported [15]. In addition, increased expression of solute carrier family 3 member 2, a polyamine transporter, has been reported [16,17]. Therefore, we hypothesized that assessing the acetylation status of polyamines would be useful in distinguishing between GC and non-GC.
Previous studies have demonstrated the utility of mass spectrometry (MS)-based metabolomic analysis of plasma samples for GC screening [6]. In the present study, we aimed to evaluate the utility of salivary metabolite profiling as a noninvasive screening tool for differentiating between patients with GC and non-GC individuals. Our analysis particularly focused on polyamine concentrations using MS-based metabolomics.
2. Materials and Methods
2.1. Participants
This study was designed as a case–control study and included 53 patients with GC and 37 non-GC controls. The GC patients were recruited from individuals who underwent upper gastrointestinal endoscopy at Tokyo Medical University Hospital between March 2020 and May 2025 and provided saliva samples on the same day. Patients with known factors that could affect polyamine levels were excluded. These factors included a history of non-gastric malignancy [18], the presence of inflammatory diseases [18], benign prostatic hyperplasia [19], and renal failure [20], as well as the use of medications such as metformin [21] and aspirin [22] (Figure S1). There were 6 participants who met multiple exclusion criteria. Participants with underlying diseases suggestive of systemic inflammation, including inflammatory bowel disease, infectious diseases, and collagen diseases, were excluded. These data were collected from participants’ self-reports and medical records on the day of saliva collection. The non-GC group was defined as participants in good general health without any of the above factors.
2.2. Saliva Collection
The overall procedure for saliva collection and storage was as follows. First, saliva samples were collected in the morning (between 8:00 and 11:00 a.m.) prior to upper gastrointestinal endoscopy on the same day, and were immediately stored at −80 °C. The presence or absence of GC was subsequently evaluated by endoscopy.
The saliva collection protocol was standardized to ensure reproducibility, following a strict procedure described previously [12]. Briefly, participants were instructed to refrain from eating and from drinking anything except water after 9:00 p.m. on the day before the examination. Participants were also instructed to avoid the use of lipstick or lip balm, smoking, and performing strenuous physical activity during the same period. In principle, regular medications were withheld except for those deemed essential. Before saliva collection, participants rinsed their mouths with water. Unstimulated whole saliva was collected by allowing it to accumulate naturally in the oral cavity. A polypropylene straw (12 mm in diameter, 50 mm in length) was used to collect the sample, and at least 0.5 mL of saliva was collected into a 5 mL polypropylene tube (Eppendorf, Hamburg, Germany). As stimulated or turbid saliva can increase polyamine concentrations [23], participants were instructed to collect clear, non-turbid saliva whenever possible. All collected samples were immediately frozen and stored at −80 °C.
2.3. Metabolomics Analysis of Saliva by Liquid Chromatography–Mass Spectrometry (LC-MS)
Quantification of metabolites such as polyamines in saliva was performed by SalivaTech Co., Ltd. (Yamagata, Japan) using LC-MS. The analytical procedures were based on previously described methods [12,23], with minor modifications. Briefly, frozen saliva samples were thawed for 4 min in warm water (40–42 °C). Subsequently, 20 μL of saliva and 60 μL of 1% ammonia in methanol containing 3.3 μM internal standards (Table S1) were mixed in a 1.5 mL tube. The mixture was centrifuged at 15,780× g for 10 min at 4 °C, and 40 μL of the supernatant was transferred to a fresh tube. The supernatant was then mixed with 60 μL of Milli-Q water, and 30 μL of the sample was transferred to a vial and subjected to LC-MS analysis, performed using LC System 1290 Infinity and the triple quadrupole mass spectrometer (QQQ) System 6475 (Agilent Technologies, Santa Clara, CA, USA). Chromatographic separation was performed using an ACQUITY BEH C18 column (2.1 mm internal diameter [i.d.] × 50 mm, 1.7 μm particle size; Waters, Milford, MA, USA) at 40 °C. The mobile phase, which comprised solvent A (0.1% formic acid and 1.5 mM heptafluorobutyric acid [HFBA] in water) and solvent B (1.5 mM HFBA in methanol) were delivered at a flow rate of 0.4 mL/min. The gradient elution conditions of solvent A were 99.0% at 1.0 min, 99.0% at 2.0 min, 60% at 3.5 min, 5.0% at 4.0 min, and 5.0% at 5 min, followed by column equilibration at 99% for 5 min. The run time was 10 min per sample. MS detection was conducted using the QQQ system. The samples were analyzed in the positive ion mode. The instrument parameters were set as follows: drying gas temperature, 350 °C; drying gas flow, 13 L/min; nebulizer, 55 pounds per square inch (psi); and capillary voltage (Vcap), 3500 V. Specific multiple reaction monitoring transitions, fragmentor voltages, and collision energies were optimized for each analyte using the Optimizer and Dynamic Multiple Reaction Monitoring Mode in Agilent MassHunter Workstation LC-MS Data Acquisition Software (version 12.2; Agilent Technologies, Santa Clara, CA, USA) (Table S1). Data processing was performed using Agilent MassHunter Workstation Qualitative Analysis Software (version 12.0; Agilent Technologies, Santa Clara, CA, USA) and Quantitative Analysis Software (version 12.1; Agilent Technologies, Santa Clara, CA, USA). The analytical performance of the LC-MS system, including precision and linearity, has been previously validated [12]. Consistent with this previous report, the method demonstrates good linearity and high precision for the target metabolites. The specific linearity (R2) and precision (CV) for each of the target metabolites were detailed in Supplementary Table S2. The concentrations of the substances measured in this study exceeded the lower limit of quantification, at which linearity is guaranteed, for all samples. To ensure consistent quality, standard mixtures of metabolites were measured in triplicate before sample analysis. Three Quality-control (QC) metabolites (1,6-diaminohexane, histidine-13C6, and N1-acetylspermine-d3) were monitored throughout the runs to confirm that retention times, peak heights, and full widths at half maximum remained within acceptable ranges. QC saliva samples were also measured in parallel.
2.4. Data Analysis
Participant characteristics and clinical variables were evaluated using the Mann–Whitney U test and the chi-square test, as appropriate. Statistical analyses were performed using IBM SPSS Statistics software (version 29.0.2.0; IBM Corp., Armonk, NY, USA).
To assess overall trends in metabolite concentrations, the concentrations of each metabolite were log10-transformed, followed by the calculation of Z-scores, and the results were visualized using heatmaps. Concentrations of individual metabolites were compared using box-and-whisker plots. Prior to statistical analysis, metabolite concentrations were log10-transformed. Statistical comparisons between the two groups were performed using multiple Welch’s t-tests, and false discovery rate (FDR) correction was applied using the Benjamini–Krieger–Yekutieli method to account for multiple testing.
Heatmaps were generated using Python (version 3.11.9; Python Software Foundation, Wilmington, DE, USA) with the Matplotlib (version 3.7.5) [24], seaborn (version 0.13.2) [25], NumPy (version 1.26.4) [26], and Pandas (version 2.1.4) [27] libraries. Box-and-whisker plots and statistical analyses were performed using GraphPad Prism software (version 8.4.3; GraphPad Software, Boston, MA, USA).
The ratio of each acetylated polyamine to its corresponding non-acetylated polyamine was calculated for each subject to evaluate changes in acetylation status.
To determine the ability to distinguish between GC and non-GC using combinations of multiple metabolites, a predictive model based on logistic regression was constructed. As input features, we developed two separate models: an absolute concentration model using raw metabolite concentrations and a relative concentration model using the aforementioned ratios. The entire dataset was stratified to ensure equivalent proportions of non-GC and GC subjects in both subsets, and then randomly divided into a training dataset (n = 63) and a test dataset (n = 27) at a 7:3 ratio (Figure S2). A random seed of 42 was used for model construction in both the absolute and relative concentration models, ensuring that the data partitioning was identical between the two models. As a preprocessing step, a log10 transformation was applied to the features to reduce the effects of outliers. To assess the potential impact of multicollinearity among features, correlation analysis was conducted. In the relative concentration model, as all pairwise correlation coefficients were less than 0.7, no feature reduction was performed. Similarly, no feature reduction was performed for the absolute concentration model to ensure that the types of features used matched those of the relative concentration model.
Hyperparameter optimization of the model (cost and penalty) was performed using a random search strategy with 10-fold cross-validation on the training dataset. Details of the optimized hyperparameters are provided in Table S3. The mean area under the receiver operating characteristic curve (AUC) was used as the evaluation metric.
The final discriminative performance of the model for GC versus non-GC was evaluated via internal validation using the test dataset, which was not involved in model construction, in terms of the AUC, sensitivity, specificity, and their respective 95% confidence intervals (CIs). The 95% CIs were calculated using the Wilson/Brown method. The optimal cutoff value was determined as the point that maximized Youden’s index in out-of-fold predictions, which were obtained by performing 10-fold cross-validation with the same hyperparameters as the final model, integrating the predicted probabilities for the validation data of each fold. This fixed cutoff value was then applied to the prediction results of the test dataset to calculate sensitivity and specificity.
Machine learning model construction was performed using Python (version 3.11.9; Python Software Foundation, Wilmington, DE, USA) with the scikit-learn library (version 1.4.2; Python Software Foundation, Wilmington, DE, USA) [28]. Receiver operating characteristic (ROC) curves were generated using GraphPad Prism software (version 8.4.3; Boston, MA, USA).
Additionally, we evaluated the correlation between each feature or the predicted probability of the machine learning model and the overall concentration of saliva. The Probabilistic Quotient Normalization (PQN) coefficient was used as an indicator of overall salivary concentration. The median of the non-GC training dataset served as the reference value for calculating the PQN coefficient. For the correlation analysis, the PQN coefficient values were transformed into log10 values. Correlation coefficients were calculated using Spearman’s rank correlation test.
3. Results
3.1. Differences in Salivary Metabolite Concentrations Between the GC and Non-GC Groups
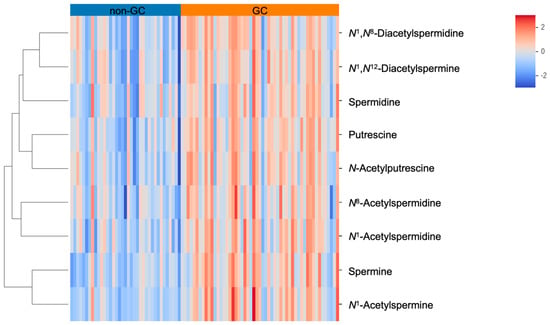
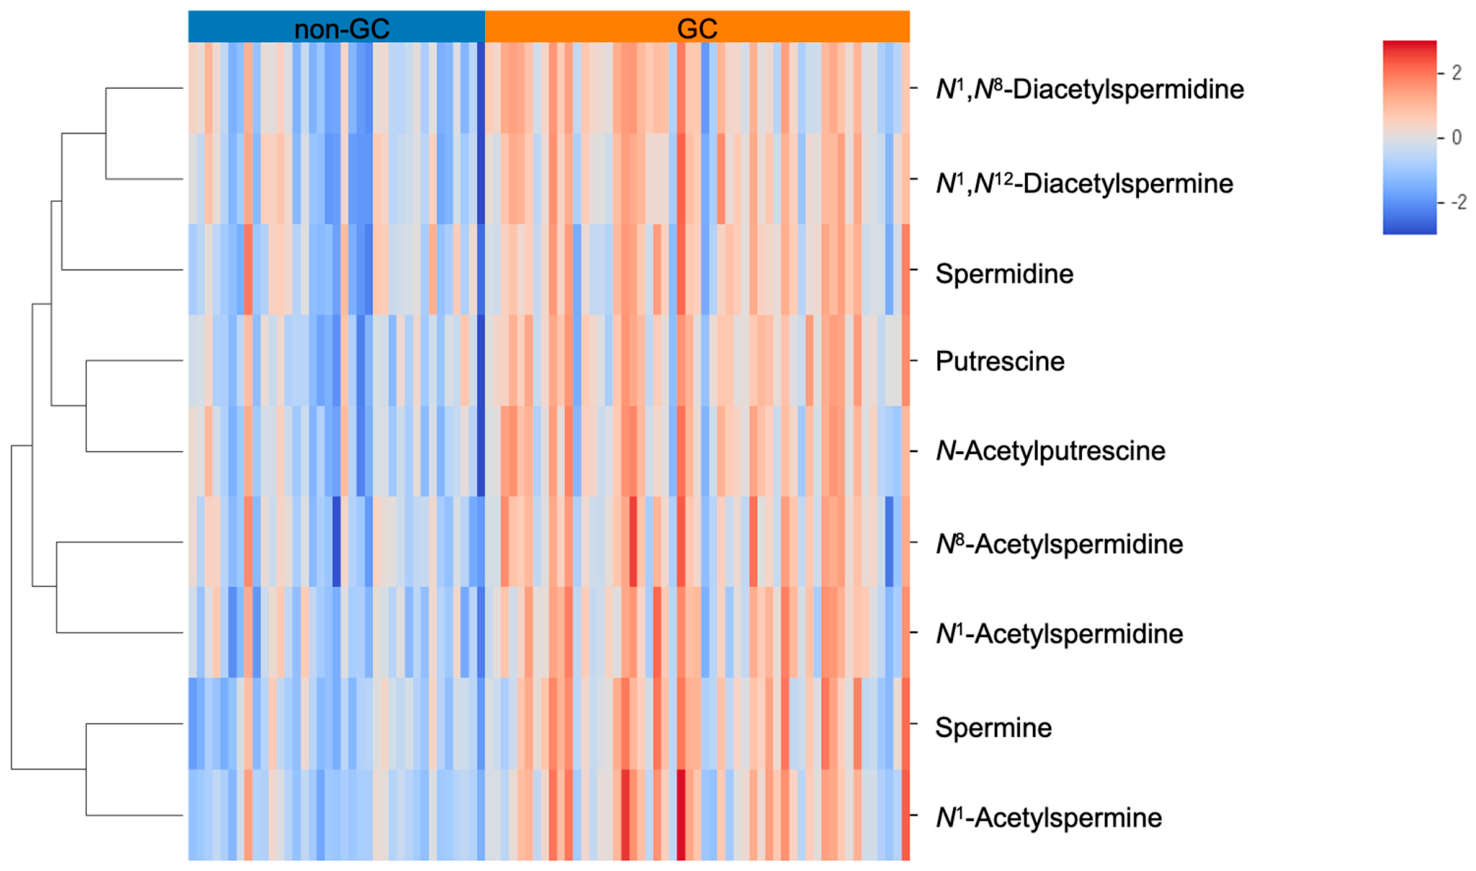
The characteristics of the study participants were summarized in Table 1. Metabolite concentration profiles of the GC and non-GC groups were compared using a heatmap (Figure 1). The GC group demonstrated higher concentrations for most metabolites than the non-GC group.
Table 1.
Characteristics of the participants of this study.
Figure 1.
Heatmap comparing the metabolite concentration profiles of the GC and non-GC groups.
After log10-transformation of each metabolite concentration, Z-scores were calculated and visualized as a heatmap. Euclidean distance was used to assess the distance between metabolites.
3.2. Comparison of Polyamine Concentrations Between the GC and Non-GC Groups
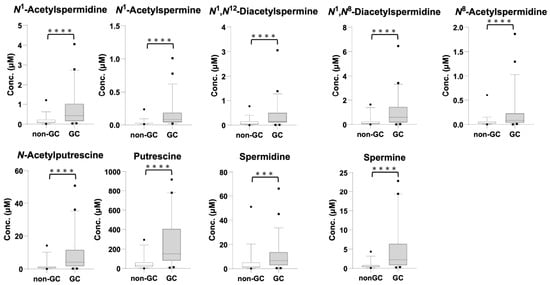
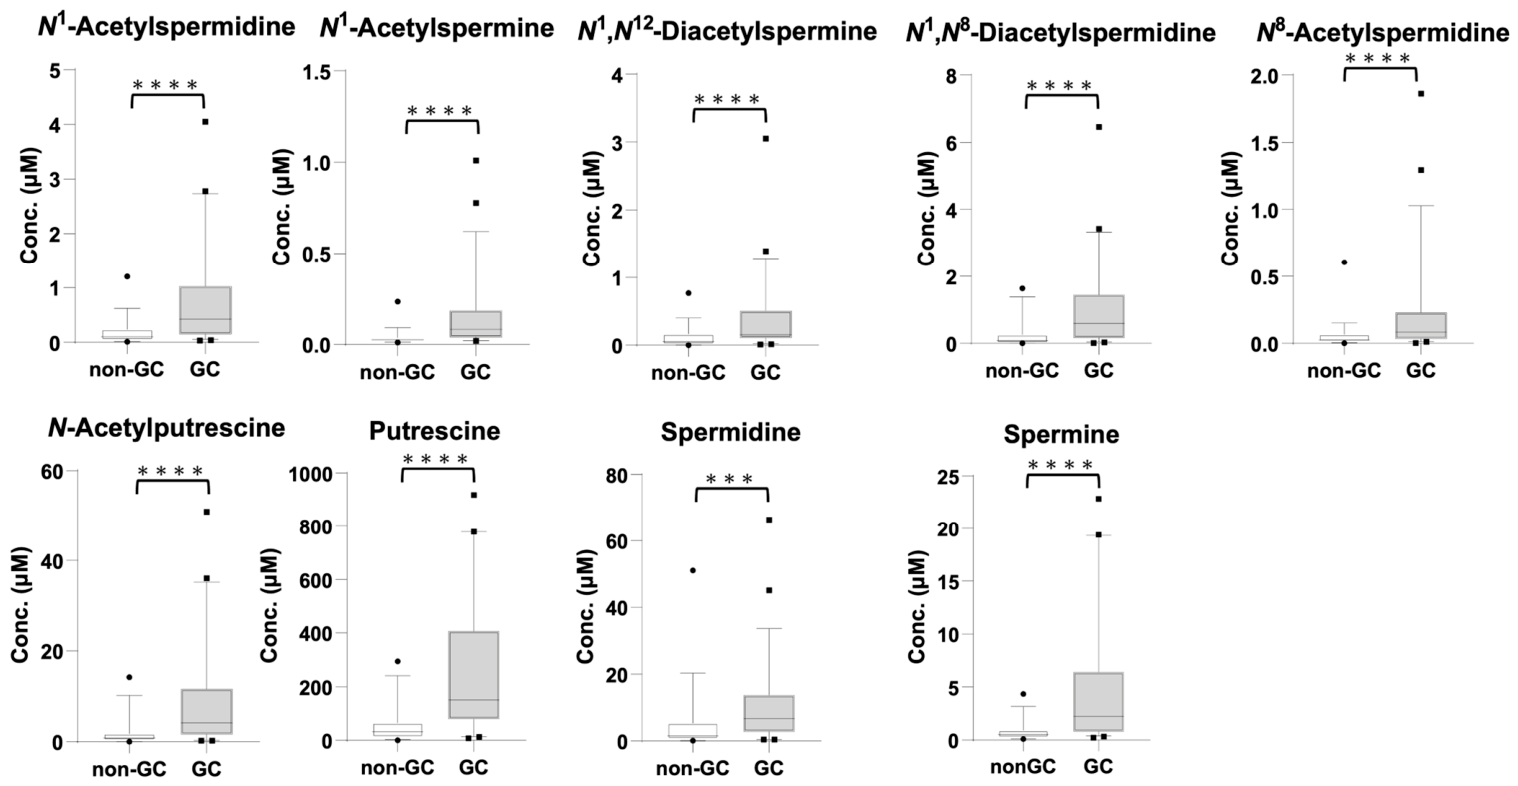
Box-and-whisker plots comparing concentrations of nine polyamines between the GC and non-GC groups were shown in Figure 2, and significant differences were observed for all of them.
Figure 2.
Comparison of salivary concentrations of nine polyamines between the GC and non-GC groups. In the box-and-whisker plots, horizontal lines indicate the 5th percentile, 95th percentile, median, first quartile, and third quartile. Data points below the 5th percentile and above the 95th percentile are shown as individual dots. Statistical analyses were performed on log10-transformed data using multiple Welch’s t-tests with false discovery rate (FDR) correction (Benjamini–Krieger–Yekutieli method). **** adjusted p < 0.0001, *** adjusted p < 0.001. GC, gastric cancer.
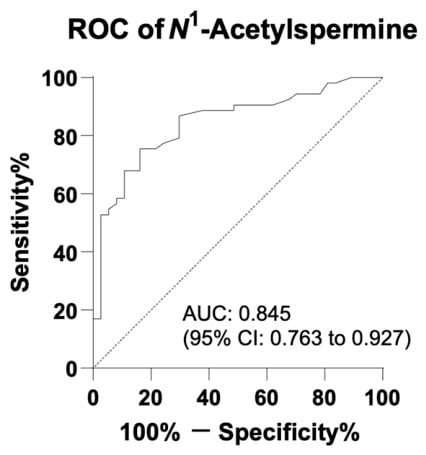
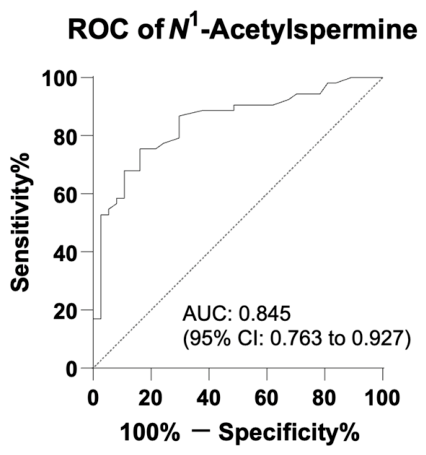
ROC curves were generated for each of the nine polyamines, and all of them demonstrated an AUC greater than 0.7 (Table 2). Among them, N1-acetylspermine demonstrated the highest discriminative performance between the GC and non-GC groups, with an AUC of 0.845 (95% CI: 0.763–0.927, p < 0.0001) (Figure 3).
Table 2.
Discrimination performance of various polyamines.
Figure 3.
ROC curve of N1-acetylspermine. The ROC curve of N1-acetylspermine, the polyamine that demonstrated the highest discriminatory ability between the GC and non-GC groups, is shown. The diagonal line represents the performance of a random classifier (AUC = 0.5).
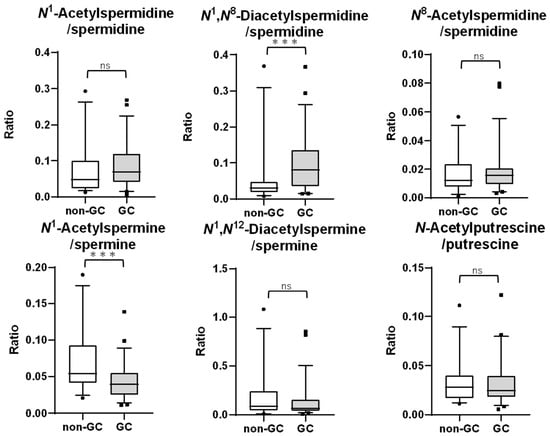
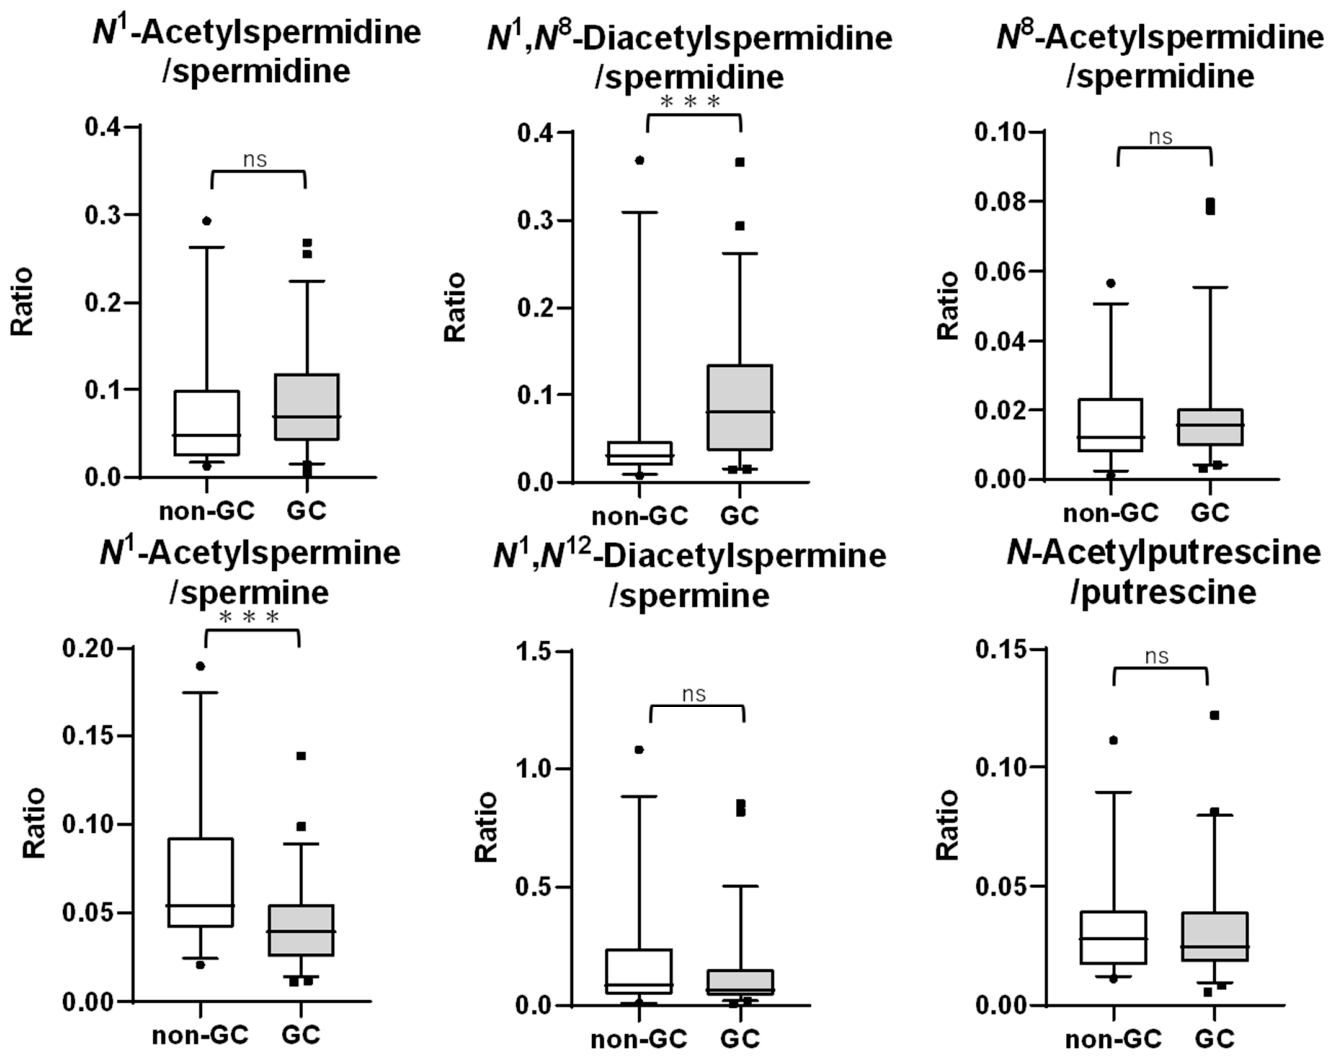
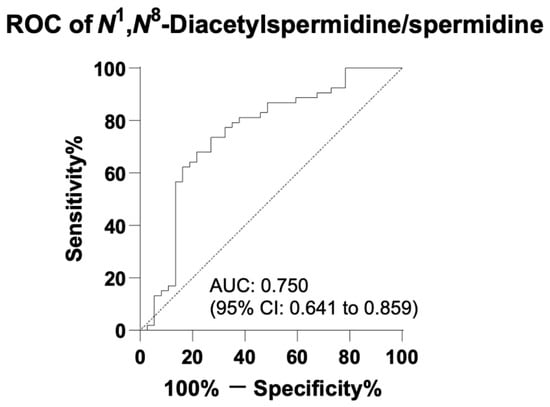
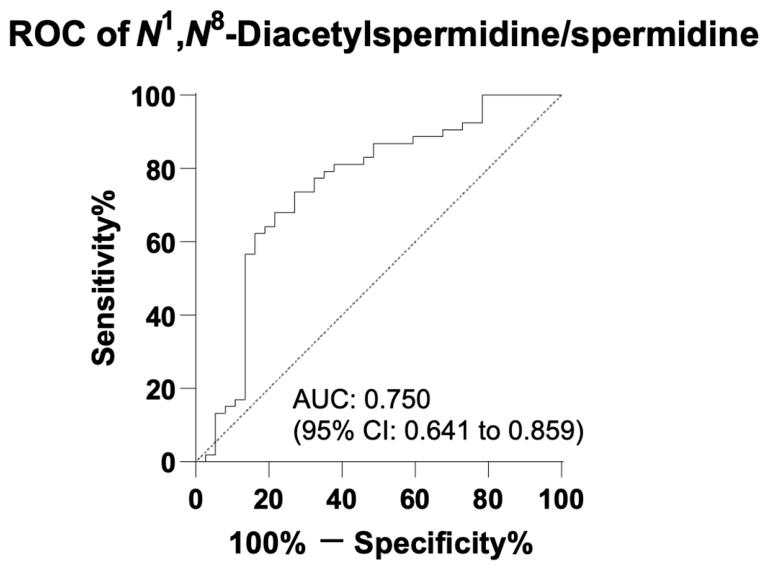
Box-and-whisker plots comparing various salivary acetylated polyamine/non-acetylated polyamine concentration ratios between the GC and non-GC groups were shown in Figure 4. Significant differences were observed for N1,N8-diacetylspermidine/spermidine and N1-acetylspermine/spermine, both of which yielded AUC values exceeding 0.7 (Table 3), with the former achieving the highest accuracy (AUC = 0.750; 95% CI: 0.641–0.859) (Figure 5).
Figure 4.
Comparison of various salivary acetylated polyamine/non-acetylated polyamine concentration ratios. In the box-and-whisker plots, horizontal lines indicate the 5th percentile, 95th percentile, median, first quartile, and third quartile. Data points below the 5th percentile and above the 95th percentile are shown as individual dots. Statistical analyses were performed on log10-transformed data using multiple Welch’s t-tests with false discovery rate (FDR) correction (Benjamini–Krieger–Yekutieli method). *** p < 0.001. GC, gastric cancer; ns, not significant.
Table 3.
Discrimination performance of various acetylated to non-acetylated polyamine concentration ratios.
Figure 5.
ROC curve of N1,N8-diacetylspermidine/spermidine ratio. The ROC curve of N1,N8-diacetylspermidine/spermidine, which was the ratio that demonstrated the highest discriminatory ability between the GC and non-GC groups, is shown. The diagonal line represents the performance of a random classifier (AUC = 0.5).
3.3. Analysis of ROC Curves, Sensitivities, and Specificities of the Machine Learning-Based Prediction for Detecting GC
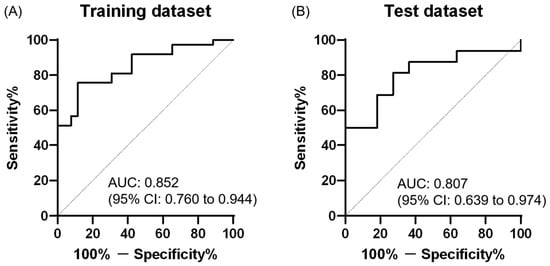
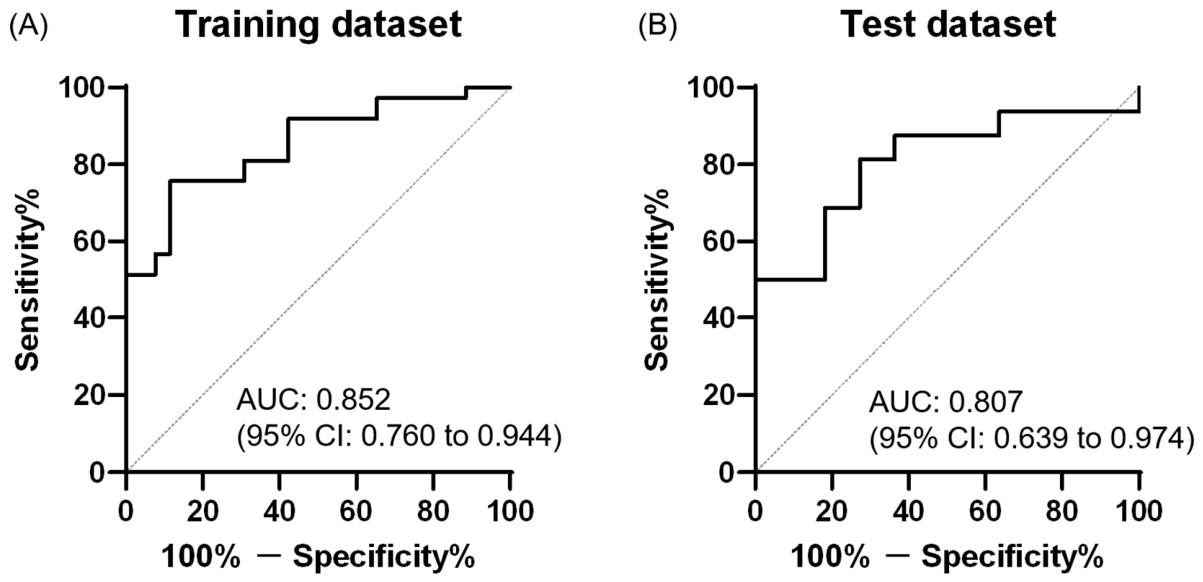
A relative concentration model was constructed using the six features generated in Section 3.2 (Table 3) as input values (Tables S3 and S4). The characteristics of the features in the training and test datasets are summarized in Table 4. ROC analysis of the constructed logistic regression model demonstrated favorable performance, with an AUC of 0.852 (95% CI: 0.760–0.944, p < 0.0001) in the training dataset and 0.807 (95% CI: 0.639–0.974, p = 0.0077) in the test dataset (Figure 6). The optimal cutoff value, determined using Youden’s index to maximize sensitivity and specificity, was 0.530, yielding a sensitivity of 68.8% (95% CI: 44.4–85.8%) and a specificity of 72.7% (95% CI: 43.4–90.3%).
Table 4.
Comparison of salivary polyamine ratios between the GC and non-GC groups.
Figure 6.
Discriminatory performance of the developed relative concentration model. (A) ROC curve for the training dataset. (B) ROC curve for the test dataset. The diagonal line represents the performance of a random classifier (AUC = 0.5).
Furthermore, to perform a comparison with the relative concentration model, an absolute concentration model was created using the absolute concentration data of the nine polyamines (Tables S3 and S4). ROC analysis of this absolute concentration model showed an AUC of 0.926 (95% CI: 0.865–0.988, p < 0.0001) in the training dataset and 0.688 (95% CI: 0.486–0.890, p = 0.1034) in the test dataset (Figure S3). The optimal cutoff value was 0.473, resulting in a sensitivity of 87.5% (95% CI: 64.0–96.5%) and a specificity of 45.5% (95% CI: 21.3–72.0%).
3.4. Verification of the Correlation Between Machine Learning-Predicted Probabilities and Salivary Concentration
In this study, the PQN coefficient was used as an indicator of overall salivary concentration, and we analyzed the correlation between the PQN coefficient and the features used in each model. While the features used in the absolute concentration model showed a strong correlation of 0.8 or higher with the PQN coefficient, the correlation between the features used in the relative concentration model and the PQN coefficient remained at approximately 0.5 at most (Table S5). Furthermore, we analyzed the correlation between the predicted probabilities output by each model and the PQN coefficient. In the test dataset, the absolute concentration model showed a high correlation of 0.8 or higher between the predicted probabilities and the PQN coefficient, whereas the correlation between the two in the relative concentration model remained below 0.2 (Table S6).
4. Discussion
In recent years, cancer screening tests using liquid biopsy samples have been increasingly reported. In this study, we focused on salivary polyamines. Polyamines are cationic low-molecular-weight compounds containing two or more amino groups per molecule. They play important roles in the regulation of gene transcription and signal transduction pathways by interacting with macromolecules such as DNA, RNA, ATP, phospholipids, and proteins [29]. Polyamines are also essential for cell proliferation. Indeed, increased polyamine levels in cancer tissues have been reported to contribute to abnormal tumor growth [30]. The polyamine biosynthetic pathway involves a series of enzymatic steps. It begins with ornithine, which is produced from arginine by arginase (EC 3.5.3.1) in the urea cycle [31]. Ornithine is converted to putrescine by ornithine decarboxylase (EC 4.1.1.17); subsequently, spermidine is synthesized by spermidine synthase (EC 2.5.1.16) and spermine by spermine synthase (EC 2.5.1.22), with S-adenosylmethionine supplied via the methionine pathway [31]. Spermidine and spermine are further converted to N1-acetylspermidine and N1-acetylspermine, respectively, through activation of SSAT [31]. SSAT has been reported to be transcriptionally regulated by tumor protein p53 [32] and to demonstrate increased expression under acidic pH conditions [33]. Acetylated polyamines are readily secreted from major tissues and diffuse into the surrounding tissues and vasculature [31]. Thus, as polyamines are closely associated with cancer biology, the analysis of polyamines that leak into body fluids may enable noninvasive cancer screening. In the present study, we found that salivary polyamine levels were significantly higher in the GC group than in the non-GC group (Figure 2), consistent with previous reports. This finding supports the biological plausibility of salivary polyamines as potential biomarkers for GC.
In the present study, saliva was selected as the target specimen because it can be collected noninvasively. However, several limitations of saliva should be considered. As reported by Nose et al., polyamine concentrations are increased in turbid saliva [23]. This may lead to false-positive results, particularly when a single metabolite concentration is used as the diagnostic indicator. Therefore, the collection of high-quality saliva with minimal stimulation is considered essential to minimize false positives. To ensure the collection of such high-quality specimens, we optimized the collection protocol based on the physiological characteristics of salivary secretion. Resting saliva is mainly secreted from the submandibular glands, and salivary flow increases with parasympathetic stimulation [34]. In addition, older individuals are more susceptible to oral dryness, which has been reported to be associated with decreased salivary flow rates [35]. Therefore, to obtain clear, high-quality saliva, particularly in older individuals, it is advisable to rinse the oral cavity with water before collection to maintain adequate moisture and to enable saliva to be naturally secreted under low-stress, parasympathetic-dominant conditions.
In this study, analysis of absolute concentrations showed that all metabolites were higher in the GC group than in the non-GC group (Figure 2). However, as mentioned earlier, it is likely that the concentration of metabolites in saliva is strongly influenced by dilution due to the volume of saliva secreted. Therefore, instead of absolute concentrations, we assessed the ratios of acetylated to non-acetylated polyamines as an index of acetylation. In contrast to the analysis of absolute concentrations, the use of metabolite ratios resulted in significant differences being detected only for specific metabolite ratios, such as N1,N8-diacetylspermidine/spermidine. Furthermore, the correlation analysis between the PQN coefficient, which served as an indicator of overall salivary concentration, and the metabolite ratios revealed no strong correlations (Table S5).
The relative concentration model, which utilized metabolite ratios as features, demonstrated an AUC of 0.807 (95% CI: 0.639–0.974, p = 0.0077) in the test dataset, indicating higher discriminative performance compared to the absolute concentration model, which used absolute concentrations as features (AUC = 0.688, 95% CI: 0.486–0.890, p = 0.1030) (Figure 6 and Figure S3). In the model using absolute concentrations, a high correlation was observed between the predicted probabilities and the PQN coefficient (Table S6). Given the small sample size of the test dataset in this study, concentration variations among samples could not be fully normalized across the datasets, which likely led to a decrease in the generalization performance of the absolute concentration model. In contrast, in the relative concentration model, the influence of concentration variability was reduced by calculating metabolite ratios, thereby mitigating such suppression compared to the absolute concentration model. These findings suggest that a machine learning model using ratios as features could be useful for specimens like saliva, which overall concentrations are prone to fluctuation. The sensitivity of the developed relative concentration model was 68.8% (95% CI: 44.4–85.8%), which compares favorably to the performance of conventional tumor markers reported in previous studies (CEA: 17.4%, CA19-9: 20.8%) [5]. However, it should be noted that these comparisons were not performed on strictly identical specimens, and that tumor markers are practically utilized as diagnostic aids in combination with other examinations rather than for standalone screening purposes.
We previously reported our results of metabolomic analysis of blood samples using MS, in which the AUC in the test dataset was 0.885 (95% CI: 0.797–0.973, p < 0.0001) [6]. Despite the limited sample size available for machine learning, the discriminative performance obtained using salivary polyamine measurements was comparable to that of blood-based metabolomic analyses. Furthermore, the majority of cases in the GC group in this study were early-stage gastric cancer (Stage I) (Table 1). This suggests that polyamine profiling in saliva could be a useful approach for screening to detect GC at an early stage.
Although this study did not directly analyze the biological mechanisms underlying the alterations observed in GC patients—such as the elevated N1,N8-diacetylspermidine/spermidine ratio or the decreased N1-acetylspermine/spermine ratio—several previous studies have reported relevant pathways. For instance, it has been reported that down-regulation of histone deacetylase 10 (HDAC10) leads to the accumulation of N8-acetylspermidine, which is subsequently N1-acetylated by spermidine/spermine N1-acetyltransferase (SSAT) and secreted into the extracellular space as N1,N8-diacetylspermidine. Furthermore, N1-acetylpolyamine oxidase (EC 1.5.3.13) utilizes monoacetylated forms as primary substrates to convert N1-acetylspermine into spermidine [36]. Such alterations in the acetylation pathway associated with cellular malignant transformation may potentially account for the changes in salivary polyamine acetylation observed in this study.
Although MS-based analysis is a standard approach in metabolomics and was also used in the present study, it entails several challenges for widespread clinical use, such as the high initial cost of instrumentation, and the need to secure personnel with specialized expertise. To address these issues, the development of a simple screening method using immunochromatographic kits may enable further cost reduction and improved convenience.
According to the 2022 Comprehensive Survey of Living Conditions published by the Ministry of Health, Labour and Welfare of Japan, the participation rates in GC screening among individuals aged 40 to 69 years remain at 47.5% for men and 36.5% for women [37], indicating substantial room for improvement. Common reasons for not undergoing cancer screening include pain and anxiety associated with the examination, the time and effort required, and financial burden. In some cases, spatial constraints, such as limited access to medical facilities, further hinder GC screening participation. If sample collection at home becomes feasible, these barriers could potentially be mitigated. Because noninvasive and highly accurate tests can contribute to improving screening participation rates, the analysis of salivary polyamine concentration ratios may be useful as an auxiliary modality for GC screening.
This study had several limitations. First, there were notable imbalances in clinical backgrounds—such as age, H. pylori status, and the presence of atrophic gastritis—between the GC and non-GC groups. Consequently, the reported AUC cannot be interpreted as an unbiased estimate of GC-specific diagnostic performance, and these background factors may partly influence salivary polyamine profiles. However, considering that advanced age, H. pylori infection, and atrophic gastritis are risk factors for gastric carcinogenesis, a certain degree of demographic disparity between GC patients and younger, healthy controls is naturally expected. Nevertheless, future studies with matched demographic profiles should be conducted. Furthermore, to minimize confounding, we carefully excluded individuals with confounding conditions known to alter systemic polyamine levels, such as a history of other cancers, benign prostatic hyperplasia, or renal dysfunction. Given these considerations, the findings of this study should be interpreted as an exploratory proof-of-concept study rather than the validation of a fully established screening test. Second, the test dataset was very small, consisting of a limited number of observations, which resulted in wide confidence intervals for sensitivity and specificity. Therefore, the test dataset represents an internal validation set rather than an external one. Third, due to the single-center design and the lack of an independent external cohort, external validation of the predictive model has not yet been established. Further large-scale, multicenter prospective studies matching age and background factors are necessary to validate the generalizability and clinical utility of salivary polyamine profiling. Fourth, we were unable to evaluate the metabolic profile in advanced cancer as the majority of participants in the GC group had early-stage cancer. Finally, since comprehensive whole-body CT was not performed routinely, we cannot entirely exclude the possibility of occult non-gastric malignancies that might affect polyamine levels.
5. Conclusions
Our results demonstrate that salivary polyamine analysis, particularly using acetylation ratios, enables accurate and minimally invasive discrimination of GC. Further studies are warranted to validate salivary polyamine acetylation ratios as candidate biomarkers for GC screening.
Supplementary Materials
The following supporting information can be downloaded at https://www.mdpi.com/article/10.3390/medsci14070695/s1, Figure S1: Flowchart of selection process; Figure S2: Flowchart of the classification and analysis of the training and validation; Figure S3: Discriminatory performance of the absolute concentration model; Table S1: Measurement conditions for salivary metabolites; Table S2: Calibration curves of the target metabolites, polyamines; Table S3: Optimum hyperparameters that were used for logistic regression; Table S4: Intercepts and regression coefficients of the machine learning models; Table S5: Correlations between each feature and the PQN coefficient; Table S6: Correlations between predicted probabilities and the PQN coefficient.
Author Contributions
Conceptualization, methodology, validation, formal analysis, data curation, writing—original draft preparation, writing—review and editing, visualization, M.N., M.F. and M.S.; supervision and project administration, T.I. (Takao Itoi); collection of participant samples, M.N., H.S., S.N., S.K., Y.Y., A.M., K.U., T.M. (Takashi Morise), Y.K., T.I. (Tadashi Ichimiya), T.M. (Takahiro Muramatsu), F.Y., M.M. and H.K. All authors have read and agreed to the published version of the manuscript.
Funding
This research received no external funding.
Institutional Review Board Statement
The study was conducted in accordance with the Declaration of Helsinki, and approved by the Ethics Committee of Tokyo Medical University Hospital, Tokyo, Japan (study approval number: SH3885, date of approval: 31 October 2017).
Informed Consent Statement
Informed consent was obtained from all subjects involved in the study.
Data Availability Statement
The original contributions presented in this study are included in the article/Supplementary Materials. Further inquiries can be directed to the corresponding author.
Acknowledgments
We are grateful to all participants who provided samples for this study, and we also thank SalivaTech Co., Ltd. for their support of this quantification of saliva polyamine concentrations, the conduct of preliminary analysis, and the provision of analytical advice. We are also grateful to Popiel Helena Akiko of Tokyo Medical University for her editing of the manuscript.
Conflicts of Interest
Makoto Sunamura holds an unpaid director position in SalivaTech Co., Ltd. The other authors have no conflicts of interest to declare.
Abbreviations
The following abbreviations are used in this manuscript:
| AUC | area under the receiver operating characteristic curve |
| CA19-9 | carbohydrate antigen 19-9 |
| CEA | carcinoembryonic antigen |
| CI | confidence interval |
| EC | enzyme commission |
| GC | gastric cancer |
| HDAC10 | histone deacetylase 10 |
| HFBA | heptafluorobutyric acid |
| i.d. | internal diameter |
| LC-MS | liquid chromatography–mass spectrometry |
| LOQ | limit of quantification |
| MS | mass spectrometry |
| PQN | Probabilistic Quotient Normalization |
| psi | pounds per square inch |
| QC | quality control |
| ROC | receiver operating characteristic |
| SSAT | spermidine/spermine N1-acetyltransferase |
| Vcap | capillary voltage |
References
- Cancer Statistics; Cancer Information Service, National Cancer Center, Japan (Vital Statistics of Japan, Ministry of Health, Labour and Welfare). Available online: https://ganjoho.jp/reg_stat/statistics/data/dl/index.html (accessed on 14 February 2026).
- Cancer Statistics; Cancer Information Service, National Cancer Center, Japan (National Cancer Registry, Ministry of Health, Labour and Welfare). Available online: https://ganjoho.jp/reg_stat/statistics/data/dl/index.html (accessed on 14 February 2026).
- Ferlay, J.; Ervik, M.; Lam, F.; Colombet, M.; Mery, L.; Piñeros, M.; Znaor, A.; Soerjomataram, I.; Bray, F. Global Cancer Observatory: Cancer Today; International Agency for Research on Cancer: Lyon, France, 2024; Available online: https://gco.iarc.who.int/today (accessed on 14 February 2026).
- Ferlay, J.; Ervik, M.; Lam, F.; Colombet, M.; Mery, L.; Piñeros, M.; Znaor, A.; Soerjomataram, I.; Bray, F. Global Cancer Observatory: Cancer Tomorrow, Version 1.1; International Agency for Research on Cancer: Lyon, France, 2024; Available online: https://gco.iarc.who.int/tomorrow (accessed on 25 September 2025).
- He, C.Z.; Zhang, K.H.; Li, Q.; Liu, X.H.; Hong, Y.; Lv, N.H. Combined use of AFP, CEA, CA125 and CAl9-9 improves the sensitivity for the diagnosis of gastric cancer. BMC Gastroenterol. 2013, 13, 87. [Google Scholar] [CrossRef] [Scilit] [PubMed]
- Matsumoto, T.; Fukuzawa, M.; Itoi, T.; Sugimoto, M.; Aizawa, Y.; Sunamura, M.; Kawai, T.; Nemoto, D.; Shinohara, H.; Muramatsu, T.; et al. Targeted Metabolomic Profiling of Plasma Samples in Gastric Cancer by Liquid Chromatography-Mass Spectrometry. Digestion 2023, 104, 97–108. [Google Scholar] [CrossRef] [Scilit] [PubMed]
- Asai, Y.; Itoi, T.; Sugimoto, M.; Sofuni, A.; Tsuchiya, T.; Tanaka, R.; Tonozuka, R.; Honjo, M.; Mukai, S.; Fujita, M.; et al. Elevated Polyamines in Saliva of Pancreatic Cancer. Cancers 2018, 10, 43. [Google Scholar] [CrossRef] [Scilit] [PubMed]
- Ishikawa, S.; Sugimoto, M.; Kitabatake, K.; Sugano, A.; Nakamura, M.; Kaneko, M.; Ota, S.; Hiwatari, K.; Enomoto, A.; Soga, T.; et al. Identification of salivary metabolomic biomarkers for oral cancer screening. Sci. Rep. 2016, 6, 31520. [Google Scholar] [CrossRef] [Scilit] [PubMed]
- Kuwabara, H.; Katsumata, K.; Iwabuchi, A.; Udo, R.; Tago, T.; Kasahara, K.; Mazaki, J.; Enomoto, M.; Ishizaki, T.; Soya, R.; et al. Salivary metabolomics with machine learning for colorectal cancer detection. Cancer Sci. 2022, 113, 3234–3243. [Google Scholar] [CrossRef] [Scilit] [PubMed]
- Kodama, N.; Ito, N.; Murano, T.; Hiruta, H.; Bujo, H.; Yamamoto, T.; Yamazaki, H.; Yokota, H. Significance of Measurement of N1,N12-diacetylspermine in Human Urine for Primary Cancer Screening (尿中N1,N12-ジアセチルスペルミン測定意義に関する検討). J. Clin. Lab. Anal. 2018, 43, 21–27. [Google Scholar]
- Bel’skaya, L.V.; Sarf, E.A.; Loginova, A.I. Diagnostic Value of Salivary Amino Acid Levels in Cancer. Metabolites 2023, 13, 950. [Google Scholar] [CrossRef] [Scilit] [PubMed]
- Tomita, A.; Mori, M.; Hiwatari, K.; Yamaguchi, E.; Itoi, T.; Sunamura, M.; Soga, T.; Tomita, M.; Sugimoto, M. Effect of storage conditions on salivary polyamines quantified via liquid chromatography-mass spectrometry. Sci. Rep. 2018, 8, 12075. [Google Scholar] [CrossRef] [Scilit] [PubMed]
- Maksymiuk, A.W.; Sitar, D.S.; Ahmed, R.; Cheng, B.; Bach, H.; Bagchi, R.A.; Aroutiounova, N.; Tappia, P.S.; Ramjiawan, B. Spermidine/spermine N1-acetyltransferase-1 as a diagnostic biomarker in human cancer. Future Sci. OA 2018, 4, FSO345. [Google Scholar] [CrossRef] [Scilit] [PubMed]
- Tse, R.T.; Ding, X.; Wong, C.Y.; Cheng, C.K.; Chiu, P.K.; Ng, C.F. The Association between Spermidine/Spermine N1-Acetyltransferase (SSAT) and Human Malignancies. Int. J. Mol. Sci. 2022, 23, 5926. [Google Scholar] [CrossRef] [Scilit] [PubMed]
- Jin, Z.; Jiang, W.; Jiao, F.; Guo, Z.; Hu, H.; Wang, L.; Wang, L. Decreased expression of histone deacetylase 10 predicts poor prognosis of gastric cancer patients. Int. J. Clin. Exp. Pathol. 2014, 7, 5872–5879. [Google Scholar] [PubMed]
- Uemura, T.; Yerushalmi, H.F.; Tsaprailis, G.; Stringer, D.E.; Pastorian, K.E.; Hawel, L., III; Byus, C.V.; Gerner, E.W. Identification and characterization of a diamine exporter in colon epithelial cells. J. Biol. Chem. 2008, 283, 26428–26435. [Google Scholar] [CrossRef] [Scilit] [PubMed]
- Wang, S.; Han, H.; Hu, Y.; Yang, W.; Lv, Y.; Wang, L.; Zhang, L.; Ji, J. SLC3A2, antigen of mAb 3G9, promotes migration and invasion by upregulating of mucins in gastric cancer. Oncotarget 2017, 8, 88586–88598. [Google Scholar] [CrossRef] [Scilit] [PubMed]
- Babbar, N.; Gerner, E.W. Targeting polyamines and inflammation for cancer prevention. Recent Results Cancer Res. 2011, 188, 49–64. [Google Scholar] [CrossRef] [Scilit] [PubMed]
- Dunzendorfer, U.; Russell, D.H. Altered polyamine profiles in prostatic hyperplasia and in kidney tumors. Cancer Res. 1978, 38, 2321–2324. [Google Scholar] [PubMed]
- Sakata, K.; Kashiwagi, K.; Sharmin, S.; Ueda, S.; Irie, Y.; Murotani, N.; Igarashi, K. Increase in putrescine, amine oxidase, and acrolein in plasma of renal failure patients. Biochem. Biophys. Res. Commun. 2003, 305, 143–149. [Google Scholar] [CrossRef] [Scilit] [PubMed]
- Zhang, T.; Hu, L.; Tang, J.F.; Xu, H.; Tian, K.; Wu, M.N.; Huang, S.Y.; Du, Y.M.; Zhou, P.; Lu, R.J.; et al. Metformin Inhibits the Urea Cycle and Reduces Putrescine Generation in Colorectal Cancer Cell Lines. Molecules 2021, 26, 1990. [Google Scholar] [CrossRef] [Scilit] [PubMed]
- Li, J.; Cameron, G.A.; Wallace, H.M. Decreased sensitivity to aspirin is associated with altered polyamine metabolism in human prostate cancer cells. Amino Acids 2016, 48, 1003–1012. [Google Scholar] [CrossRef] [Scilit] [PubMed]
- Nose, D.; Sugimoto, M.; Muta, T.; Miura, S. Salivary Polyamines Help Detect High-Risk Patients with Pancreatic Cancer: A Prospective Validation Study. Int. J. Mol. Sci. 2023, 24, 2998. [Google Scholar] [CrossRef] [Scilit] [PubMed]
- Hunter, J.D. Matplotlib: A 2D Graphics Environment. Comput. Sci. Eng. 2007, 9, 90–95. [Google Scholar] [CrossRef] [Scilit]
- Waskom, M.L. seaborn: Statistical data visualization. J. Open Source Softw. 2021, 6, 3021. [Google Scholar] [CrossRef] [Scilit]
- Harris, C.R.; Millman, K.J.; van der Walt, S.J.; Gommers, R.; Virtanen, P.; Cournapeau, D.; Wieser, E.; Taylor, J.; Berg, S.; Smith, N.J.; et al. Array programming with NumPy. Nature 2020, 585, 357–362. [Google Scholar] [CrossRef] [Scilit] [PubMed]
- McKinney, W. Data Structures for Statistical Computing in Python. In Proceedings of the 9th Python in Science Conference; van der Walt, S., Millman, J., Eds.; SciPy: Austin, TX, USA, 2010; pp. 56–61. [Google Scholar]
- Pedregosa, F.; Varoquaux, G.; Gramfort, A.; Michel, V.; Thirion, B.; Grisel, O.; Blondel, M.; Prettenhofer, P.; Weiss, R.; Dubourg, V.; et al. Scikit-learn: Machine Learning in Python. J. Mach. Learn. Res. 2011, 12, 2825–2830. [Google Scholar]
- Pegg, A.E. Mammalian polyamine metabolism and function. IUBMB Life 2009, 61, 880–894. [Google Scholar] [CrossRef] [Scilit] [PubMed]
- Suzuki, M.; Suzuki, T.; Nakano, Y.; Matsumoto, K.; Manaka, H.; Komeno, M.; Tamori, S.; Sato, A.; Dohmae, N.; Akimoto, K.; et al. Polyamines stimulate the protein synthesis of the translation initiation factor eIF5A2, participating in mRNA decoding, distinct from eIF5A1. J. Biol. Chem. 2025, 301, 110453. [Google Scholar] [CrossRef] [Scilit] [PubMed]
- Gerner, E.W.; Meyskens, F.L., Jr. Polyamines and cancer: Old molecules, new understanding. Nat. Rev. Cancer 2004, 4, 781–792. [Google Scholar] [CrossRef] [Scilit] [PubMed]
- Ou, Y.; Wang, S.J.; Li, D.; Chu, B.; Gu, W. Activation of SAT1 engages polyamine metabolism with p53-mediated ferroptotic responses. Proc. Natl. Acad. Sci. USA 2016, 113, E6806–E6812. [Google Scholar] [CrossRef] [Scilit] [PubMed]
- Kato, M.; Maeda, K.; Nakahara, R.; Hirose, H.; Kondo, A.; Aki, S.; Sugaya, M.; Hibino, S.; Nishida, M.; Hasegawa, M.; et al. Acidic extracellular pH drives accumulation of N1-acetylspermidine and recruitment of protumor neutrophils. Proc. Natl. Acad. Sci. USA Nexus 2023, 2, pgad306. [Google Scholar] [CrossRef] [Scilit] [PubMed]
- Garrett, J.R. The proper role of nerves in salivary secretion: A review. J. Dent. Res. 1987, 66, 387–397. [Google Scholar] [CrossRef] [Scilit] [PubMed]
- Nagler, R.M.; Hershkovich, O. Relationships between age, drugs, oral sensorial complaints and salivary profile. Arch. Oral Biol. 2005, 50, 7–16. [Google Scholar] [CrossRef] [Scilit] [PubMed]
- Vujcic, S.; Liang, P.; Diegelman, P.; Kramer, D.L.; Porter, C.W. Genomic identification and biochemical characterization of the mammalian polyamine oxidase involved in polyamine back-conversion. Biochem. J. 2003, 370, 19–28. [Google Scholar] [CrossRef] [Scilit] [PubMed]
- Ministry of Health, Labour and Welfare. Comprehensive Survey of Living Conditions 2022. Available online: https://www.mhlw.go.jp/toukei/saikin/hw/k-tyosa/k-tyosa22/dl/14.pdf (accessed on 14 February 2026).

Disclaimer/Publisher’s Note: The statements, opinions and data contained in all publications are solely those of the individual author(s) and contributor(s) and not of MDPI and/or the editor(s). MDPI and/or the editor(s) disclaim responsibility for any injury to people or property resulting from any ideas, methods, instructions or products referred to in the content. |
© 2026 by the authors. Licensee MDPI, Basel, Switzerland. This article is an open access article distributed under the terms and conditions of the Creative Commons Attribution (CC BY) license.