Abstract
One of the important stages of energy efficiency measures for buildings is the optimal choice of heating and cooling systems, as well as that of heat/cold production sources, so as to minimize dependence on conventional fuels and the national energy system. Currently, the option for integrating renewable energy sources addressed in the building efficiency stage is the installation of solar systems. In the context of the need to reduce energy consumption and reduce pollutant emissions, and the need to integrate renewable energy sources, the article addresses the implementation of a hybrid system with a water-to-water heat pump and photovoltaic panels, capable of achieving the decarbonization of the heating/cooling of a University Politehnica Timisoara teaching/research laboratory. The analyzed hybrid system uses the thermal potential of the Bega channel as a heat/cold source, and as a source for electricity production, a PV system, supported by the national energy system. Following the analysis of the operation of the building’s hybrid system for heating and cooling, during 4 November 2024–12 September 2025, an energy independence of approximately 90.7% and a reduction in CO2 emissions of 4.17 t/year was found.
1. Introduction
Climate change and the increasing need to ensure environmental comfort have recently led to an increase in the demand for heating and cooling buildings [1,2,3,4,5].
On the other hand, regarding Romania, but also other EU countries, the social impact of climate change is increasingly pronounced due to successive waves of high temperatures during the summer, which have led to an increase in the share of buildings in the EU in which comfortable temperatures cannot be maintained during summer. The European Environment Agency estimates that, in 2050, the elderly will be more vulnerable to heat waves as a result of increased urbanization (Figure 1) [2].
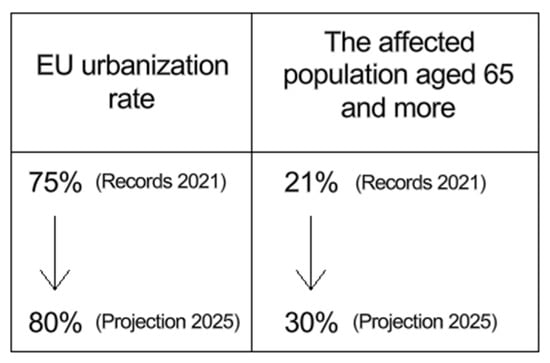
Figure 1.
Projected increase in heat-related vulnerability among populations aged 65 and older under expanding urbanization by 2050 [2].
Because Europeans spend an average of 80–90% of their time indoors [6], one of the current sustainability challenges for EU countries is to improve the energy efficiency of the existing building stock to ensure energy independence and climate neutrality in a socially just and equitable way [2]. Compared to only 5% of Europeans who lack adequate heating or cooling facilities in their buildings, in Romania, the percentage is 4.4 times higher (22%) [7].
Furthermore, the high percentages of final energy consumption (40%) and greenhouse gas emissions generated by energy consumption (36%) for which buildings in the EU are responsible indicate that their energy inefficiency accounts for 75% of all buildings [8]. For the sustainable development of the analyzed thermal systems (heating and cooling), the article considers that the main results obtained through actions involving the modernization of thermal systems must have a minimal impact on the environment, that is, through the efficient use of resources, the reduction in greenhouse gas emissions and of energy consumption, all while simultaneously integrating economic, social, and ecological aspects.
So, in the building sector, reducing energy consumption and greenhouse gas emissions, while increasing energy efficiency, can be achieved through systemic thinking, from production to consumption, effectively integrating energy produced from renewable sources. In building installation systems, at the local level, the implementation of renewable energy sources (RESs)—mainly solar energy [9,10,11,12,13,14,15,16]—will implicitly contribute to reducing energy dependence on conventional energy sources (coal, oil, etc.) and energy poverty in EU countries.
From these points of view, the EU directives on the energy performance of buildings present as a vision for the progressive decarbonization of the real estate stock for the year 2050, giving consideration to emissions generated by buildings throughout their entire life cycle, starting with new buildings [8]. Thus, it is important to research the viability and local availability of thermal resources that are as cheap as possible in terms of exploitation. In the context of the availability and free availability of energy sources, the most viable are RESs, which, in the Romanian heating and cooling sector, experienced an average annual growth of 0.8% from 2021 to 2025, with a forecast of an evolution of up to 1.1% for the immediately following period (2026–2030) [17]. The transformation that the energy infrastructure is currently undergoing is determined by environmental and societal changes, which can become increasingly connected and sustainable. Water is also part of the RES category, which, in addition to potential and kinetic energy, also possesses thermal potential. From the point of view of the thermal potential of water sources in Romania, we consider that it is quite considerable, considering the hydrographic network available in the country. The novelty brought by this study consists in the evaluation of free cooling for buildings located near watercourses and the creation of a fully automated hybrid system that integrates and complements two systems that operated individually for heating and cooling. Practically, the study attracts attention due to the thermal potential of surface waters, which can be used in heating/cooling systems for buildings located near watercourses. The case study was conducted to demonstrate the viability of using this potential. Given that we have not identified similar studies in the specialized literature, we believe that the experimental research carried out by the authors gives the study a unique character.
Romania’s thermal energy context is largely dependent on fossil fuels (gas, coal, fuel oil) for district heating. Recently, national/local strategies in Romania have focused on the transition to decarbonization, which has led to the implementation of measures to modernize district heating plants and to the use of thermal potential from renewable sources (geothermal, biomass, solar) depending on local potential. The thermal potential of surface waters can be classified as a renewable source. For this reason, its use, where available, contributes to the reduction in CO2 emissions and the decarbonization of building heating and cooling. The analyzed hybrid system can also find its applicability in similar regional contexts. The experimentally collected data can constitute a database for similar subsequent research. The main argument of the experimental study carried out is the decarbonization of building heating/cooling systems by using locally available renewable sources.
Figure 2 indicates the location, in relation to the Bega channel, of the building for which the use of surface water thermal energy in heating/cooling installations is being analyzed [18]. The average flow rate of the Bega channel varies and is estimated at approximately 17 m3/s [19].
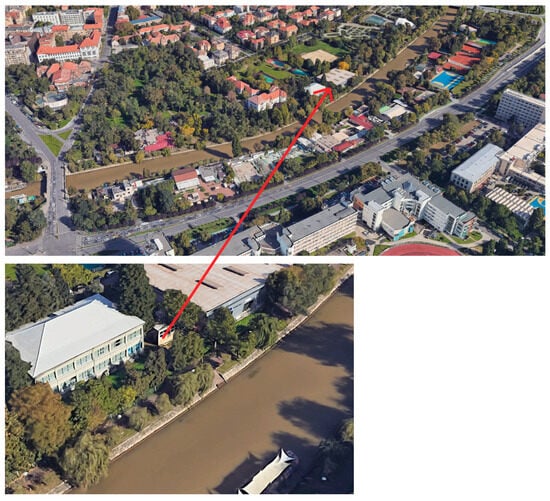
Figure 2.
Location of the analyzed building in relation to the Bega channel [18].
Given that there is a considerable flow of water in the Bega channel in Timisoara, the article presents an experimental study carried out by the authors through which its thermal potential is evaluated. The use of this potential was tested for heating and cooling a space intended for teaching and research: the “Conversion and storage of energy” laboratory owned by University Politehnica Timisoara. From the multitude of possible functions of the Bega channel (drinking and industrial water supply for the Timisoara area, irrigation, general drainage collector, recreation, servitude, etc.) [20], currently, the channel has retained its main purpose as a water supply source (approximately 76%) for most of Timisoara. The navigable portion is limited (approximately 11 kilometers in warm weather) for public water transport. In 2024, the thermal potential of the Bega channel was analyzed by the authors by implementing a water-to-water heat pump system and a free cooling system (which operated individually until October 2024), which used the water from the Bega channel as a heat source. The analyzed systems (heating and cooling) showed that, compared to the classical approach (district heating system for heating and air conditioning for cooling), a reduction in electricity consumption by 42.51% for cooling and an annual reduction in CO2 emissions by 79.37% was achieved for both systems [21].
Due to the fact that the viability of using the thermal potential of surface waters in building installation systems has been demonstrated by reducing energy consumption and CO2 emissions, which was achieved without a negative impact on the environment and groundwater [21], the authors extended the research period and, in October 2024, integrated the two systems into a hybrid one. The hybrid system studied (with a heat pump for heating and a centrifugal pump for free cooling) and presented in this article was analyzed from the point of view of the efficiency of ensuring the thermal energy requirement (heat and cold), entirely using water from the Bega channel for both heating and cooling seasons, respectively. To produce electricity, a photovoltaic system with storage was analyzed and installed, necessary for the partial supply of electricity to the proposed hybrid system.
For the design and installation of the two systems (hybrid and photovoltaic), the following steps were taken:
- -
- the thermal potential of the Bega channel was analyzed using an analytical method;
- -
- the photovoltaic potential of Timisoara was studied using two analysis models (PVGIS and Polysun SPT version);
- -
- the possibility of supplementing the existing photovoltaic system with eight monocrystalline photovoltaic panels of 455 Wp was analyzed;
- -
- the PV system inverter was resized, so a HUAWEI inverter with a maximum efficiency of 97.8% and a power of 6 kW was chosen;
- -
- a storage system with lithium-ion batteries with a capacity of 6 kWh was added, with a charging/discharging efficiency of 93%;
- -
- the heating/cooling seasons were established for which the building’s heating and cooling needs were analytically calculated according to the regulations in force in Romania [22,23,24,25];
- -
- the hybrid system was designed by coupling the previously analyzed individual systems and implementing an automation system [21].
In conclusion, the hybrid system analyzed by using the thermal potential of the water in the Bega channel as a heat/cold source, and as a source for producing electricity, a PV system with storage, supported by the national energy system, contributes additionally to the decarbonization of the heating and cooling systems serving the building.
2. Materials and Methods
2.1. Building Description and Establishment of Thermal Comfort Conditions
The “Energy Conversion and Storage” laboratory building, with the geometric dimensions indicated in Figure 3a, is made of hollow brick, clad with 12.5 mm gypsum plasterboard on the inside, and insulated on the outside with 5 cm polystyrene (Figure 3b). The roof of the building is of the non-pedestrian terrace type and is made of prefabricated sandwich panel-type sheets and polyurethane foam, in a single pitch with a 3-degree slope. The layout of the laboratory building in Figure 3a shows the location of the hybrid system equipment with details of the main elements (View A—acquisition system, View B—monitoring and measurement system (sensors and flow meters), View C—centrifugal pump).
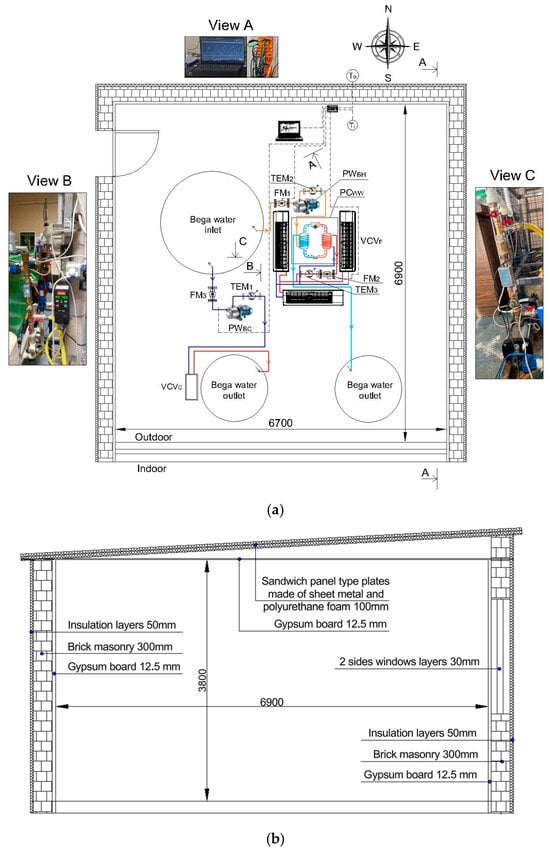
Figure 3.
“Energy Conversion and Storage” Laboratory: (a) Equipment location plan; (b) Section A-A. To—Outside air temperature; Ti—Indoor air temperature; FM1—Evaporator inlet flowmeter; FM2—Condenser outlet flowmeter; FM3—Free cooling water source flow meter; PWBC—Centrifugal pump for water circulation from Bega channel for free cooling system; PWBH—Circulation centrifugal pump by water from Bega channel through the PCWW evaporator; PWH—Axial pump for water circulation in heating system; VCVC—Fan coils ceiling unit; VCVF—Fan coils floor unit; PCWW—Water–water heat pump; TEM1,2,3—thermal energy meter.
The proposed hybrid system was designed to provide the necessary heat and cold in the laboratory, considering the climatic characteristics of the city of Timisoara in Romania (temperatures, radiation, humidity) and the hydrological characteristics (flow, temperature) of the Bega channel.
The building is naturally ventilated through two 125 mm diameter grilles, which is why the comfort temperature is directly dependent on the outside air temperature, varying within wide limits. For the laboratory building, the indoor comfort temperature (for ambient category III) varies, according to national regulations, between 19 °C (winter) and 27 °C (summer) [25,26]. The thermal comfort felt by the laboratory occupants (students and teachers) was achieved through the operative temperature Top, which was calculated and evaluated using the following relationship (1) [27]:
where
- To—outdoor temperature, in °C.
The operative temperature, calculated based on the outdoor temperature, falls within the values recommended by the technical regulations valid in Romania, for both the heating and cooling seasons.
The heat requirement was determined using the Radia 3 calculation program [28], and for the cooling requirement, CoolPack Version 1.49 [29] was used, the calculations being based on the regulations and standards in force for Romania [22,23,24,25], in order to ensure thermal comfort in the building. The calculated outdoor temperature corresponds to climate zone II (−15 °C) [22,23,25]. For the two seasons analyzed, winter and summer, the variation in the outdoor air temperature is presented in Figure 4.
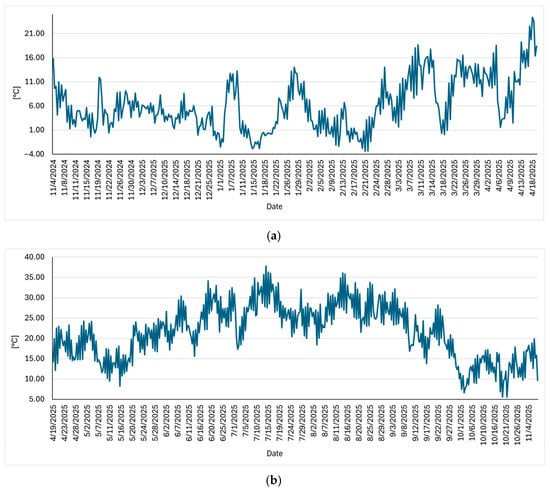
Figure 4.
Outdoor temperature in Timisoara: (a) 4 November 2024–18 April 2025; (b) 19 April 2025–4 November 2025.
The internal calculation parameters (temperature and relative humidity of the indoor air) were considered, depending on the purpose of the building, i.e., the ambient category considered for spaces where teaching and laboratory-type research activities are carried out (ambient category III—moderately acceptable level, recommended in existing buildings) and the indoor air quality category (IDA 3) [25].
The calculated indoor temperature for laboratory spaces was set at 19 °C [23]. The calculations resulted in a requirement of 5.99 kW for space heating and 2.03 kW for cooling [21].
2.2. Estimation of the Thermal Potential of the Bega Channel
The water from the Bega channel, as the heat source of the analyzed hybrid system (heating and cooling), was chosen based on the estimation of thermal potential. The variation in the water temperature in the channel during the analysis period, 4 November 2024–12 September 2025, is presented in Figure 5.
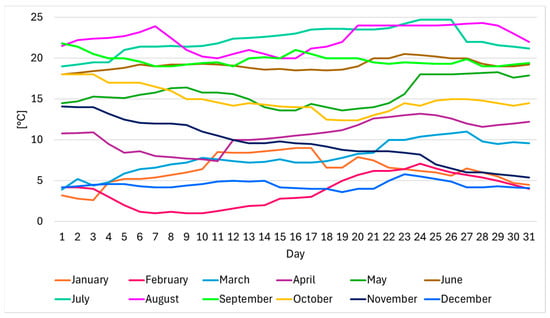
Figure 5.
Water temperature in the Bega channel recorded in 2025.
To determine the amount of thermal energy available from the Bega channel water, the amount that can be taken without exceeding the temperature limits allowed for discharge, the following relationship was used (2) [30]:
where
- QH—heat flux, in kWh;
- c—specific heat of water, in kJ/kg·°C;
- —water density at 10 °C, in kg/m3;
- —river/channel water flow, at 10 °C, in m3/s;
- —temperature difference, in·°C;
- —unit of time, in s.
Regarding the legislative framework about the capture of water flow from surface water sources, in Romania, the water law allows an uncertified use in installations of the type of hybrid system proposed, for a small water flow (less than 10 L/s), if it is returned and does not influence the quality of water resources [31]. For the operation of the proposed hybrid system for space heating, it is necessary to abstract a flow of 0.7 L/s and 0.33 L/s for cooling, respectively, but this water flow is not consumed but is returned in full to the Bega channel through an open circuit discharge. Since the water abstracted from the Bega channel circulates in the closed-circuit heating system, it is not contaminated and thus the discharged water does not influence the quality of the water in the Bega channel, being thermally loaded only within the allowed limits of maximum 35 °C [21,32]. So, in Romania, from a legislative point of view, this type of hybrid system can be installed.
2.3. Setting Heating and Cooling Seasons
In Romania, the heating season for district heating systems is established according to meteorological criteria that mainly refer to the outdoor temperature. In practice, the decision to supply the heating agent is made by the system operators according to the following rule: three consecutive nights (between 20:00 and 06:00) in which the average outdoor temperature drops below a certain threshold (in Timisoara, 10 °C) [33]. Therefore, although the heating season covers the period from 15 October to 15 April, it is established according to the actual climatic conditions that are specific for each year. Regarding individual systems (buildings not connected to the centralized heating system), as is the case of the building under analysis, the establishment of the moment of starting the heating system is decided by the building owners/administrators, depending on the thermal comfort requirements. Considering that the building is part of the category of educational buildings, the national regulations were taken into account to establish the period of the heating season [25,26]. These regulations [23,25,26] establish the indoor temperatures for the heating and cooling seasons for laboratory spaces.
According to the regulations in force in Romania, different temperatures were considered depending on the ambient category [22,23,25]:
- -
- for space heating, the minimum comfort temperature is 21.0 °C for ambient category I, 20.0 °C for ambient category II, and 19.0 °C for category III [25];
- -
- for space cooling, the maximum operating comfort temperature is different depending on the ambient category, namely 25.5 °C for ambient category I, 26.0 °C for ambient category II, and 27.0 °C for category III [25].
Thus, for the proposed system, it was considered that light teaching activities are carried out in the laboratory, with a value of 1.6 met (Table 1) [25], falling into ambient category III.

Table 1.
Heat release for a person [25].
Ambient category III was considered because, in these spaces, the people (students and teachers) who carry out activities do not require special conditions, and, as a thermal resistance for clothing, it was considered for summer—0.5 clo and for winter—1.0 clo [34]. For ambient category III, the operative comfort temperatures are centralized in Table 2 [25].
Table 2.
Comfort operating temperatures [25].
Throughout the experimental tests inside the laboratory, the relative air humidity was approximately 40% during the heating period and 60% during the cooling period.
Practically, for the case study, the following evaluation seasons were considered:
- -
- heating season: 4 November 2024–21 March 2025;
- -
- off-season: 22 March 2025–18 April 2025;
- -
- free cooling season: 19 April 2025–12 July 2025;
- -
- cooling season with water-to-water heat pump: 12 July 2025–12 September 2025;
- -
- off-season: 13 September 2025–4 November 2025.
For the analyzed installation, it can be observed that, out of the total number of days during a year (365 days), only 79 days are in off-season periods, when the heating and cooling installations are not operating, i.e., a percentage of 21.6%. Practically the majority of heating/cooling installations, in a percentage of 78.4% of the period of one year, operate, respectively, with thermal energy consumption from centralized or individual systems and electricity predominantly from the national energy system (NES).
In this article, the water-to-water heat pump cooling season (13 July 2025–12 September 2025) was not analyzed because it is part of research that will be integrated into the doctoral thesis of one of the authors. These studies will be published in the near future.
2.4. Evaluation of Solar Photovoltaic Potential
Considering the importance and necessity of integrating renewable energy into the installation systems and the fact that the area where the building is located benefits from approximately 54 sunny days and 270 partly sunny days per year, the analyzed hybrid system integrates a photovoltaic system [35]. To decide the capacity of the photovoltaic system, the authors evaluated the solar potential of the area, primarily by analyzing the solar irradiation using the PVGIS and Polysun simulation programs, data that were subsequently verified by experimental measurements (Figure 6) performed with an acquisition station equipped with a SOZ-03 radiation sensor.

Figure 6.
Solar irradiation for the analyzed location: (a) 4 November 2024–18 April 2025; (b) 19 April 2025–4 November 2025.
The performance of the proposed photovoltaic system was compared with two softwares, namely, PVGIS (https://joint-research-centre.ec.europa.eu/photovoltaic-geographical-information-system-pvgis_en, accessed on 17 January 2026) and Polysun (https://www.velasolaris.com/en/, accessed on 17 January 2026). Both programs provide hourly, daily, or monthly information about solar radiation and energy production. In addition, Polysun provides information on the estimated electricity consumption of the analyzed building, the reduction in CO2 emissions, and the possibility of choosing the model of photovoltaic panels, inverters, and storage batteries.
Basically, PVGIS only provides information on the potential of the area, while Polysun also provides information on the performance of the established photovoltaic system [36]. PVGIS uses the globally available ERA5 database [37], while Polysun uses the Google Maps database as geographic data for orientation and shading, and the Meteonorm database for solar irradiation [38].
The existing photovoltaic system ensures the electricity consumption of the PWBC centrifugal pump and a small contribution during the cold season for powering the heat pump. For the electricity supply of the proposed hybrid system, the possibility of supplementing the photovoltaic system was analyzed/studied. Thus, 8 more monocrystalline photovoltaic panels of 455 Wp were added, which required the resizing of the inverter, choosing a HUAWEI inverter with a maximum efficiency of 97.8% and a power of 6 kW. For the current photovoltaic system, the option with electrical energy storage in 2 lithium-ion batteries was chosen with a charge/discharge efficiency of 93% and a capacity of 6 kWh each.
The existing PV system was analyzed comparatively between the PVGIS and Polysun software, from the point of view of energy production estimation. From the comparison of the simulated energy production data with the two softwares, with the real energy production recorded by the system, it can be stated that the estimation with Polysun is closer to reality regarding the analyzed location [15]. For this reason, the estimation of energy production for the photovoltaic system integrated in the hybrid system presented in this article is performed with the Polysun software [39].
2.5. Presentation of the Analyzed Hybrid System
The coupling of two individual systems that initially operated and were analyzed separately for space heating (Figure 7) and space cooling (Figure 8) [21] led to the development of the hybrid system presented in this paper (Figure 9). In practice, the integration of the two individual systems into the analyzed hybrid system involves reconfiguration by modifying the routes, integrating thermal energy consumption recording equipment, automating the hybrid system, and resizing the PV system.

Figure 7.
Functional diagram of the individual heating system (Initial). To—Outside air temperature; Ti—Indoor air temperature; T1—Evaporator inlet temperature; T2—Evaporator outlet temperature; T3—Condenser outlet temperature; T4—Condenser inlet temperature; Hi—Indoor air humidity; FM1—Flowmeter water source; FM2—Heating water flow meter; PWBH—Circulation centrifugal pump by water from Bega channel through the PCWW evaporator; PWH—Axial pump for water circulation in heating system; VCVH—Heating fan coil; PCWW—Water–water heat pump.
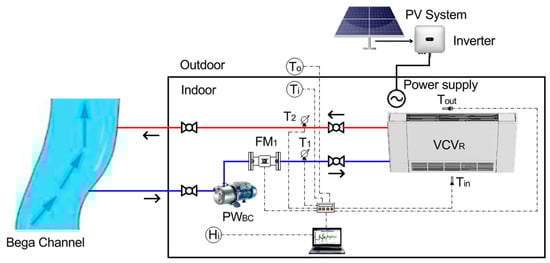
Figure 8.
Functional diagram of the individual free cooling system (Initial). To—Outside air temperature; Ti—Indoor air temperature; T1—Fan coil supply temperature; T2—Fan coil return temperature; Tin—Fan coil inlet air temperature; Tout—Fan coil outlet air temperature; Hi—Indoor air humidity; FM1—Flowmeter water source; PWBC Centrifugal pump for water circulation from Bega channel for free cooling system; VCVR—Cooling fan coil.

Figure 9.
Proposed hybrid system. (a) Functional diagram; (b) Laboratory image. To—Outside air temperature; Ti—Indoor air temperature; T1—Evaporator inlet temperature; T2—Evaporator outlet temperature; T3—Condenser outlet temperature; T4—Condenser inlet temperature; T5—Inlet water temperature; T6—Outlet water temperature; Hi—Indoor air humidity; FM1—Evaporator inlet flowmeter; FM2—Condenser outlet flowmeter; FM3—Free cooling water source flow meter; PWBC—Centrifugal pump for water circulation from Bega channel for free cooling system; PWBH—Circulation centrifugal pump by water from Bega channel through the PCWW evaporator; PWH—Axial pump for water circulation in heating system; VCVF—Fan coils floor unit; VCVC—Fan coils ceiling unit; PCWW—Water–water heat pump; TEM1,2,3—thermal energy meter; EM1,2,3—electricity meter; Tout—Fan coil outlet air temperature.
The hybrid system (Figure 9) proposed by the authors aimed to reduce the percentage by 78.4% by installing photovoltaic systems with storage and reducing the impact on the ozone layer by not using classic cooling systems (systems that use freons), adopting free cooling.
During the summer period, the automation is set to cooling mode, at which time the PWBC pump is activated, which circulates the water captured from the Bega channel through the VCVC cooling installation. However, by manipulating the shut-off valves, the three VCVF fan coils can also be supplied with water from Bega for periods with very high outdoor temperatures. An ultrasonic flow meter (FM3) was also installed on the discharge of the PWBC pump, which records the flow rate circulated through VCVC. Two temperature sensors T5 and T6 were installed on the supply and return of the hybrid system, which record the temperature of the water in Bega before and after leaving VCVC. Temperature sensors were also installed to record the temperature of the outdoor air (To), the indoor air (Ti), and the air discharged by VCVC after it was cooled (Tout). A thermal energy meter (TEM1) was installed on the outlet of VCVC to record the energy taken up by the cooling agent (water from Bega). The electrical energy consumed by the PWBC pump was recorded using the EM3 electricity meter.
During the winter period, the automation switches from cooling mode to heating mode and starts the PWBH pump, which circulates the water captured from the Bega channel through the evaporator of the PCWW water-to-water heat pump. Temperature sensors (T1 and T2) and a flow meter (FM1) were installed on the evaporator circuits, which record the flow rate of the circulated water. The TEM1 energy meter was installed on the evaporator inlet to record the amount of energy extracted by PCWW from the water captured from the Bega channel. At the outlet of the PCWW heat pump condenser, the PWH pump is installed, which ensures the circulation of the heating medium (hot water) through the three VCVF. Temperature sensors are installed on the inlet and outlet of the condenser, which monitor the parameters of the heating medium (T3 and T4). A flow meter (FM2) was installed on the condenser outlet to record the flow rate of the heat carrier and a thermal energy meter (TEM3) to record the amount of heat released by the VCVF heating elements. The electrical energy consumed by the two pumps PWBH and PWH is recorded by the energy meters EM1 and EM2.
The data acquisition system used is of the IO-LINK type, managed by the MONEO software [40]. The transformation of the collected data from the sensors into useful information for formulating the results was based on the processing of raw data. The raw data were collected with the of TASU8020 type sensors (To, Ti, Tout and T1–T6) and FM1–FM3 ultrasonic flowmeters. The raw data collection was carried out with an AL1112 master acquisition board with integrated Ethernet/IP interface that ensures their transmission with an Ethernet cable to a computer for data storage. The collected data were exported in graphical form.
3. Results and Discussion
In the results and discussion section, the relevant data obtained experimentally by monitoring the parameters, as a result of the operation of the hybrid system that ensures the heating and cooling of the building, are presented and discussed. The analysis of the obtained results focuses on the evaluation of the thermal and photovoltaic potential on which the operation of the evaluated hybrid system can be based, highlighting the degree of energy independence and the decarbonization rate obtained.
3.1. Evaluation of the Thermal Potential of the Water of the Bega Channel in Timisoara
The evaluation of the amount of thermal energy available to the Bega channel was carried out by analytical calculation using relationship (2) and validated by experimental measurements carried out throughout the year using the TEM2 thermal energy meter. Thus, for an average flow of 17 m3/s, based on calculation relationship (2), the thermal potential of the Bega channel was evaluated at approximately 85 MWh (experimental validated quantity).
Considering that, to cover a heat requirement of 5.99 kW, it is necessary to transport a flow rate of 0.7 L/s, this means that, at the average flow rate of 17 m3/s available in the Bega channel, theoretically, approximately 24,286 apartments with an average surface area of 50 m2 could be supplied (which can be homes classified in comfort categories I, II, or III, depending on the configuration), which represents a number of 1214 collective residential buildings with a height regime of GF + four floors, with four apartments per level. The calculated data are valid for ensuring an indoor temperature of at least 20.5 °C.
To cover a cooling requirement of 2.03 kW, it is necessary to transport a flow rate of 0.33 L/s, which means that, at the average flow rate of 17 m3/s available in the Bega channel, theoretically, approximately 51,515 apartments with an average surface area of 50 m2 could be supplied (which can be homes classified in comfort categories I, II, or III, depending on the configuration), which represents a number of 2576 collective residential buildings with a height regime of GF + four floors, with four apartments per level. The calculated data are valid for ensuring an indoor temperature of maximum 27 °C.
3.2. Evaluation of the Photovoltaic Potential of the Area Where the Building Is Located
The amount of locally available solar energy is an important condition for sizing solar photovoltaic systems. The estimated monthly energy production of the new proposed fixed-angle photovoltaic system and the monthly in-plane irradiation for the fixed angle are presented in Figure 10 compared to the previous system, and Figure 11 shows the electricity production and sources for the proposed system. The graphical representations were obtained using data generated by Polysun software [39].

Figure 10.
Electricity production of the photovoltaic system—comparing proposed PV system vs. existing PV system.
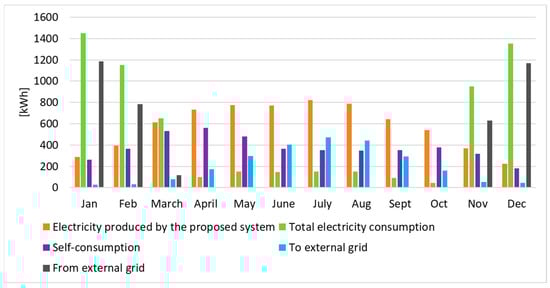
Figure 11.
Comparative analysis of PV system between electricity production and consumption.
In Figure 10, the monthly energy production of the newly proposed photovoltaic system also includes the production generated by the previously installed system. The considerable difference between the electricity production of the proposed photovoltaic system is due to the fact that the eight proposed panels have higher power (the system was expanded from 2.48 kW to 6.12 kW) and the location on the land adjacent to the laboratory is at an angle of 15 degrees (compared to the eight panels previously installed on the facade of the laboratory—at 80 degrees).
In Figure 11, it is observed that, in the cooling season (April–September), the electricity consumption of the analyzed hybrid system is supplied entirely from the proposed PV system, and, in the heating season, the coverage from the PV system is low (maximum 82.0%—March and minimum 13.5%—December). For this period of the year, the hybrid system is supplied with electricity mainly from the national energy system (NES). Also, self-consumption vs. export/import can be appreciated. Except for the months of November and March, it is observed that the hybrid system does not consume electricity from the NES.
The analysis of the monthly solar contribution under the conditions of an electricity consumption during the heating season of 5.6 MWh and of 0.8 MWh during the cooling season demonstrates the capacity of the PV system to satisfy the electricity consumption of the building in proportion to 100% during the summer (with a surplus of 2.07 MWh), and in winter it can contribute in proportion to 43.43%.
On the other hand, if the surplus electricity of 2.07 MWh could be used with a compensation degree of 0.7 to 1 (economically viable), then the electricity consumption of the building during the winter could be covered in proportion to 69.42%.
In Figure 12, the reduction in CO2 emissions is represented, comparing the proposed and the existing PV system. From the monthly representation of CO2 emissions for PV systems (previously and newly proposed), it is observed that the emission reduction for the proposed system is approximately two times higher for the heating season and approximately five times higher for the heating season.
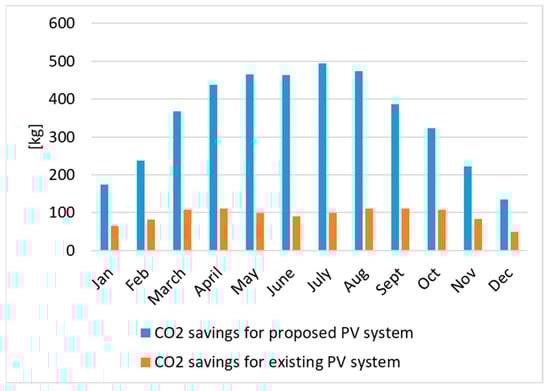
Figure 12.
Comparative analysis between CO2 emissions of existing and proposed PV systems.
This difference is mainly due to the fact that the proposed PV system is a system with storage that allows the use of solar energy also during the night, thus replacing the need for electricity consumption from the NES for which the amounts of CO2 are higher (SEN also produces electricity using fossil fuels). Thus, during the heating season, a reduction of 1.13 t CO2 was obtained, and, during the cooling season, there is a reduction of 2.7 t and, in the off-season, of 0.34 t, resulting in an annual CO2 reduction of 4.17 t/year.
Assuming that natural gas is predominantly used for heating buildings in Romania, the reduction of 1.13 tons of CO2 achieved by the hybrid system may be equivalent to an electricity consumption of 5.5 MWh. Regarding the cooling of buildings, in Romania, electricity is predominantly used, and the reduction of 2.7 tons of CO2 may be equivalent to an electricity consumption of 10.18 MWh. The amount of CO2 emitted by SEN to produce electricity varies depending on the energy mix (coal, gas, nuclear, hydro, wind, solar) and is assessed by the specific emission factor of 265 kg/MWh, and, for natural gas, a specific emission factor of 205 kg/MWh was considered [41]. From the point of view of heating the laboratory with a water-to-water heat pump system, the reduction of 1.13 tons of CO2 achieved by the system implies a decarbonization degree of 81.4%. Regarding the cooling of the laboratory, for which free cooling was predominantly used, the reduction of 2.7 tons of CO2 implies a decarbonization degree of 100%.
3.3. Evaluation of the Operation of the Hybrid System in the Heating and Cooling Seasons
For the heating season, the analyzed hybrid system (Figure 9) ensured the indoor temperature by means of three fan coils (3 × 1.9 kW) which are supported by the 10 kW water–water heat pump and input from the photovoltaic system with a total installed power of 6.12 kW. For the cooling period (considering a maximum temperature of 27 °C), free cooling was used, in open circuit, supported by a variable speed centrifugal pump, with a power of 80 W which sucks the water from the Bega channel and circulates it through the 3 VCVF and an VCVC, after which it discharges it back into the channel. On days when the indoor temperature could not be ensured by free cooling, no measures were taken to reduce the indoor temperature, firstly because the aim was to record the real indoor temperature obtained only by free cooling, and secondly, indoor comfort conditions were not necessary because, during this period, no teaching activities were carried out, as it is a holiday period (21–23 July, 12–31 August and 1–8 September). Measures to reduce the indoor temperature that would ensure an increase in the degree of decarbonization of the cooling system while maintaining comfort conditions will be the subject of further research which integrates heat pumps.
For the summer season, the solar irradiation (Figure 6) benefits the provision of electricity to the cooling system from the photovoltaic system. The measurements were carried out for the entire analyzed period (4 November 2024–12 July 2025) using a data acquisition system consisting of sensors and equipment for monitoring and tracking the behavior of the heating/cooling installations. The energy consumption to ensure comfort conditions inside the building in summer/winter varied depending on the external temperature, the solar input, and the water temperature in the Bega channel.
3.3.1. Operation the Hybrid System in the Heating Season
The monthly variation in data recorded with the hybrid system operating in heating mode is presented in Figure 13. Referring to the graphical representations in Figure 13, it is observed that, for the heating season, the indoor temperature recorded values in the range (19.74–28.53) °C, with the maximums being recorded in February of 2025.


Figure 13.
The monthly variation in data recorded with the system operating in heating mode: (a) November; (b) December; (c) January; (d) February; (e) March.
In February, the flow/return temperature of the PCWW heat pump condenser changes from 40/35 °C to 45/40 °C, maintaining the low temperature regime. For this reason, and because there are no systems for storing the excess thermal energy produced by the PCWW heat pump, these variations in condenser temperatures occur. As the flow temperature increases, the ambient temperature also increases, but, due to the low thermal inertia of the heating elements, the indoor temperature decreases depending on the outdoor temperature.
From a climatic point of view, the locality of Timisoara, where the building under analysis is located, is located in the temperate–continental transitional zone with outdoor temperatures in the heating season between −3 °C and −5 °C, with extreme values of −38.5 °C, at Bod on January 25, 1942 (Brașov County). The maximum and minimum records for the locality of Timisoara were recorded in the interval 1961–1990 and are presented in Figure 14 [42]. Practically, since 1990, no extreme values have been recorded, and the average temperature per country of 11.6 °C was 2.0 °C higher than the median of the standard reference interval (1991–2020), which can be seen from the monthly variation presented in Figure 15 [43].

Figure 14.
Climate data for Timisoara (1961–1990) with extreme temperature [42].
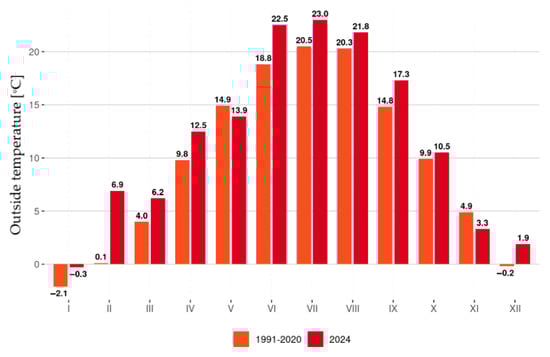
Figure 15.
Evolution of the average monthly temperature, average per country, in Romania, in 2024, compared to the median of the standard reference interval (1991−2020) [43].
According to the calculation of outdoor temperature for determining the heat requirement, the outdoor temperature is considered, for the locality of Timisoara, at the value of −15 °C [22]. From the analysis of Figure 13, it is observed that the outdoor temperature, during the cold season, is in the range (−6.06 and 21.68) °C. According to the data in Figure 13, the values from the regulations in force in Romania and the experimentally measured data, it can be concluded that a reassessment of the calculation of outdoor temperature is necessary for the localities in the western area of Romania. Practically, starting from 2014 and until 2024, there was a continuous increase in the average outdoor temperature in Romania (Figure 15).
Even though an indoor temperature of 19 °C was considered sufficient for teaching and research activities [22,25], higher temperatures were recorded for the monthly operation of the hybrid system in order to evaluate the maximum amount of energy that the water-to-water heat pump system can produce using the water from the Bega channel as a heat source. In practice, the PCWW heat pump was set to stop when the indoor temperature reached 30 °C, throughout the heating season. Thus, a surplus of thermal energy was recorded that was able to increase the indoor air temperature from 1 °C to 9 °C above the recommended temperature (19 °C), depending on the variation in the outdoor temperature (between −5 °C and 7.8 °C).
The temperature recorded at the inlet/outlet of the evaporator varies depending on the water temperature in the Bega channel, as follows:
- -
- (10.21–15.35) °C/(9.36–15.00) °C—from 4 November;
- -
- (8.70–11.10) °C/(7.48–10.60) °C—December;
- -
- (6.50–9.18) °C/(5.42–8.60) °C—January;
- -
- (5.59–8.50) °C(4.43–7.40) °C—February;
- -
- (6.91–11.10) °C(6.31–10.50) °C—until 23 March.
From the point of view of the variation in the temperature recorded at the inlet and outlet of the condenser, it is observed that the values record a difference of approximately 3 °C.
The temperature recorded at the inlet/outlet of the condenser varies as follows:
- -
- (33.46–36.96) °C/(34.74–40.08) °C—from 4 November;
- -
- (32.51–36.74) °C/(37.30–41.44) °C—December;
- -
- (30.96–37.75) °C/(35.86–44.84) °C—January;
- -
- (30.31–37.40) °C/(36.05–44.57) °C—February;
- -
- (35.50–36.70) °C/(39.50–40.20) °C—until 23 March.
An important parameter for evaluating the operation of the hybrid system in heating mode is the water flow captured from the Bega channel and circulated through the PCWW evaporator. Thus, Figure 13 shows the flows circulated through the evaporator and the PCWW condenser, respectively.
Practically, the flow circulated through the evaporator, in open circuit, varied between (30–50) L/min. The flow variation was carried out to evaluate whether the variation in the water flow influences the efficiency of the PCWW. Practically, it is known that circulating a lower flow leads to a lower electricity consumption of the PWBH pump. From the evaluation of the electricity consumption of the PWBH pump, it was found that the flow variation within ±10 L/min from the value of 40 L/min considered as the reference value does not negatively influence the efficiency of the PCWW. In conclusion, the flow of the circulation pump can be reduced to reduce the electricity consumption of the PWBH pump.
From the point of view of the water flow rate circulated through the condenser, in a closed circuit, it can be seen from Figure 11 that it is approximately constant, with small differences depending on the speed stages of the PWH pump, namely, ≈7 L/min—stage I, ≈9 L/min—stage II, and ≈14 L/min—stage III.
3.3.2. Operation of the Hybrid System in the Cooling Season
The monthly variation in data recorded with the hybrid system operating in cooling mode (19 April–12 July) is presented in Figure 16. Referring to the graphical representations in Figure 16, it is observed that, for the cooling season, the indoor temperature recorded values in the range (18.16–22.71) °C in April and (18.16–24.21) °C in May.


Figure 16.
The monthly variation in data recorded with the system operating in cooling mode: (a) from 19 April; (b) May; (c) June; (d) to 12 July.
Since in the first three days of June, outdoor temperatures above 27 °C (the maximum temperature considered for the indoor temperature in the laboratory) were recorded, the free cooling system was stopped to verify the increase in the indoor temperature. During this period, increases in the indoor temperature were recorded between (29.43–31.08) °C. Starting on 4 June, the PWBC pump of the free cooling system was started and the indoor temperature stabilized in the range (21.76–25.74) °C. The free cooling system operated efficiently until 5 July, when the indoor temperature reached 24.31 °C, by circulating a water flow from the Bega channel of 14 L/min. In practice, the free cooling system operated, using more increased water flows, until 12 July, when a temperature of 27.32 °C was recorded inside the laboratory. From this moment, due to the heating of the water in the Bega channel above 23.00 °C, the free cooling system became ineffective due to the inability to ensure the maximum accepted temperature inside the laboratory (27.00 °C). Practically, during the period 5–12 July, the free cooling period was extended by increasing the water flow rate circulated by the PWBC pump from 14 L/min to 23 L/min and subsequently to 27 L/min. For the first interval of increasing the flow rate by 9 L/min, for 6 days (5–11 July), an indoor temperature of maximum 26.5 °C was obtained, and, for the next interval with an increase in the flow rate of another 4 L/min, for 1 day (12 July), it was possible to maintain the indoor temperature at maximum 27 °C for almost the entire day. The last data record on 12 July indicated a temperature of 27.32 °C. During these 7 days (5–11 July), the outside air temperature was in the range (19.05–37.47) °C, and the water temperature in the Bega channel was in the range (21.30–22.58) °C. Starting from 13 July, in order to maintain the temperature inside the laboratory below 27.00 °C, it was necessary to use a different type of cooling system.
In terms of outdoor temperatures during the cooling season, the available information shows that the values range between 22 °C and 24 °C, with extremes of +44.5 °C recorded on 10 August 1951, in Ion Sion (Braila County) [42]. For the period 1961–1990, Figure 14 presents the highest temperature values recorded in each month. Thus, it is observed that, in this interval, the extreme maximum of 41 °C was recorded in August, followed by July (39.6 °C) and September (39.7 °C), which are approximately identical. Regarding the period of operation of the hybrid system in “free cooling” mode (19 April–12 July from year 2025), it can be seen that the hottest month is July with a maximum of 39.78 °C, followed by August with a maximum of 38.22 °C and June with 37.22 °C. Specifically, the months in which maximum temperatures are recorded have shifted by one month towards the spring season. From the analysis of Figure 14, it is found that the external temperature and, implicitly, the water temperature in the Bega channel represent determining factors in the efficient operation of the hybrid system analyzed in the “free cooling” operating mode.
The water temperature difference between the inlet and outlet of the VCVC, when the hybrid system operates in “free cooling” mode, is ≈1.20 °C in April, ≈1.00 °C in May, ≈0.80 °C in June, and ≈0.50 °C in July, which indicates the need to adopt another type of cooling system to maintain the temperature inside the laboratory space at a maximum of 27.00 °C.
The measurements were carried out for the entire analyzed period (4 November 2024–12 July 2025) using a data acquisition system consisting of sensors and equipment for monitoring and tracking the behavior of heating/cooling installations.
The assessment of the building’s energy independence was carried out by considering the actual operation of the hybrid system for the period 4 November 2024–12 July 2025 and the theoretical operation achieved by extrapolating the results for the hybrid system in “free cooling” mode after 12 July 2025 until 12 September 2025, even if a maximum temperature of 27.00 °C was not ensured inside. For this period, the authors considered the operation of a heat pump cooling system that would bring the indoor temperature below 27.00 °C an approach that will be the subject of immediate research.
4. Conclusions
The effects of climate change on buildings are quantified by increased indoor air temperatures, which mainly, in the hot season, are due to successive waves of high outdoor temperatures. This leads to the degradation of comfort level in buildings, and to an increase in mortality rates among the population that cannot afford to heat/cool their homes to an adequate temperature level. The lack of facilities (the installations in buildings) that ensure the maintenance of a comfortable temperature in buildings is quantified through an indirect indicator of energy poverty.
The conclusions formulated in this section summarize the main advantages of implementing the proposed hybrid system for heating and cooling the “Energy Conversion and Storage” laboratory building that uses the thermal potential of the water in the Bega channel as a primary energy source, and a photovoltaic system as a source of electricity production, supported by the national energy system. The article aims to draw attention to the thermal potential of surface waters, both for heating and cooling buildings located in the vicinity of watercourses. We believe that the reasons why this system is not implemented can be attributed to the lack of experimental research to validate such a solution. The choice of equipment that took into account the quality of surface water made it possible to exploit the thermal potential of the Bega channel. On the other hand, the free cooling concept considered the temporary non-use, as much as possible, of systems that use refrigerants (freons) and equipment with high maintenance costs. Thus, maintenance and energy consumption are reduced to a centrifugal pump PWBC (made of recyclable materials), reducing the risk of pollution in the manufacturing, operation, and maintenance flow.
The analysis of the operation of the hybrid system in the two real operating modes (“heating” mode and “free cooling” mode) during 4 November 2024–12 July 2025 and the extrapolation of the results obtained in 13 July 2025–12 September 2025 showed that an energy independence of approximately 90.70% can be achieved, for which the amount of CO2 was reduced by 4.17 t/year, thus contributing to the decarbonization of the heating/cooling systems related to the laboratory building in a percentage of 81.4% for the heating season and 100% for the cooling season. The energy independence achieved during the summer is due to the fact that the electrical energy required to power the PWBC pump, which supplies the cooling system, is provided by the PV system. Practically, for free cooling, an average SCOP of 4.13 was calculated, and, for the heating period with a water-to-water heat pump, an average SCOP of 2.32 was calculated.
In light of all of the above, the analysis carried out in this study can contribute to adaptation measures of the built environment to prepare them to combat climate change, by addressing heating/cooling systems with high degrees of decarbonization. Heating/cooling systems that use surface water as a primary heat source (considered a RES) and that are adapted to the climate conditions corresponding to a transitional temperate–continental climate, as is the case of Timisoara, where the “Energy Conversion and Storage” laboratory building is located, were identified and analyzed. The study will continue by further exploring the optimization of installation systems to increase the degree of decarbonization and the degree of energy independence that would contribute to the sustainable adaptation of new or existing buildings (especially in urban environments) to climate change conditions. We intend to expand the research area by purchasing and integrating an air-to-water heat pump for a comparative study that will also include a cost–benefit analysis. Also, in order to enrich the specialized literature, which can support the sustainable adaptation of new or existing buildings, research is still needed that addresses similar measures (heating/cooling systems) conveyed in the context of climate diversity, available energy resources, and buildings typology.
Author Contributions
Conceptualization, A.T. and D.M.; methodology, A.T., D.M., D.T. and D.B.; software, D.M. and D.T.; validation, A.T., D.M., D.T. and D.B.; formal analysis, A.T., D.M., D.T. and D.B.; investigation, A.T., D.M., D.T. and D.B.; resources, D.T.; data curation, D.M., D.T. and D.B.; writing—original draft preparation, A.T.; writing—review and editing, A.T. and D.M.; visualization, A.T., D.M., D.T. and D.B.; supervision, A.T. All authors have read and agreed to the published version of the manuscript.
Funding
This research received no external funding.
Data Availability Statement
The datasets presented in this article are not readily available because the data are part of an on-going study. Requests to access the datasets should be directed to author Adriana Tokar.
Acknowledgments
The authors acknowledge the administrative support given by University Politehnica Timisoara and donations in kind (equipment and sensors) offered by the companies BRB Serv, Termocasa, and Romstal. The authors have reviewed and edited the output and take full responsibility for the content of this publication.
Conflicts of Interest
The authors declare no conflicts of interest.
Abbreviations
The following abbreviations are used in this manuscript:
| EM | Electricity meter |
| FM | Flowmeter |
| PC | Heat pump |
| PW | Circulation pump |
| PV | Photovoltaic system |
| TEM | Thermal energy meter |
| VCV | Fan coil |
References
- Qi, T.; He, C.; Ren, Q.; Fang, Z. Climate change will make increasing people less comfortable: Insights from the weather preference index. J. Environ. Manag. 2025, 393, 126949. [Google Scholar] [CrossRef] [PubMed]
- European Environment Agency (EEA). Cooling Buildings Sustainably in Europe: Exploring the Links Between Climate Change Mitigation and Adaptation, and Their Social Impacts; Briefing EEA no. 20; European Environment Agency: Copenhagen, Denmark, 2022; ISBN 978-92-9480-511-9. [Google Scholar] [CrossRef]
- Aebischer, B.; George Henderson, G.; Jakob, M.; Catenazzi, G. Impact of climate change on thermal comfort, heating and cooling energy demand in Europe. In Saving Energy—JUST Do It! ECEEE: Zurich, Germany, 2007; pp. 859–870. [Google Scholar]
- Marco, M.; Ramezani, A.; Buoite Stella, A.; Pezzi, A. Climate Change and Building Renovation: Effects on Energy Consumption and Internal Comfort in a Social Housing Building in Northern Italy. Sustainability 2023, 15, 5931. [Google Scholar] [CrossRef]
- Saifudeen, A.; Mani, M. Adaptation of buildings to climate change: An overview. Front. Built Environ. 2024, 10, 1327747. [Google Scholar] [CrossRef]
- World Health Organization (WHO). Heat and Health in the WHO European Region: Updated Evidence for Effective Prevention; WHO Regional Office for Europe: Copenhagen, Denmark, 2021; ISBN 978 92 890 5540 6. Available online: https://iris.who.int/server/api/core/bitstreams/7193ff44-7a24-46b3-a3bd-b0edfd40e81c/content (accessed on 9 December 2025).
- Tufă, L. The quality of housing in Romania. Between precarious improvement and the maintenance of social inequalities in access to decent housing. Qual. Life 2019, 30, 226–239. [Google Scholar]
- Official Journal of the European Union. Directive (EU) 2024/1275 of the European Parliament and of the Council, 24 April 2024; Official Journal of the European Union: Luxembourg, 2024. [Google Scholar]
- Kurz, D.; Dobrzycki, A.; Krawczak, E.; Jajczyk, J.; Mielczarek, J.; Woźniak, W.; Sąsiadek, M.; Orynycz, O.; Tucki, K.; Badzińska, E. An Analysis of the Increase in Energy Efficiency of Photovoltaic Installations by Using Bifacial Modules. Energies 2025, 18, 1296. [Google Scholar] [CrossRef]
- Babaelahi, M.; Kazemi, A. Optimal energy system configuration for zero energy buildings using hybrid thermal-photovoltaic solar collector. Environ. Dev. Sustain. 2025, 27, 11047–11062. [Google Scholar] [CrossRef]
- Zhou, L.; Qi, F.; Yan, X. A review of research on the passive effect of building photovoltaic systems and analysis of influencing factors. Sol. Energy 2024, 278, 112766. [Google Scholar] [CrossRef]
- Ko, M.K.; Mon, E. An Investigation of the Temperature Effect on Solar Panel Efficiency Based on IoT Technology. Int. J. Trend Sci. Res. Dev. 2024, 8, 401–407. Available online: www.ijtsrd.com/papers/ijtsrd61354.pdf (accessed on 3 June 2025).
- Alaas, Z.M. The Effects of Temperature on Photovoltaic and Different Mitigation Techniques: A Review. IEEE Access 2024, 12, 180309–180327. [Google Scholar] [CrossRef]
- Alzarooni, M.; Olabi, A.G.; Mahmoud, M.; Alzubaidi, S.; Abdelkareem, M.A. Study on Improving the Energy Efficiency of a Building: Utilization of Daylight through Solar Film Sheets. Energies 2023, 16, 7370. [Google Scholar] [CrossRef]
- Tokar, D.; Tokar, A.; Muntean, D.; Bisorca, D.; Adam, M.; Pacurar, C. Validation of the electricity production, of a photovoltaic power station, through monitoring. In Proceedings of the Building Services and Energy Saving, Iasi, Romania, 11–12 July 2025. [Google Scholar]
- Tokar, A.; Tokar, D.; Stoian, F.; Muntean, D. Experimental Research on the Influence of Factors on the Electricity Production of Thin-Film Photovoltaic Panels. Hidraul. Mag. Mag. Hydraul. Pneum. Tribol. Ecol. Sensorics Mechatron. 2022, 1, 46–52. [Google Scholar]
- Ministry of Energy. Romania’s Energy Strategy 2025–2035, with a View to 2050. 2024. Available online: https://energie.gov.ro/wp-content/uploads/2024/12/Strategia-Energetica-a-Romaniei-2025-2035-cu-perspectiva-anului-2050.pdf (accessed on 10 December 2025).
- Google Maps. Available online: https://www.google.com/maps/@45.748359,21.2279332,451m/data=!3m1!1e3?entry=ttu&g_ep=EgoyMDI1MTIwOS4wIKXMDSoASAFQAw%3D%3D (accessed on 6 January 2026).
- Bega. Available online: https://en.wikipedia.org/wiki/Bega_(Tisza) (accessed on 17 December 2025).
- Panţu, H. Modernization of the Timiş—Bega Hydrotechnical System. Doctoral Dissertation, University Politehnica, Timisoara, Timisoara, Romania, 6 May 2009. [Google Scholar]
- Tokar, A.; Muntean, D.; Tokar, D.; Bisorca, D. Decarbonization of Heating and Cooling Systems of Buildings Located Nearby Surface Water Sources: Case Study. Energies 2024, 17, 3673. [Google Scholar] [CrossRef]
- Ministry of Development, Public Works and Administration. Methodology for Calculating the Energy Performance of Buildings, Reference Mc 001-2022; Part I, No. 46 bis/17.I.2023; Official Gazette of Romania: Bucharest, Romania, 2023.
- Ministry of Development, Public Works and Administration. Norm for the Design, Execution and Operation of Heating Installations I 13-2022; Part I, No. 108 bis/8.II.2023; Official Gazette of Romania: Bucharest, Romania, 2023.
- ISO/TC 163; Energy Performance of Buildings—Energy Needs for Heating and Cooling, Internal Temperatures and Sensible and Latent Heat Loads—Part 1: Calculation Procedures. International Organization for Standardization: Geneva, Switzerland, 2017.
- Ministry of Development, Public Works and Administration. Norm for the Design, Execution and Operation of Ventilation and Air Conditioning Installations, Indicative I5-2022; Part I, No. 108 bis/8.II.2023; Official Gazette of Romania: Bucharest, Romania, 2023.
- NP 010-2022; Normative on the Design, Construction and Operation of Buildings for Schools and High Schools Indicative. Ministry of Development, Public Works and Administration: Bucharest, Romania, 2022.
- Chelghoum, Z. Contribution a L’evaluation et L’amelioration des Performances Thermiques de L’habitat du Sud Algerien (Cas de Tamanrasset). Doctorat Dissertation, L’université Constantine 3, Constantine, Algeria, 2013. [Google Scholar]
- Thermal Calculation—Radia 3. Available online: https://docs.google.com/spreadsheets/d/1VkAHPZFsoI0TlhEFulK70NtlWM5YWfEU/edit#gid=1044508031 (accessed on 5 June 2024).
- CoolPack. Available online: https://www.ipu.dk/products/coolpack/ (accessed on 5 June 2024).
- Ptak, M.; Sojka, M.; Baloch, M.Y.J.; Amnuaylojaroen, T. Heat Resources of Rivers in the Odra River Basin as a Potential Element Implement for Sustainable Development in Poland. Resources 2025, 14, 184. [Google Scholar] [CrossRef]
- Water Law No. 107/1996. Available online: https://lege5.ro/Gratuit/ge3demru/legea-apelor-nr-107-1996 (accessed on 7 June 2024).
- Normative NTPA-001/2002 of February 28, 2002 (*Updated*) Regarding the Establishment of Pollutant Load Limits for Industrial and Urban Wastewater Upon Discharge Into Natural Receivers. Available online: https://legislatie.just.ro/Public/DetaliiDocumentAfis/98311 (accessed on 3 June 2024).
- Colterm Prepares the Start of the Heating Season in Timisoara. Available online: https://www.colterm.ro/ (accessed on 12 December 2025).
- Olesen, B.W. European Standardisation on Thermal Environment. In Book Measuring and Evaluating IEQ; Hogeling, J., Ed.; REHVA European HVAC Journal: İstanbul, Türkiye, 2024; Volume 61, pp. 9–11. [Google Scholar]
- Meteoblue. Available online: https://www.meteoblue.com (accessed on 18 December 2025).
- Axaopoulos, P.J.; Fylladitakis, E.D.; Gkarakis, K. Accuracy analysis of software for the estimation and planning of photovoltaic installations. Int. J. Energy Environ. Eng. 2014, 5, 71. [Google Scholar] [CrossRef]
- PVGIS-Photovoltaic Georgaphical Information System. Available online: https://re.jrc.ec.europa.eu/pvg_tools/en/tools.html (accessed on 7 June 2024).
- Witzig, A.; Stöckli, U.; Kistler, P.; Bornatico, R.; Pfeiffer, M. Polysun Inside: A Universal Platform for Commercial Software and Research Applications. In Proceedings of the EuroSun 2010, International Conference on Solar Heating, Cooling and Buildings, Graz, Austria, 28 September–1 October 2010. [Google Scholar] [CrossRef]
- Polysun SPT from Vela Solaris. Available online: https://www.velasolaris.com/en/products/polysun-spt/ (accessed on 23 March 2024).
- Tokar, D.M. Functional-Energetic Optimization of Systems for the Conversion and Storage of New Renewable Energies. Doctoral Dissertation, University Politehnica Timisoara, Timisoara, Romania, 28 July 2025. [Google Scholar]
- Ministry of Environment, Waters and Forests. Order no. 1,548 of September 7, 2021 Amending the Order of the Minister of Environment, Waters and Forests no. 2,057/2020 for the Approval of the Financing Guide for the Program on Increasing Energy Efficiency and Intelligent Energy Management in Public Buildings Intended for Educational Institutions; Official Gazette no. 868 of September 10, 2021; Official Gazette of Romania: Bucharest, Romania, 2021.
- Climate of Romania. Available online: https://en.wikipedia.org/wiki/Climate_of_Romania (accessed on 22 December 2025).
- Meteorological Characterization. 2024. Available online: https://www.meteoromania.ro/clim/caracterizare-anuala/cc_2024.html (accessed on 22 December 2025).
Disclaimer/Publisher’s Note: The statements, opinions and data contained in all publications are solely those of the individual author(s) and contributor(s) and not of MDPI and/or the editor(s). MDPI and/or the editor(s) disclaim responsibility for any injury to people or property resulting from any ideas, methods, instructions or products referred to in the content. |
© 2026 by the authors. Licensee MDPI, Basel, Switzerland. This article is an open access article distributed under the terms and conditions of the Creative Commons Attribution (CC BY) license.