Abstract
Tunnels have significantly expanded human activity spaces and alleviated urban congestion and environmental pollution on the surface. However, fires and associated smoke propagation in tunnels pose common and critical challenges in underground space utilization. Previous studies have primarily focused on smoke control under standard atmospheric conditions, emphasizing isolated parameters such as jet velocity or heat release rate (HRR), while overlooking key factors like environmental pressure and fire source proximity that influence smoke buoyancy and containment efficacy. One of the key problems remains unsolved: the comprehensive mechanisms governing transverse air curtain performance in variable-pressure and proximity scenarios. This study utilized Fire Dynamics Simulator (FDS6.7.1) software to conduct numerical simulations, aiming to elucidate the underlying incentives and explore the phenomena of smoke–thermal interactions. The analysis systematically evaluates the influence of four critical parameters: HRR (1–15 MW), fire-to-curtain distance (5–95 m), air curtain jet velocity (6–16 m/s), and ambient pressure (40–140 kPa). Results show that (1) jet velocity emerges as the dominant factor, with exponential enhancement in thermal containment efficiency at velocities above 10 m/s due to intensified shear forces; (2) escalating HRR weakens isolation, leading to disproportionate downstream temperature rises and diminished efficacy; (3) fire proximity within 10 m disrupts curtain integrity via high-momentum smoke impingement, amplifying thermal gradients; and (4) elevated ambient pressure dampens smoke buoyancy while augmenting air curtain momentum, yielding improved containment efficiency and reduced temperatures. This paper is helpful for the design and operation of thermal applications in underground infrastructures, providing predictive models for optimized smoke control systems. The contour maps reveal the field-distribution trends and highlight the significant influence of the air curtain and key governing parameters on the thermal field and smoke control performance. This work delivers pivotal theoretical and practical insights into the advanced design and optimization of aerodynamic smoke control systems in tunnel safety engineering
1. Introduction
In underground spaces, tunnels serve as critical infrastructure for transportation and connectivity between different functional areas [1,2,3,4]. With the increasing development of underground spaces in modern society, the construction of tunnel-like structures, such as underground utility corridors [5,6], hydropower station busbar tunnels [7,8], traffic tunnels [9,10], and underground passageways [11,12], has grown significantly. Tunnels have served as new areas for functional engineering applications including connections between thermal storage [13], biogas systems [14], wind turbines [15], solar power systems [16] and underground utilizations [17,18,19]. However, due to their length, enclosed environment, and narrow structure, tunnels pose significant challenges during fires. The large volume of smoke generated in fires is difficult to exhaust, and the high temperature and toxicity of smoke coupled with rapid fire spread, exacerbate rescue difficulties [20,21,22,23].
As a result, efficient smoke extraction and containment measures are crucial for ensuring the safety of individuals within tunnels and other underground spaces [24,25]. Currently, ventilation systems in tunnels primarily include longitudinal air flow systems [26], semi-transverse configurations [27], and fully transverse ventilation designs [28]. Longitudinal systems are characterized by fast airflow and extended smoke travel distances, making smoke dispersion difficult to control [29,30]. In contrast, semi-transverse and full-transverse ventilation systems struggle to effectively manage smoke during large-scale fires [31,32]. Consequently, efforts have been made to analyze tunnel fire smoke dynamics with air curtains, aiming to optimize ventilation efficiency [33,34,35,36,37,38,39,40].
For fundamental smoke behavior and corridor studies, Delichatsios et al. [41] investigated the flow behavior of fire smoke beneath beam-structured ceilings. They developed a mathematical model that captured how beam structures interfered with smoke movement. Their work provided insights into the dynamic characteristics of smoke flow, temperature distribution, and condensation phenomena in confined spaces. Building on this, Bailey et al. [42] integrated real fire tests with numerical simulations to examine smoke propagation patterns in corridors. Their efforts were proved to enhance the predictive capability of the Consolidated Model of Fire and Smoke Transport (CFAST) model for long corridor fires. Wang et al. [43] conducted experiments in tunnel fires to evaluate how varying blockage ratios and natural ventilation conditions affected smoke exhaust efficiency. It was revealed that higher blockage ratios reduced smoke exhaust efficiency and altered smoke layer stability. Complementing these findings, Kayili et al. [44] used 1:13 scaled model experiments to explore how blockage ratios and airflow velocity interacted to influence fire dynamics. Hu et al. [45] combined scaled experiments with FDS simulations to evaluate the effectiveness of jet air curtains in preventing smoke and CO spread in tunnels. They validated their models with experimental data and enhanced predictive tools for fire safety in long underground passages. Yang et al. [46] investigated, via small-scale experiments, the performance of air curtains under varying external wind speeds. They argued that adjustments in jet angles and velocities can mitigate smoke penetration beneath doors. Krajewski and Wegrzynski [47] further employed CFD to examine how air curtain velocity, jet inclination, and thermal stratification influence smoke containment. Upon their efforts, key design parameters were successfully identified. Yu et al. [48] expanded on this by assessing air curtains with different widths and jet angles in tunnel fires, quantitatively determining optimal configurations.
Regarding advanced air curtain configurations and full-scale validation, Severino et al. [49] examined dual-flow, dual-jet air curtains in a scaled tunnel model. It was revealed that flame behavior and air curtain mechanisms were coupled dynamically. Gao et al. [50] confirmed through numerical simulations and experimental validation that air curtains significantly reduced smoke spread, with performance influenced by air velocity and fire source position. Jung et al. [51] utilized CFD to systematically compare various air curtain setups regarding their isolation efficiency and overall impact on tunnel fire safety. Finally, Viegas et al. [52,53] employed laboratory-scale saltwater experiments to develop predictive equations for vertical air curtain efficiency; while Viegas and Cruz [54] conducted full-scale experiments demonstrating the synergistic benefits of integrating air curtains with exhaust systems.
Current research on transverse air curtains in tunnel fire smoke control is limited, particularly regarding individual factor influences. Employing FDS, this study evaluates air curtain performance under varying velocities, HRR, fire distances, and pressures, analyzing upstream–downstream smoke temperature patterns. Three dimensionless relational equations are developed to assess smoke containment across single-factor scenarios. Results offer benchmarks and practical guidance for designing, implementing, and enhancing transverse air curtains’ smoke control in varied conditions.
This study addresses a key gap in the literature on transverse air curtains for tunnel fire smoke control, where the independent effects of environmental pressure, fire source proximity, and air curtain parameters remain underexplored, especially in high-altitude or variable-pressure settings that influence smoke buoyancy and isolation efficiency. Prior research has mainly focused on standard atmospheric conditions and isolated factors like jet velocity or heat release rate (HRR), often overlooking individual parameter impacts on smoke stratification, longitudinal spread, and thermal gradients in real tunnels. Using Fire Dynamics Simulator (FDS) simulations with parametric analyses—covering HRR, fire-to-curtain distances, velocities, and pressures—this work derives three dimensionless relational equations (double exponential for velocity–temperature, fractional for HRR–temperature, and linear–exponential for pressure–temperature), revealing enhanced isolation under higher pressures via increased air density and reduced buoyancy, while identifying thresholds for proximity effects. These findings enhance existing studies by providing targeted models for optimizing air curtain designs, improving fire safety in diverse tunnels such as high-altitude or subway systems.
2. Numerical Model
2.1. Physical Problem: Fire Scenario
This study employs a section of a traffic tunnel within a hydropower station as a model. A tunnel configuration with longitudinal span of 300 m and uniform cross-sectional geometry (8.6 m × 8.6 m) was numerically implemented in FDS(6.7.1), as depicted in Figure 1. The tunnel design incorporates passive ventilation openings at terminal portals, with the combustion source strategically located 150 m downstream from the ingress portal along the central axis. Operational parameters include air curtain velocities spanning 6–16 m/s and fire scenarios characterized by discrete heat release rates (HRR). Heptane serves as the fuel source [55], and the HRR are set to 1 MW, 3 MW, 5 MW (representing car fires), 7 MW, 9 MW, 11 MW, 13 MW, and 15 MW (representing bus fires). The fire source is placed 5 to 50 m from the air curtain, and environmental pressure is varied from 40 to 140 kPa. The 300 m tunnel section was selected because it provides a sufficiently long computational domain to capture the evolution of fire-induced ceiling smoke flow, the development of upstream and downstream thermal fields, and the interaction between the smoke layer and the transverse air curtain. This length ensures that boundary effects do not interfere with the air-curtain region while remaining representative of practical transport tunnels.
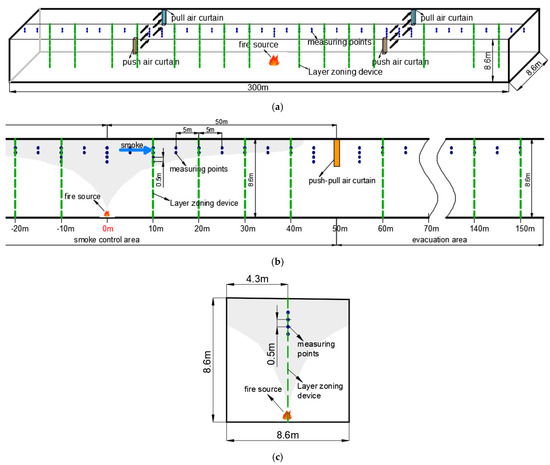
Figure 1.
Tunnel model and measuring point layout. (a) Schematic view of the tunnel built by FDS; (b) Front view; (c) Side view.
The fire source maintains a consistent size of 1 m × 1 m across different HRR scenarios. Isothermal control at 20 °C was maintained to establish baseline experimental conditions, facilitating the analysis of the effects of environmental pressure, fire source distance, HRR, and air curtain velocity on fire smoke. Thermometric instrumentation is deployed with 5 m longitudinal spacing across ventilation barrier zones and 0.5 m vertical resolution within the ceiling-proximal region, capturing stratified smoke thermal profiles through thermocouple arrays. Additionally, “thermocouples,” “gas detectors,” and “layer zoning devices” are used to record temperature variations along the tunnel’s centerline and ceiling at 5 m intervals. The simulation runtime is set to 600 s.
Figure 1 illustrates the tunnel model and measurement points. It is noteworthy that ambient temperature varies with altitude and latitude. However, a constant ambient temperature is used in this study to isolate the effects of environmental pressure, the distance between the fire source and the air curtain, HRR, and air curtain velocity on fire smoke. Different operational conditions are explored by individually varying parameters such as HRR, air curtain velocity, environmental pressure, and fire source location. Specific parameter settings are summarized in Table 1. The study analyzed the performance of the blow-suction type transverse air curtain by considering three main aspects: fire source combustion, environmental factors, and air curtain characteristics. Key parameters examined included the heat release rate (HRR) of the fire source, the spacing between the fire source and the air curtain, ambient pressure, and air curtain velocity. The study investigated the effectiveness of the transverse air curtain in controlling smoke and temperature and explored the impact of varying ambient pressure, with some degree of quantification. A total of 37 simulation scenarios were conducted: Scenarios 1–6 were used for model validation. Scenarios 7–12 focus on establishing the impact of different lateral air curtain supply speeds. Scenarios 13–20 discusses the impact of fire source HRR. Scenarios 21–26 analyze how the distance between the fire and air curtain impacts smoke containment. Scenarios 27–37 mainly study the flow pattern of fire smoke under the transverse air curtain under different ambient pressures. Experimental configurations for these test cases are detailed in Table 1.

Table 1.
Summary of the test conditions.
2.2. Numerical Model: Governing Equations
Fire Dynamics Simulator (FDS) version 6.7.1 is an open-source computational fluid dynamics (CFD) tool developed by the National Institute of Standards and Technology (NIST) in the United States, specifically designed to simulate low-speed flow, emphasizing fire smoke and heat transfer. Mainly based on the Large Eddy Simulation (LES) method, the low Mach number (<0.3) Navier–Stokes equations are numerically solved to analyze the dynamic process driven by combustion thermal buoyancy, which is suitable for the study of unsteady combustion scenarios such as tunnel fires.
Assumptions:
- The fluid is assumed to be Newtonian, wherein the viscous stress tensor is linearly proportional to the strain rate tensor, adhering to Newton’s law of viscosity.
- The continuum assumption is adopted, in which the fluid is treated as a continuous medium and its thermophysical properties are defined as smoothly varying fields in space and time.
- Large eddy simulation (LES) presupposes: (1) governance by Navier–Stokes equations under continuum and Newtonian fluid assumptions; (2) scale separation, resolving large eddies while modeling subgrid-scale turbulence; (3) subgrid isotropy, assuming small eddies are statistically homogeneous and isotropic; and (4) energy cascade, wherein kinetic energy transfers from large to small scales.
- In FDS(6.7.1), thermophysical properties are typically assumed to be constant or temperature-dependent based on built-in material databases. The gas mixture is treated as ideal, radiative properties follow gray-gas assumptions, and species transport parameters are simplified using mixture-averaged diffusion and constant specific heat formulations.
The governing equations for Large Eddy Simulation (LES) are obtained by filtering the fundamental conservation laws of mass, momentum, and energy using a spatial filter with characteristic width Δ. In this study, it is sufficient to treat the filtered fields in the LES equations as cell-averaged quantities. Considering a one-dimensional case, the spatially averaged density across a cell of size Δ is mathematically defined by the following integral expression [56]:
In commonly employed turbulence modeling approaches within Computational Fluid Dynamics (CFD), the Large Eddy Simulation (LES) method achieves superior accuracy relative to Reynolds-Averaged Navier–Stokes (RANS) formulations while maintaining lower computational cost compared to Direct Numerical Simulation (DNS), especially in scenarios involving fire-driven fluid flows [57].
The time-dependent Navier–Stokes (N-S) equations explicitly capture large-scale turbulent structures, whereas subgrid-scale vortical effects on resolved motions are represented through closure formulations, given that these small-scale phenomena arise from nonlinear energy cascades inherent to large-eddy dynamics. LES assumes isotropic behavior for small-scale turbulence, while large-scale turbulent motions are computed using appropriately constructed subgrid-scale models. The combustion and flow processes of tunnel fire smoke under the influence of transverse air curtains are particularly complex. They involve fundamental governing principles spanning mass, momentum, and energy conservation theorems [58,59]:
where ▽ denotes the Nabla differential operator; ρ, k, R, and Di are the gas density, thermal conductivity, gas constant, and diffusion coefficient of species i, respectively; u, P, h, t, and T separately represent velocity vector, pressure, enthalpy, time, and absolute temperature; f and g stand for external force and gravitational acceleration; qr is radiative heat flux; Yi indicates mass fraction of species; and mi denotes mass per unit volume of species i.
Within the low-Mach-number formulation of FDS, ambient pressure is imposed as the global reference pressure, entering the ideal-gas equation of state to determine background density and serving as the boundary pressure in the Poisson equation and open-boundary conditions. Although only pressure perturbations are solved, changes in ambient pressure systematically influence density, buoyancy, and thermophysical properties, thereby affecting plume rise, thermal stratification, and jet momentum. Furthermore, this treatment is implicitly integrated into the Poisson equation for solving perturbation pressure within independent pressure zones, ensuring mass conservation and flow stability without directly substituting absolute pressure into the core Navier–Stokes equations. Consequently, variations in ambient pressure can faithfully represent differences in tunnel fire smoke behavior under different environmental conditions.
2.3. Boundary Conditions
This study uses the traffic tunnel of a hydropower station in Foping as the prototype, establishing and simplifying a full-scale numerical model based on its design blueprint. The tunnel cross-section is 8.5 m × 8.5 m, and a 200 m segment is modeled. The tunnel’s structural components (walls, ceiling, floor) utilize concrete with a thermal conductivity coefficient of 1.8 W/(m·K). Lateral air curtains are installed at 50 m and 150 m along the tunnel length. Each air curtain is located on the sidewalls of the tunnel and consists of air supply outlets and exhaust outlets, forming a blow-suction air curtain system. Dimensional specifications include 0.4 m × 2.0 m duct cross-sections, operational with 6–16 m/s injection velocities and fixed 10 m/s exhaust flowrates. Specific structure of the air curtain system is shown in Figure 1.
The initial conditions for the tunnel air parameters are set to match the surrounding environment. The boundary conditions for lateral air curtain-induced smoke flow in the tunnel primarily involve inlet, outlet, and wall conditions. During model construction in FDS(6.7.1), the surface attributes of the tunnel ends, which are connected to large open spaces or external environments, are designated as “Open” to enable natural ventilation. The FDS(6.7.1) boundary attribute “Supply” is used to define air supply for the air curtain, while “Exhaust” is specified for air curtain exhaust functions.
This study investigates the efficacy of transverse air curtains in mitigating smoke propagation during tunnel fires, with a primary objective to elucidate the performance mechanisms under varying factors for more effective smoke control and enhanced safety. Utilizing Fire Dynamics Simulator (FDS(6.7.1)) simulations based on a prototypical hydropower station tunnel (300 m length, 8.6 m × 8.6 m cross-section), the research quantifies the impacts of key parameters—air curtain jet velocity, fire heat release rate (HRR), fire-to-curtain distance, and ambient pressure—on temperature distributions and containment, thereby advancing strategies to minimize smoke risks in tunnel environments.
Parameter selection is rigorously grounded in empirical data from prior tunnel fire studies to ensure relevance and realism. HRR values (1–15 MW) represent typical vehicle fires (cars: 2–15 MW), aligning with benchmarks for analyzing buoyancy-driven smoke escalation. Velocities (6–16 m/s) are chosen based on literature thresholds for effective smoke blocking, while lower ranges test failure modes. Distances (5–50 m) target proximity effects, with <10 m amplifying impingement risks. Pressures (40–140 kPa) encompass high-altitude conditions, where reduced pressure accelerates smoke development, as evidenced by studies on increased critical velocities and decay rates. These selections isolate interactions while mirroring real-world prototypes, yielding transferable insights for smoke control engineering.
2.4. Grid Independence Study
Mesh sensitivity investigations confirm that refined cell dimensions enhance solution precision at the expense of computational efficiency. Optimal meshing requires balancing numerical accuracy with resource allocation. Current best practices, as documented in foundational literature [57] and the FDS User Guide [58], adopt the parameter D∗/δx as the principal metric for large eddy simulation (LES) grid resolution assessment. This parameter is suggested to maintain established validity bounds of 4 ≤ D∗/δx ≤ 16, where δx denotes grid cell characteristic length and D∗ represents the characteristic fire scale determined by:
where D denotes characteristic fire source diameter, Q is fire source heat release rate, T represents air temperature, ρ stands for density of air, Cp is specific heat of air, δx indicates dimensions of the grid cell.
Based on Equation (7) and the recommended D∗/δx values, the grid sizes for fire sources in the tunnel ranging from 1 MW to 15 MW were calculated to be between 0.058 m and 0.684 m. Current guidelines suggest maintaining combustion zone grid refinement within 0.05 D∗ to 0.2 D∗, while regions farther from the fire source can utilize larger grid sizes, up to 0.3 D∗. To balance simulation accuracy and computational efficiency, temperature-time curves at a measurement point located 30 m from the fire source (Figure 2) were analyzed for six grid resolutions (0.1 D∗ to 0.5 D∗).
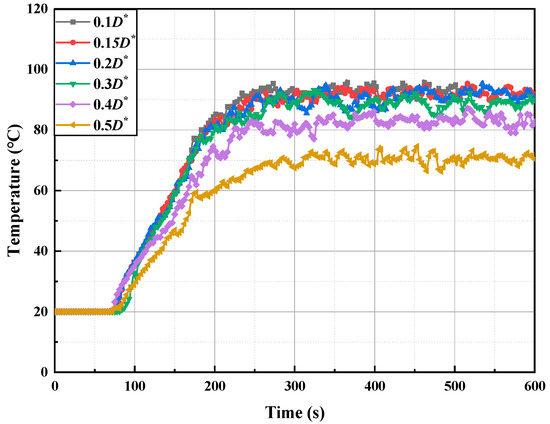
Figure 2.
Grid sensitivity analysis curve.
As shown in Figure 2, grid sizes of 0.1 D∗, 0.15 D∗, 0.2 D∗, and 0.3 D∗ produce nearly identical temperature curves, indicating consistent computational results. Parametric sensitivity quantification shows acceptable solution divergence below 2.16% for δx ≤ 0.2 D∗, escalating to 2.51% at 0.3 D∗ and 6.84% at 0.4 D∗. These findings validate δx = 0.2 D∗ as the optimal grid resolution threshold, effectively balancing numerical fidelity (relative error < 3%) with computational feasibility under constrained resource conditions.
2.5. Model Validation
Validation compares simulations with Weng et al.’s experimental data [60] from a full-scale Chongqing metro tunnel. The experimental domain comprised 211.2 m × 4.8 m × 5.15 m (L × W × H), with fire dynamics characterized by 3.5 MW HRR over 2 m2 combustion area under ambient conditions of 9.6 °C and 0.45 m/s longitudinal airflow. Based on this full-scale tunnel fire experiment, temperature data measured 30 m and 50 m downstream of the fire source were selected for comparison with simulation results which were performed using environmental parameters and boundary conditions exactly identical to those in the experiment, including tunnel geometry, ambient temperature, longitudinal ventilation velocity, fire HRR, and combustion area (Figure 3). The comparison of Figure 3 indicates that both the simulated and experimental temperature trends are consistent, with the simulated temperatures being slightly lower than the experimental values. The average errors were 4.43% and 3.87%, respectively, thereby confirming model fidelity and validating that the numerical model accurately reproduces the thermal behavior under the same physical and environmental conditions as the full-scale experiment.
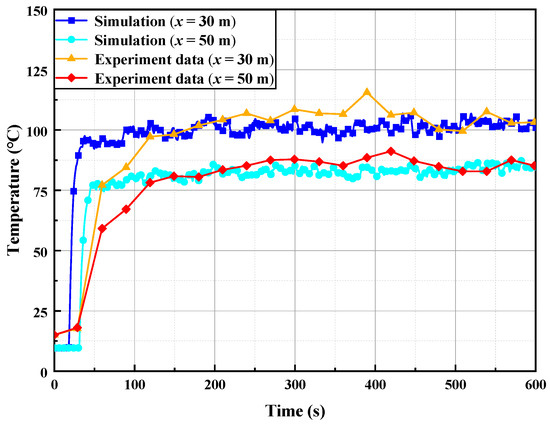
Figure 3.
Comparison of experimental and simulation results.
The numerical model employed for validation was rigorously constructed in strict accordance with the tunnel geometry and experimental conditions reported in Weng et al. [60], thereby ensuring fidelity and consistency with the full-scale experiments. Consequently, the model replicates the observed ceiling-attached flow behavior, thermal stratification patterns, and longitudinal confinement characteristics. Moreover, the grid-generation principles, turbulence modeling approaches, and governing buoyant-flow mechanisms align seamlessly with those of the experimental framework. Accordingly, the full-scale experiment reported by Weng et al. [60] provides a robust empirical basis for validating the numerical simulations, demonstrating strong agreement between experimental observations and computational predictions, and thereby supporting the reliability of the smoke propagation and air-curtain modeling conducted in this study.
3. Results and Discussion
Based on the FDS calculation results, the temperature cloud maps at the center of the air curtain during the steady stage of fire smoke under different air curtain wind speed conditions are shown in Figure 4. It can be observed that, under various wind speeds, part of the high-temperature smoke at the tunnel ceiling still penetrates the air curtain and continues to flow downstream. According to the cloud maps for wind speeds ranging from 6 to 16 m/s, the upstream temperature increases from 56.1 °C to 70 °C, while the downstream temperature decreases from approximately 40 °C to about 32 °C, and the temperature difference expands from 15 °C to 33 °C. Increasing the air curtain wind speed enhances the jet rigidity of the curtain, thereby reducing the penetration of high-temperature smoke. This leads to higher accumulated temperatures upstream due to smoke stagnation, while the overall downstream temperature field decreases, resulting in a larger upstream–downstream temperature difference. Therefore, adjusting the air curtain wind speed can effectively improve its overall integrity and thermal insulation performance.
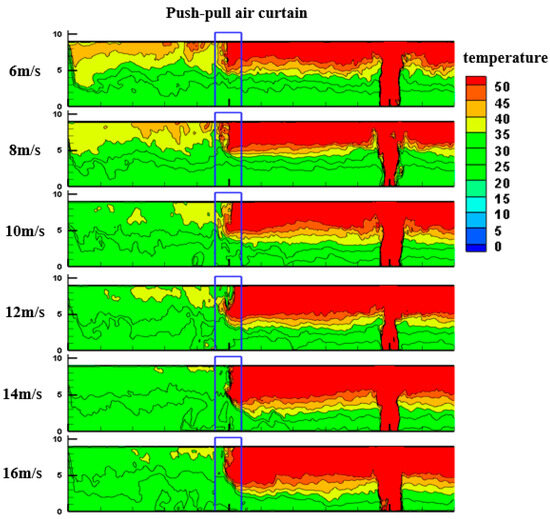
Figure 4.
Temperature distribution at the center of the air curtain under different wind speeds.
Figure 5 presents the temperature cloud maps at the center of the air curtain during the steady stage of fire smoke under environmental pressures ranging from 40 to 140 kPa. As the environmental pressure increases, the upstream temperature decreases from 77 °C to about 55 °C, while the downstream temperature decreases from 46 °C to approximately 34 °C, and the temperature difference reduces from 32 °C to 25 °C. Figure 5 indicates that increasing environmental pressure enhances the specific heat capacity of air, improves heat absorption and convective efficiency, strengthens the momentum of the air curtain, and weakens diffusivity. These changes lead to a partial reduction in the temperature difference across the air curtain. Therefore, when designing air curtains, it is necessary to adjust certain design parameters according to environmental pressure variations to optimize their blocking and dilution performance.
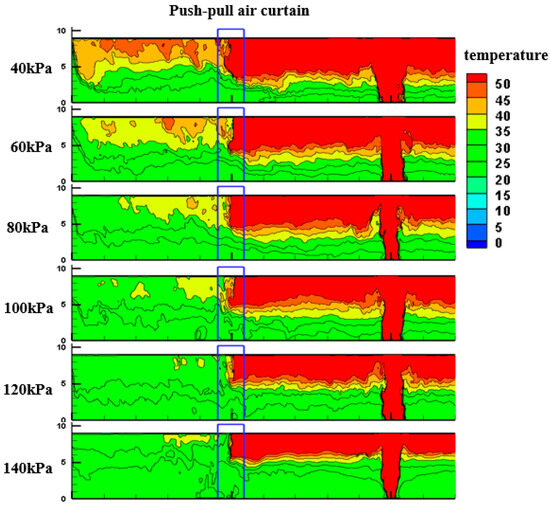
Figure 5.
Temperature distribution at the center of the air curtain under different environmental pressures.
3.1. Effect of Air Curtain Velocity on Tunnel Temperature Distribution
Figure 6 illustrates the effect of the lateral air curtain on the tunnel ceiling’s flue gas temperature at upstream and downstream locations (5 m from the air curtain) under various supply speeds. The temperature variation trends are clearly delineated, thereby simplifying the analysis of the overall temperature profile at the ceiling. Analysis reveals the air curtain induces distinct thermal stratification, demarcating the tunnel into upstream high-temperature and downstream low-temperature domains. With incremental airflow augmentation, the steady-state temperature in the upstream zone rises while that in the downstream zone decreases.
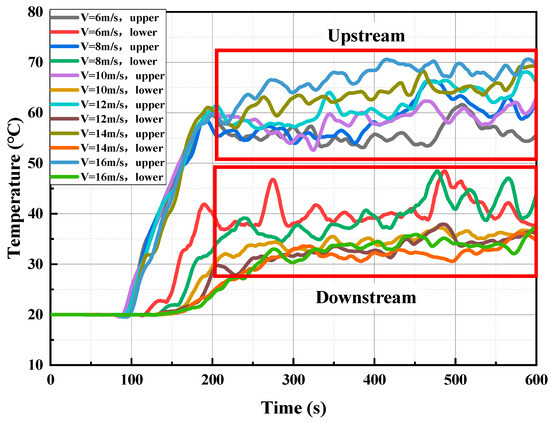
Figure 6.
Temperature response curves at 5 m upstream and downstream positions of air curtains with different air supply speeds.
At 5 m upstream, hot smoke reaches the measurement point at about 100 s, causing a temperature rise that stabilizes around 200 s. Although minor smoke leakage occurs, the air curtain significantly restricts longitudinal smoke propagation, and the overall temperature remains steady. As the supply speed increases from 6 to 16 m/s, enhanced smoke retention in the upstream zone leads to higher steady-state temperatures. At 5 m downstream, hot smoke arrives around 120 s, with temperatures rising and stabilizing thereafter. The upstream temperature ranges from 52 °C to 70 °C, whereas downstream temperatures fall between 30 °C and 51 °C, yielding a temperature gradient exceeding 20 °C. Higher supply speeds extend the downstream stabilization time from 200 s to 320 s and further lower the temperatures by reducing smoke leakage and diluting the smoke concentration, thereby decreasing both thermal and pollutant levels. The air curtain markedly enhances smoke containment, as demonstrated by a temperature differential of over 20 °C, which effectively delays smoke spread and downstream temperature rise. Moreover, increasing the supply speed further improves both the containment and cooling performance, underscoring the critical role of the air curtain in ensuring safety and reducing evacuation times during tunnel fire incidents.
Under standard atmospheric conditions, with a fire source located at the tunnel center—50 m from air curtains on both sides—and an HRR of 5 MW, this study investigates ceiling temperature variation using the average data from numerical simulations at around 400 s (in Figure 7). Results indicate that increasing the air supply velocity from 6 to 16 m/s markedly enhances the air curtain’s effect, effectively reducing downstream temperatures and establishing distinct upstream high-temperature and downstream low-temperature zones. Localized analysis in the 40–60 m region from the fire source reveals a temperature difference exceeding 20 °C between the smoke control and evacuation zones, mitigating high-temperature smoke damage to the tunnel structure. Specifically, at 6 m/s, upstream and downstream temperatures are 55.4 °C (±0.5 °C) and 36.9 °C (±0.5 °C) (ΔT = 18.4 °C), respectively; at 16 m/s, they shift to 67.5 °C (±0.5 °C) and 34.3 °C (±0.5 °C) (ΔT = 33.2 °C).
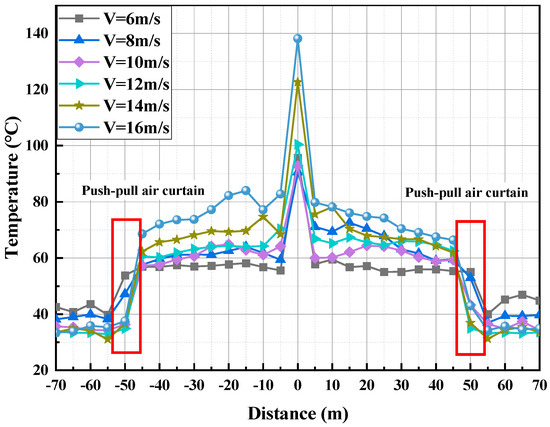
Figure 7.
Comparison of Longitudinal Temperature Distribution of Horizontal Air Curtain with Different Air Supply Speeds.
Furthermore, with the air curtain’s speed enhancement, the upstream ceiling temperature rises while the downstream temperature falls, enlarging the temperature gradient until stabilization occurs. This behavior is attributed to the enhanced isolation and dilution effects at higher wind speeds, which reduces downstream temperatures despite increased smoke accumulation upstream that accelerates temperature decay. In summary, increased air curtain velocity significantly lowers downstream smoke temperature and concentration, thereby improving isolation and evacuation safety. The complex interplay between transverse airflow and thermal smoke jet underscores the critical role of air curtains in effective tunnel fire smoke control.
The upstream and downstream average temperatures, and their difference across the air curtain, are key metrics for evaluating air curtain performance and smoke isolation efficiency. As shown in Figure 8, under standard atmospheric pressure with a fire source 50 m from the air curtain and an HRR of 5 MW, the average upstream temperature varies between 55 °C and 70 °C, while the downstream temperature varies between 32 °C and 43 °C as the air supply velocity increases from 6 to 16 m/s. Temperature data from the dynamic steady-state phase (400–600 s) were used to compute the average ceiling smoke temperature. The results indicate that an increase in air curtain velocity raises the upstream temperature and lowers the downstream temperature, thus widening the temperature differential. Specifically, as the air curtain velocity increases from 6 to 16 m/s, the upstream temperature increases from 56.2 °C (±0.5 °C) to 68.9 °C (±0.5 °C) (an 18.39% increase), while the downstream temperature decreases from 41.4 °C (±0.5 °C) to 36.1 °C (±0.5 °C) (a 12.64% decrease), resulting in a temperature difference that grows from 14.9 °C (±0.5 °C) to 32.8 °C (±0.5 °C) (a 54.48% increase).
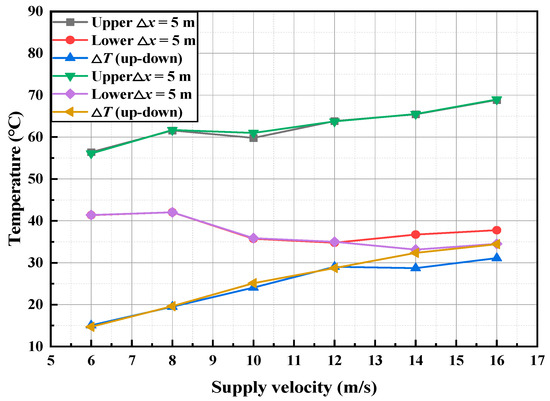
Figure 8.
The variation in temperature and temperature difference upstream and downstream of the air curtain with the air supply speed.
These findings confirm that air supply velocity significantly affects air curtain performance and smoke control. Therefore, maximizing the air supply velocity is recommended in the design of transverse air curtains to enhance smoke isolation and ensure personnel safety in underground tunnel environments.
From an engineering perspective, the observed increase in upstream–downstream temperature differentials with rising air curtain velocity underscores the enhanced shear layer stability and jet momentum, which effectively disrupts smoke entrainment and promotes thermal stratification in tunnel fire scenarios. Consequently, engineering designs should prioritize velocity thresholds to maximize isolation efficiency, ensuring robust smoke control systems that mitigate fire spread and improve occupant egress safety in confined infrastructures.
3.2. Effect of Heat Release Rate on Tunnel Temperature Field
Figure 9 shows the temperature distribution at the center of the air curtain under heat release rates (HRR) from 1 to 15 MW. As HRR increases, the upstream temperature rises from about 21 °C to 63 °C, and the downstream temperature increases similarly from 21 °C to 63 °C, with steady-state fluctuations growing from 1 °C to 18 °C. Higher HRR generates hotter smoke with stronger buoyancy and momentum, producing a more concentrated hot core and expanding the thermal influence region. Despite the increased thermal load, the air curtain maintains a transverse jet that dilutes downstream smoke and limits breakthrough. Overall, HRR strongly governs the thermal field, while the air curtain continues to provide effective mitigation under high-temperature, high-intensity fire conditions.
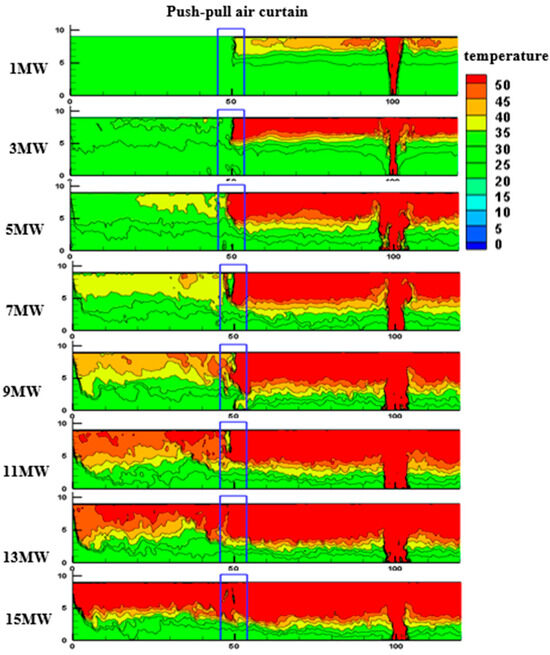
Figure 9.
Temperature distribution at the center of the air curtain under different heat release rate.
Figure 10 illustrates the impact of varying heat release rates (HRR) on ceiling smoke temperature under the influence of a transverse air curtain, with data presented in a simplified format to clearly reveal measurement trends. The results show that smoke temperatures both upstream and downstream increase with higher HRR; although the air curtain maintains a temperature difference between these regions, both temperatures rise as HRR increases, with the rate of increase gradually diminishing. Furthermore, during the steady-state phase, temperature fluctuations become more pronounced, the time to reach steady-state decreases, and the heating rate accelerates. At an upstream location 5 m from the air curtain, when HRR is 1 MW, hot smoke reaches this point at approximately 135 s and stabilizes around 400 s; as HRR increases from 1 to 15 MW, the arrival time decreases to 80 s and stabilization occurs around 220 s. In the downstream evacuation zone, as HRR increases from 1 to 15 MW, the smoke arrival time reduces from 175 s to 100 s, and the stabilization time shortens from 420 s to 200 s, with measured temperatures rising from 21.4 °C (±0.5 °C) to 63.4 °C (±0.5 °C) and steady-state fluctuations increasing from 0.5 °C (±0.5 °C) to 17.5 °C (±0.5 °C).
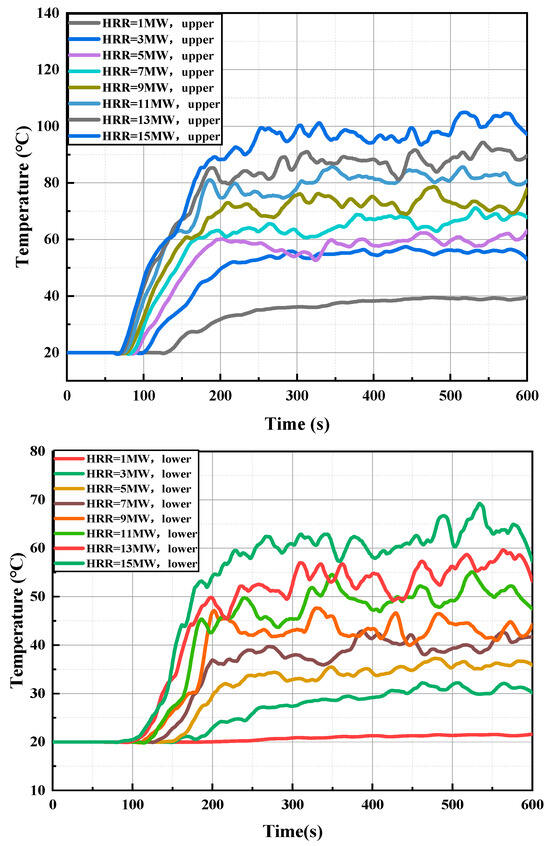
Figure 10.
Temperature response curves at 5 m upstream and downstream of air curtains with different heat release rates (HRR).
Although a higher HRR leads to increased overall smoke temperatures and fluctuations, the air curtain effectively isolates the smoke by reducing overflow and diluting downstream smoke. This mechanism preserves a substantial upstream–downstream temperature differential, thereby improving evacuation safety in underground tunnel environments. Nonetheless, HRR remains a critical factor influencing smoke temperature and personnel safety, emphasizing the need to rapidly reduce HRR during a fire to lower smoke temperatures and improve safety.
Under standard atmospheric parameters, the fire source is positioned at the tunnel’s central axis, maintaining 50 m equidistant spacing from dual transverse air curtains, with stabilized airflow velocities of 10 m/s across the barrier systems. This study investigates the variation in ceiling temperature as the heat release rate (HRR) increases from 1 MW to 15 MW, using average simulation data around 400 s to mitigate transient effects (in Figure 11). The results indicate that the ceiling temperature rises with higher HRR, and the transverse air curtain effectively reduces downstream smoke temperature and concentration. The air curtain significantly reduces hot smoke temperature, increasing the temperature difference between areas before and after its operation, especially with rising HRR.
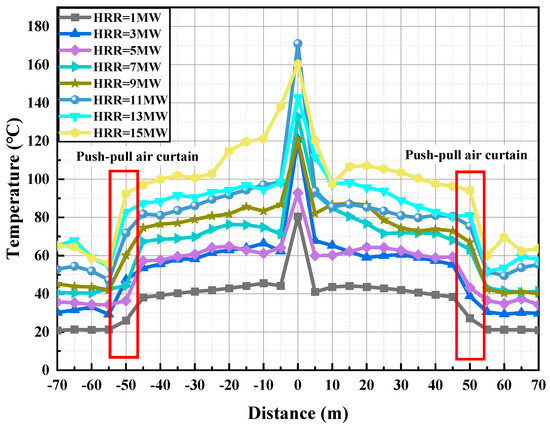
Figure 11.
Comparison of longitudinal temperature distribution with different heat release rates (HRR).
Local data from 40 to 60 m from the fire source reveal that at 1 MW, the upstream temperature is 38.4 °C (±0.5 °C), the downstream temperature is 21.3 °C (±0.5 °C), and the temperature difference is 17.1 °C (±0.5 °C); at 15 MW, the upstream temperature increases to 96.4 °C (±0.5 °C) and the downstream to 60.0 °C (±0.5 °C), yielding a difference of 36.4 °C (±0.5 °C). Although overall temperatures increase with HRR, the cooling effect of the air curtain becomes more pronounced, as indicated by the amplified temperature gradient between the smoke and the airflow. In summary, while higher HRR leads to increased overall ceiling temperatures and elevated downstream smoke temperatures and concentrations, the air curtain’s isolation performance also improves, resulting in a larger temperature difference between upstream and downstream zones. This enhanced performance underscores the critical role of transverse air curtains in effectively managing smoke under various HRR conditions, thereby ensuring safety for downstream occupants.
The average upstream and downstream temperatures, along with their difference across the air curtain, are key metrics for evaluating the air curtain’s performance in smoke isolation. As shown in Figure 12, under standard atmospheric conditions—with the fire source located 50 m from the air curtain and an air curtain wind speed of 10 m/s—the upstream average temperatures range from 38 °C to 101 °C and the downstream temperatures from 21 °C to 64 °C as the heat release rate (HRR) increases from 1 MW to 15 MW. The values shown in the figure represent time-averaged data extracted from the dynamic steady phase, providing a reliable characterization of the stabilized temperature behavior; this averaging period effectively smooths transient fluctuations and yields representative thermal conditions for the overall operating scenario. By averaging temperature data during the dynamic steady phase (400–600 s), the analysis shows that both upstream and downstream temperatures rise with increasing HRR, resulting in an expanding temperature difference across the air curtain. Specifically, when HRR increases from 1 MW to 15 MW, the upstream temperature rises from 39.0 °C (±0.5 °C) to 99.2 °C (±0.5 °C) (a 64.06% increase), the downstream temperature increases from 21.4 °C (±0.5 °C) to 62.8 °C (±0.5 °C) (a 66.10% increase), and the temperature difference expands from 17.4 °C (±0.5 °C) to 37.1 (±0.5 °C) °C (a 52.43% increase). These findings indicate that HRR critically governs thermal distribution patterns. Moreover, elevated smoke temperatures moderately improve the air curtain’s cooling capacity and containment performance, suggesting that, for larger fire sources and higher-temperature smoke, transverse air curtains can effectively isolate high-temperature smoke and improve safety for occupants in tunnel spaces.
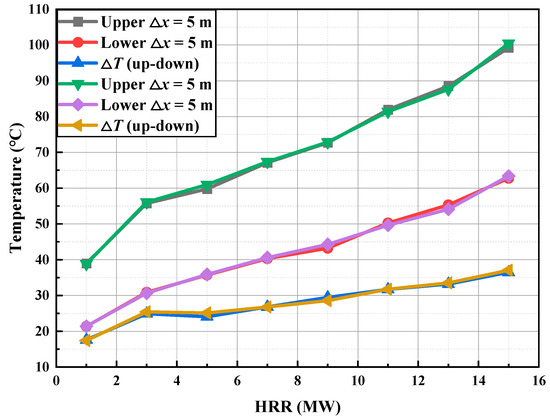
Figure 12.
The variation in upstream and downstream temperature and temperature difference in air curtain with heat release rate (HRR).
This indicates a critical engineering trade-off where higher HRR diminishes relative isolation efficacy, necessitating adaptive curtain designs to counteract buoyancy-driven flows in high-intensity fire events. Overall, these insights inform engineering strategies for scaling air curtain systems to accommodate variable HRR, enhancing thermal containment and reducing fire hazards in vehicular tunnel applications.
3.3. Effect of Fire Source Distance on Tunnel Temperature Distribution
Figure 13 illustrates the impact of transverse air curtains on ceiling smoke temperature distribution at varying fire source distances. The data is simplified to highlight temperature trends. The results indicate that the air curtain creates a high-temperature region upstream and a low-temperature region downstream. Increasing the fire source distance from 50 m to 95 m does not significantly affect upstream and downstream temperatures but delays the time for smoke to reach the upstream measurement point. Specifically, with the fire source 50 m from the air curtain, smoke reaches the upstream measurement point in approximately 95 s and stabilizes after 200 s. At a 95 m distance, the arrival time extends to 150 s. Despite these delays, the air curtain effectively maintains a temperature difference exceeding 20 °C between upstream and downstream regions.
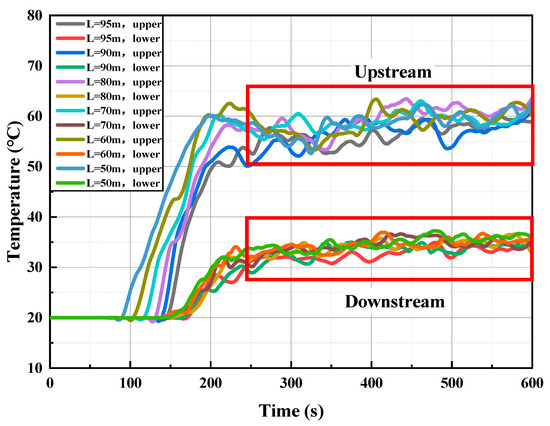
Figure 13.
Temperature response curves at 5 m upstream and downstream positions of air curtains with different fire source distances.
The air curtain significantly enhances smoke temperature distribution, maintaining a temperature difference of over 20 °C between upstream and downstream areas. Increasing the fire source distance primarily affects the upstream smoke arrival time, with minimal impact on the curtain’s isolation performance. As a critical measure for controlling high-temperature smoke, the transverse air curtain plays a vital role during the fire spread phase, providing effective support for the safe evacuation of occupants. Under standard atmospheric pressure, with the fire source positioned 50 m from each air curtain and a heat release rate (HRR) of 5 MW, this study examines the ceiling temperature variations as the fire source approaches one air curtain. Given the transient nature of numerical simulation results, data averaging around 400 s were analyzed. Figure 14 illustrates the longitudinal temperature distribution along the tunnel ceiling.
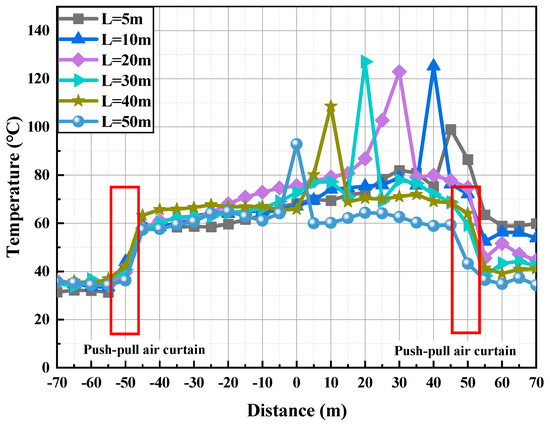
Figure 14.
Comparison of Longitudinal Temperature Distribution at Different Fire Source Distances.
The values shown in the figure represent time-averaged data extracted from the dynamic steady phase, providing a reliable characterization of the stabilized temperature behavior; this averaging period effectively smooths transient fluctuations and yields representative thermal conditions for the overall operating scenario. Numerical data reveals that reducing the fire-air curtain separation distance from 50 m to 5 m elevates thermal exposure at the fire-side barrier interface. This proximity amplifies the influence of high-temperature smoke on the air curtain, inducing bilateral temperature escalation. During this process, the air curtain effectively mitigates the impact of fire source fluctuations on downstream measurement points, although the downstream temperature gradually increases as the fire source approaches. Conversely, when the distance from the fire source to the opposite air curtain increases from 50 m to 95 m, the temperature in that region remains relatively stable, ranging between 55 °C and 70 °C. Overall, as the fire source moves closer to the air curtain (from 50 m to 5 m), both upstream and downstream temperatures rise. Although the air curtain’s temperature isolation effect improves, the proximity of the fire source still leads to a rise in downstream temperature. The air curtain’s isolation and dilution effects mitigate the fluctuations of high-temperature smoke, reducing the impact of the approaching fire source on downstream areas. However, changes in the fire source’s distance from the air curtain significantly influence the temperature increase upstream and downstream. When the fire source distance to the air curtain decreases from 50 m to 5 m, temperatures on both sides rise, and the air curtain’s isolation effect slightly improves. As the fire source distance increases from 50 m to 95 m, the air curtain’s isolation effect remains effective, but upstream temperatures approach stability, reducing its cooling effect. This study reveals a strong correlation between the transverse airflow velocity and smoke isolation effectiveness, dependent on fire source proximity to the air curtain.
Figure 15 illustrates the variations in upstream and downstream average temperatures, as well as the temperature difference across the air curtain, under standard atmospheric conditions. The fire source is positioned 50 m from the air curtain, with a heat release rate (HRR) of 5 MW and an air curtain velocity of 10 m/s. As the fire source approaches the air curtain from 50 m to 5 m, the upstream and downstream average temperatures fluctuate between 60 and 115 °C and 25–49 °C, respectively. During the dynamic stabilization phase (400–600 s), the upstream temperature decreases from 112.2 °C (±0.5 °C) to 61.0 °C (±0.5 °C), the downstream temperature decreases from 65.0 °C (±0.5 °C) to 35.9 °C (±0.5 °C), and the temperature difference decreases from 47.2 °C (±0.5 °C) to 25.1 °C (±0.5 °C). These reductions are 45.65%, 44.86%, and 46.76%, respectively. These findings indicate that the proximity of the fire source to the air curtain significantly affects its performance and smoke control efficiency, with the impact intensifying as the fire source moves closer to the air curtain.
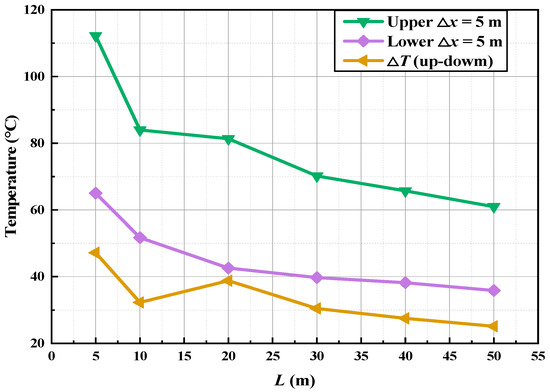
Figure 15.
The variation in temperature and temperature difference upstream and downstream of the air curtain with the distance from the fire source.
This proximity effect underscores the need for strategic placement in tunnel designs to maintain structural integrity and smoke control efficacy against direct fire impacts. Thus, engineering optimizations should incorporate minimum distance thresholds to preserve isolation performance and ensure reliable fire containment in dynamic tunnel fire scenarios.
3.4. Effect of Ambient Pressure on Tunnel Temperature Field
Although typical mountain or urban tunnels seldom operate above standard atmospheric pressure, the rapid expansion of underground and deep-underground infrastructures has introduced tunnel environments where ambient pressure increases with depth. To reflect these emerging applications, the study considers a pressure range of 40–140 kPa, enabling analysis of both low-pressure (high-altitude) and elevated-pressure (deep-underground) scenarios. This broader range allows investigation of how pressure-induced variations in density, specific heat, and buoyancy influence the performance of transverse air curtains and thus maintains practical relevance for next-generation underground facilities.
Figure 16 illustrates the variation in smoke temperature at upstream and downstream positions (5 m from the air curtain) on the tunnel ceiling under different air curtain velocities. The data indicates a pronounced temperature difference between the upstream and downstream regions due to the barrier effect of the air curtain. With an increase in ambient pressure, the stabilized temperatures in both regions decrease progressively, while the time for smoke arrival and stabilization is delayed. Specifically, at 5 m upstream from the air curtain, as the ambient pressure increases from 40 to 140 kPa, the smoke arrival time is delayed from 80 s to 105 s. After smoke arrival, the temperature curve rises over time, with the stabilization time postponed from 190 s to 210 s. The upstream smoke temperature range decreases from 74 to 85 °C to 55–64 °C, with reduced fluctuation amplitude. Similarly, at 5 m downstream, as the ambient pressure increases from 40 to 140 kPa, the smoke arrival time is delayed from 112 s to 155 s. Once the smoke arrives, the temperature curve rises, and stabilization time shifts from 200 s to 310 s, showing a more significant delay than upstream. The downstream smoke temperature range decreases from 42 to 51 °C to 30–37 °C, with fluctuations further reduced.
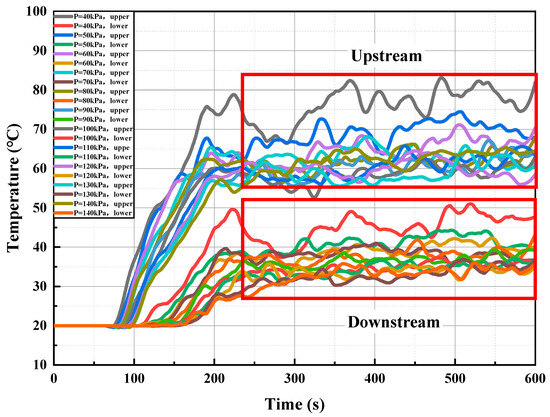
Figure 16.
Temperature response curve of air curtain at 5 m upstream and downstream under different environmental pressures.
The air curtain effectively isolates smoke, creating a temperature differential of at least 22 °C between the upstream and downstream regions. Increased ambient pressure reduces the stabilized temperatures in both regions, delays the arrival and stabilization of smoke—particularly downstream—due to higher air and smoke densities that diminish buoyancy and increase air heat capacity. Consequently, enhanced heat transfer under high pressure accelerates cooling and further lowers temperatures. In summary, while the air curtain robustly limits smoke propagation and downstream temperature rise, its performance is strongly influenced by ambient pressure. Therefore, adjusting the air curtain system for different altitudes and pressure conditions is essential to optimize smoke control and ensure safe evacuation.
Figure 17 analyzes ceiling thermal stratification under differential atmospheric pressure regimes, with the fire source centered in the tunnel and paired air curtains deployed 50 m from both portals. Test parameters include 5 MW combustion intensity (HRR) and 10 m/s airflow velocity. Environmental pressure varies from 40 to 140 kPa, and transient simulation data are averaged around 400 s for analysis. The results indicate that as the environmental pressure increases, the overall ceiling temperature decreases. The transverse air curtain effectively reduces downstream smoke temperature and concentration, as high-temperature smoke rapidly cools after passing through it; consequently, the temperature difference between the upstream and downstream regions decreases and stabilizes with increased pressure. For example, in the 40–60 m region from the air curtain, at 40 kPa the upstream temperature is 80.2 °C (±0.5 °C) and the downstream temperature is 46.4 °C (±0.5 °C) (ΔT = 33.8 °C), while at 130 kPa these values decrease to 57.3 °C (±0.5 °C) and 32.8 °C (±0.5 °C) (ΔT = 24.4 °C).
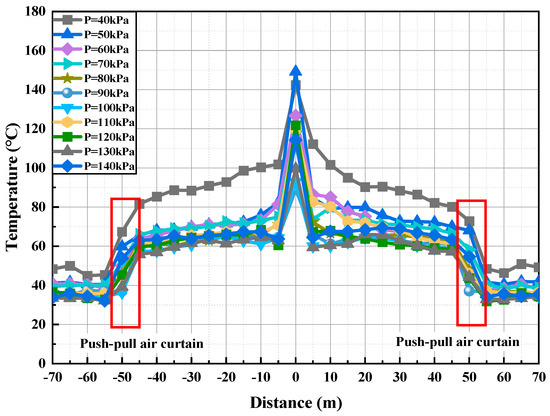
Figure 17.
Comparison of longitudinal temperature distribution under different environmental pressures.
Higher environmental pressures increase air density and heat capacity, which enhances heat absorption and transfer, reduces smoke buoyancy and movement speed, and ultimately lowers and stabilizes the ceiling temperature. Although the air curtain continues to control smoke effectively under different pressures, its cooling performance diminishes with increasing pressure. Thus, when designing transverse air curtains, the impact of environmental pressure must be considered to optimize smoke containment and ensure effective fire safety in tunnel environments. The average upstream and downstream temperatures, and the temperature difference across the air curtain, are key parameters for assessing its performance and smoke containment effectiveness. As shown in Figure 18, with the fire source at the tunnel center, air curtains located 50 m from each end, an HRR of 5 MW, and an air curtain velocity of 10 m/s under standard atmospheric conditions, monitoring data reveal temperature variations linked to air pressure changes, with upstream regions exhibiting temperature oscillations between 58 and 80 °C and downstream zones maintaining 31–48 °C thermal ranges.
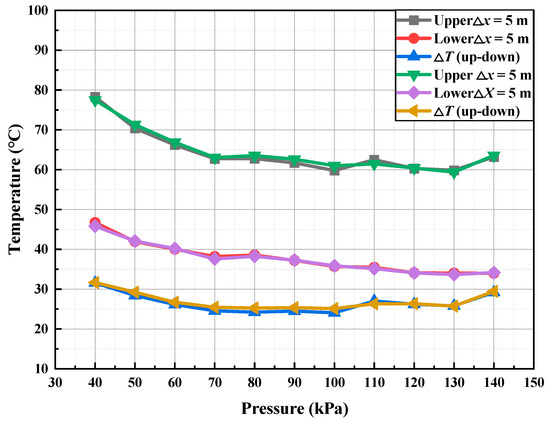
Figure 18.
The variation in temperature and temperature difference upstream and downstream of the air curtain with environmental pressure.
Temperature data from the dynamic stable phase (400–600 s) were used to compute the average ceiling smoke temperature under various pressures. The results indicate that increasing environmental pressure causes both upstream and downstream temperatures to decrease, with the temperature difference reducing and stabilizing. Specifically, as pressure rises from 40 kPa to 130 kPa, the upstream temperature decreases from 78.3 °C (±0.5 °C) to 59.8 °C (±0.5 °C), the downstream temperature from 46.7 °C (±0.5 °C) to 34.0 °C (±0.5 °C), and the temperature difference from 31.6 °C (±0.5 °C) to 25.8 °C (±0.5 °C) (reductions of 23.56%, 27.15%, and 18.24%, respectively). These findings demonstrate that environmental pressure significantly affects overall temperature distribution by enhancing the jet momentum and rigidity of the air curtain, thereby improving its isolation effect, while simultaneously reducing diffusion and enhancing heat transfer and convection. Consequently, the temperature difference across the air curtain decreases and stabilizes under higher pressures. Therefore, in high-pressure environments, the air curtain’s isolation effect becomes more pronounced. Designers should adjust air curtain parameters based on environmental pressure variations to optimize smoke containment and dilution, ensuring the safety of tunnel occupants.
Engineering evaluation shows that elevated ambient pressure reduces overall thermal loads, enhancing air curtain momentum and shear interactions to stabilize differentials at higher densities, thus improving smoke dilution and heat transfer efficiency. Consequently, pressure adjustments in air curtain systems are essential for optimizing isolation in high-pressure environments, bolstering tunnel safety through reduced smoke diffusion and enhanced occupant protection.
4. Conclusions
This study, combining experimental data from other researchers and FDS simulations, investigates the performance of transverse air curtains in tunnel fires, primarily focusing on key factors such as air supply velocity, heat release rate, fire source distance, and environmental pressure, and reveals the smoke control mechanisms and effects in relation to temperature distribution patterns.
This study addresses critical gaps in prior investigations of transverse air curtains for tunnel fire smoke control, where limitations in experimental conditions and simulation capabilities have constrained comprehensive analyses. Consequently, multifaceted influences such as environmental pressure variations and fire source proximity on smoke buoyancy and thermal dynamics have not been thoroughly explored. The study is limited by its idealized boundary conditions and simplified air-curtain configuration, which may not fully capture the geometric complexity, fluctuating inflow, and multi-factor coupling present in real tunnel fires. Nevertheless, the quantified relationships among air-supply velocity, heat release rate, and source–curtain spacing provide actionable guidance for engineering optimization of transverse air-curtain systems.
Through numerical simulations and data analysis, the following conclusions were drawn:
- (1)
- As the air supply velocity of the transverse air curtain increases from 6 to 16 m/s, the smoke isolation and dilution effects are significantly enhanced. The temperature difference increases exponentially with wind speed, and higher wind speeds increase the rigidity of the air curtain’s jet, reducing the penetration of high-temperature smoke and lowering downstream temperatures. Additionally, the accumulation of upstream smoke results in a slight increase in upstream temperatures. This outcome suggests enhanced smoke management through wind velocity optimization. The relationship between the air curtain’s non-dimensional temperature and non-dimensional velocity is described using a double-exponential fitting function, showing that the enhanced shear effect at higher wind speeds significantly strengthens the smoke isolation and cooling capability.
- (2)
- The heat release rate significantly impacts the performance of the air curtain in smoke control. As the heat release rate increases from 1 MW to 15 MW, the longitudinal flow and momentum of the smoke increase, causing both upstream and downstream temperatures to rise, thereby weakening the smoke isolation performance of the air curtain. Although the upstream–downstream temperature difference increases, the increase in downstream temperature is more significant. The fitted fractional function reveals this trend. At high heat release rates, the ability and risk of smoke penetration through the air curtain increase, necessitating improvements in the performance of the air curtain, providing a reference and requirements for its optimization.
- (3)
- When the fire source is close to the air curtain, the temperature on the side closest to the fire source gradually increases, while the side farther from the fire source is less affected. Reduced separation distances between the air curtain and fire source amplify upstream–downstream thermal gradients. When the fire source is within 10 m, there is a sharp increase in overall temperature. This phenomenon is due to the intense entrainment and impact of the high-temperature smoke near the fire source. High-temperature, high-momentum smoke strikes the air curtain, making it easier for the smoke to penetrate the air curtain. Therefore, when the fire source is too close, it reaches a critical point that disrupts the effect of the air curtain.
- (4)
- The influence of environmental pressure on smoke control is reflected in the temperature distribution. Elevating ambient pressure across the 40–140 kPa spectrum induces progressive thermal load reduction in tunnel ceiling regions, with concurrent attenuation of upstream–downstream thermal gradients. This is because, under high-pressure conditions, air density and specific heat capacity increase, reducing the buoyancy of smoke and its velocity. With constant air curtain speed, the increase in air density and momentum significantly enhances the air curtain’s ability to block smoke. The combined linear and exponential fitting curve reflects the complex mechanisms of non-dimensional pressure changes.
The findings furnish actionable engineering directives for transverse air curtain deployment in tunnel fire mitigation. Optimal jet velocities exceeding 10 m/s are recommended to bolster shear-induced smoke isolation. For high-HRR scenarios (up to 15 MW), adaptive enhancements mitigate disproportionate downstream thermal rises via fractional correlations. Positioning air curtains at least 10 m from fire sources averts integrity breaches from momentum impingement. Pressure-tuned configurations (40–140 kPa) leverage density augmentation for buoyancy suppression. These offer theoretical insights into smoke dynamics and practical guidance for design optimization, enhancing tunnel resilience, evacuation safety, and ventilation standards in smoke control systems.
Author Contributions
Conceptualization, Y.W. and A.L.; Methodology, A.L.; Validation, Y.W.; Formal analysis, Y.W.; Investigation, Y.W.; Writing—original draft, Y.W. and A.L.; Writing—review & editing, A.L.; Supervision, A.L.; Funding acquisition, A.L. All authors have read and agreed to the published version of the manuscript.
Funding
Supported by the Foundation of International Joint Laboratory on Low Carbon Built Environment, Ministry of Education (Xi’an University of Architecture and Technology).
Data Availability Statement
The data presented in this study are available upon request from the corresponding author. The data are not publicly available due to the large volume of computational data and the management regulations of the research team.
Conflicts of Interest
The authors have no competing interests to declare that are relevant to the content of this article.
References
- Shi, Q.; Xu, T.; Zhang, D.; Liu, Y. Tunnel face stability during slurry-shield tunnelling in saturated cohesionless soil considering slurry infiltration. Int. J. Civ. Eng. 2025, 23, 393–402. [Google Scholar] [CrossRef]
- Fan, X.; Zhang, H.; Wan, Z.; Liu, Z.; Liu, J.; Yang, J.; Liu, S.; Pu, J.; Wang, Z.; Jiang, Y.; et al. A simplified model for unsteady airflow analysis in ultra-long tunnels based on the resistance compensation method. Build. Simul. 2024, 17, 1823–1840. [Google Scholar] [CrossRef]
- Jiao, W.; Chen, C.; Lin, Z.; Bao, Y.; Shi, L. Experimental study on the effect of longitudinal ventilation on spill fire characteristics in sloped tunnels. Int. J. Therm. Sci. 2024, 206, 109269. [Google Scholar] [CrossRef]
- Wang, K.; Cao, K. Optimization of ventilation performance in large-section highway tunnels: The role of deflector shields in jet fan systems. Buildings 2025, 15, 2859. [Google Scholar] [CrossRef]
- Zou, J.; Wu, P.; Chen, J.; Fan, W.; Xu, Y. Empowering underground utility tunnel operation and maintenance with data intelligence: Risk factors, prospects, and challenges. Struct. Durab. Health Monit. 2025, 19, 441–471. [Google Scholar] [CrossRef]
- Qi, D.; Yang, S.; Shu, C.; Zhang, X.; Wang, L.L.; Athienitis, A. An exploratory study on road tunnel with semi-transparent photovoltaic canopy—From energy saving and fire safety perspectives. Build. Simul. 2021, 15, 537–548. [Google Scholar] [CrossRef]
- Naji, A.M.; Emad, M.Z.; Rehman, H.; Yoo, H. Geological and geomechanical heterogeneity in deep hydropower tunnels: A rock burst failure case study. Tunn. Undergr. Space Technol. 2019, 84, 507–521. [Google Scholar] [CrossRef]
- Zhao, J.-S.; Jiang, Q.; Pei, S.-F.; Chen, B.-R.; Xu, D.-P.; Song, L.-B. Microseismicity and focal mechanism of blasting-induced block falling of intersecting chamber of large underground cavern under high geostress. J. Cent. South Univ. 2023, 30, 542–554. [Google Scholar] [CrossRef]
- Hausberger, L.; Flora, M.; Gschösser, F. Environmental impacts of road traffic and route variants: An accurate way to support decision-making processes of mountain roads and tunnels in austria. Buildings 2025, 15, 1669. [Google Scholar] [CrossRef]
- Tung, P.-W.; Chung, H.-C.; Kawabata, N.; Seike, M.; Hasegawa, M.; Chien, S.-W.; Shen, T.-S. Numerical study of smoke distribution in inclined tunnel fire ventilation modes considering traffic conditions. Buildings 2023, 13, 714. [Google Scholar] [CrossRef]
- Chen, Z.; Zhao, S.; Wang, S.; Guo, Y.; Sun, B.; Chen, W.; Guo, C. Forced-exhaust-air curtain dust removal measures of tunnel blasting dust based on CFD and orthogonal experiments. Tunn. Undergr. Space Technol. 2025, 155, 106223. [Google Scholar] [CrossRef]
- Song, X.-Y.; Lu, Q.-C.; Peng, Z.-R. Spatial distribution of fine particulate matter in underground passageways. Int. J. Environ. Res. Public Health 2018, 15, 1574. [Google Scholar] [CrossRef]
- Liu, Z.; Gao, X.; Huang, X.; Xie, Y.; Gao, J.; Yang, X.; He, Q. Evaluation on solar-biogas heating system for buildings: Thermal characteristics and role of heat storage sectors. Appl. Energy 2025, 390, 125817. [Google Scholar] [CrossRef]
- Güsewell, J.; Eltrop, L.; Hufendiek, K. Seasonal flexibilisation: A solution for biogas plants to improve profitability. Adv. Appl. Energy 2021, 2, 100034. [Google Scholar] [CrossRef]
- Mangriotis, M.-D.; Nguyen, P.; MacBeth, C.; Monteleone, V.; Bayrakci, G.; Clare, M. A review of the ground seismic vibrations induced by wind-turbines: Controls, issues and opportunities. J. Sound Vib. 2025, 119576. [Google Scholar] [CrossRef]
- Kennedy, K.M.; Ruggles, T.H.; Rinaldi, K.; Dowling, J.A.; Duan, L.; Caldeira, K.; Lewis, N.S. The role of concentrated solar power with thermal energy storage in least-cost highly reliable electricity systems fully powered by variable renewable energy. Adv. Appl. Energy 2022, 6, 100091. [Google Scholar] [CrossRef]
- Taghavi, A.; Niknam, T.; Gitizadeh, M.; Shojaeiyan, S. Techno-economic assessment of coordinated energy management in multi-vector systems: Cost-effective integration of underground storage and ai-based maritime scheduling. Energy Convers. Manag. 2025, 346, 120422. [Google Scholar] [CrossRef]
- Ebrahimi, A.; Ghasemi, K.; Akbari, A.; Kazemzadeh, Y.; Azin, R. Hydrogen energy system and underground hydrogen storage in depleted reservoirs. Pet. Res. 2025, 10, 501–528. [Google Scholar] [CrossRef]
- Chen, F.; Wang, Z.; Meng, X.; Shi, X.; Ma, H.; Yang, C.; Li, H. Inversion of creep parameters and their application in underground salt cavern energy storage systems for enhancing wind power integration. Int. J. Electr. Power Energy Syst. 2024, 162, 110237. [Google Scholar] [CrossRef]
- Xie, Y.; Yao, G.; Yuan, Z. Study on Maximum temperature under multi-factor influence of tunnel fire based on machine learning. Buildings 2025, 15, 3401. [Google Scholar] [CrossRef]
- Schmidt-Polończyk, N. Full-scale experimental study on influence of smoke on pedestrian movement during evacuation in road tunnel. Buildings 2024, 14, 3654. [Google Scholar] [CrossRef]
- Tan, Y.; Wang, K.; Zhang, Z.; Lu, Z.; Zhang, H. Study on the effect of natural wind on the smoke spread law of extra-long tunnel fires with inclined shafts for air supply and exhaust. Buildings 2024, 14, 1516. [Google Scholar] [CrossRef]
- Yi, L.; Lan, S.; Wang, X.; Bu, R.; Zhao, J.; Zhou, Y. Study on the air inlet velocity and temperature distribution in an inclined tunnel with single shaft under natural ventilation. Buildings 2023, 13, 842. [Google Scholar] [CrossRef]
- Guo, N.; Liu, J.; Di, K.; Gu, K.; Qiao, J. A hybrid attention model based on first-order statistical features for smoke recognition. Sci. China Technol. Sci. 2024, 67, 809–822. [Google Scholar] [CrossRef]
- Liang, C.; Yuan, Y.; Yuan, Z.; Yu, N. Smoke exhaustion characteristics and critical shaft height of natural ventilation in slope tunnel fires. J. Therm. Sci. 2025, 34, 789–800. [Google Scholar] [CrossRef]
- Li, Q.; Kang, J.; Wang, Y.; Feng, Y. Superheated steam similarity simulation on longitudinal distribution of maximum smoke temperature rise in tunnel fires. Therm. Sci. Eng. Prog. 2023, 37, 101550. [Google Scholar] [CrossRef]
- Yan, X.; He, Q. Numerical study on the influence factors of thermal-smoke front spread length in the semi-transverse ventilated underground traffic link tunnels. Therm. Sci. Eng. Prog. 2025, 59, 103364. [Google Scholar] [CrossRef]
- Yan, X.; Fang, X.; Cheung, S.C.P.; Li, Z. Numerical study on the maximum temperature rise and thermal-smoke front spread length in the upstream of semi-transverse ventilated underground traffic link tunnels. Int. Commun. Heat Mass Transf. 2023, 149, 107096. [Google Scholar] [CrossRef]
- Zhao, P.; Yuan, Z.; Liang, C.; Yuan, Y.; Wang, R. Smoke control strategy and design criterion in tunnel fire hazards using point extraction ventilation: Experimental analysis and theoretical modeling. Fire Technol. 2024, 60, 3903–3925. [Google Scholar] [CrossRef]
- Yan, G.; Wang, M.; Yu, L.; Duan, R.; Xia, P. Effects of ambient pressure on smoke movement patterns in vertical shafts in tunnel fires with natural ventilation systems. Build. Simul. 2020, 13, 931–941. [Google Scholar] [CrossRef]
- Beard, A.N. Fire safety in tunnels. Fire Saf. J. 2009, 44, 276–278. [Google Scholar] [CrossRef]
- Li, H.; Tang, F. Numerical and experimental study on the critical velocity and smoke maximum temperature in the connected area of branch tunnel. Build. Simul. 2022, 15, 525–536. [Google Scholar] [CrossRef]
- Yuan, W.; Ji, W.; Zhang, J.; Du, T.; Yuan, Y. Examining smoke control in fires occurring in railroad tunnels: A review. J. Therm. Anal. Calorim. 2024, 149, 13–39. [Google Scholar] [CrossRef]
- Zhang, X.; Luo, M.; Tao, L.; Zeng, Y.; Yuan, Y.; Zhang, Z. Analysis of the influence of exhaust vent leakage on the efficiency of tunnel smoke evacuation. Fire Saf. J. 2025, 154, 104399. [Google Scholar] [CrossRef]
- Hong, Y.; Kang, J.; Fu, C. Rapid prediction of mine tunnel fire smoke movement with machine learning and supercomputing techniques. Fire Saf. J. 2022, 127, 103492. [Google Scholar] [CrossRef]
- Guo, X.; Lin, Z.; Yang, D.; Yang, Y.; Jiang, L.; Liu, Y. Experimental evaluation on PID-based adaptive longitudinal ventilation control of tunnel fire smoke. J. Wind Eng. Ind. Aerodyn. 2024, 254, 105884. [Google Scholar] [CrossRef]
- Cai, G.; Zheng, X.; Wen, H.; Guo, J.; Chen, C.; Liu, Y.; Gao, W. Numerical study on the transverse offset of fire smoke characteristics induced by the tunnel combustion source and blocking. Case Stud. Therm. Eng. 2025, 73, 106453. [Google Scholar] [CrossRef]
- Lin, J.; Li, S.; Lu, S.; Chen, G.; Xue, Z. Large-scale experimental study on the average temperature distribution model of fire smoke under mechanical ventilation in the flat space. Int. J. Therm. Sci. 2024, 204, 109228. [Google Scholar] [CrossRef]
- Xia, C.; Wang, S.; Chen, W.; Lin, Z.; Zhao, D.; Ying, Y.; Xu, B. A novel indicator for equivalent mean air temperature within the tunnel considering time-varying ventilation wind speeds: Calculation and application. Int. J. Therm. Sci. 2024, 204, 109194. [Google Scholar] [CrossRef]
- Ding, Y.; Mei, J.; Li, X.; Lu, K.; Li, C. A dimensionless model for smoke backflow length prediction with mobile ventilation in tunnel fire. Therm. Sci. Eng. Prog. 2024, 56, 103026. [Google Scholar] [CrossRef]
- Delichatsios, M.A. The flow of fire gases under a beamed ceiling. Combust. Flame 1981, 43, 1–10. [Google Scholar] [CrossRef]
- Bailey, J.L.; Forney, G.P.; Tatem, P.A.; Jones, W.W. Development and validation of corridor flow submodel for CFAST. J. Fire Prot. Eng. 2002, 12, 139–161. [Google Scholar] [CrossRef]
- Wang, J.; Fan, Y.; Wei, Y.; Jiang, X.; Lu, K. Effect of the blockage ratio on the smoke extraction efficiency in tunnel fires with natural ventilation. Tunn. Undergr. Space Technol. 2021, 117, 104165. [Google Scholar] [CrossRef]
- Kayili, S.; Yozgatligil, A.; Cahit Eralp, O. An experimental study on the effects of blockage ratio and ventilation velocity on the heat release rate of tunnel fires. J. Fire Sci. 2011, 29, 555–575. [Google Scholar] [CrossRef]
- Hu, L.H.; Fong, N.K.; Yang, L.Z.; Chow, W.K.; Li, Y.Z.; Huo, R. Modeling fire-induced smoke spread and carbon monoxide transportation in a long channel: Fire Dynamics Simulator comparisons with measured data. J. Hazard. Mater. 2007, 140, 293–298. [Google Scholar] [CrossRef]
- Yang, S.; Alrawashdeh, H.; Zhang, C.; Qi, D.; Wang, L.; Stathopoulos, T. Wind effects on air curtain performance at building entrances. Build. Environ. 2019, 151, 75–87. [Google Scholar] [CrossRef]
- Krajewski, G.; Węgrzyński, W. Air curtain as a barrier for smoke in case of fire: Numerical modelling. Bull. Pol. Acad. Sci. Tech. Sci. 2015, 63, 145–153. [Google Scholar] [CrossRef]
- Yu, L.-X.; Liu, F.; Beji, T.; Weng, M.-C.; Merci, B. Experimental study of the effectiveness of air curtains of variable width and injection angle to block fire-induced smoke in a tunnel configuration. Int. J. Therm. Sci. 2018, 134, 13–26. [Google Scholar] [CrossRef]
- Severino, G.; Elicer-Cortés, J.C.; Fuentes, A. Characterization of a diffusion flame inside a scale tunnel using double stream-twin jets air curtains. Fire Saf. J. 2013, 62, 264–271. [Google Scholar] [CrossRef]
- Gao, D.; Li, T.; Mei, X.; Chen, Z.; You, S.; Wang, Z.; Wang, K.; Lin, P. Effectiveness of smoke confinement of air curtain in tunnel fire. Fire Technol. 2020, 56, 2283–2314. [Google Scholar] [CrossRef]
- Jung, U.-H.; Kim, S.; Yang, S.-H.; Kim, J.-H.; Choi, Y.-S. Numerical study of air curtain systems for blocking smoke in tunnel fires. J. Mech. Sci. Technol. 2016, 30, 4961–4969. [Google Scholar] [CrossRef]
- Viegas, J.C. Saltwater experiments with air curtains for smoke control in the event of fire. J. Build. Eng. 2016, 8, 243–248. [Google Scholar] [CrossRef]
- Viegas, J.C.; Oliveira, F.; Aelenei, D. Experimental study on the aerodynamic sealing of air curtains. Fluids 2018, 3, 49. [Google Scholar] [CrossRef]
- Viegas, J.C.; Cruz, H. Air curtains combined with smoke exhaust for smoke control in case of fire: Full-size experiments. Fire Technol. 2019, 55, 211–232. [Google Scholar] [CrossRef]
- Hu, L.; Liu, S.; Wu, L. Flame radiation feedback to fuel surface in medium ethanol and heptane pool fires with cross air flow. Combust. Flame 2013, 160, 295–306. [Google Scholar] [CrossRef]
- McGrattan, K.B.; McDermott, R.J.; Weinschenk, C.G.; Forney, G.P. Fire Dynamics Simulator—Technical Reference Guide; National Institute of Standards and Technology: Gaithersburg, MD, USA, 2000. [Google Scholar]
- Lan, B.; Li, Y.-R.; Li, P.-C.; Gong, H.-F. Numerical simulation of the chimney effect on smoke spread behavior in subway station fires. Case Stud. Therm. Eng. 2022, 39, 102446. [Google Scholar] [CrossRef]
- McGrattan, K.B.; Forney, G.P.; Floyd, J.E.; Hostikka, S.A. Fire Dynamics Simulator (Version 2)—User’s Guide; National Institute of Standards and Technology: Gaithersburg, MD, USA, 2001. [Google Scholar]
- Li, L.; Li, Y.; Wu, Z.; Xu, P.; Peng, X.; Wang, H.; Fan, C. Window ejected thermal plume dispersion and recirculation behavior in urban street canyon with different building height ratios under wind. Case Stud. Therm. Eng. 2021, 27, 101220. [Google Scholar] [CrossRef]
- Weng, M.C.; Yu, L.X.; Liu, F.; Nielsen, P.V. Full-scale experiment and CFD simulation on smoke movement and smoke control in a metro tunnel with one opening portal. Tunn. Undergr. Space Technol. 2014, 42, 96–104. [Google Scholar] [CrossRef]


Disclaimer/Publisher’s Note: The statements, opinions and data contained in all publications are solely those of the individual author(s) and contributor(s) and not of MDPI and/or the editor(s). MDPI and/or the editor(s) disclaim responsibility for any injury to people or property resulting from any ideas, methods, instructions or products referred to in the content. |
© 2026 by the authors. Licensee MDPI, Basel, Switzerland. This article is an open access article distributed under the terms and conditions of the Creative Commons Attribution (CC BY) license.