You are currently viewing a new version of our website. To view the old version click .
Buildings
  • Article
  • Open Access

2 November 2025

Mechanical Analysis and Prototype Testing of Prestressed Rock Anchors

,
,
,
,
,
and
1
Department of Engineering Mechanics, Nanchang University, 999 Xuefu Avenue, Nanchang 330031, China
2
Project Management Office of Shanghai-Kunming Expressway, Liyuan to Dongxiang Section Reconstruction and Expansion, 13 Xingye Avenue, Shangrao 334100, China
3
Jiangxi Gandong Road & Bridge Construction Group Ltd., 1288 Yingbin Avenue, Fuzhou 344000, China
4
Jiangxi Province Traffic Construction Engineering Quality Supervision Administration, 218 Gaoxin Third Road, Nanchang 330069, China
Buildings2025, 15(21), 3952;https://doi.org/10.3390/buildings15213952 
(registering DOI)
This article belongs to the Section Building Structures

Abstract

This study primarily investigates the mechanical performance of prestressed anchor foundations. Based on the assumptions of continuity, homogeneity, and isotropy of the anchor foundation and anchoring materials, a simplified elastic analysis model was developed. Using the superposition principle, the working stresses under vertical loads and bending moments were calculated, allowing for the determination of the maximum working stresses within the anchors and the foundation. Additionally, the distribution of bond strength of the prestressed tendons was analyzed, and the concept of effective anchorage length was introduced. The reliability of the model was validated through prototype testing, with the measured free segment strain values showing a high degree of consistency with theoretical calculations, with errors within 6.5%. Empirical data on ultimate bearing capacity and bond characteristics were also obtained. By integrating numerical calculations with experimental results, the performance of the anchoring system under extreme and specialized loading conditions was analyzed. The experimental results indicated that the failure modes of all anchor foundations were characterized by bond failure at the interface between the anchor and the surrounding rock mass. Based on the experimental data, a reasonable anchorage length satisfying design strength requirements was proposed. The findings provide a theoretical foundation and practical guidance for the design and application of prestressed anchor foundations in structures such as wind turbine towers.

1. Introduction

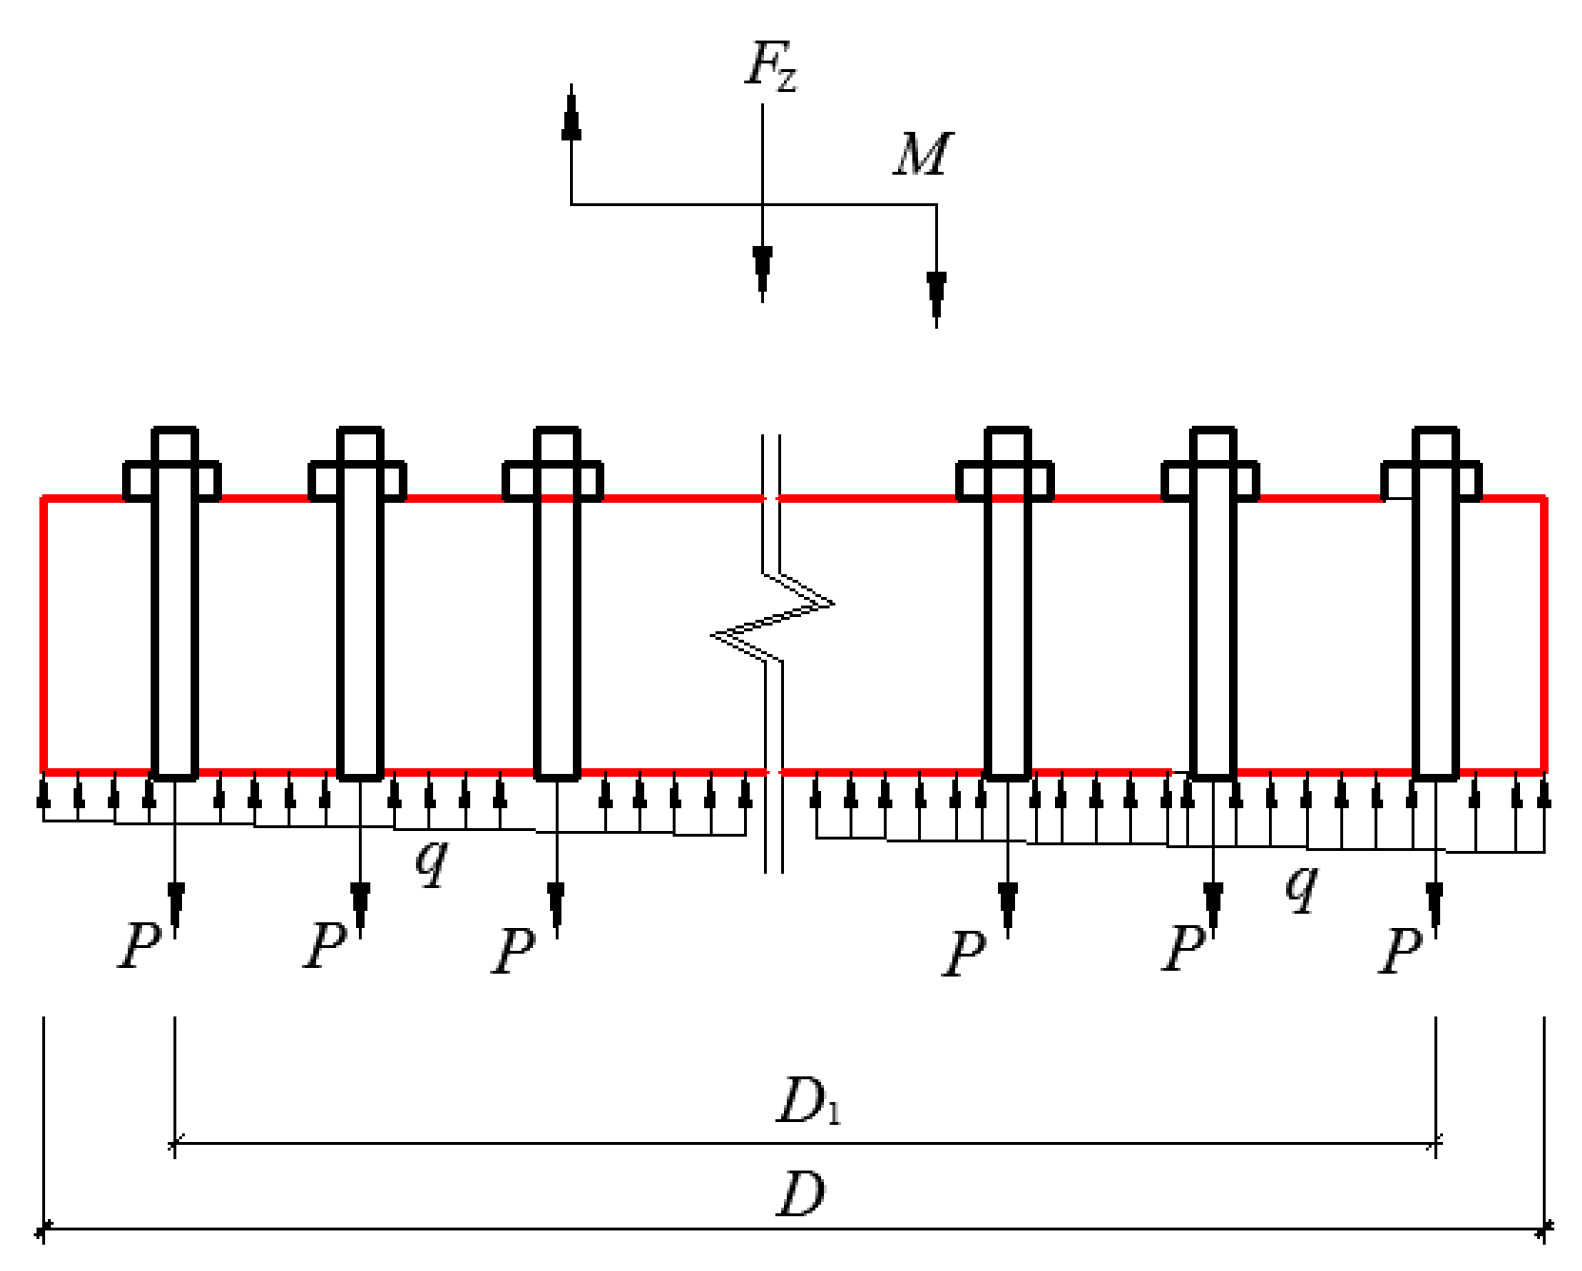
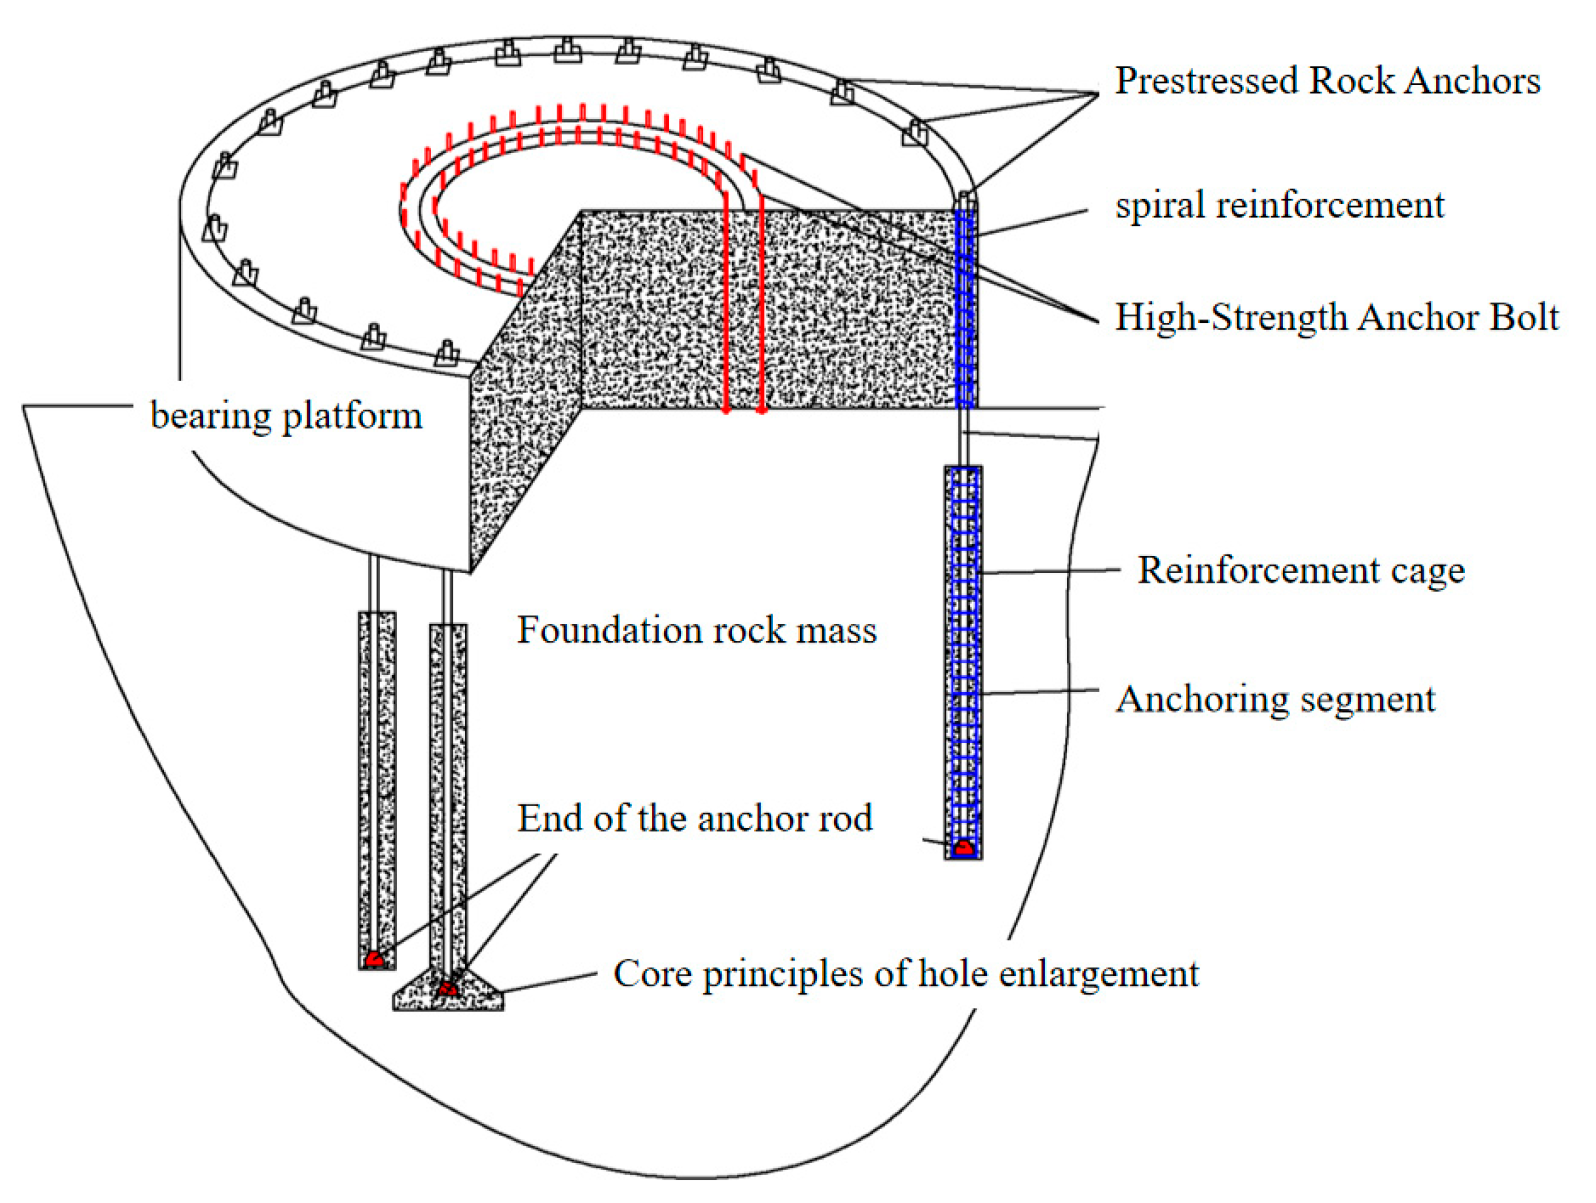
Prestressed rock anchors are widely utilized in various engineering projects, particularly in high-rise buildings, bridges, tunnels [,,,], and wind power foundations []. The rationality of their design directly influences the safety and economic viability of these structures. As the scale of engineering projects continues to expand, the design and analysis of anchor foundations face increasingly complex challenges. To ensure the long-term stability and safety of these structures, it is essential to conduct in-depth studies on the mechanical behavior of anchors. The schematic diagram of the prestressed rock anchor foundation for a certain wind turbine tower is shown in Figure 1.
Figure 1. Schematic diagram of the foundation for prestressed rock anchors.
In recent years, significant advancements have been made by researchers both domestically and internationally in the design and application of prestressed rock anchors. Studies have shown that the bearing capacity of anchors is closely related to various factors, including material properties [], anchorage depth [], and the bond strength between the anchorage body and surrounding rock [,,,]. For instance, Wang et al. [] investigated the performance of frame prestressed anchor structures under seismic loading and found that increases in anchor prestress and elastic modulus reduce seismic displacements in slopes, while increased anchor inclination leads to greater seismic deformation. Zeng et al. [] focused on frame-supported slopes, treating prestress as a uniformly distributed force acting on the slope surface, and calculated the additional stresses induced by prestress, demonstrating that prestressed anchors significantly enhance slope stability, particularly in homogeneous soils with circular sliding surfaces. Zhao et al. [] established a stability analysis model for loess fill slopes supported by frame prestressed anchors based on upper limit plasticity analysis, considering the tensile strength cut-off characteristics of the soil. Their results indicated that neglecting fissures in loess could overestimate the stability of fill slopes, while the anchorage structure significantly improves the stability of fissured loess slopes. Ye et al. [] developed a seismic analysis model for slopes reinforced with prestressed anchors based on the principles of soil and structural dynamics, obtaining the dynamic response of reinforced slopes under horizontal seismic loads. This model can approximate the soil pressure distribution, displacement response of the reinforced structure, and axial force response of the prestressed anchors. Nakamoto et al. [] studied the mechanical behavior of soil nails reinforced with prestressed panels, finding that this reinforcement effectively prevents slope deformation and failure, with greater prestress leading to improved performance. Wang H [] examined the failure mechanisms of composite retaining structures using soil nails and prestressed anchors, identifying the magnitude of anchoring force as a key factor controlling the performance of the entire retaining system, with prestressed anchors being particularly sensitive to the stiffness of the concrete surface.
In the context of rock impact resistance, Fu et al. [] analyzed the effects of anchoring materials, prestress, and anchoring methods on crack propagation patterns and dynamic mechanical properties of anchored rock masses. They established a lateral impact mechanics model for anchored rock masses and proposed reasonable recommendations for anchoring support in deep impact rock tunnels, providing theoretical guidance for the design of anchor support in deep rock blasting tunnels. Kang et al. [] created a fractured rock mass model using the Continuum Discontinuum Element Method (CDEM) and conducted uniaxial compression tests under varying anchor parameters, analyzing the effects of anchor spacing and prestress. Jiang et al. [] combined the Discrete Element Method (DEM) and Finite Difference Method (FDM) to study the reinforcement mechanisms and quantitative effects of prestressed and non-prestressed grouted rock anchors in tunnels, revealing significant improvements in the stress state of the rock, with prestressed anchors greatly reducing displacement increases in the reinforced area.
Furthermore, advancements in computer technology have made numerical simulation methods, such as finite element analysis, important tools for studying anchor behavior [,,,]. In anchor design, the selection of an appropriate anchorage length is critical to ensuring its pullout capacity. Existing research indicates that anchorage length not only affects the bearing capacity of anchors but is also closely related to the properties of the surrounding soil, loading conditions, and the quality of anchor construction [,]. Teng et al. [] present a novel approach that incorporates nuclear magnetic resonance (NMR) measurement and triaxial loading chamber to accomplish the laboratory in situ continuous observation of the pore-fracture evolution in the coal-rock samples during triaxial compression. Therefore, optimizing anchorage length under different conditions is particularly important.
In summary, research on prestressed rock anchors encompasses multiple aspects, including material properties [], mechanical models [], design methods, and experimental validation [,].
This study constructs a simplified elastic analysis model based on the assumptions of continuity, homogeneity, and isotropy of the concrete foundation and anchorage material. The working stresses under vertical loads and bending moments are calculated using the superposition principle, ultimately identifying the maximum working stress values for the anchor and the foundation. The theoretical section further investigates the distribution of bond strength on prestressed anchors and introduces the concept of effective anchorage length. Subsequently, the model is validated through prototype pull-out tests conducted on-site at the Xiangshan Wind Farm in Xunwu, Jiangxi Province. These tests verify the model’s reliability and provide empirical data on ultimate bearing capacity and bond characteristics. The comprehensive analysis combining theoretical derivations and experimental measurements facilitates the proposal of an optimized anchorage length, thereby offering a theoretical foundation and practical guidance for the application of prestressed rock anchors.

2. Analysis of Mechanical Behavior of Prestressed Rock Anchors

2.1. Elastic Analytical Solution of Prestressed Rock Anchors Under Uplift Force

Assuming that both the concrete pedestal and the anchor materials satisfy the conditions of continuity, uniformity, and isotropy, we define the external diameter of the pedestal as D , the diameter of the anchor circle as D 1 , the number of anchors as n , and the diameter of each anchor as d . The prestress of a single anchor is denoted as P , while the vertical load acting on the upper part of the pedestal (primarily comprising the self-weight of the tower, nacelle, blades, pedestal, and ancillary facilities) is represented by F z . The static equivalent moment acting on the cross-section of the pedestal is denoted as M . Considering the interaction between the foundation and the pedestal, the distributed load system is represented as q . We isolate the pedestal and anchor components as the objects of study and establish a simplified model for the elastic analysis of the prestressed rock anchor foundation, as shown in Figure 2.
Figure 2. Schematic of mechanical analysis of the prestressed rock anchor foundation.
Let the elastic modulus of the concrete pedestal be E 1 and that of the anchors be E 2 . We first solve for the working stresses under the separate actions of vertical load and moment. We then apply the principle of superposition to determine the maximum working stresses for both the anchors and the pedestal. When the vertical load acts alone, we assume that the contact stress between the pedestal and the foundation is uniformly distributed, leading to the compressive stress in the pedestal and the working stress in the anchors being expressed as
σ N ( 1 ) = F z + n P π 4 D 2 ,   σ N ( 2 ) = P π 4 d 2 ,
respectively.
When the moment M acts alone, we assume that the moment transferred to the pedestal is M 1 and the moment transferred to the anchors is M 2 ; thus, we have
M = M 1 + M 2 .
According to the bending stress theory for beams under pure bending, and in line with the fundamental assumptions proposed in this study, we can get
M 1 = A 1 σ d z d y = A 1 E 1 y 2 ρ d z d y = E 1 ρ 0 2 π 0 D / 2 r 2 cos 2 θ r d r d θ = E 1 ρ π 64 D 4 ,   M 2 = A 2 E 2 y 2 ρ d y d z ,
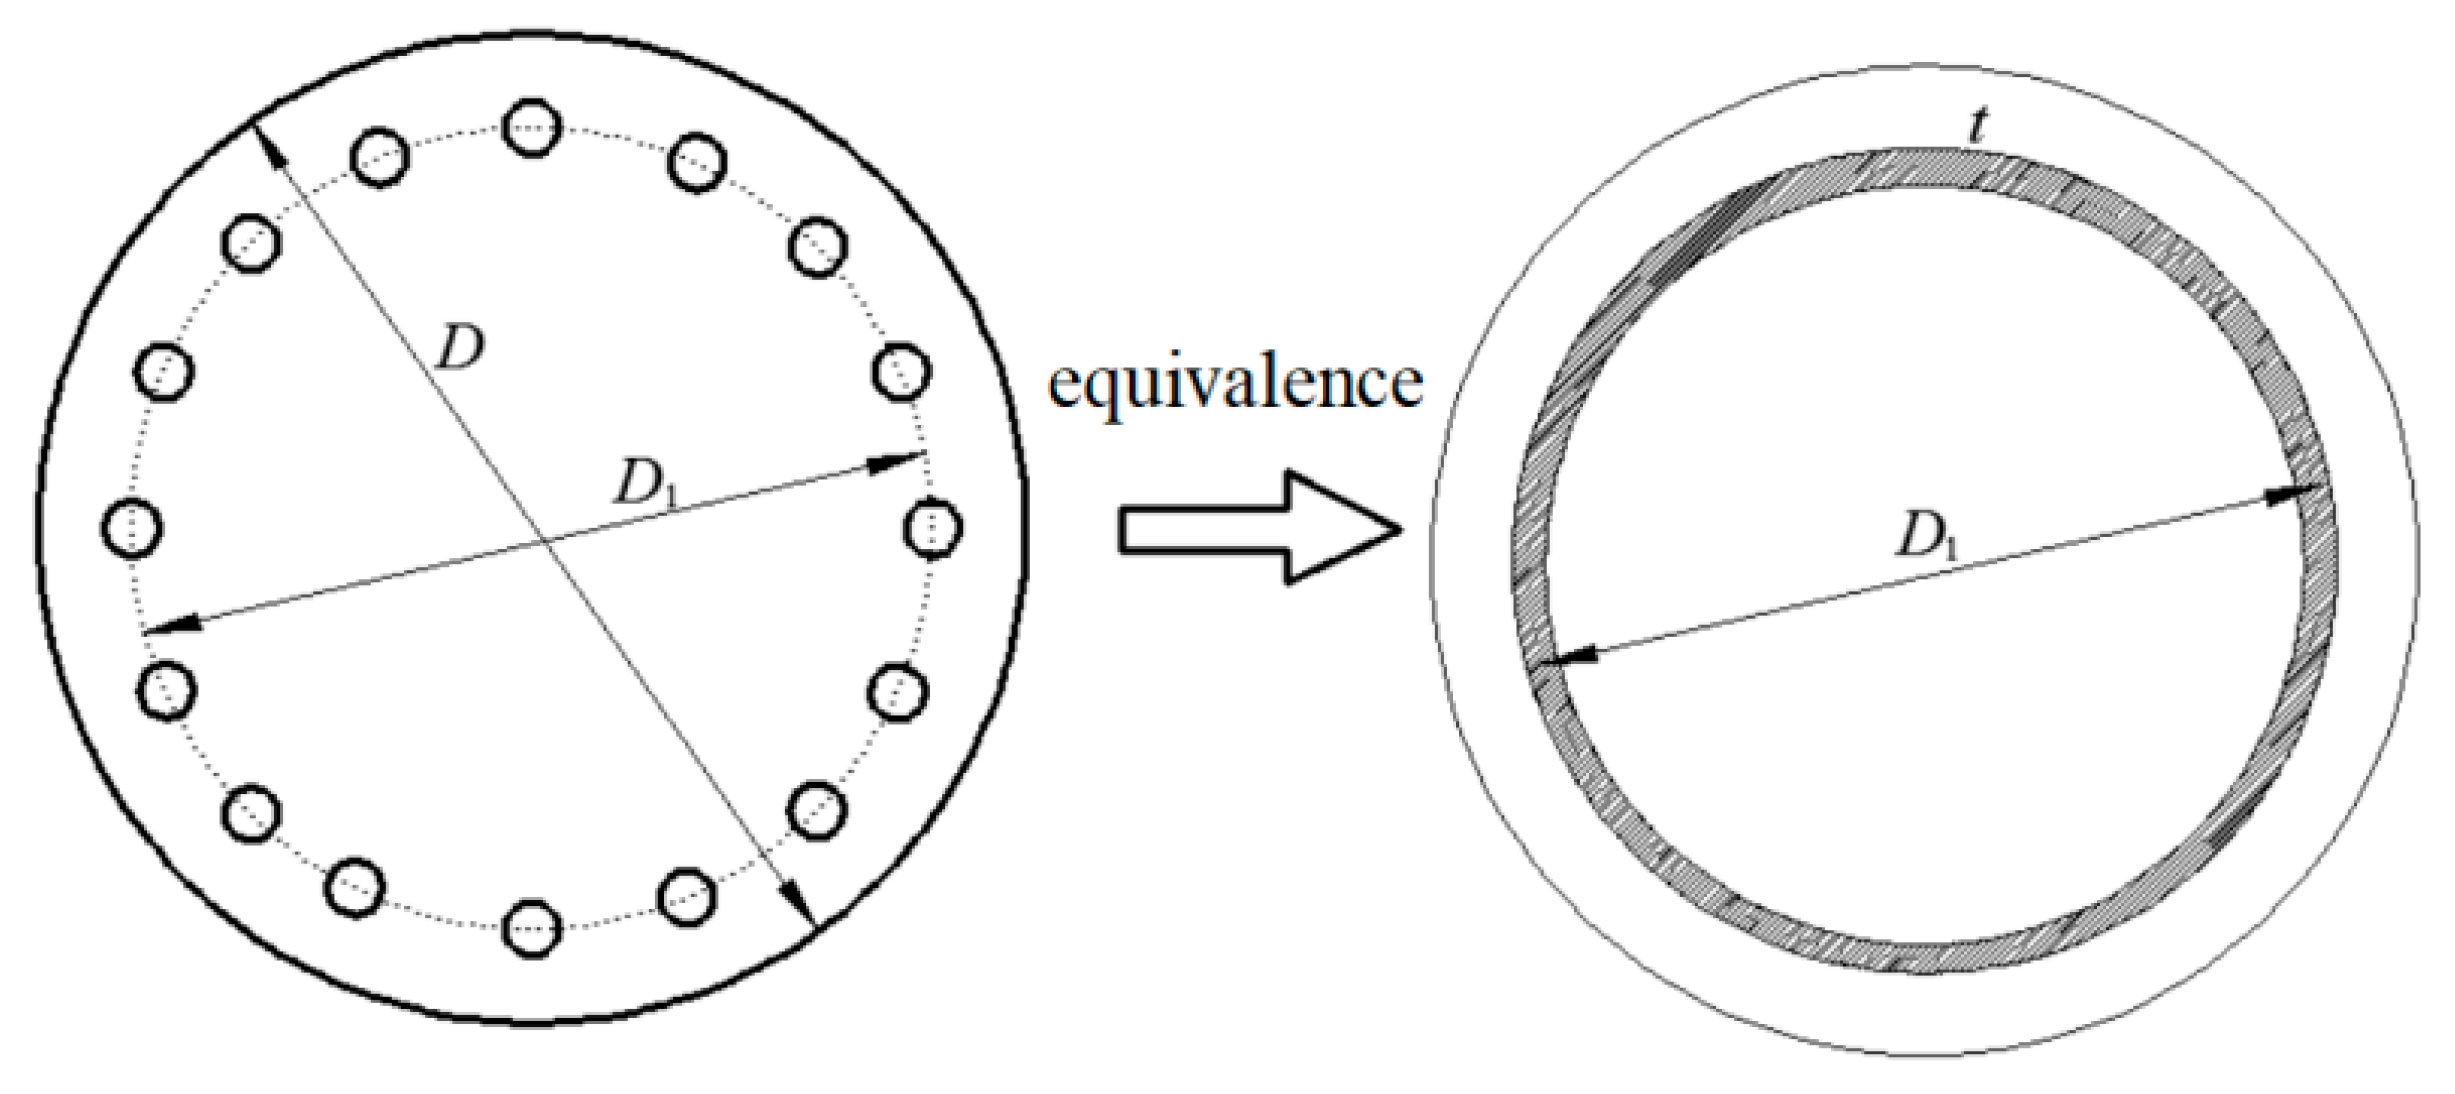
where ρ is the radius of curvature of the composite cross-section. The integral region A 2 in Equation (3) refers to the area of the anchor circle. To simplify calculations, we can statically equivalate the anchor circle to a steel ring, as illustrated in Figure 3. The average diameter of the equivalent steel ring is taken as D 1 , and its thickness is denoted as t, leading to the relations
π D 1 t = π 4 d 2 n     t = d 2 n 4 D 1 .
Figure 3. Equivalent schematic of the anchor circle.
From Equations (3) and (4), we obtain
M 2 = E 2 ρ 0 2 π r 2 cos 2 θ t r d θ = E 2 ρ ( D 1 2 ) 3 t π .
Combining Equations (2)–(5), we find
1 ρ = M E 1 π 64 D 4 + E 2 π 8 t D 1 3 .
Consequently, the maximum stresses in the pedestal and anchors under the moment are expressed as
σ M ( 1 ) = E 1 1 ρ D 2 = M π 32 D 3 + π n d 2 E 2 16 D E 1 D 1 2 ,   σ M ( 2 ) = E 2 1 ρ D 1 2 = M E 1 π 32 D 1 E 2 D 4 + π n d 2 D 1 16 .
Applying the principle of superposition, we can derive the maximum and minimum compressive stresses in the prestressed rock anchor foundation pedestal as
σ max ( 1 ) = σ N ( 1 ) σ M ( 1 ) = F z + n P π 4 D 2 M π 32 D 3 + π n d 2 E 2 16 D E 1 D 1 2 ,
σ min ( 1 ) = σ N ( 1 ) + σ M ( 1 ) = F z + n P π 4 D 2 + M π 32 D 3 + π n d 2 E 2 16 D E 1 D 1 2 ,
Thus, the maximum uplift force of the prestressed rock anchors is
σ max ( 2 ) = σ N ( 2 ) + σ M ( 2 ) = P π 4 d 2 + M E 1 π 32 D 1 E 2 D 4 + π n d 2 D 1 16 .

2.2. Design of Prestressed Rock Anchors Based on Elastic Analysis

The design loads for the rock anchor foundation are provided by the design institute, with the load conditions summarized in Table 1.
Table 1. Design load summary.
The initial proposed anchorage depth is 6 m, with a pedestal height of 2 m, a pedestal radius of 6 m, and an anchor circle radius of 5.5 m. The concrete strength is specified as C40, with an elastic modulus E 1 = 32.5   GPa . The diameter of the anchorage body is taken as 180 mm, while the anchor diameter is set at 50 mm. The standard yield strength is 930 MPa, the design tensile strength is 770 MPa, and the ultimate strength is 1080 MPa, with an elastic modulus E 2 = 200   GPa . The yield load for a single anchor is calculated to be 1825 kN, with the load at the design tensile strength being 1511 kN and the ultimate load being 2119 kN. The bond strength between the rock and concrete is assumed to be 0.6 MPa.
Using the data from Table 1 and the parameters outlined above, the maximum compressive stress in the pedestal and the maximum tensile stress can be calculated using Equations (8) and (9). The maximum uplift force of the prestressed rock anchors can be derived from Equation (10).
(1)
Rare Earthquake Condition
The results presented in Table 2 indicate that under rare earthquake conditions, to prevent tensile stress in the pedestal, a prestress of 1500 kN requires 36 anchors, resulting in a working internal force of 1506 kN. The corresponding foundation bearing capacity must reach 1080 kPa. If a minimal tensile stress in the pedestal is permissible, for example, with a maximum tensile stress of 0.301 MPa, only 16 anchors are needed, with a corresponding prestress of 1200 kN, and the foundation bearing capacity should be at least 780 kPa.
Table 2. Anchor calculation results under rare earthquake condition.
(2)
Rare Earthquake Condition
The calculations in Table 3 show that under extreme load conditions, to avoid tensile stress in the pedestal, a prestress of 1400 kN requires 24 anchors, resulting in a working internal force of 1404 kN, which provides a safety margin. The corresponding foundation bearing capacity must be at least 728 kPa. If the site’s foundation bearing capacity cannot achieve 728 kPa, appropriate foundation treatment measures should be implemented to improve the bearing capacity. If a minimal tensile stress is acceptable, such as a maximum tensile stress of 0.155 MPa, only 12 anchors are required, with a corresponding prestress of 1200 kN.
Table 3. Anchor calculation results under extreme load condition.
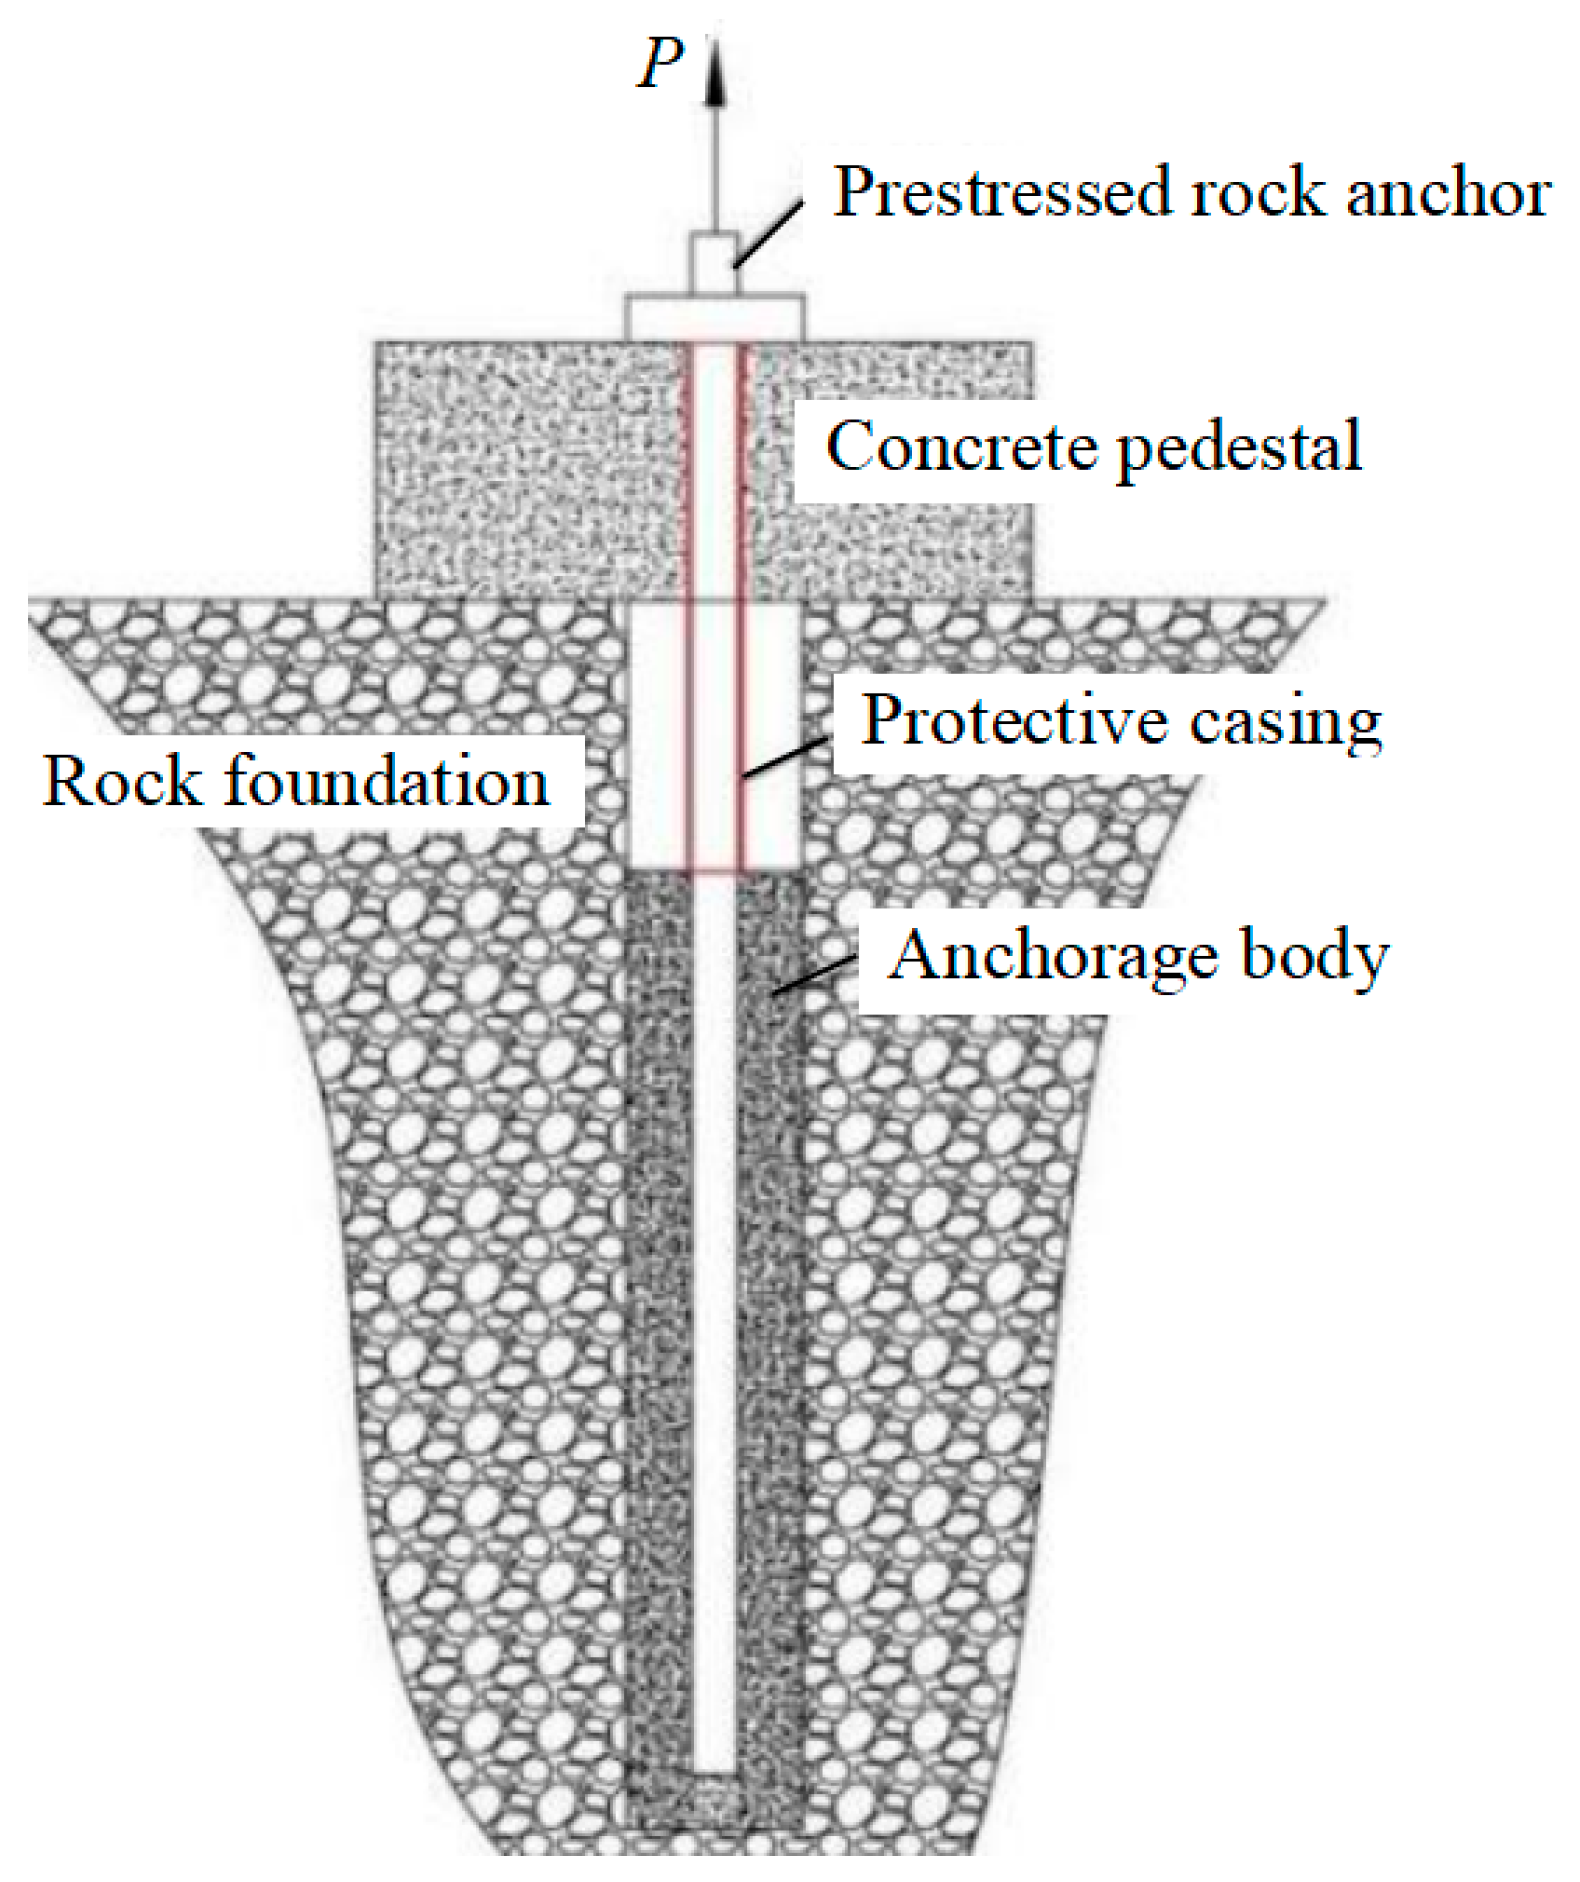
Figure 4 illustrates the configuration of a single prestressed rock anchor. The load transfer mechanism operates as follows: the wind turbine tower transmits loads to the concrete pedestal through high-strength anchors. The concrete pedestal, in turn, transfers these loads to the anchorage body, which subsequently passes the loads to the rock foundation. This load transfer process is straightforward and clearly defined.
Figure 4. Structural diagram of prestressed rock anchor.
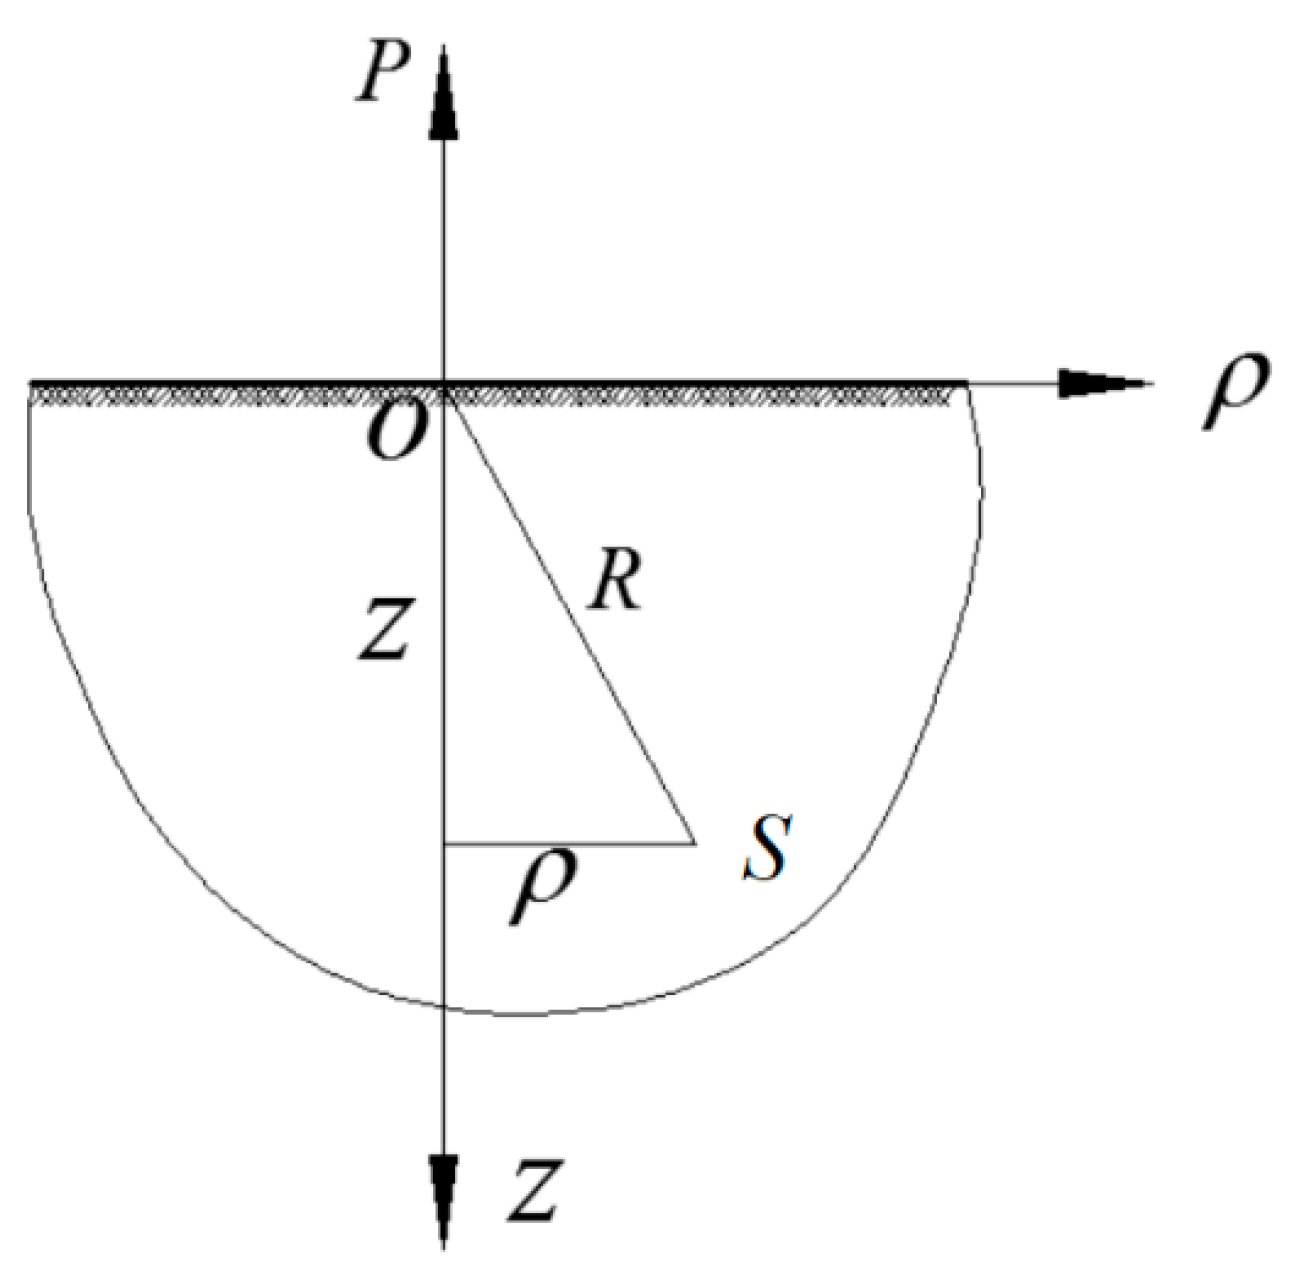
For the spatial axisymmetric problem in Figure 5, the elastic equations for the stress components [] are given by:
σ ρ = E 1 + ν ( ν 1 2 ν θ + u ρ ρ ) ,   σ φ = E 1 + ν ( ν 1 2 ν θ + u ρ ρ ) , σ z = E 1 + ν ( ν 1 2 ν θ + u z z ) ,   τ z ρ = E 2 ( 1 + ν ) ( u ρ z + u z ρ ) .
Figure 5. Sketch of theoretical calculations without considering the role of bearing platforms.
The displacement components must satisfy the following fundamental differential equations:
E 2 ( 1 + ν ) ( 1 1 2 ν θ ρ + 2 u ρ u ρ ρ 2 ) + f ρ = 0 ,   E 2 ( 1 + ν ) ( 1 1 2 ν θ z + 2 u z ) + f z = 0 ,
where θ = u ρ ρ + u ρ ρ + u z z , 2 = 2 ρ 2 + 1 ρ ρ + 2 z 2 , and ν is the Poisson’s ratio of the anchorage material. Since body forces are neglected, the above equations can be simplified to
1 1 2 ν θ ρ + 2 u ρ u ρ ρ 2 = 0 ,   1 1 2 ν θ z + 2 u z = 0 .
The stress boundary conditions for the problem are ( σ z ) z = 0 , ρ 0 = 0 and ( τ z ρ ) z = 0 , ρ 0 = 0 . Additionally, near the origin O on the surface z = 0 , we can define a small boundary area where surface force components act, and the resultant force is the concentrated force F applied at point O , with the resultant moment equal to zero. Applying Saint-Venant’s principle, we consider the equilibrium conditions of a plate that extends from z = 0 to z = z removed from the body:
F z = 0 ,   0 σ z 2 π ρ d ρ P = 0 .
Due to the axisymmetry, the remaining equilibrium conditions for the plate naturally hold. Boussinesq derived the following solution that satisfies all the above conditions, known as the Boussinesq solution:
σ ρ = P 2 π R 2 3 ρ 2 z R 3 1 2 ν R R + z ,   σ φ = 1 2 ν P 2 π R 2 ( R R + z z R ) ,   σ z = 3 P z 3 2 π R 5 ,   τ z ρ = τ ρ z = 3 P ρ z 2 2 π R 5 ,
where R = ρ 2 + z 2 . Equation (15) provides the stress field for a half-space subjected to an uplift force at the boundary, which serves as a theoretical foundation for studying the stress field of prestressed rock anchors. This analysis will guide the determination of relevant parameters for full-scale testing of prestressed rock anchors.

3. Establishment of the Mechanical Model for Anchor Pullout and Its Engineering Applications

The failure modes of rock anchor foundations can be categorized into several types: (1) anchor rupture; (2) insufficient strength at the anchor-anchorage interface leading to anchor pullout; (3) insufficient strength at the anchorage-rock interface causing the anchorage body to be pulled out; and (4) shear failure of the rock surrounding the anchorage body. In the present study, full-scale tests on rock anchors revealed that failure modes (1), (2), and (4) did not occur, indicating that the weak interface was between the anchorage body and the surrounding rock. Therefore, this section focuses on investigating the failure mechanisms at the anchorage-rock interface during the uplift process of the anchor. A universal mechanical model is proposed, which is validated against the results of the full-scale tests, providing reliable guidance for determining the embedding depth of the anchorage body.

3.1. Distribution Characteristics of Bond Strength at the Anchorage-Rock Interface and Definition of Effective Anchorage Length

3.1.1. Non-Uniformity of Bond Strength Distribution at the Anchorage-Rock Interface

To quantitatively analyze the distribution characteristics of bond strength at the anchorage-rock interface, we consider a specific rock anchor foundation. The engineering context is as follows: the prestressed anchor, designated as ϕ 56 , has a length of 8 m, an elastic modulus E s = 200   GPa , and a Poisson’s ratio ν = 0.3 . The anchorage body is made of C60 cement mortar with a diameter of 0.2 m and an anchorage depth of 8 m, having an elastic modulus E c = 36   GPa and a Poisson’s ratio ν = 0.167 . The surrounding rock has an elastic modulus E = 80   GPa and a Poisson’s ratio ν = 0.25 , with an applied uplift force P = 2000   kN .
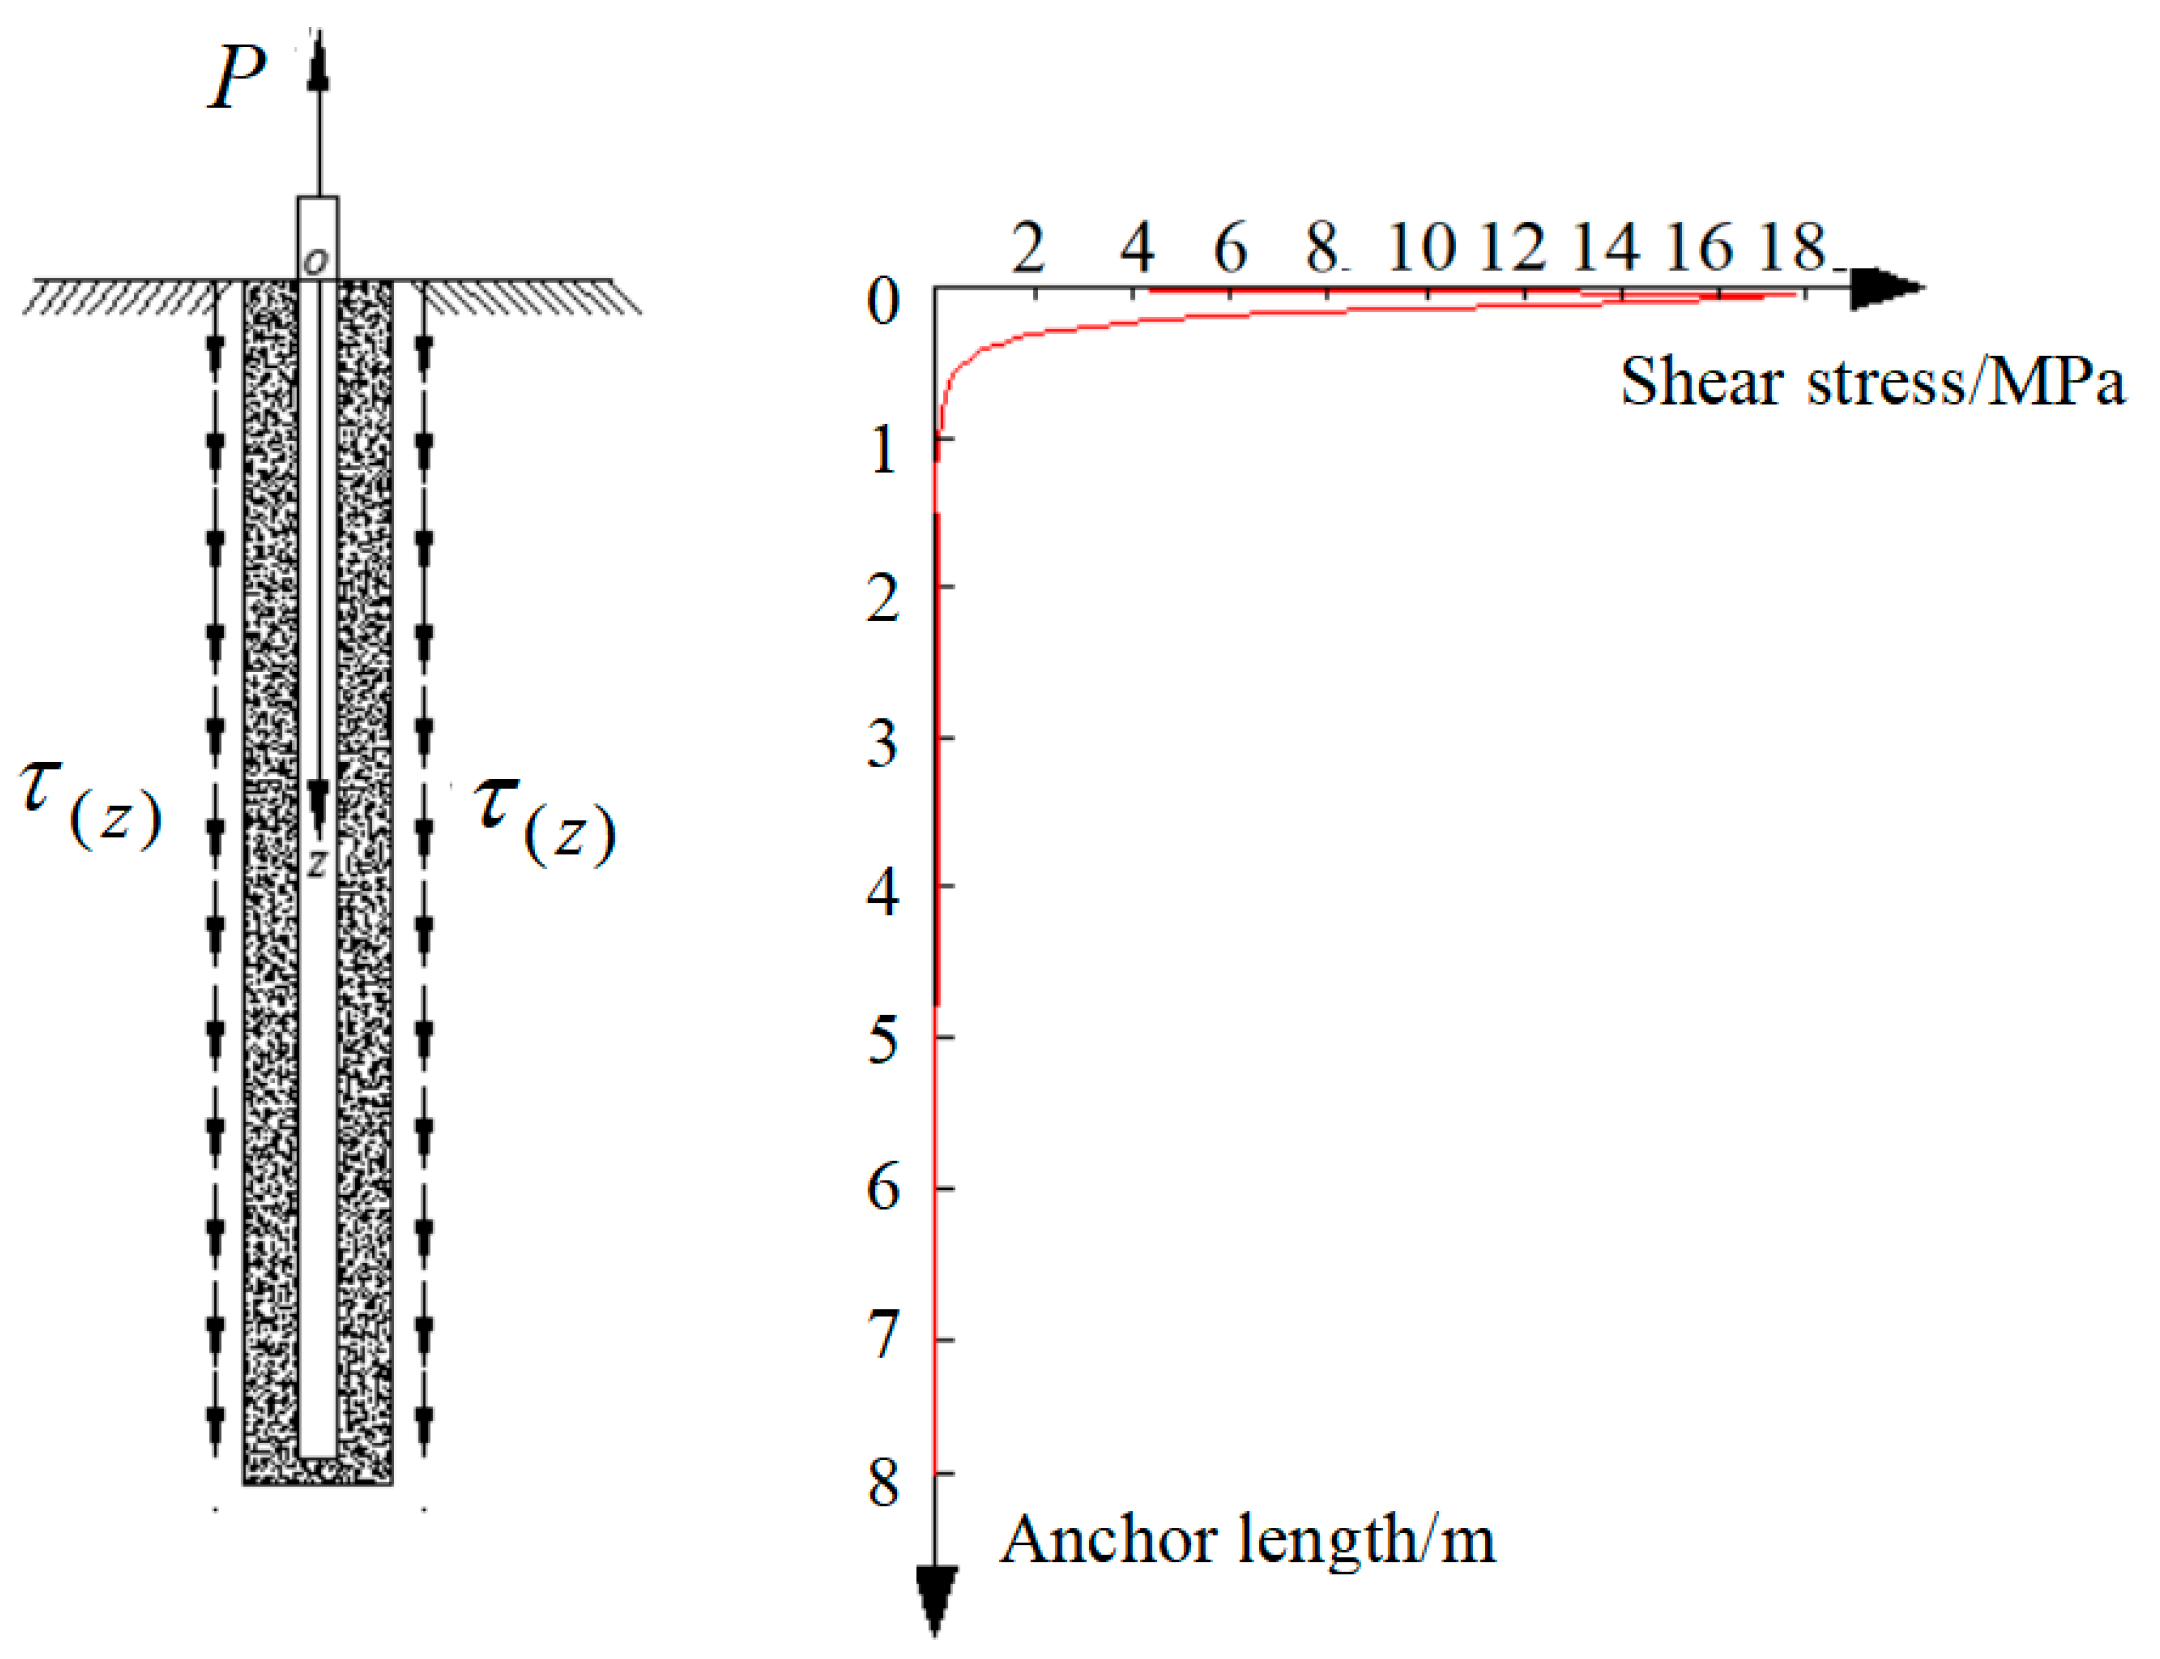
Using the theoretical expression for shear stress from Equation (15), we can derive the shear stress at the anchorage-rock interface as a function of anchorage length, as shown in the following figure:
The results depicted in Figure 6 indicate that the shear stress (bond strength) reaches its maximum near an anchorage depth of 0.1 m and then sharply decreases. By the time it reaches an anchorage depth of 1 m, the shear stress approaches zero, suggesting that most of the load is absorbed by the front section of the anchorage body, which is often unfavorable for the anchorage.
Figure 6. Shear stress-anchorage length curve.

3.1.2. Definition of Effective Anchorage Length

We introduce the concept of the load ratio of the anchorage body. Assuming the length of the anchorage body is l and its radius is r , we treat the anchorage body as a separate entity. Based on the static equilibrium conditions of the anchorage body, we can express:
0 l τ ρ z 2 π r d z = P .
Dividing the anchorage body into n segments, the z-coordinates of the starting points for each segment are denoted as h i and h i + 1 , with
κ i = h i h i + 1 τ ρ z 2 π r d z P ,
where κ i represents the load ratio for each segment of the anchorage body, describing the proportion of external load transmitted by each segment, allowing for a quantitative understanding of the bond strength transfer characteristics at the anchorage-rock interface.
Based on the concept of load ratio, we define the effective anchorage length as the length at which the cumulative load ratio of the anchorage body reaches 95%.
For the aforementioned engineering example, we divide the anchorage body into three segments, with the starting z-coordinates as (0 m, 0.5 m), (0.5 m, 1.5 m), and (1.5 m, 8 m), corresponding to segment lengths of 0.5 m, 1 m, and 6.5 m, respectively. The load ratios for each segment are calculated as follows:
κ 1 = 0 0.5 τ ρ z 2 π r d z P = 0.95 ,   κ 2 = 0.5 1.5 τ ρ z 2 π r d z P = 0.04 ,   κ 3 = 1.5 8 τ ρ z 2 π r d z P = 0.01 .
The calculations indicate that 95% of the load is transmitted through the segment from 0 to 0.5 m, and 99% through the segment from 0 to 1.5 m. According to the definition provided, the effective anchorage length is thus 0.5 m.

3.1.3. Numerical Verification of the Applicability of Theoretical Solutions for Concentrated Forces on Half-Space Bodies

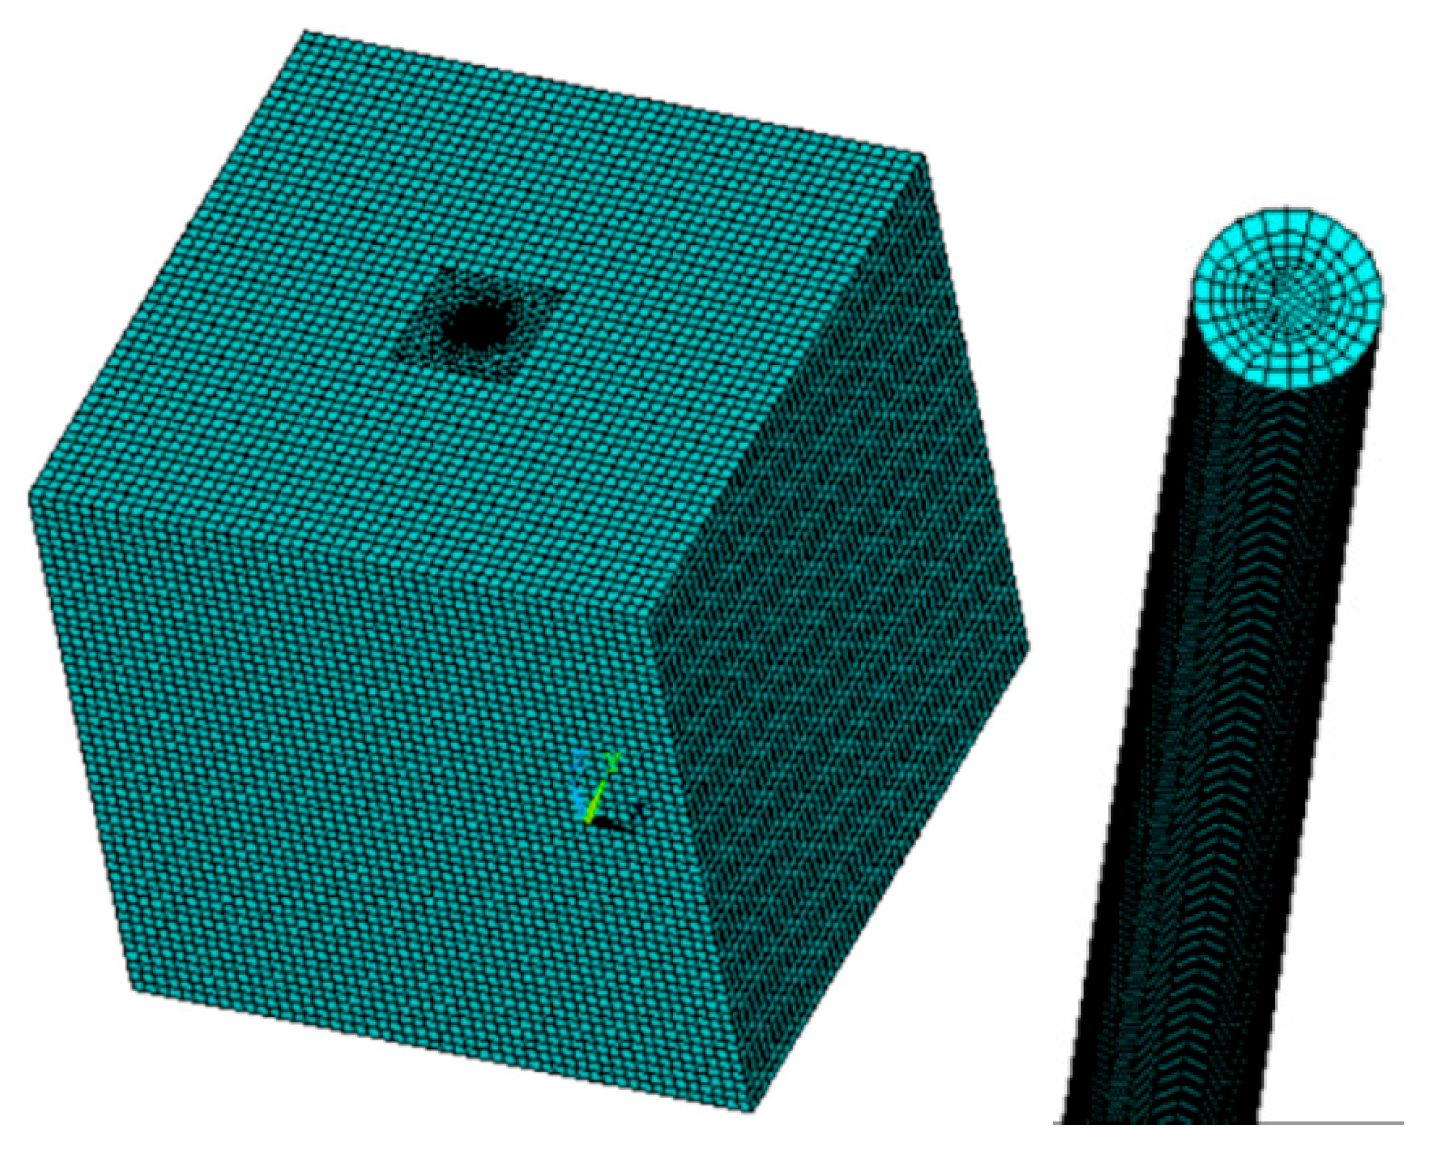
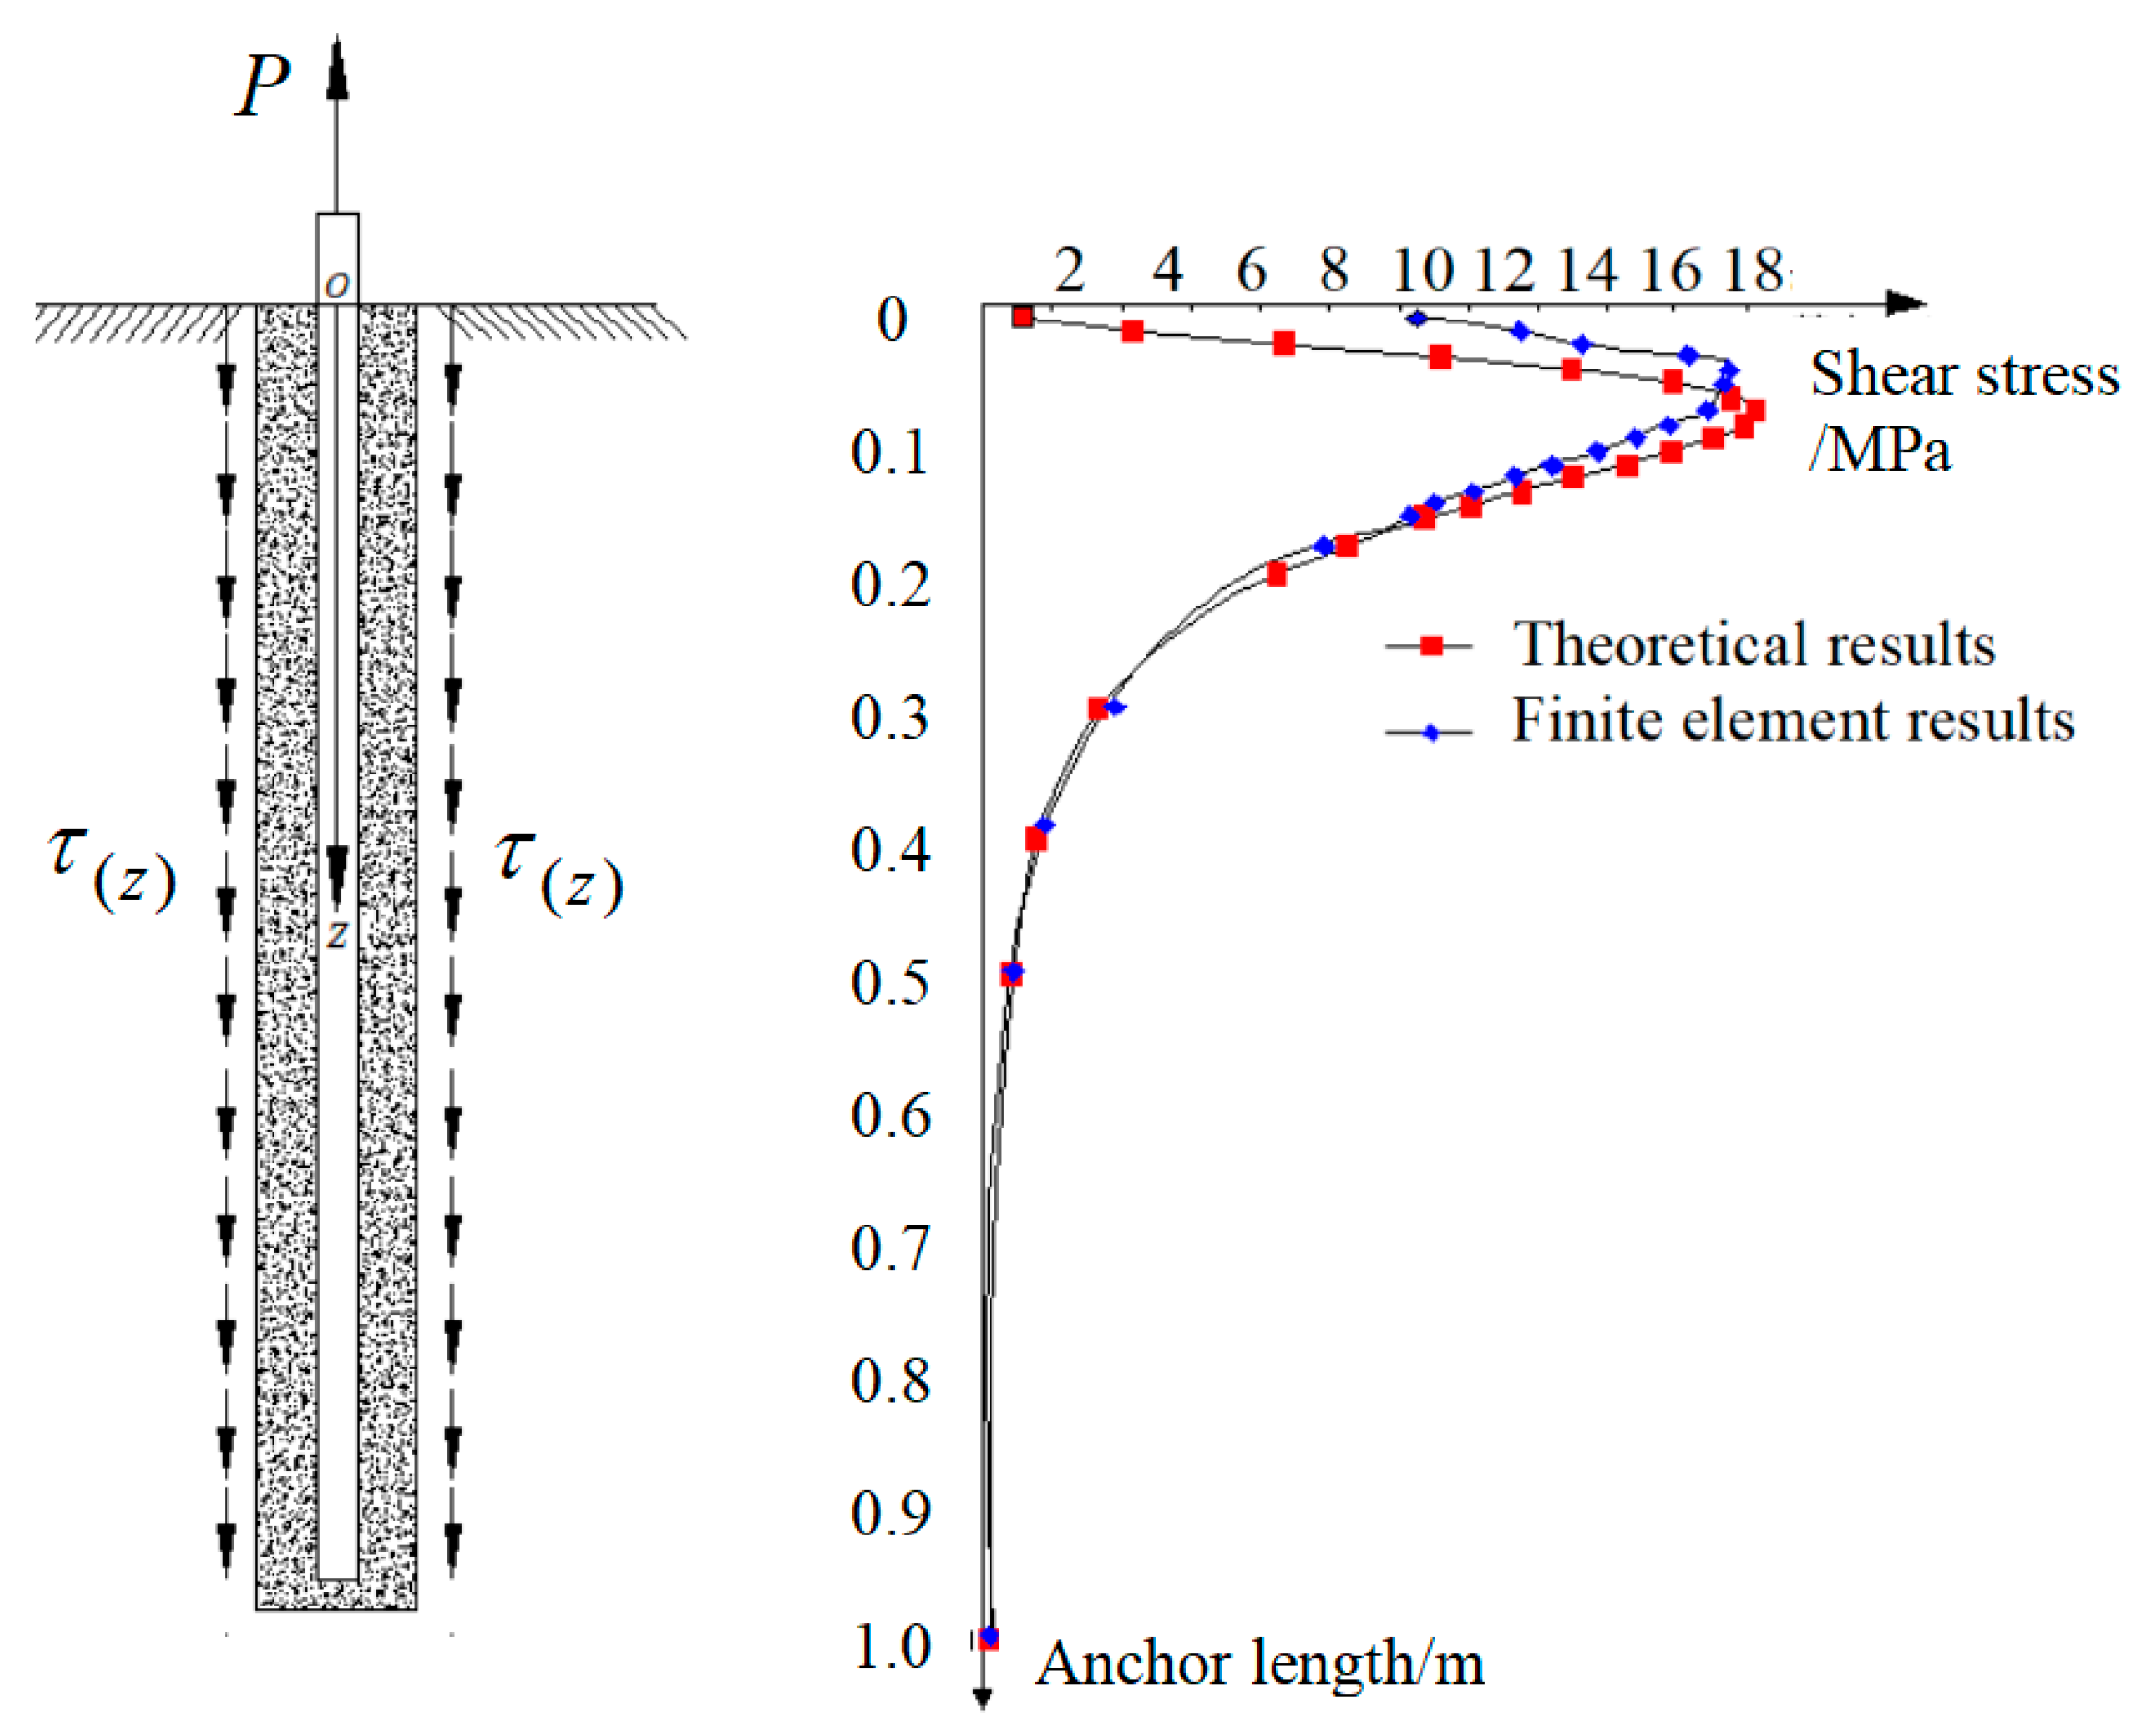
To further validate the reliability of the theoretical results, we employed the finite element software ANSYS 2024 R2 to establish a finite element model of the aforementioned anchor, as shown in Figure 7, for numerical verification. We extracted the shear stress at the anchorage-rock interface per unit depth and compared it with the theoretical results, as illustrated in Figure 8:
Figure 7. Finite element model (number of elements: 800,000).
Figure 8. Comparison of finite element values and theoretical values.
The results presented in Figure 8 demonstrate a good agreement between the theoretical calculations and the finite element results. During the finite element modeling, three different material parameters were used to simulate the anchor, concrete, and rock materials, establishing a mixed material numerical model. The theoretical solution provided in this study is based on the assumption of uniformity, and the close match between the theoretical and mixed model numerical solutions indicates that the theoretical solution for concentrated forces acting on half-space bodies can be effectively applied to the mechanical analysis of rock anchor foundations.

3.2. Proposal and Establishment of the Mechanical Model for Anchor Pullout

3.2.1. Analysis of the Failure Mechanism at the Anchorage-Rock Interface During Anchor Pullout

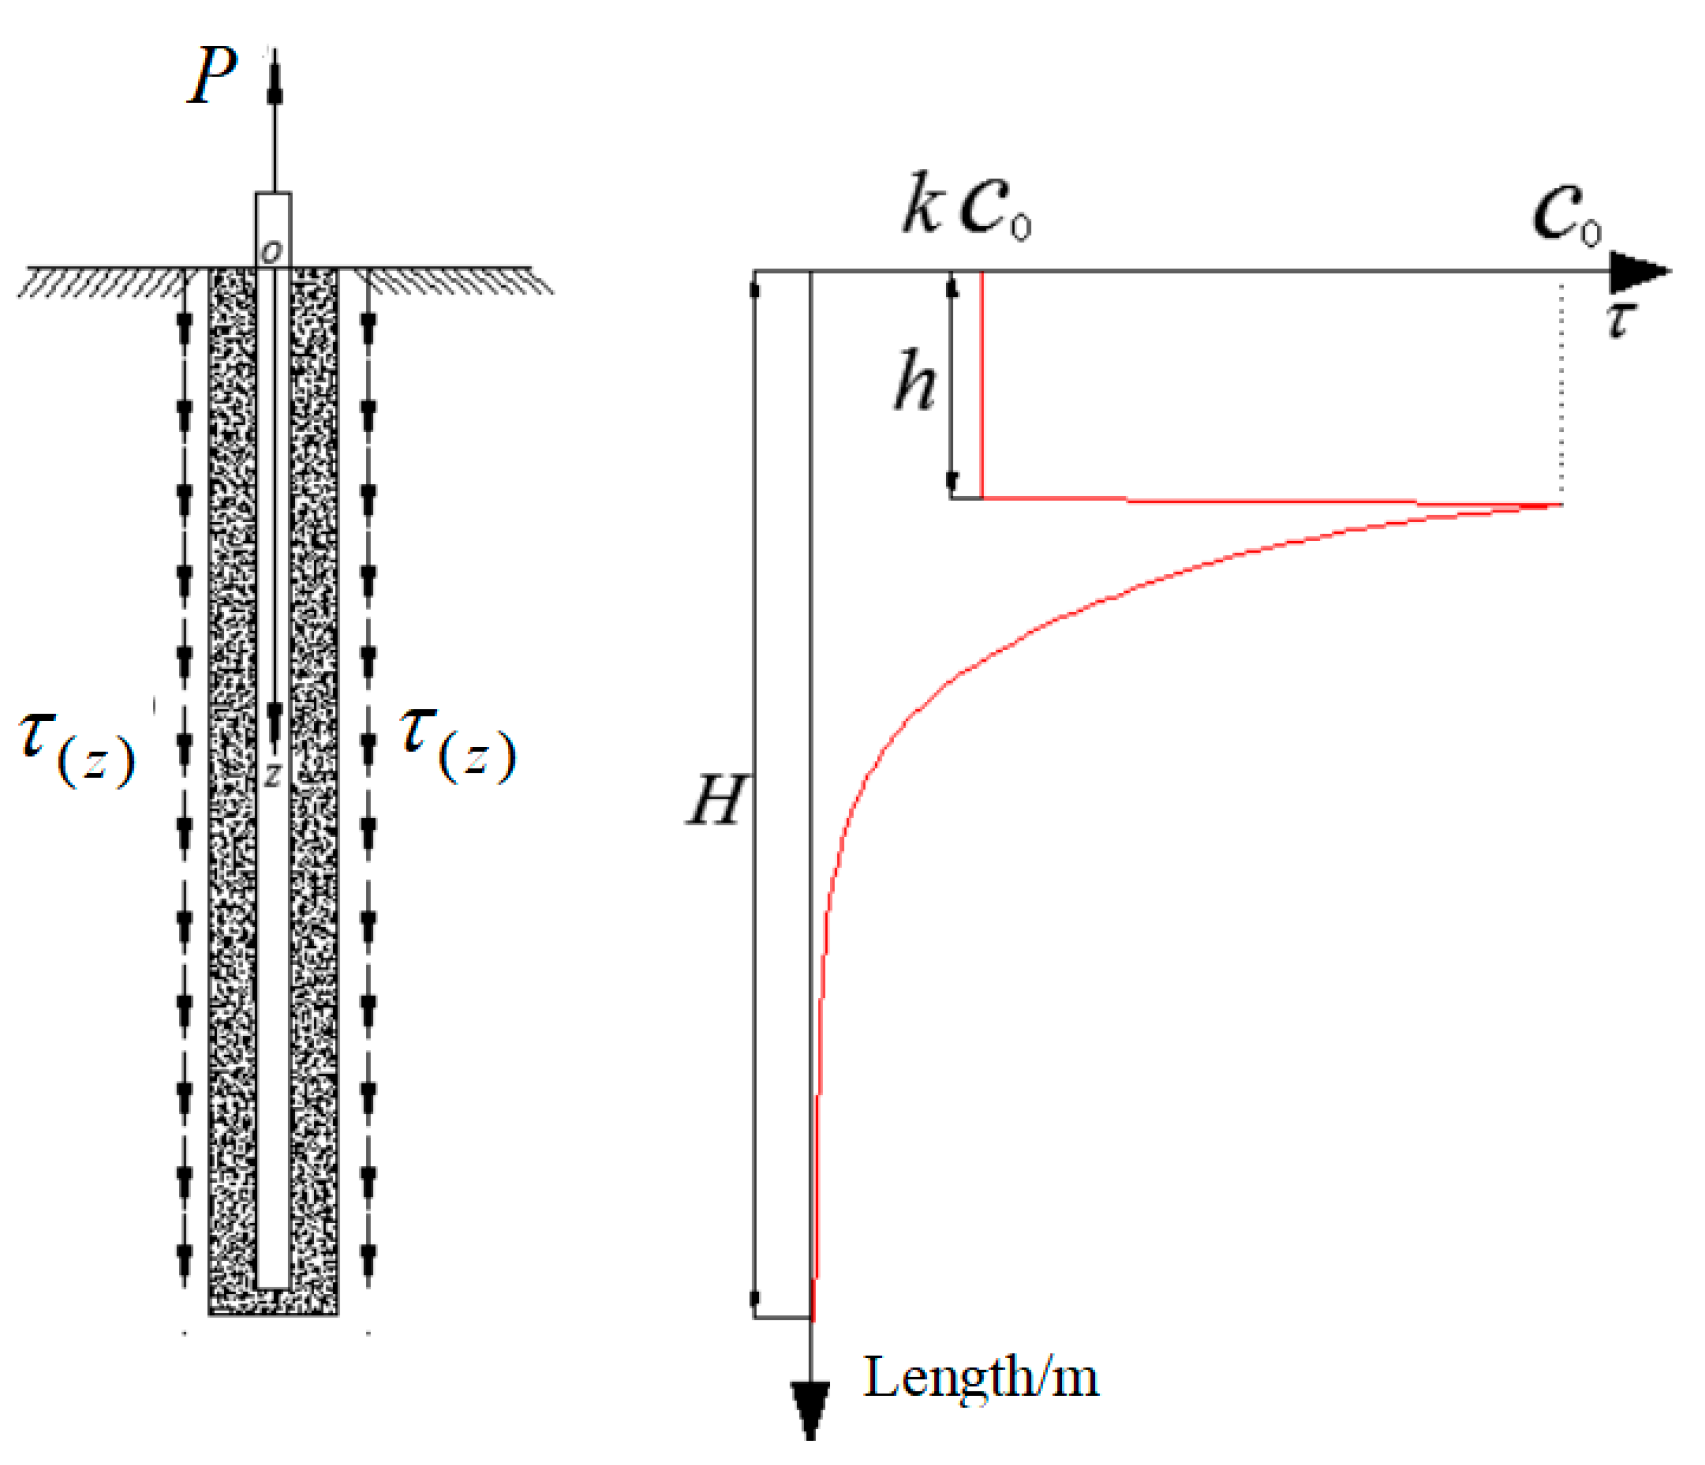
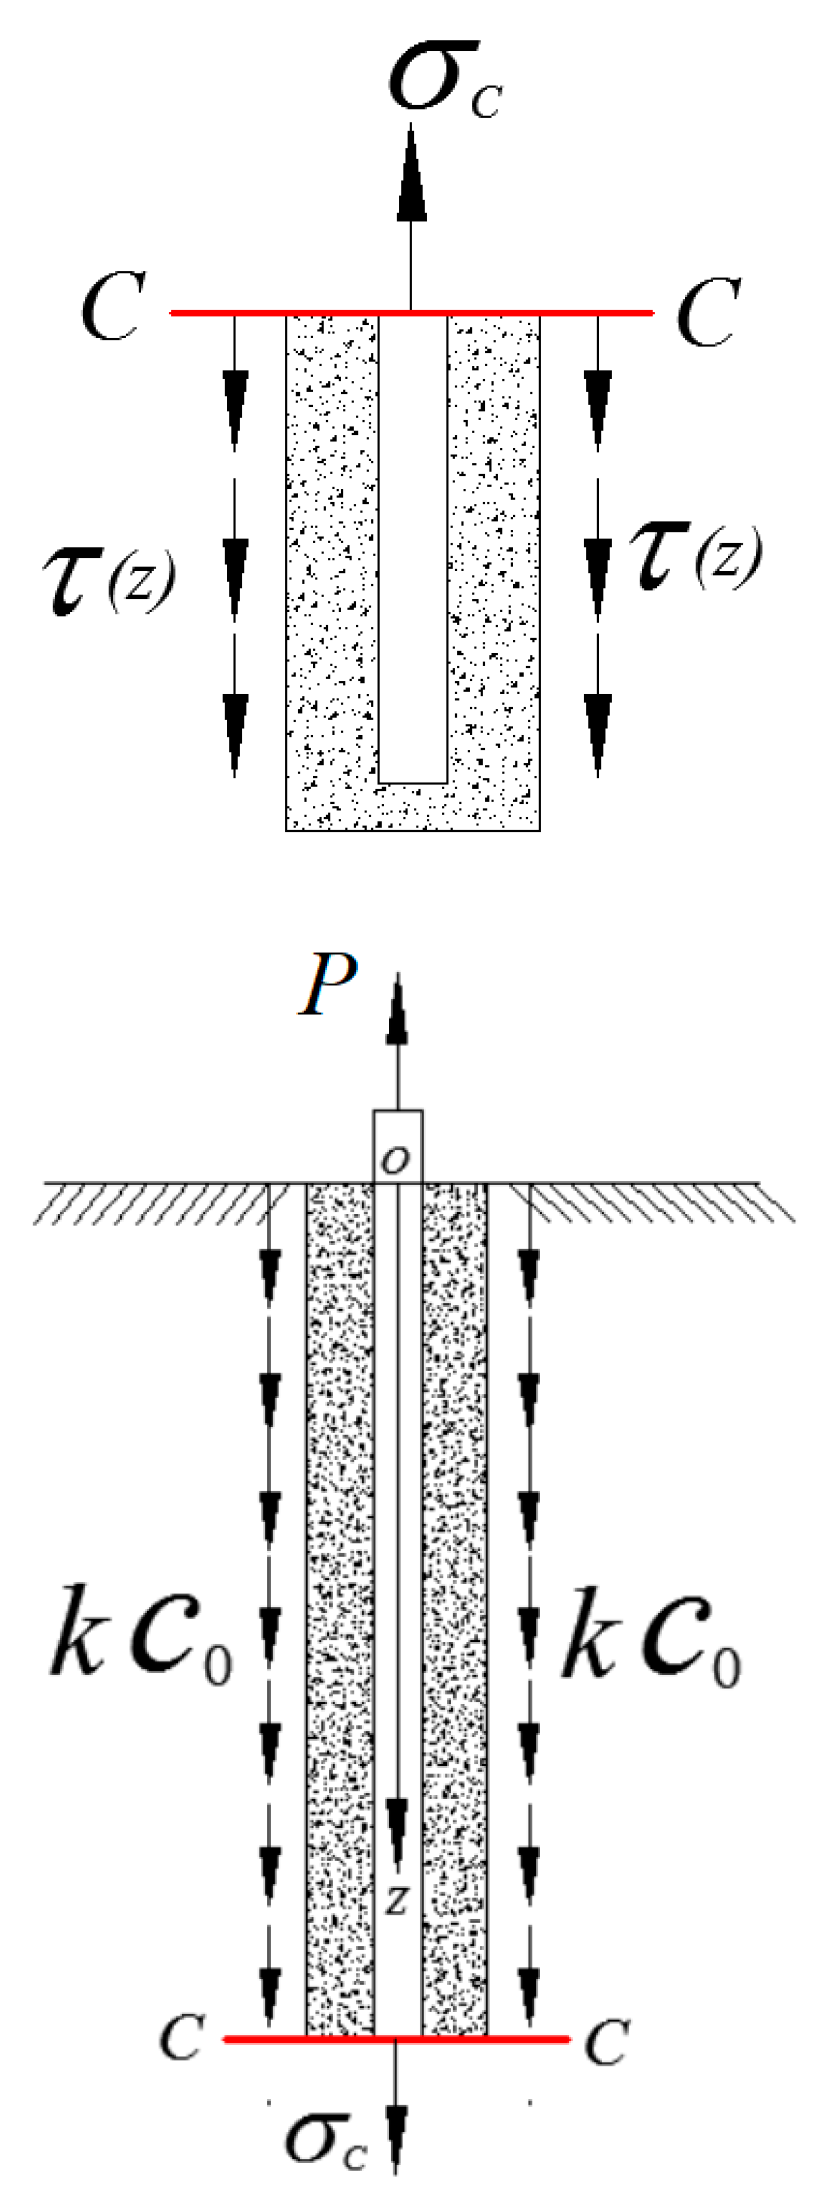
From Section 3.1, it can be concluded that during the pullout process of the anchor, the effective transfer depth is approximately 0.5 m, with peak stress occurring near 0.1 m. When the peak stress at any point on the interface exceeds the bond strength between the anchorage body and the surrounding rock, failure will occur at that location. Consequently, the bond strength in the initial 0.5 m segment rapidly becomes ineffective. However, even after the bond strength fails, this segment does not cease to function entirely. Due to the presence of macroscopic friction between the interfaces, some residual load-carrying capacity is retained, which we refer to as residual shear strength, assumed to be a constant. As the load gradually increases, the load continues to transfer downward, and the depth of the bond failure segment gradually increases, as illustrated in Figure 9. In this figure, h (the length of the bond failure segment) increases until all bond strength is lost and the anchor reaches its ultimate load capacity.
Figure 9. Schematic of failure mechanism analysis.

3.2.2. Critical State of the Anchorage-Rock Interface During Anchor Pullout

As shown in Figure 9, let us assume that the initial bond strength at the anchorage-rock interface is C 0 , and the residual shear strength after bond failure is k C 0 , where k is the bond strength loss coefficient. This coefficient is related to the anchorage material, the type of surrounding rock, and the roughness of the interface, and it can be determined through testing or engineering experience. Extensive experimental data and engineering experience indicate that for a given anchorage material, the value of k varies between approximately 0.3 and 0.7 for different geological types. The value of k is primarily influenced by the weathering degree of the foundation rock, with increasing values corresponding to fully weathered, strongly weathered, moderately weathered, and slightly weathered states. Let the total length of the anchorage body be H and the length of the bond failure segment be h . Given that the effective length of the anchorage segment is approximately 0.5 m, as the bond failure segment expands, when it reaches the cross-section located 0.5 m from the bottom of the anchorage segment (as shown at the C-C cross-section in Figure 10), the peak shear stress under load reaches the bond strength C 0 . At this moment, the anchorage-rock interface reaches a critical state.
Figure 10. Critical state.

3.2.3. Establishment and Solution of the Mechanical Model During Anchor Pullout

Focusing on the anchorage body, we analyze the forces acting on the lower portion of the anchorage at the C-C cross-section, as shown in Figure 11. Let the equivalent normal stress at the C-C cross-section be σ C . Next, we analyze the relationship between the normal stress at this cross-section and the peak shear stress τ max at the anchorage-rock interface.
Figure 11. Isolated body.
Based on the theoretical solution from Equation (15), we can determine the ratio between the normal stress and the peak shear stress. When the uplift force is P , the equivalent normal stress at the cross-section of the anchorage body is given by
σ = P π ρ 2 .
The ratio of shear stress to normal stress is
f = τ σ = 3 ρ 3 z 2 2 ρ 2 + z 2 5 2 .
Taking the partial derivative of the above expression with respect to the radius and setting it to zero yields.
f 1 = f z = 0 .
Given that the diameter of the anchorage body is 180 mm, ρ = r = 90   mm , substituting this into Equation (21) yields z = 0.073 m. Substituting this result into Equation (20) gives:
f = τ max σ C = 0.279 .
Next, considering the upper part of the anchorage body at the C-C cross-section as an isolated body, we can derive from Figure 11 that when the critical state is reached, combined with Equation (22), we obtain
σ C = τ max f = C 0 0.279 .
Establishing the equilibrium equation for the isolated body, we find
2 k C 0 π   r ( H 0.5 ) + C 0 0.279 × π   r 2 = P .
Equation (24) provides the relationship between the uplift force P and the bond strength C 0 . This equation can be used to calculate the bond strength between the anchorage body and the surrounding rock during the anchor pullout test, allowing for the determination of the required embedding depth of the anchorage body to meet design strength requirements.

4. Full-Scale Testing Plan for the Uplift Bearing Capacity of Prestressed Rock Anchor Foundations

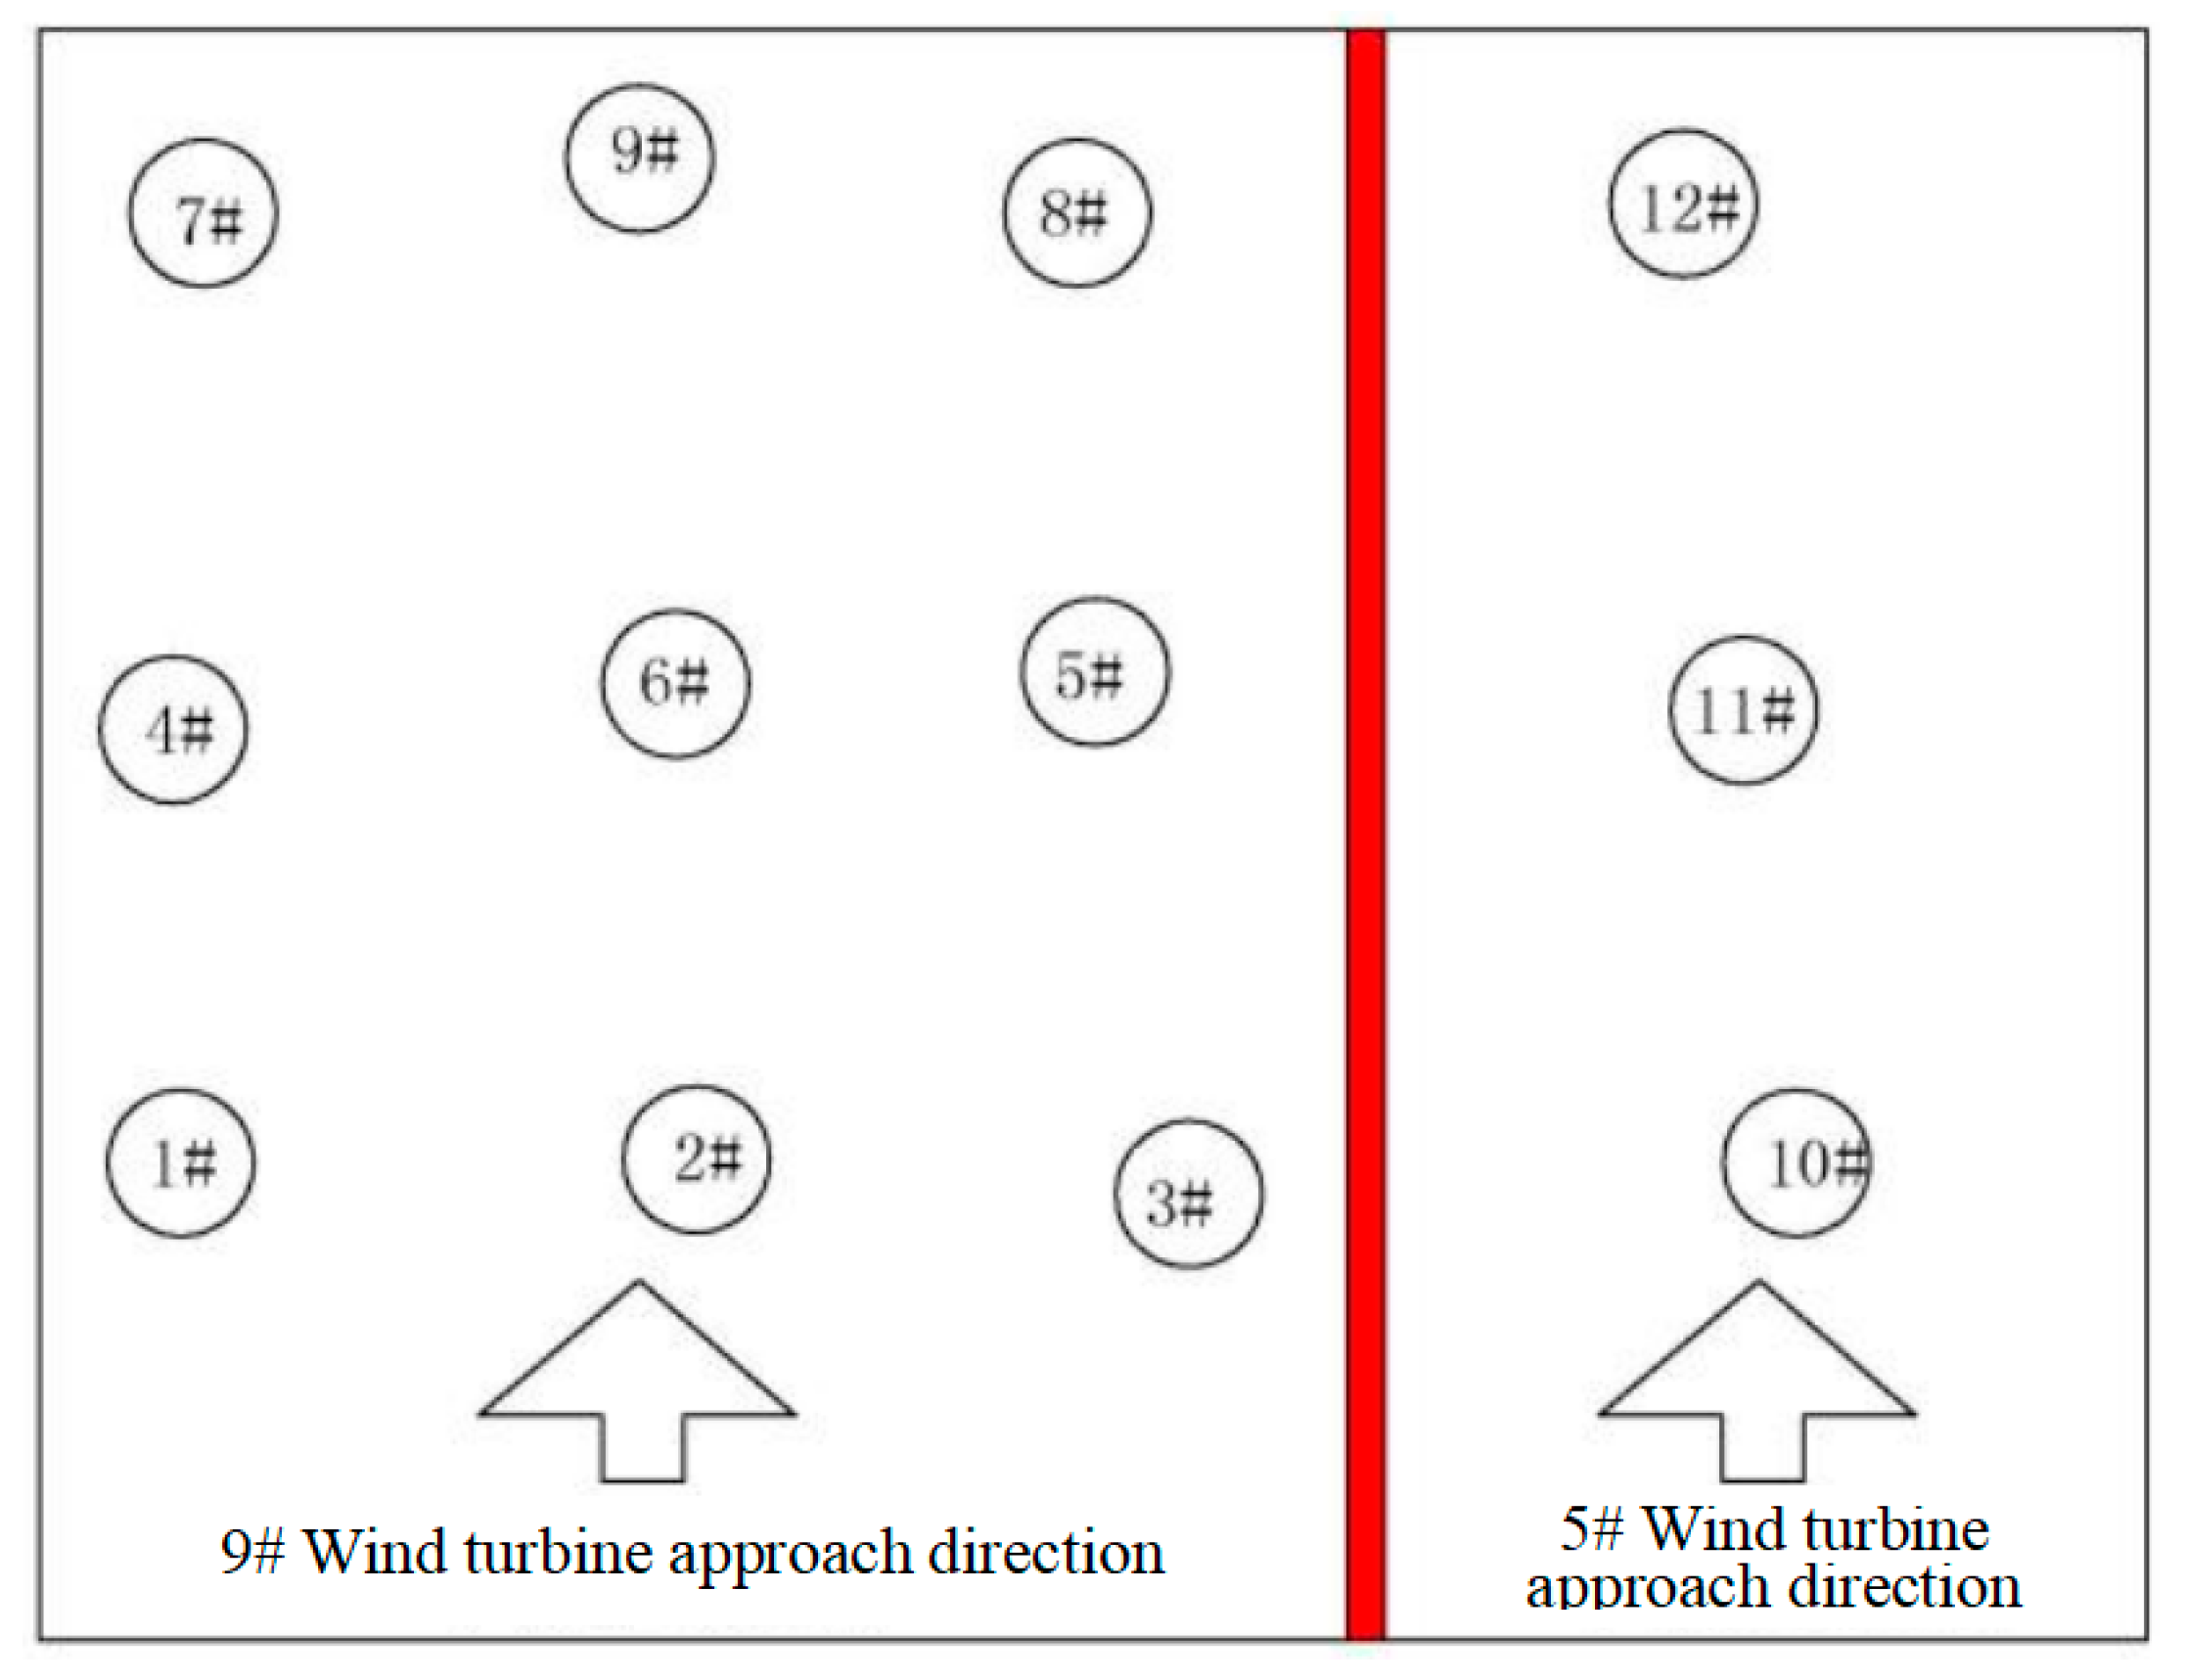
The full-scale uplift bearing capacity test for rock anchors is conducted at the Xiangshan Wind Farm in Xunwu, Jiangxi Province, across two sites: Site 9 and Site 5. Site 9 is located in a strongly weathered area with some fully weathered sections, featuring a surface layer of silty clay and relatively low foundation bearing capacity. In contrast, Site 5 is situated in a moderately weathered area with higher foundation bearing capacity. A total of 12 samples are tested, with 9 anchors at Site 9 and 3 anchors at Site 5. The anchor numbers and the layout of the test sites are shown in Figure 12. The failure mode observed is anchor pullout, indicating that the weak interface is consistently between the anchorage body and the surrounding rock, allowing for analysis using the proposed mechanical model.
Figure 12. Layout of anchor test site.

4.1. Test Loading Method and Load

A hydraulic jack is utilized to apply the loading force, supported by a steel beam pedestal, with the reaction force provided by the foundation. Load measurements are taken using a hydraulic pressure gauge, while large-range displacement sensors measure the uplift displacement of the anchors. Static strain gauges are employed to read the strain in the anchors. The loading apparatus and specific implementation are illustrated in Figure 13. The load was applied in discrete, controlled increments. Each load step was held constant for 2 min to allow for stress redistribution and stable data acquisition.
Figure 13. Schematic of full-scale test.
In this full-scale test, the anchors consist of prestressed threaded steel bars with a diameter of 50 mm. The yield load for a single anchor is 1825 kN, while the load at the design tensile strength is 1511 kN, and the ultimate load is 2119 kN. The grout material employed has a strength grade of C50. The test employs a staged loading approach, divided into 10 levels, with each level set at 250 kN and a maximum loading capacity of 2200 kN, disregarding the effect of the pedestal during the test. The applied tensile load was measured using a calibrated hydraulic load cell with an accuracy of ± 1% of the full-scale output.

4.2. Test Content and Procedure

4.2.1. Sample Identification and Description

After selecting the test sites, the objective is to determine the ultimate bearing capacity of the rock anchors and to study and establish reasonable anchorage depths. The anchors are preliminarily grouped into four sets for uplift testing, with three anchors per set, resulting in a total of 12 rock anchors for this full-scale test. The relevant parameters for each anchor are summarized in Table 4.
Table 4. Sample identification and parameter summary.

4.2.2. Test Measurement Content

To provide abundant verification data for theoretical research, the full-scale test aims to collect the following data: the ultimate bearing capacity of the anchors, the force-displacement curves of the anchors, and the strain distribution along the depth of the anchors. The measurement content includes: (1) Measurement of the force-displacement curve of the anchors: The applied load is measured using the hydraulic jack, while the displacement of the anchors is captured by displacement gauges, allowing for the generation of the force-displacement curve. (2) Measurement of strain distribution along the depth of the anchors: Strain gauges adhered to the surface of the anchors measure the strain distribution at each load level. (3) Measurement of displacement at the end face of the anchorage body and local foundation displacement: Displacement at the end face of the anchorage body is measured using lead-out steel bars embedded within the anchorage, while local foundation displacement is obtained using embedded displacement sensors. The measuring instrument employed is a vibrating wire concrete strain gauge, with an accuracy within ±1%.

4.2.3. Overview of Strain Gauge Layout

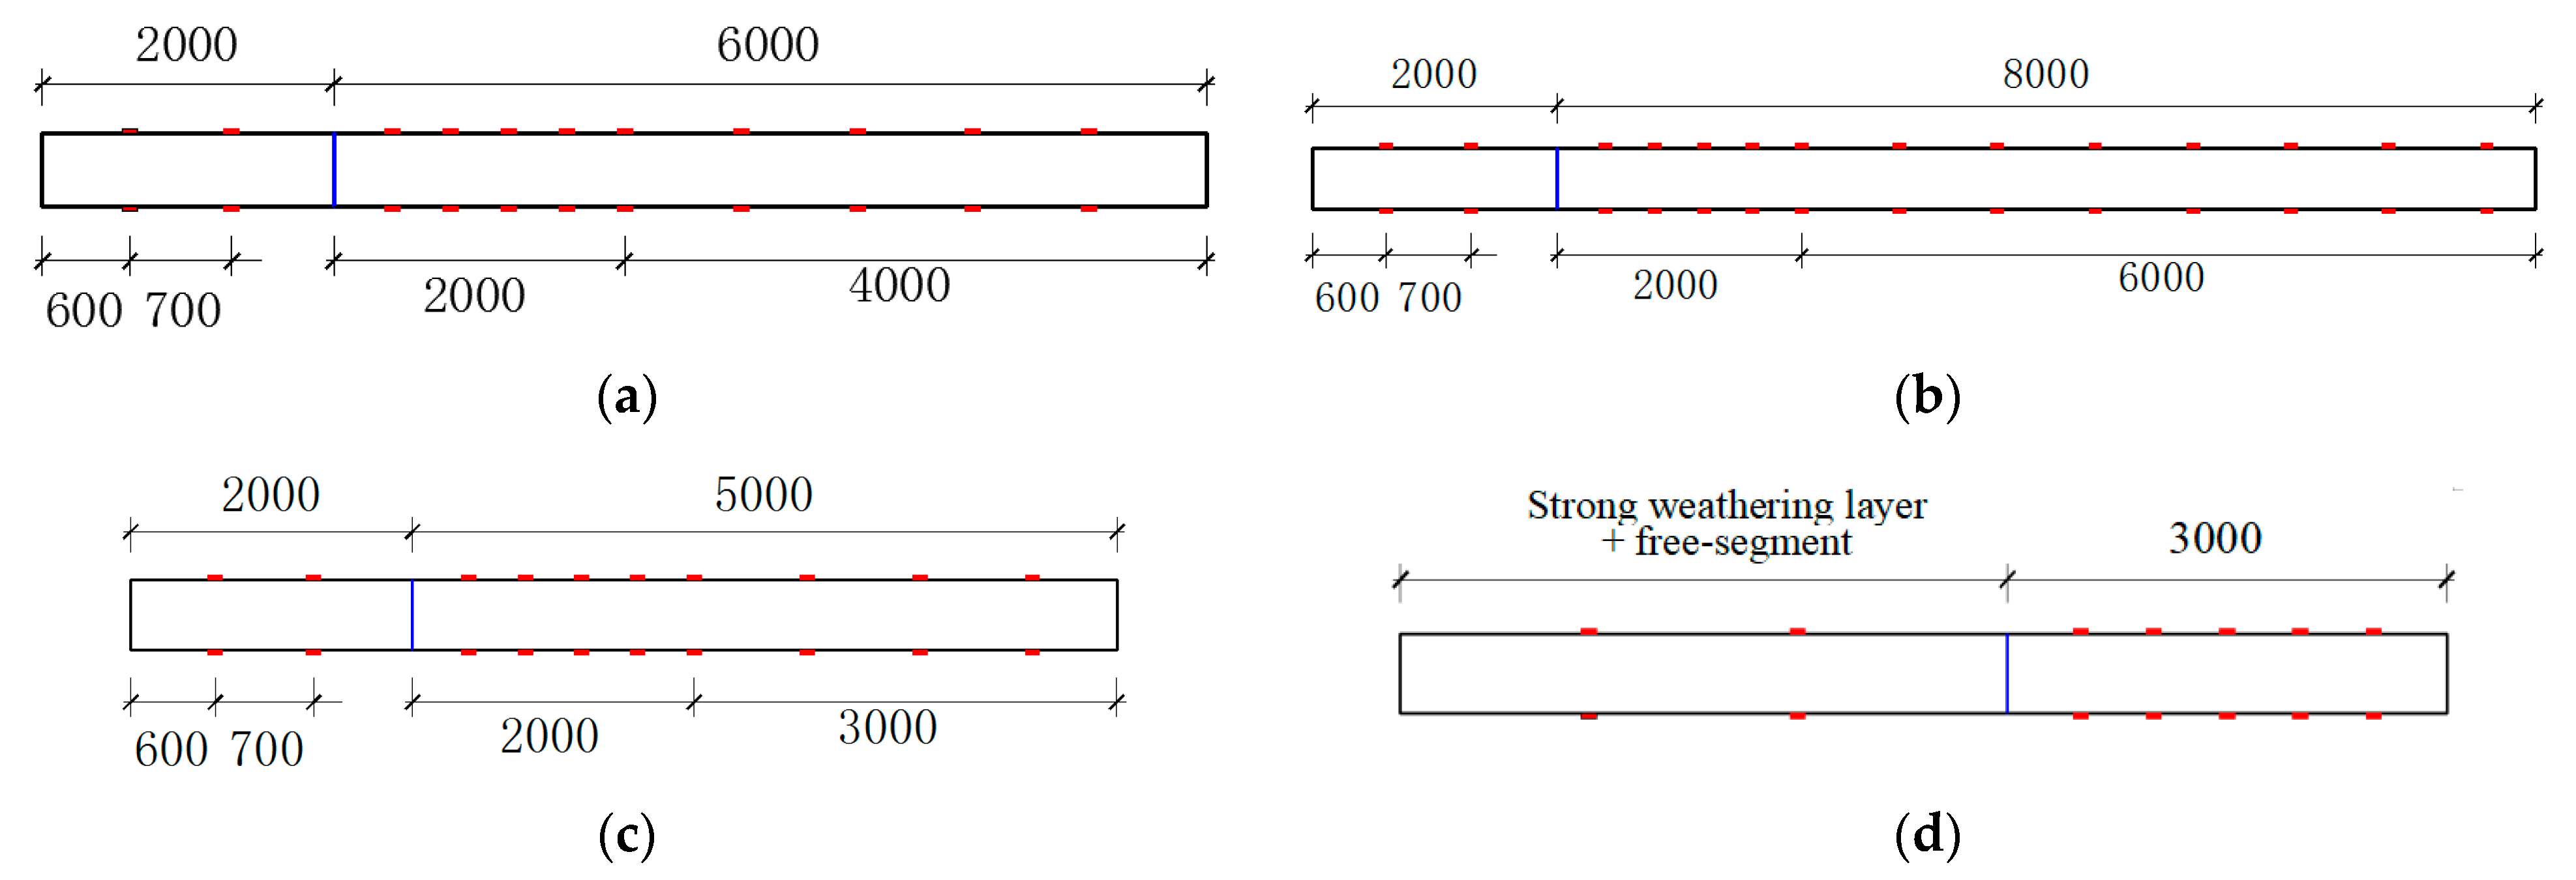
Strain Gauge Layout Description: A total of four test groups with three anchors each (12 anchors in total) are used in this full-scale test. Strain gauges are affixed along the length of each anchor, with two gauges applied at each segment length, symmetrically arranged. The layout of the strain gauges for each test group is illustrated as follows:
In Figure 14a, four strain gauges are placed along the free length of Test Group 1, one gauge is placed every 40 cm for the first 2 m of the anchorage segment, and one gauge is placed every 80 cm for the subsequent 4 m. A pair of strain gauges is arranged every 80 cm in the back 6 m of Figure 14b and in the back 3 m of Figure 14c. In Figure 14d, the number of strain gauges for Test Group 4 is to be determined based on the depth of the moderately weathered layer, with one gauge placed every 50 cm along the anchorage segment.
Figure 14. Strain gauge layout schematic: (a) Strain gauge layout for test group 1; (b) Strain gauge layout for test group 2; (c) Strain gauge layout for test group 3; (d) Strain gauge layout for test group 4.

4.2.4. Test Steps and Key Points

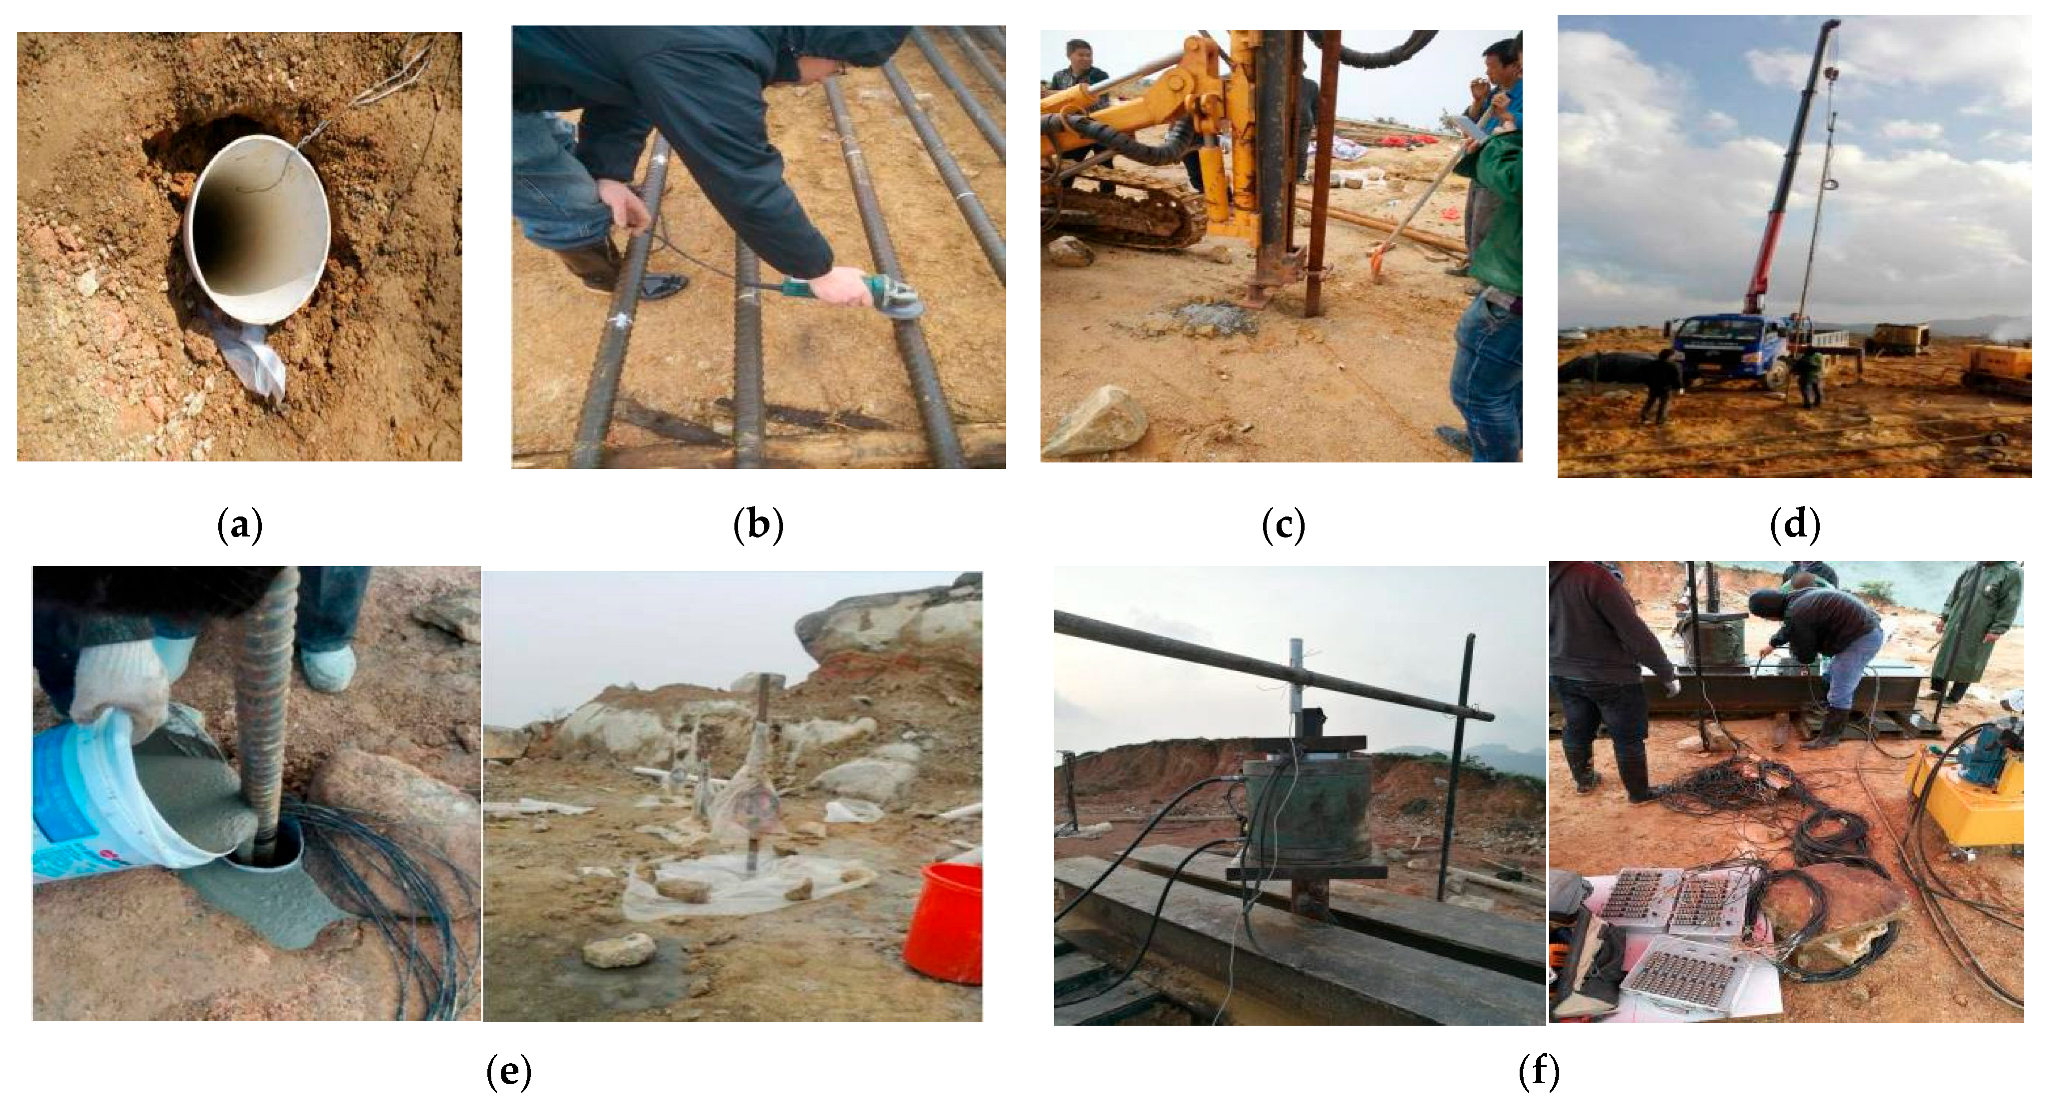
The test must be conducted in strict accordance with the “Code for Design of Building Foundations” (GB50007-2011), Appendix M, “Key Points for Rock Anchor Pullout Tests.” [] The specific test steps (as shown in Figure 15) are as follows: (1) Drilling of boreholes and treatment of borehole walls, along with mechanical property measurements of the original samples from each layer; (2) Preparation of test anchors, application of strain gauges, and fixing of concrete strain gauges; (3) Installation of the anchors; (4) Grouting of the boreholes; (5) Installation of instruments and gauges; (6) Loading and data collection; (7) Data analysis; (8) Compilation of test and research reports.
Figure 15. Test site images:(a) Drilling; (b) Layout of strain gauges; (c) Cleaning of boreholes; (d) Installation; (e) Grouting and curing; (f) Loading and data collection.
Test key points: (1) Loading Levels: The test employs staged loading, divided into 10 levels, with each level set at 250 kN and a maximum loading capacity of 2500 kN, ultimately loading to failure. (2) Loading Measurement Timing: After applying each load level, displacement is immediately measured. Subsequent measurements are taken every 5 min. If the uplift value of the anchor remains below 0.01 mm after four consecutive measurements, it is considered stable, allowing for the application of the next uplift load level. (3) Termination Conditions for Loading: The pullout test may be terminated under any of the following conditions: (a) If the uplift of the anchor continues to increase without signs of stabilization within one hour; (b) If the newly added uplift force cannot be applied or fails to stabilize; (c) If the anchor is ruptured or pulled out.

5. Processing and Analysis of Full-Scale Test Data for Rock Anchors

The full-scale tests conducted on rock anchors have yielded a wealth of experimental data, providing robust support for the theoretical research and optimization design of rock anchor foundations. This section focuses on the effective processing and detailed analysis of the test data. Due to variations in geological conditions at the test site and drilling errors, discrepancies were observed between the actual anchorage depths and those proposed in the initial test plan. Therefore, the data processing and analysis in this section are based on the results obtained from the field tests.

5.1. Data Processing for Each Anchor Test

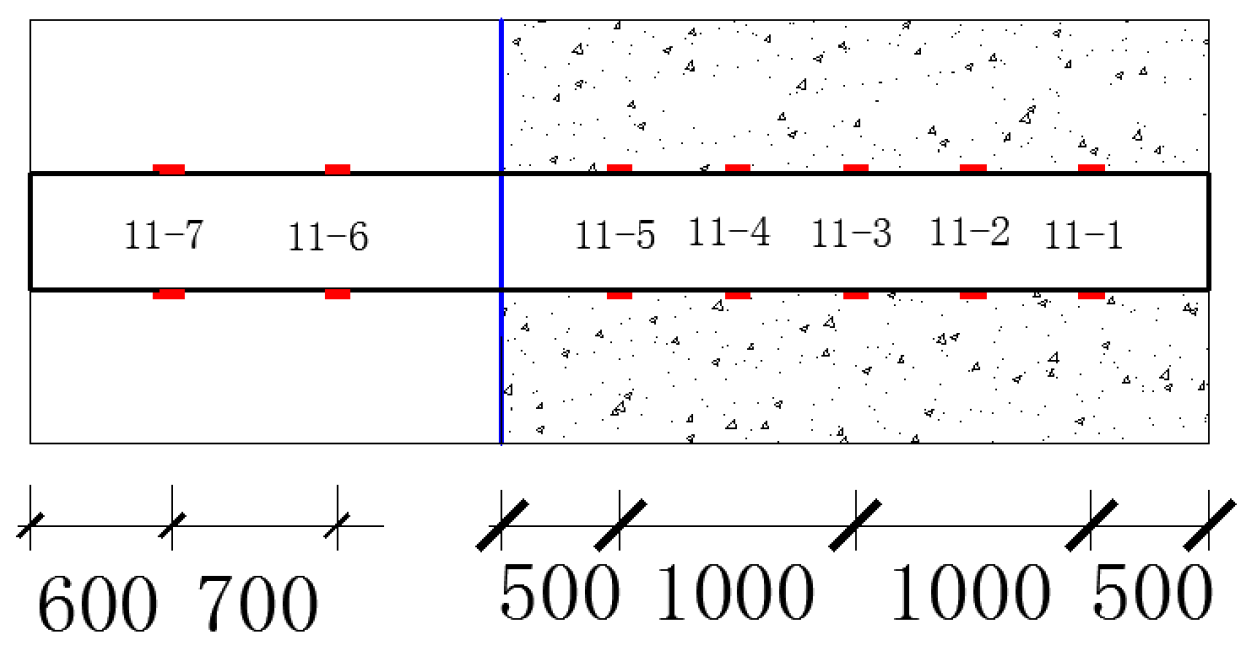
Figure 16 and Figure 17 illustrate the strain gauge and strain meter numbering for Anchor 1 and Anchor 11, respectively.
Figure 16. Strain gauge and strain meter numbering for Anchor 1.
Figure 17. Strain gauge and strain meter numbering for Anchor 11.
As shown in Figure 18, Anchor 1 reached its ultimate load capacity of 1376 kN when the hydraulic pressure was increased to 18 MPa, with failure occurring at the interface between the anchorage body and the surrounding rock.
Figure 18. Pullout force-displacement curve for Anchor 1.
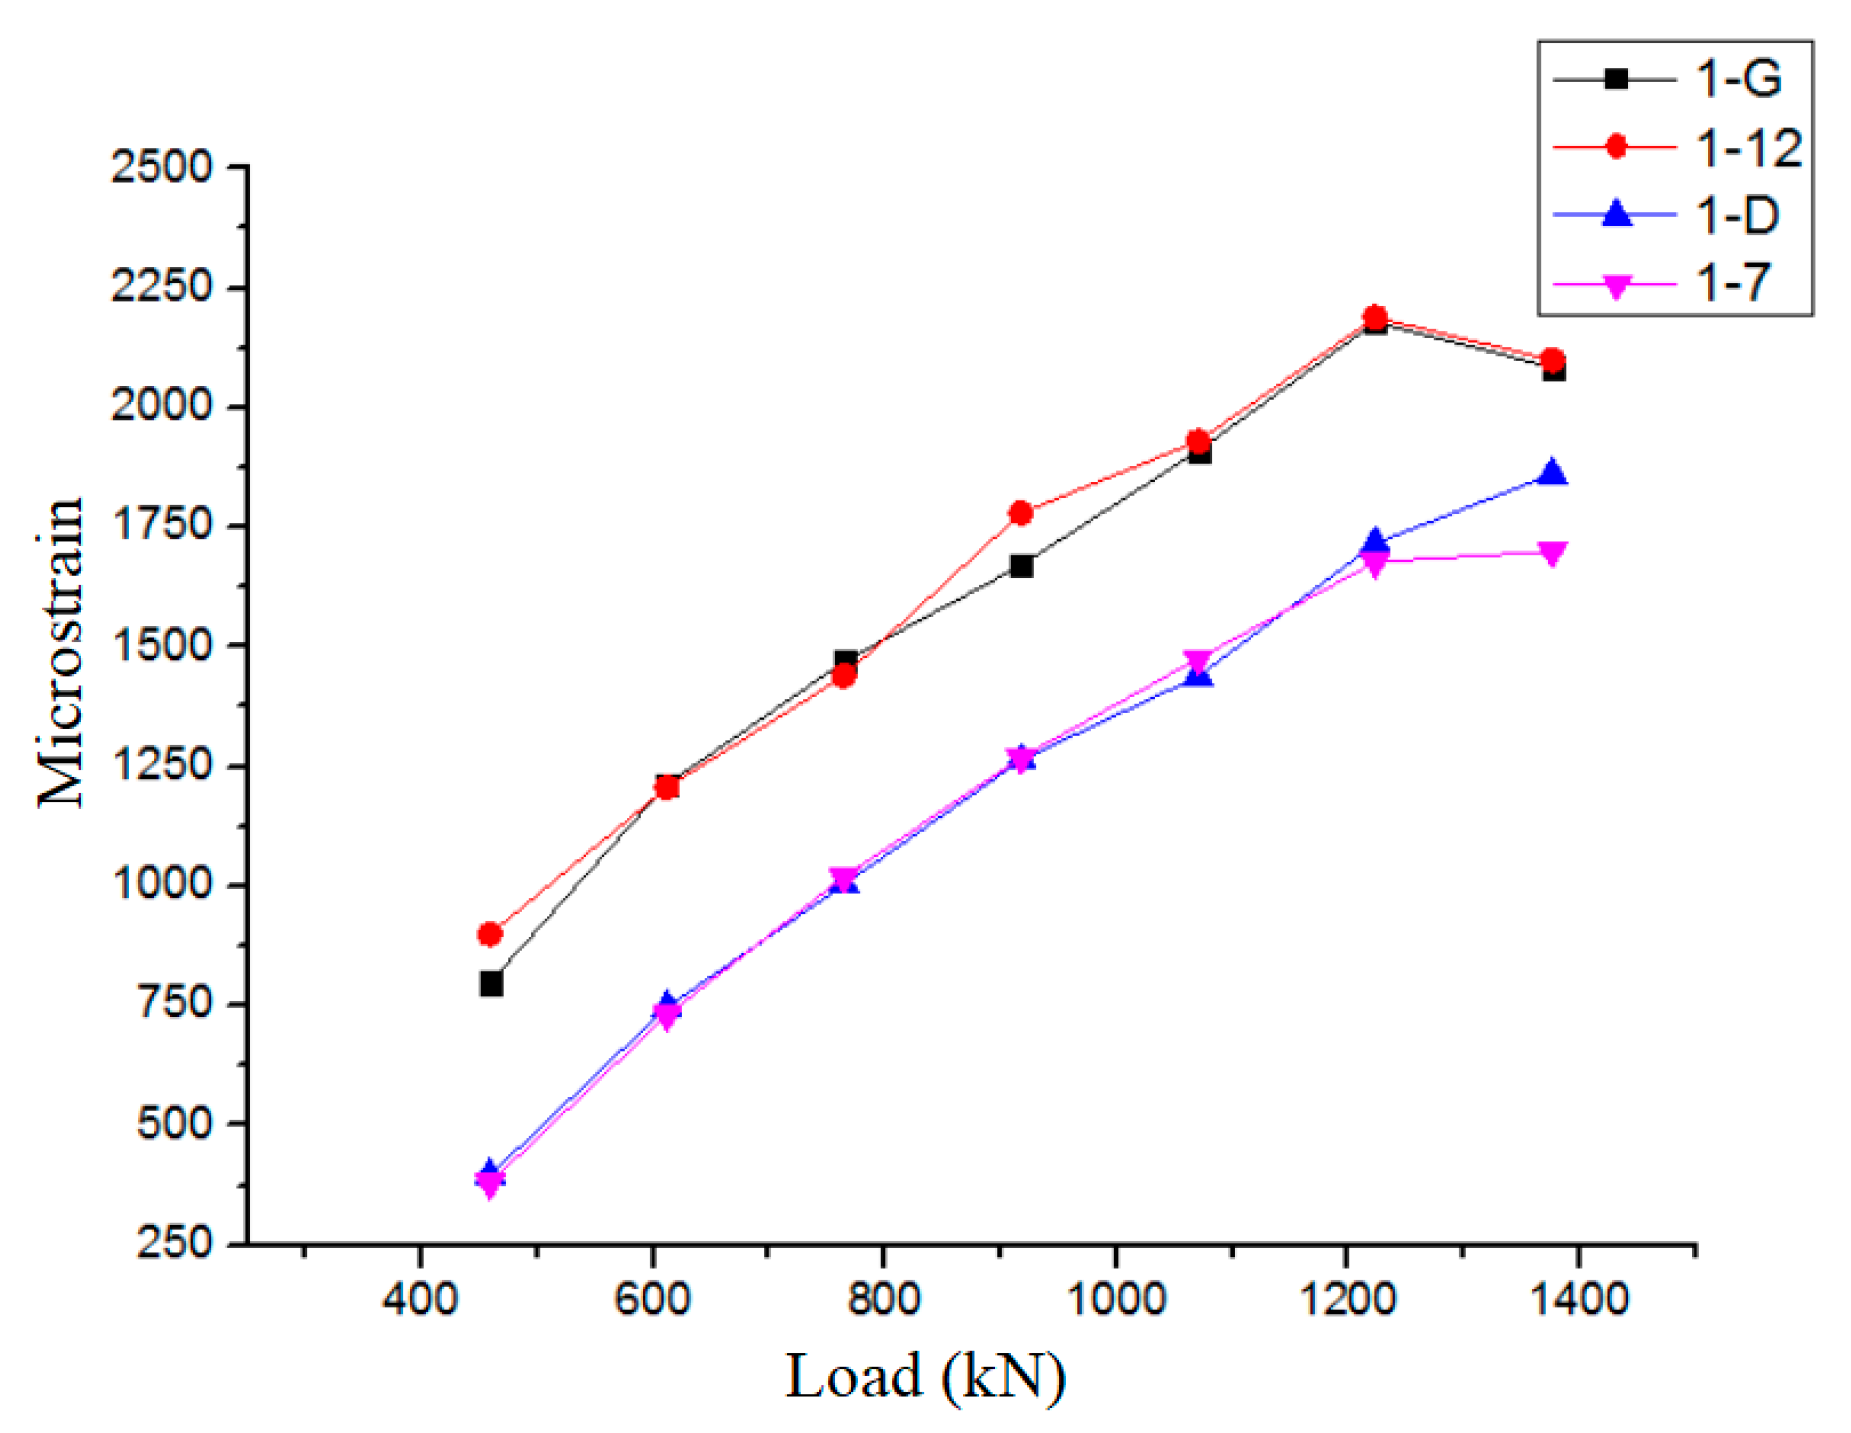
The experimental results obtained from the strain meters in Figure 16 were organized and plotted in Figure 19. The results in Figure 19 indicate a nearly linear relationship between the concrete strain and stress, suggesting that the anchor was operating within its elastic range. The data from strain gauge 1-A were nearly zero, indicating that the load was not transmitted to that depth (7.6 m anchorage depth). Combined with the force-displacement curve for the anchor, it can be concluded that the failure mode for this anchor was due to the bond strength failure at the interface between the anchorage body and the surrounding rock.
Figure 19. Load-strain curve for concrete strain gauges for Anchor 1.
The experimentally measured data of strain gauges 1–13 and 1–14 were extracted and compared with the theoretical results. The findings are presented in Table 5.
Table 5. Comparison between experimentally measured strain values and theoretical predictions.
The comparative results presented in Table 5 indicate that the experimentally measured values of free segment strain closely align with the theoretical calculations. The discrepancy between the measured values and the theoretical values is within 6.5%. The maximum measured strain is 3417 × 10 6 , with a corresponding maximum stress of 683.4 MPa. The primary sources of error include: the discrepancy between the idealized boundary conditions employed in the theoretical model and the complex, actual constraints present in field experiments; measurement uncertainties arising from subtle variations in local rock mass properties, differences in grouting quality, and potential minor errors in strain or displacement measurements, all of which can lead to deviations from the deterministic model predictions.
Comparative results for strain gauge and strain meter data at the same cross-section are shown in the following figures:
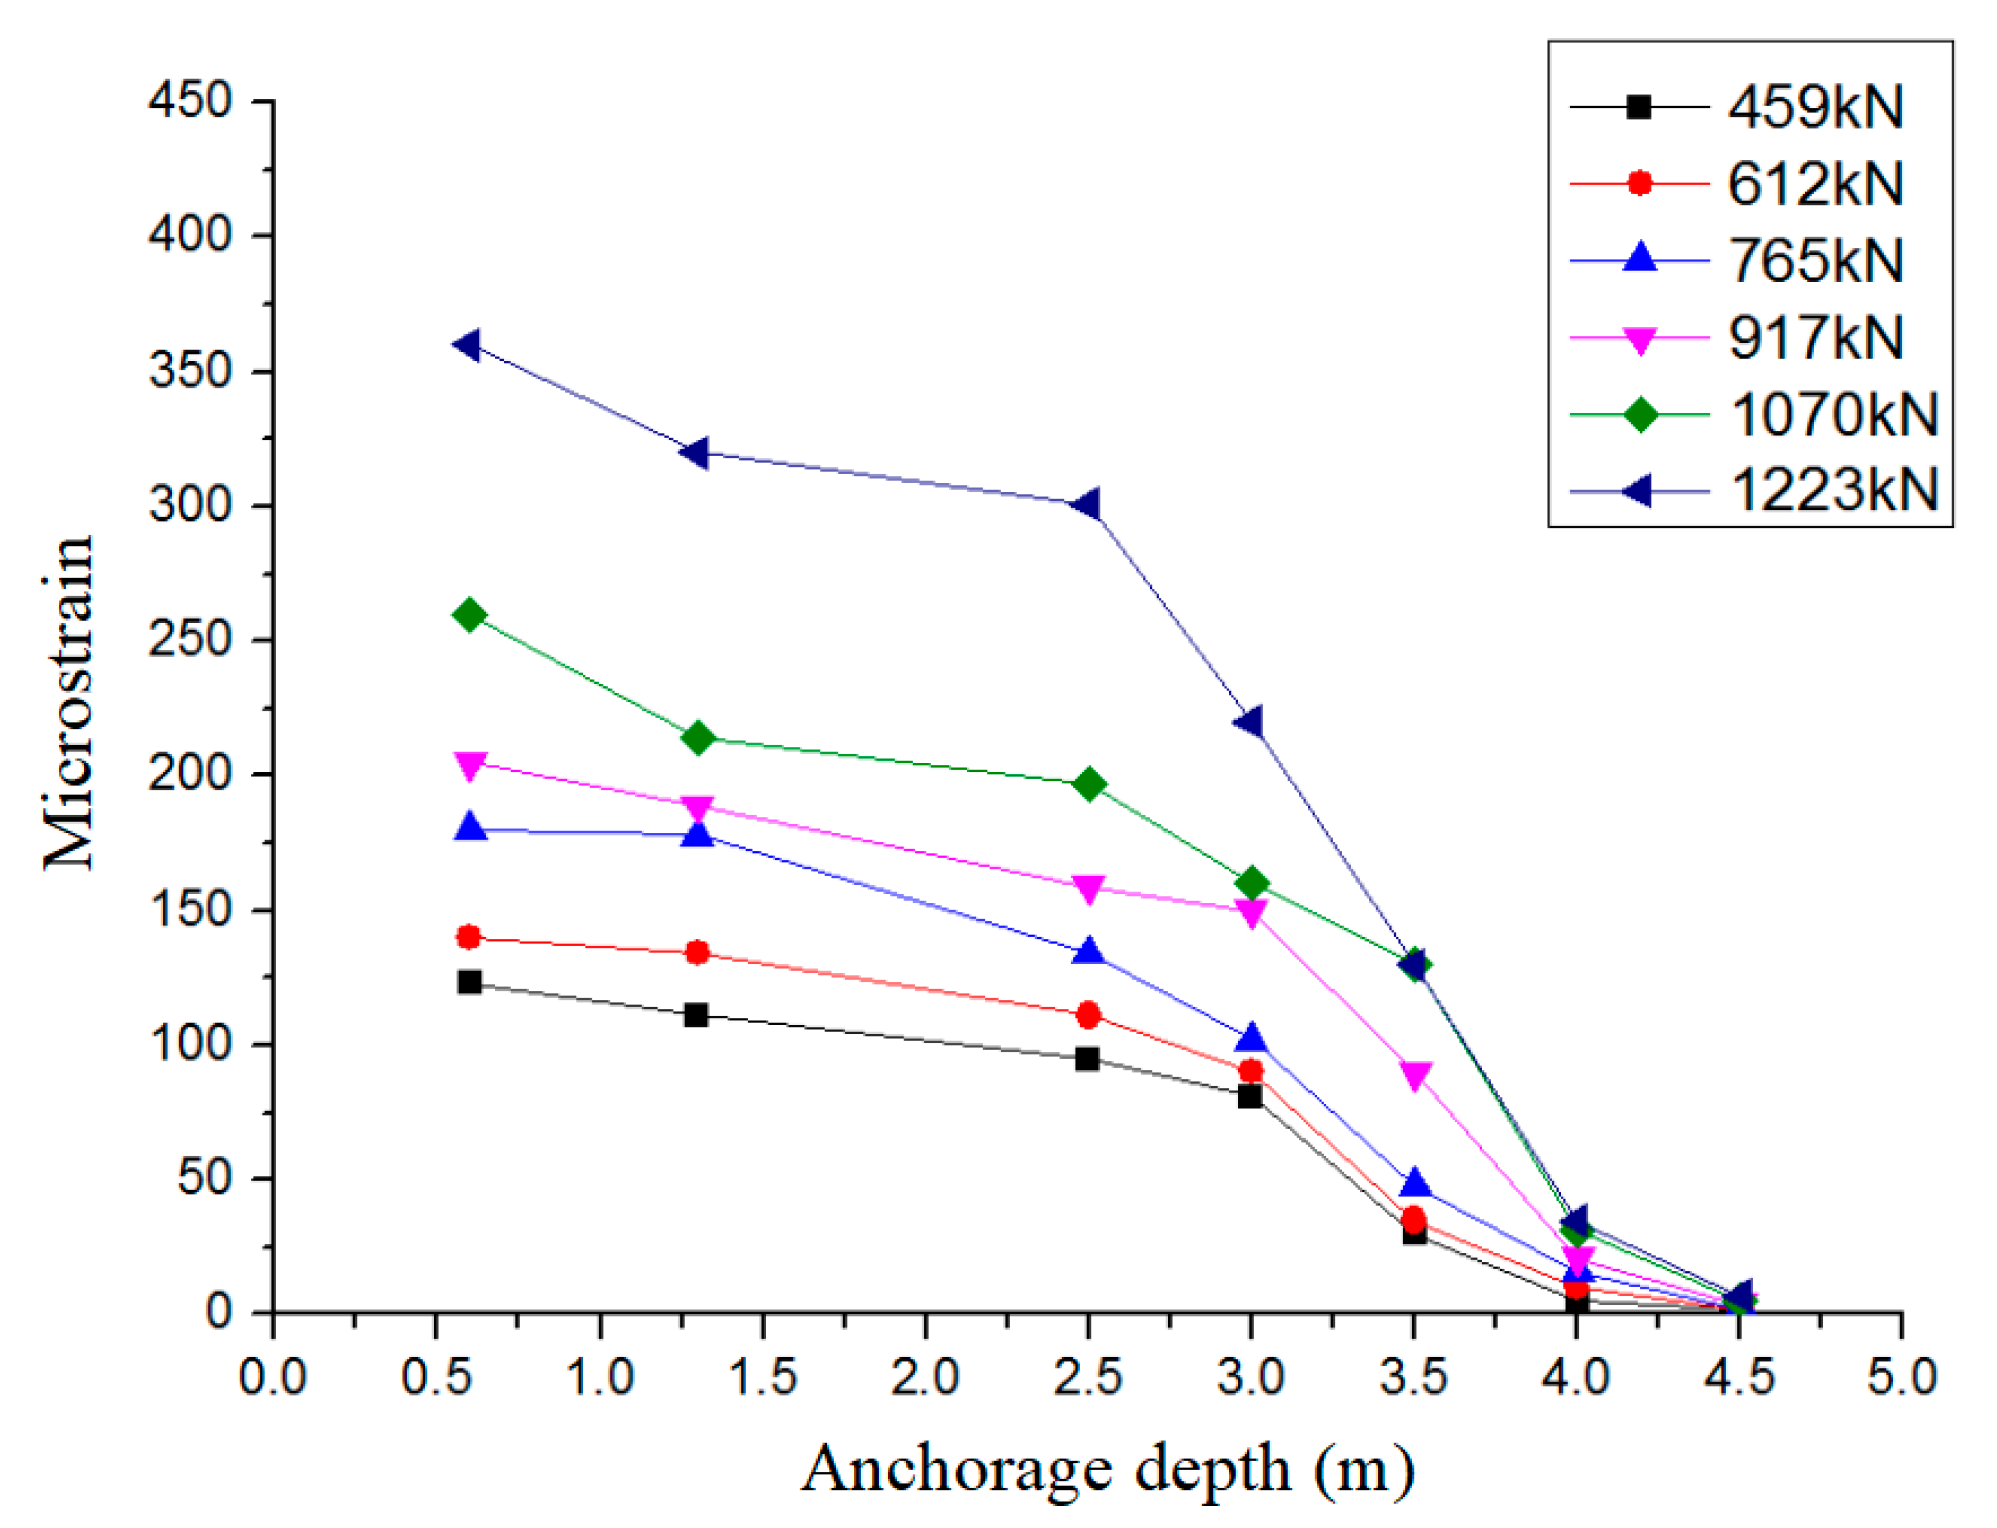
The results in Figure 20 demonstrate that throughout the loading process, the concrete strain within the anchorage segment was coordinated with the strain of the anchor, indicating that the interface between the anchor and the surrounding rock remained intact, with high bond strength. Figure 21 shows that as the load gradually increased, the force was transmitted downward along the depth of the anchor, with an effective transfer depth of approximately 6 m. The strains recorded were all elastic, and the bond strength distribution at the anchor-anchorage interface exhibited a linear pattern. The failure was attributed to the bond failure at the anchorage body-rock interface, resulting in the complete pullout of the anchorage body.
Figure 20. Comparison of strain gauge and strain meter data at the same cross-section.
Figure 21. Variation of strain with depth under different loads.
Based on the geological conditions at Site 9, a bond strength coefficient k of 0.35 was selected. According to Equation (24), we obtain
2 × 0.35 × π × 0.09 × ( 8 0.5 ) × C 1 + C 1 0.279 × π × 0.09 2 = 1376000 C 1 = 0.873   MPa .
Thus, the bond strength between the anchorage body and the surrounding rock for Anchor 1 is calculated to be 0.873 MPa.
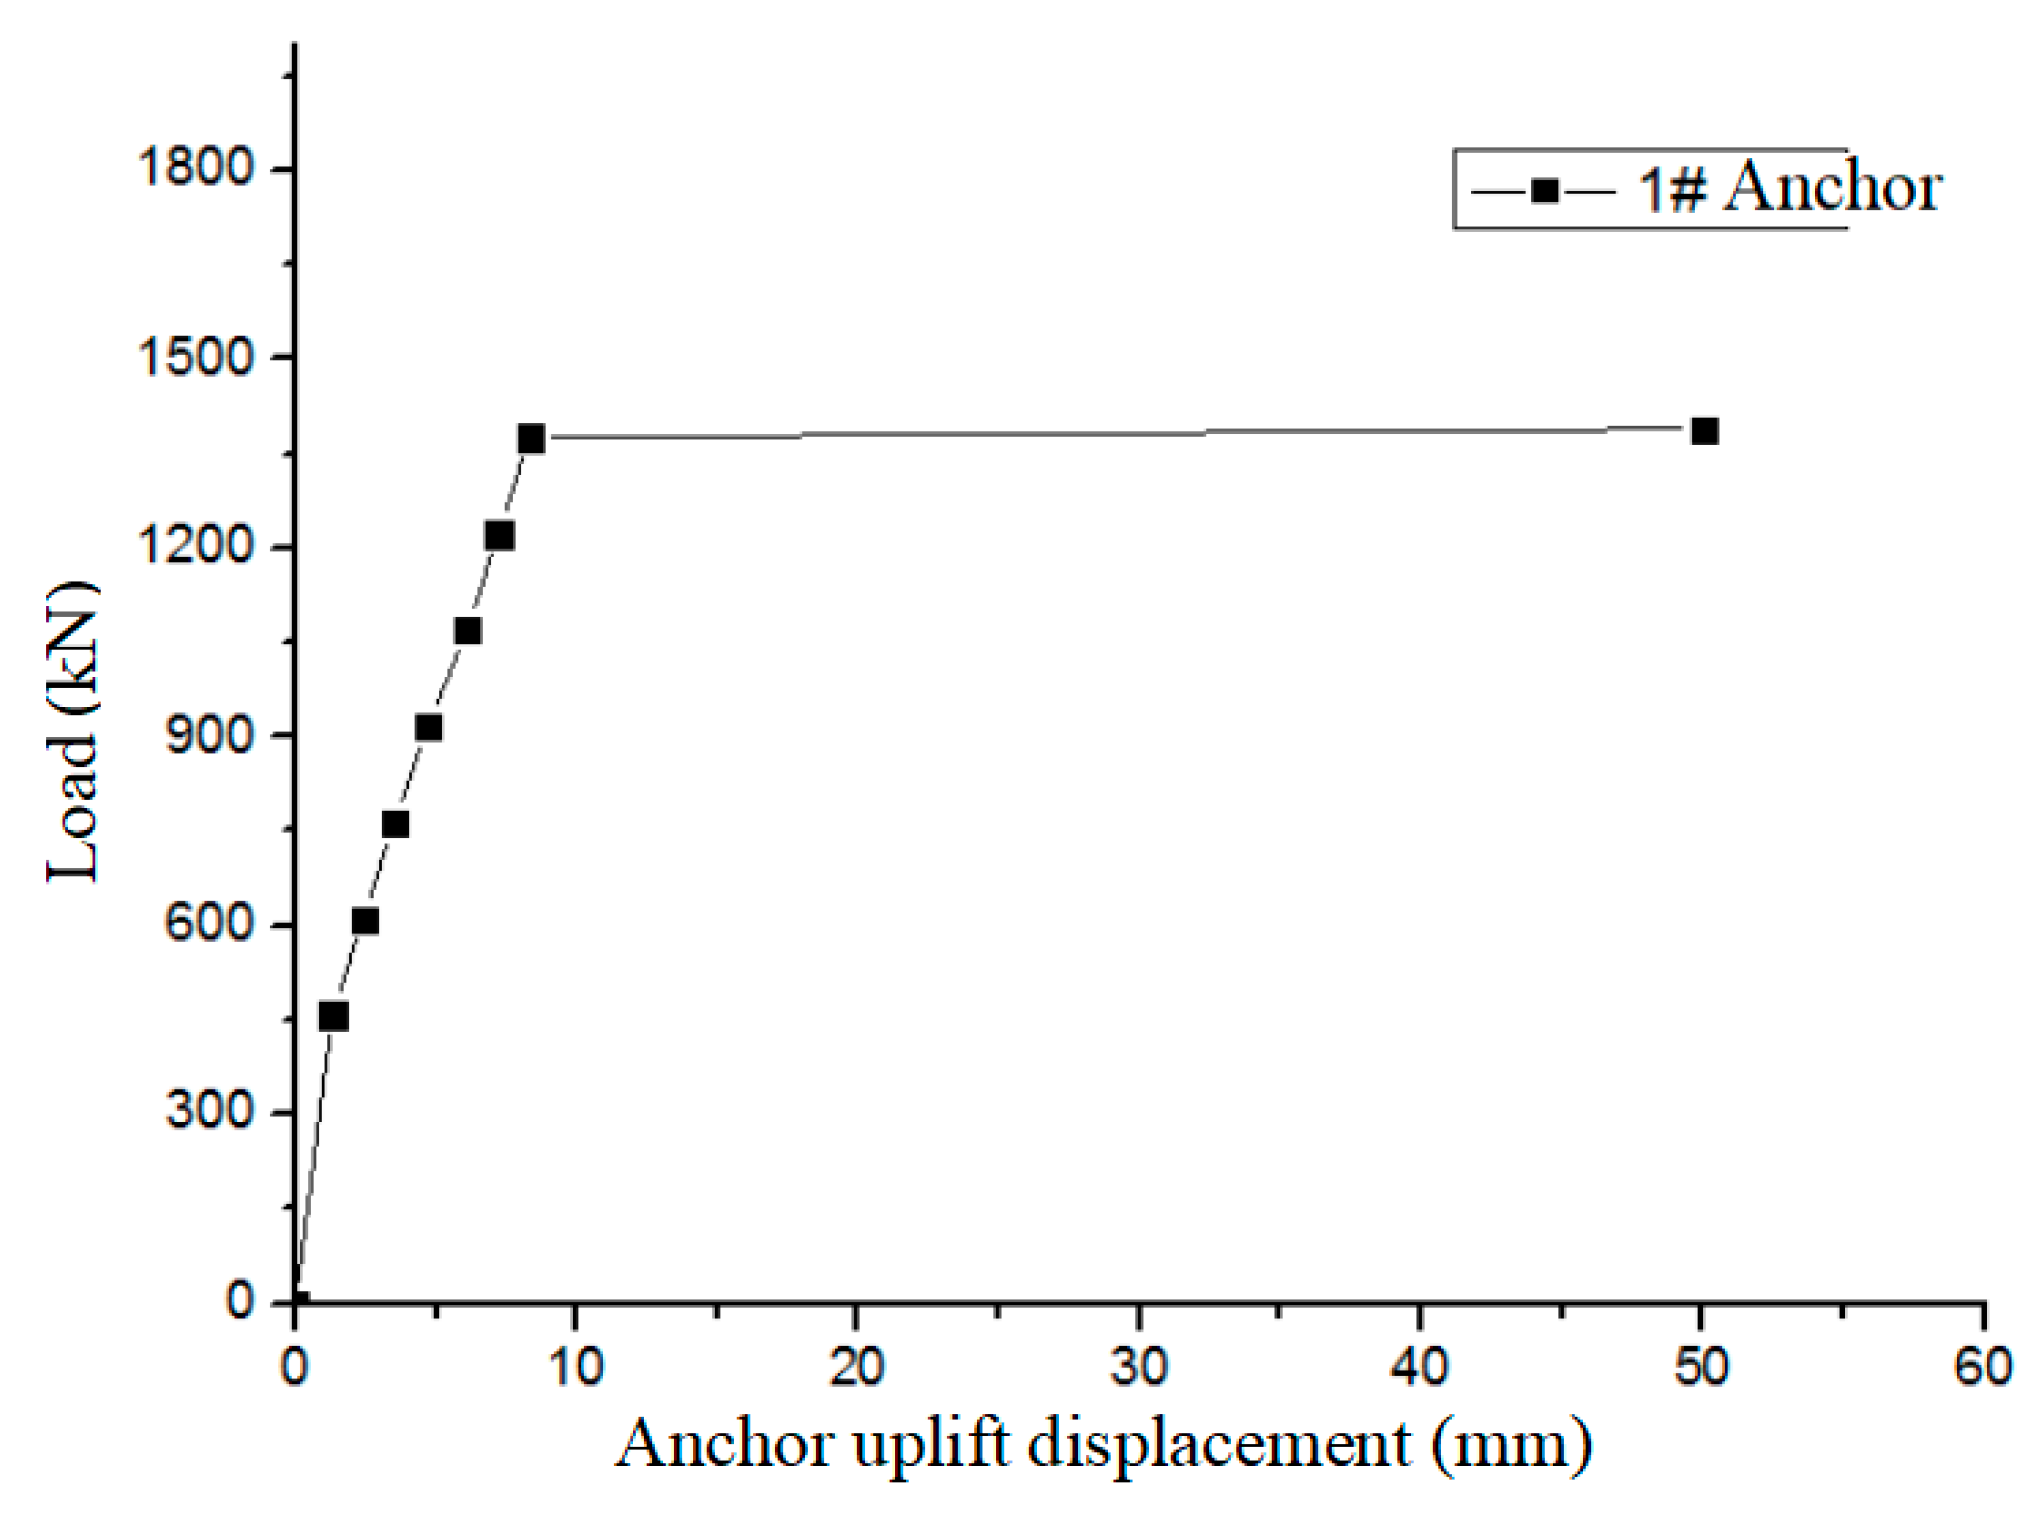
Figure 22 presents the displacement-load curve for Anchor 11, which reached its ultimate load capacity of 1223 kN when the hydraulic pressure was increased to 16 MPa. Figure 23 indicates that as the load gradually increased, the force was transmitted downward along the depth of the anchor, with an effective transfer depth of approximately 4 m, and the failure mode was again attributed to the bond failure at the interface between the anchorage body and the surrounding rock.
Figure 22. Pullout force-displacement curve for Anchor 11.
Figure 23. Load-strain curve for concrete strain gauges for Anchor 11.
Based on the geological conditions at Site 5, a bond strength coefficient k of 0.65 was selected. According to Equation (24), we obtain
2 × 0.65 × π × 0.09 × ( 3 0.5 ) × C 11 + C 11 0.279 × π × 0.09 2 = 1225000 C 11 = 1.213   MPa .
Thus, the bond strength between the anchorage body and the surrounding rock for Anchor 11 is calculated to be 1.213 MPa.
We summarize the actual anchorage depths and ultimate load capacities obtained from the experiments, as shown in Table 6.
Table 6. Ultimate load capacities of each anchor.
Special Notes: 1. For Anchor 8, the free length was filled with sand during loading, and the ultimate load capacity was reached before the hydraulic pressure reached 6 MPa, indicating a failure mode of bond failure at the interface between the anchorage body and the surrounding rock, with a load capacity estimated to be less than 500 kN. 2. Anchor 10, located at Site 5, encountered significant geological variability. The rock at this site was less weathered and more intact, resulting in higher surrounding rock strength and greater difficulty during drilling. Consequently, the actual drilling depth was only 4.5 m; the total length of the anchor was 6 m, with a first grouting depth of 3 m and a second grouting depth of 1.5 m before loading, leaving 1.5 m of the anchor exposed above ground.

5.2. Characteristic Values of Bond Strength at the Anchorage-Rock Interface

According to the “Technical code for testing of building foundation piles” (JGJ 106-2014) [], for design purposes, test piles should be loaded until the side friction of the rock-soil reaches its ultimate state or the material of the pile body reaches its design strength. During acceptance testing of engineering piles, the applied uplift load must be no less than 2.0 times the characteristic value of the vertical uplift bearing capacity of a single pile or must achieve the design requirement for uplift displacement at the pile head. The measured bond strength at the anchorage body-rock interface should therefore be divided by 2.0 to obtain the characteristic bond strength value. Using the calculation methods outlined in Equations (25) and (26), the characteristic bond strength values for each anchor are presented in Table 7.
Table 7. Characteristic bond strength values.

5.3. Calculation of Reasonable Anchorage Lengths to Meet Design Strength Requirement

In this full-scale test, all 12 samples exhibited failure modes characterized by bond failure at the interface between the anchorage body and the surrounding rock. Based on the measured results, the bond strength at the anchorage body-rock interface was calculated for each anchor. These results are now used to inform engineering design. Utilizing the mechanical model proposed in this study, we can back-calculate the reasonable anchorage lengths required to meet design strength requirements.
From Table 7, the characteristic bond strength values for Anchors 1 and 11 are as follows: f 1 = 0.436   MPa , f 11 = 0.607   MPa .
(1)
Calculation of reasonable anchorage length under rare load conditions
According to the results in Table 2, to satisfy the strength requirements under rare load conditions, while ensuring that the pedestal does not experience tensile stress, the prestress in the anchor should reach 1500 kN. The maximum working internal force in the anchor is 1506 kN, meaning the design load for the anchor is 1506 kN.
For Anchor 1, to meet the design requirements, let the reasonable length be L 1 :
2 × 0.35 × π × 0.09 × ( L 1 0.5 ) × f 1 + f 1 0.279 × π × 0.09 2 = 1506000 L 1 = 17.46   m .
For Anchor 11, similarly:
2 × 0.65 × π × 0.09 × ( L 11 0.5 ) × f 11 + f 11 0.279 × π × 0.09 2 = 1506000 L 11 = 7.01   m
(2)
Calculation of reasonable anchorage length under extreme load conditions
Based on the results in Table 3, to satisfy the strength requirements under extreme load conditions, while ensuring that the pedestal does not experience tensile stress, the prestress in the anchor should reach 1400 kN. The maximum working internal force in the anchor is 1404 kN, meaning the design load for the anchor is 1404 kN. Following similar calculations, the reasonable anchorage lengths for Anchors 1 and 11 are determined to be 16.3 m and 6.55 m, respectively. The reasonable anchorage lengths for the remaining anchors are summarized in Table 8.
Table 8. Reasonable anchorage lengths under rare and extreme load conditions.

6. Conclusions

Current foundation design codes do not yet offer detailed design methodologies for prestressed rock anchor foundations. This study systematically investigates the pull-out bearing capacity and design requirements of prestressed rock anchor foundations through mechanical analysis and full-scale testing. This comprehensive approach effectively overcomes the limitations of relying on a single research method, providing a more reliable theoretical basis for understanding the load transfer mechanisms and performance evaluation of anchor foundations.
The study derives an expression for the maximum working stress of a single anchor bolt, considering the interaction between the bearing platform and the surrounding soil. Based on this expression, design schemes suitable for various load conditions are proposed, with particular focus on determining the number of anchors and the magnitude of pre-stress. Additionally, the research explores the distribution characteristics of bond strength at the interface between the anchoring body and the surrounding rock, as well as the definition of effective anchorage length, thereby providing theoretical support for prestressed anchor foundation design.
In full-scale testing, two sites within the Xiangshan Wind Farm in Xunwu County, Jiangxi Province, with markedly different geological conditions, were selected to evaluate the uplift bearing capacity of the anchors. During the tests, strain measurements in the free segment closely matched the theoretical calculations, with discrepancies within 6.5%. The experimental results indicated that all specimens experienced complete pull-out, primarily due to the loss of bond strength at the interface between the anchoring body and the surrounding rock. By analyzing the test data, characteristic bond strength values for each anchor were obtained, which were then used to calculate the appropriate anchorage lengths required under rare and extreme load conditions.
It should be noted that the bond strength parameters and anchorage length recommendations derived in this study are primarily applicable to intact or moderately weathered rock masses with similar geological conditions. For adverse geological conditions such as fractured zones, karst regions, or weak interlayers, the parameter values should be appropriately reduced, and it is recommended to validate these through on-site testing. This study has certain limitations, including the omission of considerations related to creep and stress relaxation effects under long-term loading, the influence of groundwater seepage on bond performance, and the nonlinear interface slip behavior within complex rock masses. Future research should focus on establishing long-term monitoring systems, collecting data on the operational performance of structures, and conducting large-scale field tests across different geological units to refine the relationships between geological conditions and strength parameters. Additionally, developing finite element models that incorporate nonlinear bond–slip constitutive relationships would enhance the accuracy of critical failure state predictions.
In summary, the findings of this study provide a theoretical foundation, practical guidelines, and data support for the design of prestressed anchor bolt foundations, offering valuable reference for similar engineering applications. With ongoing research and continuous technological advancements, it is anticipated that anchor design schemes will be further optimized, thereby improving the safety and economic efficiency of such structures.

Author Contributions

Conceptualization, M.H., X.X. and R.Z.; methodology, X.X. and H.Y.; software, F.X., Z.H. and R.Z.; validation, H.Y., Z.H. and F.X.; formal analysis, X.X., M.H. and T.Z.; writing—original draft preparation, M.H. and T.Z. All authors have read and agreed to the published version of the manuscript.

Funding

This research was supported by the Science and Technology Project of Jiangxi Provincial Department of Transportation. (Awards No. 2023C0006); Jiangxi Provincial Natural Science Foundation, grant number 20224BAB214072 and the Jiangxi Province Education Science “14th Five-Year Plan” Project, grant number 22QN007.

Data Availability Statement

The data of this study are available from the corresponding author upon request.

Conflicts of Interest

Author Risheng Zhu was employed by the company Project Management Office of Shanghai-Kunming Expressway. Author Zhi Huang was employed by the company Jiangxi Gandong Road & Bridge Construction Group Ltd. The remaining authors declare that the research was conducted in the absence of any commercial or financial relationships that could be construed as a potential conflict of interest.

References

  1. Wang, Y.; Krishta David, T.; Mansor, H.; Guan, J. Managing inverted arch heaving in Sanlian Tunnel: Analysis of inverted arch structure utilizing prestressed anchor rods. Geotech. Geol. Eng. 2024, 42, 4477–4507. [Google Scholar] [CrossRef]
  2. Yu, W.; Wang, B.; Zi, X.; Dong, J. Elastoplastic coupling analysis of surrounding rock-prestressed yielding anchor bolts/cables based on unified strength theory. Tunn. Undergr. Space Technol. Inc. Trenchless Technol. Res. 2024, 143, 105491. [Google Scholar] [CrossRef]
  3. Zhou, Z.; Chen, Z.; He, C.; Jiang, C.; Li, T. A solution method for tunnel supporting structure system incorporating the active control of surrounding rock deformation. Int. J. Geomech. 2024, 24, 04023243. [Google Scholar] [CrossRef]
  4. Li, P.; Chen, Y.; Huang, J.; Wang, X.; Liu, J.; Wu, J. Design principles of prestressed anchors for tunnels considering bearing arch effect. Comput. Geotech. 2023, 15, 105307. [Google Scholar] [CrossRef]
  5. Pi, J.; Zhao, Y.F.; Cao, R.L.; Jia, Z.X. Anchor spacing design of pre-stressed tunnel concrete lining with un-bonded annular anchors for Songhua River water supply project. Key Eng. Mater. 2017, 737, 505–510. [Google Scholar] [CrossRef]
  6. Wu, Y.; Fu, Y.; Hao, D.; Guo, G. Experimental research on the mechanical performance of the bolted rock under lateral impact load: Effect of prestress, body material, and anchorage style. Shock Vib. 2020, 2020, 8851364. [Google Scholar] [CrossRef]
  7. Zhou, M.; Wang, L. Optimizing the design of rock anchors based on field tests. J. Geotech. Geoenviron. Eng. 2022, 148, 04021123. [Google Scholar]
  8. Li, G.; Hu, Y.; Tian, S.M.; Ma, W.; Huang, H.L. Analysis of deformation control mechanism of prestressed anchor on jointed soft rock in large cross-section tunnel. Bull. Eng. Geol. Environ. 2021, 80, 9089–9103. [Google Scholar] [CrossRef]
  9. Guo, X.; Zheng, X.; Li, P.; Lian, R.; Liu, C.; Shahani, N.M.; Wang, C.; Li, B.; Xu, W.; Lai, G. Full-stress anchoring technology and application of bolts in the coal roadway. Energies 2021, 14, 7475. [Google Scholar] [CrossRef]
  10. Zhang, J.; Liu, L.; Liu, C.; Li, Y. Mechanism and application of new prestressed yield bolt for controlling deep high-stress rock mass. Tunn. Undergr. Space Technol. Inc. Trenchless Technol. Res. 2022, 119, 104254. [Google Scholar]
  11. Wang, Z.; Zhang, Z.; Dai, G.; Zhou, Y.; Su, T.; Ma, T. Seismic displacement analysis of slope reinforced by frame prestressed anchor rod structure. Soil Dyn. Earthq. Eng. 2024, 181, 108666. [Google Scholar] [CrossRef]
  12. Zeng, H.; Ye, S.; Zhang, J. Seismic stability analysis of slope reinforced by frame anchors considering prestress. KSCE J. Civ. Eng. 2024, 28, 1238–1252. [Google Scholar] [CrossRef]
  13. Zhao, Z.; Zhu, Y.; Hou, H.; Li, L. Stability analysis of loess fill slope supported by frame prestressed anchors considering tensile strength cut-off. Sci. Rep. 2024, 14, 3007. [Google Scholar] [CrossRef]
  14. Ye, S.; Fang, G.; Zhu, Y. Model establishment and response analysis of slope reinforced by frame with prestressed anchors under seismic considering the prestress. Soil Dyn. Earthq. Eng. 2019, 122, 228–234. [Google Scholar] [CrossRef]
  15. Nakamoto, S.; Seki, S.; Iwasa, N.; Takemura, J. A centrifuge model study on a slope reinforced by rock bolts with prestressed facing plate. Jpn. Geotech. Soc. Spec. Publ. 2016, 2, 948–952. [Google Scholar] [CrossRef]
  16. Wang, H.; Cheng, J.-h.; Guo, Y.-c.; Gao, X.-j. Failure mechanism of soil nail—Prestressed anchor composite retaining structure. Geotech. Geol. Eng. 2016, 34, 1889–1898. [Google Scholar] [CrossRef]
  17. Fu, K.Y.; Wu, Z.Y.; Hao, Y.D. Experimental study on lateral impact resistance of the prestressed anchored rock mass. Arab. J. Geosci. 2023, 16, 569. [Google Scholar] [CrossRef]
  18. Kang, Y.; Hou, C.; Xu, C.; Liu, B.; Xiao, J. Investigation on mechanical behavior of pre-tensioned bolt in fractured rock mass using continuum discontinuum element method (CDEM). Eng. Anal. Bound. Elem. 2023, 151, 30–40. [Google Scholar] [CrossRef]
  19. Jiang, M.; Bo, Y.; Wang, H.; Che, N. Study on the reinforcement mechanism of grouted bolts with or without prestress via the hybrid DEM-FDM method. Transp. Geotech. 2023, 40, 100967. [Google Scholar] [CrossRef]
  20. Bui, T.Q. Finite element analysis of rock anchors in various geological conditions. Comput. Geotech. 2020, 120, 103426. [Google Scholar]
  21. Yang, X.; Zhang, T. The role of anchorage length in the performance of rock anchors. Int. J. Geomech. 2021, 21, 04020106. [Google Scholar]
  22. Zhao, T.; Wang, X.; Liu, G.; Zhu, J.; Yin, S. The thermal conductivity of graphite composite insulation boards: A theoretical and experimental study. Compos. Sci. Technol. 2024, 256, 11076. [Google Scholar] [CrossRef]
  23. Kumar, A. Assessment of the bond strength of rock anchors: A case study. Geotech. Test. J. 2020, 43, 546–558. [Google Scholar]
  24. Alavi, A.; Ranjbar, A. Laboratory investigation of the bond strength of rock anchors. Soils Found. 2018, 58, 675–689. [Google Scholar]
  25. Teng, T.; Chen, Y.; Wang, Y.; Qiao, X. In Situ Nuclear Magnetic Resonance Observation of Pore Fractures and Permeability Evolution in Rock and Coal under Triaxial Compression. J. Energy Eng. 2025, 151, 04025036. [Google Scholar] [CrossRef]
  26. Ranjbarnia, M.; Rashedi, M.M.; Dias, D. Analytical and numerical simulations to investigate effective parameters on pre-tensioned rockbolt behavior in rock slopes. Bull. Eng. Geol. Environ. 2022, 81, 74. [Google Scholar] [CrossRef]
  27. Xu, R.; Zhou, H. Experimental investigation of the anchoring effect of two different types of rock bolts on fractured rock. Adv. Mater. Sci. Eng. 2019, 2019, 9290318. [Google Scholar] [CrossRef]
  28. Zhao, T.; Wang, X.; Yin, S. Comprehensive average model for determining the effective thermal conductivity of graphite composite insulation boards: Experimental validation and numerical simulation verification. J. Build. Eng. 2024, 95, 110217. [Google Scholar] [CrossRef]
  29. Zhong, Z.; Li, Y.; Huang, D. Prestress loss mechanism and constitutive model of an anchored joint rock mass under low-frequency fatigue loading. Rock Mech. Rock Eng. 2022, 56, 1517–1535. [Google Scholar] [CrossRef]
  30. Xu, Z.L. Elementary Course on Elastic Mechanics, 5th ed.; Higher Education Publisher: Beijing, China, 2018; pp. 181–182. [Google Scholar]
  31. GB 50007-2011; Code for Design of Building Foundation. China Architecture & Building Press: Beijing, China, 2011.
  32. JGJ 106-2014; Technical Code for Testing of Building Foundation Piles. China Architecture & Building Press: Beijing, China, 2014.
Disclaimer/Publisher’s Note: The statements, opinions and data contained in all publications are solely those of the individual author(s) and contributor(s) and not of MDPI and/or the editor(s). MDPI and/or the editor(s) disclaim responsibility for any injury to people or property resulting from any ideas, methods, instructions or products referred to in the content.

Article Metrics

Citations

Article Access Statistics

Multiple requests from the same IP address are counted as one view.