Abstract
In precast concrete shear wall structures, the joints formed during the vertical connection of precast units are referred to as the “horizontal joint”. Serving as vertical connection nodes in this structure system, the construction quality of theses horizontal joints significantly influences the structural integrity. To investigate the influence of horizontal joint quality defects on the mechanical behaviour of precast concrete shear walls, three precast concrete shear wall specimens with quality defects in different regions and three control specimens were designed. Quasi-static tests under a constant axial load were conducted to investigate the effects of defect area, location and other factors on the mechanical behaviour of the walls. Results demonstrate that the quality defects in horizontal joints significantly affect the mechanical behaviour of precast concrete shear walls. When the ratio of the quality defect area to the cross-sectional area of the boundary member reaches 100%, the yield load and peak load of the precast concrete shear wall decrease by 13% and 20%, respectively. Additionally, the structural stiffness exhibited a 13% degradation at a drift angle of 1/1000. Although the failure mode remains largely unchanged, yielding of longitudinal reinforcement in the boundary members is observed. Moreover, as the proportion of the quality defect area to the cross-sectional area decreases, its adverse effects on the mechanical behaviour of the precast concrete shear wall gradually diminish. The established numerical analysis model is shown to be reasonable and reliable. When the defective area of the horizontal joints is less than 25% of the total cross-sectional area, the quality defects essentially have no influence on the mechanical behaviour of the precast concrete shear walls.
1. Introduction
In recent years, prefabricated buildings have experienced rapid development, with an average annual growth rate exceeding 30% [1]. As one of the primary structural forms of prefabricated buildings, precast concrete shear wall structures exhibit high load-bearing capacity, excellent seismic performance and significant lateral stiffness, which contribute to their widespread application in residential construction [2,3]. The connection technology between prefabricated units serves as the critical technology in precast concrete shear wall structures [4], where vertical connection primarily transmits vertical loads, resisting horizontal shear forces and significantly contributing to structural integrity and seismic performance. Qian et al. [5,6], Jiang et al. [7,8] and Kurama et al. [9,10], among other scholars, have conducted extensive experimental and theoretical studies on the seismic performance of precast concrete shear walls with different vertical connection details. The results demonstrate that properly designed precast concrete shear walls exhibit satisfactory integrity. Their seismic performance indicators are essentially equivalent to those of cast-in-place structures, meeting the requirements for application in seismic regions.
The joint formed during the vertical connection of precast units is referred to as the “horizontal joint”. In precast concrete shear walls, horizontal ducts are typically pre-reserved at the horizontal joint for concrete casting or a mortar bedding layer is provided to enhance the integrity of the connection [11], as illustrated in Figure 1. During actual construction, under the combined effects of loads and environmental factors, the cast-in-place concrete or mortar bedding layer at the horizontal joint is prone to initial defects such as cracks and voids. These defects can lead to issues including non-uniform stress distribution within the components [12] and premature failure at the structural level [13], ultimately resulting in reduced durability and load-bearing capacity of the concrete structure, and potentially even triggering severe safety incidents.
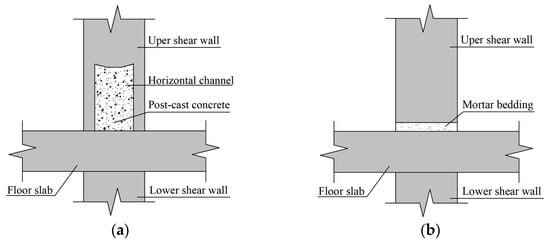
Figure 1.
Structure of horizontal joint. (a) Horizontal channel. (b) Mortar bedding.
Leveraging well-established nondestructive testing methods for concrete [14,15,16], researchers have conducted comprehensive experimental and theoretical investigations into the quality defects present in precast concrete members during construction. Feng et al. [17] investigated the influence of interface defects on the flexural performance of composite beams. The results revealed that when the defect length exceeded a critical threshold, its detrimental effect on flexural capacity significantly intensified. Additionally, for defects of identical length, their locations exhibited varying degrees of impact on the load-bearing capacity. Zhang et al. [18] investigated the influence of defect area on the flexural performance of composite slabs by introducing defects at the interface of the slabs. The results demonstrated that the cross-sectional stiffness was significantly reduced as the defect area increased. Xiao et al. [19] studied the effect of defective grouting sleeve placement on the seismic behaviour of concrete shear walls. The results demonstrated that the load-bearing capacity of the walls was significantly reduced when defective grouting sleeves were placed in the boundary member regions. Cao et al. [20] investigated the influence of defective grouting sleeve quantity on the seismic performance of precast monolithic concrete shear walls through numerical simulations. Walls were found to have failed in meeting seismic design requirements when the defective sleeve ratio exceeded 25%.
Previous studies have indicated that quality defects in the connection nodes of precast concrete members significantly impair their mechanical behaviour. However, research on the quality defects of horizontal joints in precast concrete shear walls has not yet been reported. To investigate the influence of quality defects in horizontal joints on the mechanical behaviour of precast concrete shear walls, this study designed six full-scale precast concrete shear wall specimens, including three intact specimens and three specimens with quality defects in different regions. Quasi-static tests under constant axial load were conducted to examine the effects of defect area, location and other factors on the mechanical behaviour of the walls. The findings aim to provide a reference for the promotion and application of wet connection technology in precast construction.
2. Experimental Programme
2.1. Wall Geometry and Reinforcement
Six shear wall specimens were designed, each consisting of a loading beam, a wall panel and a ground beam. The wall cross-section measured 1600 mm × 200 mm and was constructed by closely assembling two precast wall panels. Each precast wall panel had a cross-section of 800 mm × 200 mm and included boundary members, vertical circular holes with 120 mm diameter and a transverse groove with a cross-section of 120 mm × 200 mm. The loading pint was set at a heigh of 2400 mm, corresponding to a shear span ratio of 1.5, and were tested under an axial compression ratio of 0.15. The detailed configuration is illustrated in Figure 2a.
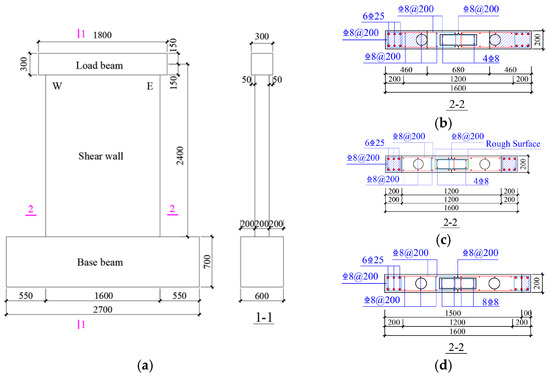
Figure 2.
Section dimensions and reinforcing details. Note: The shadow part represents the defect area. (a) Elevation drawing of specimen. (b) Cross-section of PSW1. (c) Cross-section of PSW2. (d) Cross-section of PSW3.
The specimens were designed on the basis of the principle of strong bending and weak shear. The reinforcement details for each specimen are shown in Figure 2b–d. The boundary members were reinforced with 6C25 longitudinal bars, corresponding to a reinforcement ratio of 7.36%. The stirrups were C8@200, with a volumetric stirrup ratio of 0.72%. Both the horizontal and longitudinal distributed reinforcements were C8@200. Additionally, longitudinal grooves were provided with connecting bars (C8@200) and longitudinal bars (2C8 on each side of the groove). Concrete was then poured to achieve the connection between the precast wall panels.
Based on the research program, the six specimens were divided into three groups (i.e., Group 1, Group 2 and Group 3). Each group consisted of one intact specimen and one defective specimen, labelled as PSWi-A and PSWi-B, respectively, where ‘i’ denotes the group number, ‘A’ represents the intact specimen and ‘B’ represents the defective specimen. Within the same group, all parameters were identical except for the defect design. The defects were intentionally designed as concrete casting cavities, simulated by incorporating 20 mm thick foam panels to replicate cavity conditions typical of actual concrete casting processes. The precise locations and dimensions of these cavities are depicted by the shaded regions in Figure 2b–d, while a schematic representation of the defect configuration is provided in Figure 3. Group 1 specimens served as the baseline. In specimen PSW1-B, the defects were located in the boundary member region and extended into the central wall panel, with a defect length of 460 mm on both sides. Group 2 specimens were designed with varying surface roughness. Compared with Group 1, specimen PSW2-A featured a roughened surface at the bottom of the transverse groove (indicated by the green color in Figure 2c), whilst specimen PSW2-B had defects covering the entire boundary member region, with a defect length of 200 mm on both sides. Group 3 specimens were designed with varying longitudinal reinforcement ratios in the longitudinal groove. Compared with Group 1, specimen PSW3-A had an increase in longitudinal reinforcement from 4 to 8 bars within the longitudinal groove, whilst specimen PSW3-B had a defect located in a partial region of the eastern boundary member, with a defect length of 100 mm.

Figure 3.
Cavity indication of each defect specimen. (a) Specimen PSW1-B. (b) Specimen PSW2-B. (c) Specimen PSW3-B.
2.2. Material
2.2.1. Steel
During the fabrication of the specimens, reinforcement bars from the same batch were reserved. The average yield strength (fy), average tensile strength (fu) and elongation after fracture (δ) of the reinforcement bars were measured, as summarised in Table 1.

Table 1.
Tested strength of the reinforcements.
2.2.2. Concrete
On the day of testing, the average compressive strengths of precast concrete cube specimens (fcu,p) and cast-in-place concrete cube specimens (fcu,c) were measured. The average axial compressive strength (fc,m) was calculated using the formula as follows:
where and represent the area ratios of precast concrete and cast-in-place concrete in the wall cross-section, respectively, as detailed in Table 2.

Table 2.
Tested compressive strengths of the concrete.
2.3. Test Setup and Testing Procedure
2.3.1. Test Setup and Loading Protocol
Figure 4 depicts the test setup. The test was designed to investigate seismic behavior by applying a constant axial load, thus neglecting the fluctuations in axial force induced by horizontal seismic actions. The axial load and horizontal load were applied using a 3000 kN vertical jack and a 2000 kN horizontal jack, respectively. During the test, 50% of the axial load was initially applied for pre-compression, held for 5 min and then unloaded to 0. Subsequently, the axial load was increased to the target constant value and remained stable throughout the test.
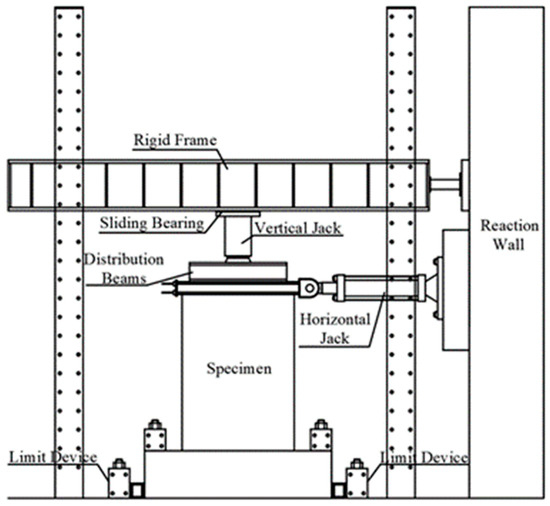
Figure 4.
Test setup.
The horizontal load was applied using a load–displacement hybrid control method. During the load-controlled phase, the horizontal load was increased in increments of 300 kN, with each increment cycled once. After typical diagonal cracks appeared on both sides of the wall, the displacement corresponding to this load level was defined as the yield displacement. The test then transitioned to displacement-controlled loading, with increments set as integer multiples of the yield displacement. Each increment was cycled three times until specimen failure or until the inter-story drift at the loading point reached approximately 1/50, at which point the test was terminated.
2.3.2. Layout of Measurement Points
Figure 5 illustrates the layout of displacement and strain measurement points. Displacement measurements were taken at the loading point to record horizontal displacements (MD1E and MD1W). Twenty-four resistance strain gauges were installed to measure the strain in reinforcement at various locations, including the root strains of longitudinal reinforcement in the boundary members (ES1–ES2 and WS1–WS2) and the strains of horizontally distributed reinforcement (EH1–EH13 and WH1–WH7).
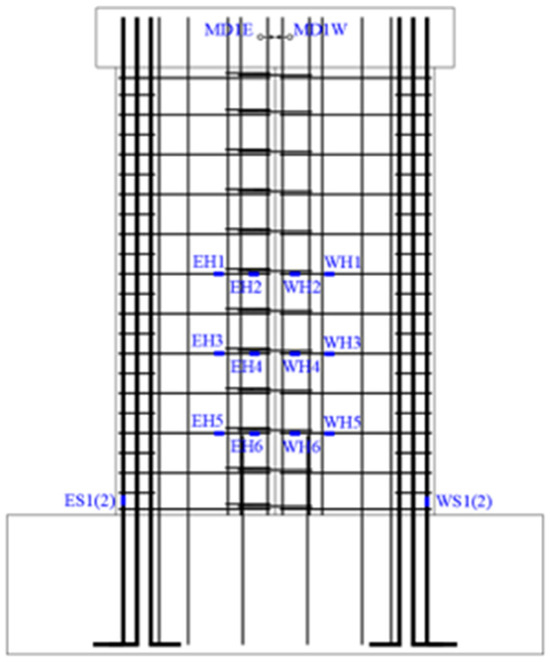
Figure 5.
Distributions of displacement meters and strain gauges.
3. General Behaviour and Failure Mode
None of the specimens exhibited brittle failure. At peak load, the horizontal distributed reinforcement in each specimen yielded in tension, whereas the longitudinal reinforcement in the boundary members remained in the elastic stage. The concrete at the roots remained largely intact, achieving the design objective of strong bending and weak shear.
The testing process can be divided into the following three main stages:
- (1)
- Stage 1: Pre-yielding
In this stage, diagonal cracks first appeared at the vertical circular holes on both sides of the wall. Flexural horizontal cracks formed in the middle and lower parts of the boundary members and developed diagonally downward into flexural-shear diagonal cracks, marking the onset of the yield stage.
- (2)
- Stage 2: Post-yield to peak load
After yielding, spalling and debris shedding occurred at the diagonal cross cracks near the vertical circular holes. Partial yielding of the horizontal distributed reinforcement was observed, and the wall reached its peak load.
- (3)
- Stage 3: Post-peak stage
In this stage, the relative deformation on both sides of the diagonal cracks increased, leading to the formation of vertical cracks. The wall was divided into multiple wall columns, transitioning from whole-section behaviour to a segmented-wall behaviour. No brittle failure occurred, and the wall ultimately reached its failure state.
3.1. Group 1 of Specimens
For specimen PSW1-A, when the controlled load reached 500 kN, multiple short diagonal cracks appeared at the positions corresponding to the vertical circular holes on both sides of the wall. At a controlled load of 660 kN, fine horizontal cracks formed at the intersections of the wall and the ground beam on both sides. When the controlled load reached 886 kN, horizontal cracks appeared at the boundary members at the wall ends and developed diagonally downward into diagonal cracks, marking the yielding of the wall with a yield displacement of 3.9 mm.
After yielding, the control method was switched to displacement control. At a controlled inter-story drift of 1/1000, diagonal cracks near the vertical circular holes on the east and west sides intersected, forming macroscopic vertical cracks. At a controlled inter-story drift of 1/250, the wall reached its peak state, with cracks primarily consisting of intersecting diagonal cracks near the vertical circular holes, horizontal cracks in the boundary members and long diagonal cracks on both sides as shown in Figure 6a. At a controlled inter-story drift of 1/140, the macroscopic vertical cracks on the east and west sides intensified, forming distinct vertical cracks. This phenomenon prevented the development of overall diagonal cracks and avoided brittle failure of the wall as illustrated in Figure 7a.
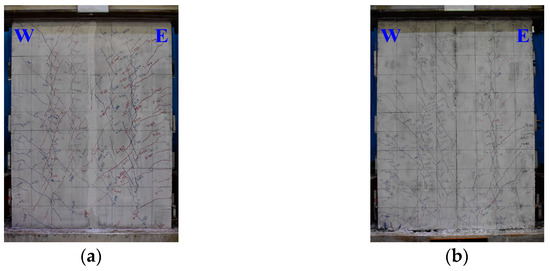
Figure 6.
Failure mode of spmens at peak point. (a) PSW1-A. (b) PSW1-B.
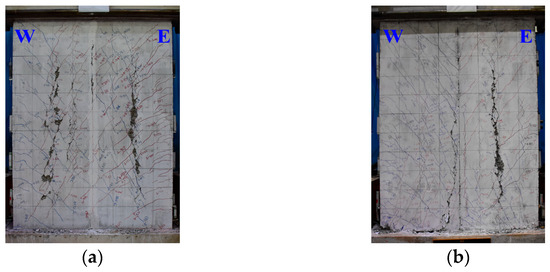
Figure 7.
Failure mode of specimens at ultimate point. (a) PSW1-A. (b) PSW1-B.
Compared with specimen PSW1-A, the load at which cracks initiated in specimen PSW1-B was significantly lower. The load for the formation of horizontal cracks at the root was 440 kN, representing a 51% reduction compared with PSW1-A. The load for the development of flexural-shear diagonal cracks at the boundary members of the wall ends was 807 kN, a 10% reduction compared with PSW1-A. The yield displacement of the wall was 5.4 mm, a 39% increase compared with PSW1-A. Owing to the presence of defects, slight crushing of the concrete at the roots on both sides of the wall was observed at peak load as shown in Figure 6b. As the controlled inter-story drift increased, a vertical crack extending upward appeared at the defect location on the west side of the wall. The horizontal joint defect in the central wall region altered the local failure characteristics of the specimen, as illustrated in Figure 7b.
3.2. Group 2 and 3 of Specimens
Figure 8 and Figure 9 illustrate the crack propagation at peak load and failure load for each specimen, respectively.

Figure 8.
Failure mode of specimens at peak point. (a) PSW2-A. (b) PSW2-B. (c) PSW3-A. (d) PSW3-B.

Figure 9.
Failure mode of specimens at ultimate point. (a) PSW2-A. (b) PSW2-B. (c) PSW3-A. (d) PSW3-B.
For specimen PSW2-B, the load for the formation of horizontal cracks at the root was 495 kN, a 7% reduction compared with PSW2-A. The load for the development of flexural-shear diagonal cracks at the boundary members of the wall ends was 853 kN, a 6% reduction compared with PSW2-A. The yield displacement was 4.1 mm, a 19% increase compared with PSW2-A. At peak load, the crack distribution in both specimens were essentially identical. After peak load, slight crushing of the concrete at the roots on both sides of PSW2-B was observed; however, concrete damage remained concentrated in the vertical circular hole regions, with a failure pattern similar to that of PSW2-A.
For specimen PSW3-B, the crack distribution and the load at which cracks initiated were nearly identical to those of PSW3-A. When the area of the horizontal joint defect in the boundary member region was within a certain range, the crack propagation in the wall was not significantly affected.
4. Experimental Results and Discussion
4.1. Hysteresis Behaviour
Figure 10 and Figure 11 show the horizontal load–displacement hysteresis curves and skeleton curves for each specimen at the loading point, respectively. To account for the influence of concrete variability, the vertical axis is represented by the shear-compression ratio , where is the horizontal load, is the wall section thickness and is the effective depth of the wall section. The horizontal axis is the ratio of the horizontal displacement Δ at the loading point to the height . The following observations can be made through comparison:

Figure 10.
Lateral force–displacement hysteresis curves of specimens. (a) Group 1 of specimens. (b) Group 2 of specimens. (c) Group 3 of specimens.

Figure 11.
Lateral force–displacement skeleton curves of specimens. (a) Group 1 of specimens. (b) Group 2 of specimens. (c) Group 3 of specimens.
- (1)
- Before cracking, the specimens exhibited primarily elastic deformation, with small hysteresis loop areas and negligible residual deformation. As the displacement at the loading point increased, cracks in the wall developed and extended, leading to a gradual increase in the hysteresis loop area, stiffness degradation and improved energy dissipation capacity.
- (2)
- The quality defect in the horizontal joint of the central wall region resulted in an increased yield displacement for specimen PSW1-B. During displacement-controlled loading, the increment steps were larger, leading to a rapid increase in the hysteresis loop area and a reduction in the pinching effect of the hysteresis curve.
- (3)
- The quality defect in the horizontal joint of the boundary member region significantly influenced the hysteresis and skeleton curves. As the defect area decreased, the pinching effect of the hysteresis curve gradually increased, the peak load increased and the post-peak load bearing capacity degradation weakened. When only a partial quality defect existed in the horizontal joint of the eastern boundary member region, the impact on the hysteresis performance of the specimen was minimal, and the skeleton curves remained essentially consistent.
4.2. Load Capacity
Table 3 presents a comparison of the characteristic points, including load, displacement and ductility coefficients. The yield point was determined using the energy method [21], whilst the failure point corresponds to the state where the horizontal load on the skeleton curve drops to 85% of the peak load. The displacement ductility coefficient is defined as the ratio of the failure point displacement to the yield point displacement. The comparison reveals the following:

Table 3.
Lateral loads of different characteristic points.
- (1)
- Compared with the intact specimens, the yield loads of the defective specimens in the three groups decreased by 17%, 13.4% and 1.5%, respectively, whilst the peak loads decreased by 19.4%, 20.6% and 4.1%, respectively. This finding indicates that the presence of defects reduces both the yield load and peak load of the wall. However, when defects exist entirely in the horizontal joints of the boundary member region, increasing the defect area in the horizontal joints of the central wall region has little effect on the peak load-bearing capacity. When defects are only present in the horizontal joints of the boundary member region, the defect area significantly affects the shear capacity of the wall.
- (2)
- The displacement ductility coefficients of all specimens exceeded 4, indicating excellent ductility [22]. The quality defects in the horizontal joints did not lead to brittle failure of the wall. The displacement ductility coefficients within each group were similar, suggesting that the quality defects in the horizontal joints had minimal impact on the ductility of the wall.
4.3. Stiffness Degradation
Figure 12 presents the stiffness degradation comparison curves for each group of specimens, where represents the secant stiffness, defined as the ratio of the maximum load to the corresponding displacement during loading. The following observations can be made through comparison:

Figure 12.
Secant stiffness degradation curves. (a) Group 1 of specimens. (b) Group 2 of specimens. (c) Group 3 of specimens.
- (1)
- The initial stiffness of the defective specimens was consistently lower than that of the intact specimens; the larger the defect area, the lower the initial stiffness.
- (2)
- At a inter-story drift of 1/1000, compared with the intact specimens, the equivalent stiffness of the defective specimens in Groups 1, 2 and 3 decreased by 15%, 13% and 1.2%, respectively. This finding indicates that the quality defects in the horizontal joints of the boundary member region significantly affect the wall stiffness at the serviceability stage, and the stiffness reduction becomes more pronounced as the defect area increases.
- (3)
- The stiffness degradation curves of the defective and intact specimens nearly overlap, suggesting that the quality defects in the horizontal joints had minimal impact on the rate of stiffness degradation.
4.4. Energy Dissipation
The energy dissipation capacity of the specimens was represented using the equivalent viscous damping coefficient he [23]. Figure 13 illustrates the relationship curves between the equivalent viscous damping coefficient and the inter-story drift for each specimen. The following observations can be made:
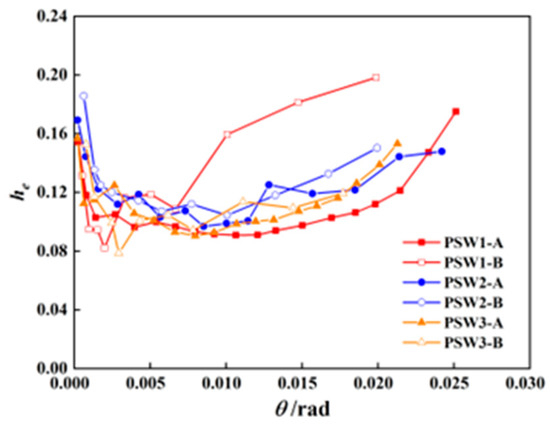
Figure 13.
Equivalent viscous damping coefficients curves.
- (1)
- The equivalent viscous damping coefficient of the defective specimen PSW1-B exhibited a sudden increase after peak load, reaching approximately 1.6 times that of the intact specimen PSW1-A at ultimate failure. This phenomenon is attributed to the quality defects in the horizontal joints, which exacerbated wall damage and caused the specimen to reach failure earlier, leading to a more pronounced increase in the equivalent viscous damping coefficient.
- (2)
- The equivalent viscous damping coefficients of the defective specimens PSW2-B and PSW3-B were similar to those of the intact specimens, indicating that the quality defects in the horizontal joints of the boundary member region alone had no significant impact on the energy dissipation capacity of the wall.
4.5. Strain Development
Figure 14 presents the load–strain curves for the outermost longitudinal reinforcement at measurement points ES1 and WS1 in the east and west boundary members of each specimen. The black dashed line in the figure indicates the yield strain of the reinforcement. The following observations can be made:

Figure 14.
Strain distribution of outermost longitudinal reinforcement measuring points at boundary members. (a) Group 1 of specimens. (b) Group 2 of specimens. (c) Group 3 of specimens.
- (1)
- At peak load, the longitudinal reinforcement in the boundary members of all specimens did not yield, achieving the design objective of strong bending and weak shear. The presence of defects did not alter the failure modes of the walls.
- (2)
- The strain at measurement point WS1 in the west boundary member of specimen PSW1-B at peak load was significantly smaller than that of specimen PSW1-A, and the strain decreased noticeably after peak load. This phenomenon is due to the fact that the quality defects in the horizontal joints caused vertical cracking above the cavity on the west side of the wall, leading to concentrated and accumulated concrete damage in this area. Consequently, the tensile force carried by the longitudinal reinforcement in the west boundary member decreased, reducing the strain.
- (3)
- After peak load, the strains at measurement points ES1 and WS1 of specimen PSW2-B and measurement point ES1 of specimen PSW3-B continued to increase, leading to reinforcement yielding. This finding is attributed to the partial loss of concrete functionality at the defect locations after peak load, resulting in increased stress in the reinforcement. Therefore, when considering the quality defects in horizontal joints, the design should appropriately increase the longitudinal reinforcement ratio.
5. Numerical Analysis
5.1. Establishment of the Numerical Analysis Model
A numerical analysis model of the precast concrete shear wall specimens was established using the finite element analysis software ABAQUS (2022). By implementing geometric subtraction to replicate cavity defect, the mechanical behaviour under combined axial and lateral loads was systematically investigated. The concrete in the model was discretized using reduced-integration elements (C3D8R), which effectively mitigate pseudo-energy modes, shear and membrane locking, as well as issues associated with hourglass control [24]; the reinforcement was modeled with truss elements (T3D2) and embedded into the concrete using the embedded region constraint. The mesh size for the loading beam and ground beam was set to 100 mm, whilst the mesh size for the wall and reinforcement skeleton was 50 mm.
The constitutive model for concrete was based on the plastic damage model recommended in the Code for Design of Concrete Structures [25], and the reinforcement was modelled using a bilinear elastic-plastic model. After multiple trial calculations, Table 4 lists the parameters used in the model.

Table 4.
Parameters of concrete plastic damage model.
Based on experimental observations, a Coulomb friction-cohesive hybrid model was adopted to simulate the interface between new and old concrete [26]. The shear strength of the interface was determined using the shear capacity formula from Eurocode 2 [27]:
where and for untreated interfaces, and and for roughened interfaces. Here, is the design tensile strength of concrete, and is the normal force acting on the interface. Table 5 lists the parameters for the interface.

Table 5.
Parameters of interface between new and old concrete.
In the model, the ground beam, loading beam and wall were connected using tied constraints. The ground beam was restrained against translation and rotation, and a reference point coupled to the top and side surfaces of the loading beam was used to apply vertical loads and horizontal displacements for model loading.
5.2. Validation of the Numerical Analysis Model
Figure 15 compares the finite element analysis results and experimental results of the horizontal load–displacement skeleton curves for each group of specimens. Both trends are observed to be generally consistent. Compared with the experimental results, the peak load errors of the simulated specimens were all less than 5%, indicating good agreement. After the peak load, certain deviations exist between the two, which can be attributed to differences between the concrete damage model used in the simulation and the actual behaviour, leading to increased discrepancies in load-bearing capacity at larger displacements.

Figure 15.
Comparison of predicted and measured lateral load–displacement curves. (a) Group 1 of specimens. (b) Group 2 of specimens. (c) Group 3 of specimens.
Figure 16 illustrates the failure modes of Group 1 of specimens and their corresponding finite element models at the failure state. The finite element models are represented by the maximum principal plastic strain contour (PE, Max. Principal). Apparently, the failure characteristics of the models align well with the experimental results. At the failure state, the plastic strain in Model PSW1-A was concentrated around the vertical circular holes on both sides; whilst in Model PSW1-B, the plastic strain was predominantly above the quality defect in the horizontal joint on the west side of the wall, affecting the distribution of the plastic strain region on that side, consistent with the experimental observations.
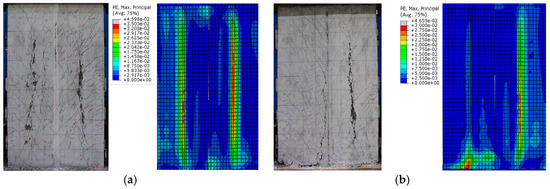
Figure 16.
Comparison of the predicted and experimental failure modes under the peak load. (a) Model PSW1-A. (b) Model PSW1-B.
The comparison results demonstrate that the finite element simulation results show no significant deviations from the experimental results, confirming that the model can be used for subsequent parametric analysis.
5.3. Parametric Study
To investigate the influence of defect area and location on the shear performance of precast concrete shear walls, numerical models were established considering four defect area ratios (25%, 50%, 75%, 100%) and two defect locations (D1: horizontal joint defects in the boundary member region; D2: horizontal joint defects in the central wall region). The models were consistent with those in Section 4.1, with horizontal joint defects symmetrically arranged on the east and west sides. The defect area ratio was defined as the ratio of the defect area to the cross-sectional area of the region. The shear–compression ratio was used as the shear capacity index for parametric analysis.
Four models with horizontal joint defects in the boundary member region were established, labelled D1-25, D1-50, D1-75 and D1-100, corresponding to defect area ratios of 25%, 50%, 75% and 100%, respectively. Similarly, four models with horizontal joint defects in the central wall region were established, labelled D2-25, D2-50, D2-75 and D2-100, with the same defect area ratios. The parameter settings for each model were identical to those of Model PSW1-A. Figure 17 illustrates the horizontal load–displacement skeleton curves for each model. Figure 18 illustrates the variation in peak load with defect area for different defect locations; the dashed line represents the peak load of the intact specimen, and the percentages indicate the deviation from the peak load of the intact specimen.
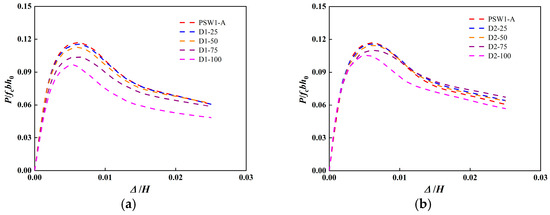
Figure 17.
Comparison of predicted lateral force–displacement curves with different defect area. (a) Quality defects in the boundary member region. (b) Quality defects in the central wall region.
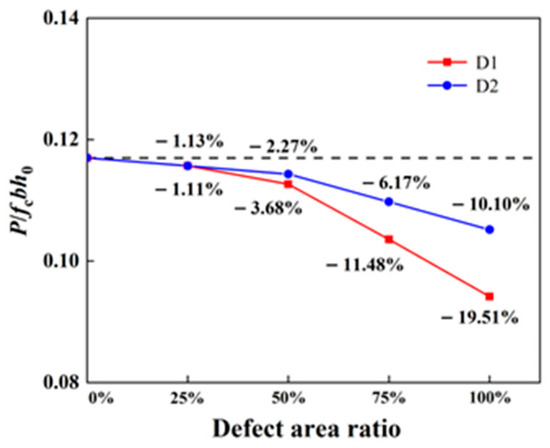
Figure 18.
Peak load–defect area ratio curves at different defect locations.
5.3.1. Influence of Defect Area
For D1 defects: In Figure 17a, the smaller the defect area in the horizontal joints of the boundary member region, the greater the initial slope of the load–displacement curve and the higher the initial stiffness in the elastic stage. When the defect area ratio was less than 25%, the skeleton curves were nearly identical to those of Model PSW1-A. However, when the defect area ratio exceeded 25%, the peak load showed a significant decreasing trend.
For D2 defects: In Figure 17b, the curves nearly overlapped during the initial loading stage, indicating that defects in the horizontal joints of the central wall region had little effect on the initial stiffness. As the defect area increased, the peak load-bearing capacity decreased. When the defect area ratio was less than 50%, the skeleton curves were nearly identical to those of Model PSW1-A.
5.3.2. Influence of Defect Location
Between the two defect locations, the one resulting in a lower peak load-bearing capacity is considered the more unfavourable location. As shown in Figure 18, the deviation of the D1 defect curve from the peak load of the intact specimen was greater than that of the D2 defect curve. Therefore, for the same defect area, horizontal joint defects in the boundary member region have a more significant impact on the shear capacity of the wall, rendering it the more unfavourable location.
6. Conclusions
Through quasi-static tests on six precast concrete shear wall specimens under constant axial load, the influence of factors, such as the area and location of quality defects in horizontal joints, on their stress performance was investigated. Based on the experimental results, a numerical analysis model was established, and a systematic analysis of the defect area and location was conducted. The main conclusions are as follows:
- (1)
- The crack development process and failure mode of specimens with quality defects in horizontal joints were generally similar to those of intact specimens, indicating that the defects had little impact on the failure mode of the wall. However, vertical cracks extending upward were observed in the western wall of specimen PSW1-B at the defect locations, suggesting that quality defects in the horizontal joints of the central wall region significantly influenced the local failure characteristics.
- (2)
- The quality defects in the horizontal joints of the boundary member region had a notable impact on the stress performance of the walls. When the defect area ratio (defect area to cross-sectional area) reached 100%, the yield load decreased by 13%, the peak load decreased by 20% and the stiffness at the serviceability stage decreased by 13%. However, the displacement ductility coefficient, stiffness degradation rate and energy dissipation efficiency were not significantly affected. Reducing the defect area ratio in this region significantly improved the load-bearing capacity and stiffness of the walls.
- (3)
- When quality defects were present throughout the horizontal joints of the boundary member region, increasing the defect area in the horizontal joints of the central wall region reduced the yield load but had little effect on the peak load, displacement ductility coefficient or stiffness at the serviceability state.
- (4)
- The ABAQUS finite element software was used to simulate the mechanical behaviour of the wall, and the results agreed well with the experimental data. For the same defect area, quality defects in the horizontal joints of the boundary member region had a greater impact on the shear capacity of the wall. When the defect area ratio in the horizontal joint cavity was less than 25% of the total cross-sectional area, the shear capacity of the walls was essentially unaffected.
7. Outlook
It should be noted that the conclusion of this study—that a defect ratio below 25% has a negligible structural impact—is derived solely from numerical simulations. Future work should include experimental tests to validate this finding. Furthermore, investigation into specimens with different cross-sections, such as T-shaped, L-shaped, and I-shaped configurations, is recommended to develop a more comprehensive understanding of how concrete casting cavities in horizontal joints affect structural behavior.
Author Contributions
Conceptualization, M.C.; methodology, Z.Z.; software, Z.Z.; validation, Z.Z. and J.L.; formal analysis, Z.Z.; investigation, Z.Z., S.W. and C.D.; resources, J.L.; data curation, Z.Z., S.W. and C.D.; writing—original draft preparation, Z.Z.; writing—review and editing, J.L.; supervision, M.C.; project administration, J.L.; funding acquisition, M.C. All authors have read and agreed to the published version of the manuscript.
Funding
This research was funded by Beijing Natural Science Foundation, grant number 8222012.
Data Availability Statement
The data presented in this study is available on request from the corresponding author. The data is not publicly available due to privacy.
Conflicts of Interest
Author Chao Dong was employed by the company Shandong Aikefu Building Technology Co., Ltd. The remaining authors declare that the research was conducted in the absence of any commercial or financial relationships that could be construed as a potential conflict of interest.
References
- China Industrial Research Institute. Analysis Report on the Current Situation and Future Development Trends of China’s Prefabricated Construction Industry from 2024 to 2029; China Industrial Research Institute: Beijing, China, 2023. [Google Scholar]
- Liu, J.; Chu, M.; Sun, Z.; Xiong, G. Experimental investigation on the mechanical behavior of a novel precast concrete shear wall system composed of serrate-edged panels and cast-in-situ concrete boundary elements. Structures 2024, 69, 107398. [Google Scholar] [CrossRef]
- Liu, J.; Wang, B.; Chu, M.; Sun, Z.; Cao, C. Experimental study and numerical analysis of the seismic behavior of precast concrete shear walls with mortise–tenon joints. Struct. Concr. 2025; early view. [Google Scholar] [CrossRef]
- Martins, R.; Carmo, R.D.; Costa, H.; Júlio, E. A review on precast structural concrete walls and connections. Adv. Struct. Eng. 2023, 26, 2600–2620. [Google Scholar] [CrossRef]
- Zhang, W.; Wallace, J.W.; Jiang, X.; Qian, J. Seismic behaviour of assembled monolithic concrete coupling beams through tests of two-story coupled shear walls. J. Build. Eng. 2023, 76, 107331. [Google Scholar] [CrossRef]
- Han, W.; Zhao, Z.; Qian, J. Global experimental response of a three-story full-scale precast concrete shear wall structure with reinforcing bars spliced by grouted couplers. PCI J. 2019, 64, 51–65. [Google Scholar] [CrossRef]
- Jiang, H.; Zhang, H.; Liu, W.Q.; Yan, H.Y. Experimental study on plug-in filling hole for steel bar anchorage of the PC Structure. J. Harbin Inst. Technol. 2011, 43, 28–31+36. [Google Scholar] [CrossRef]
- Jiang, H.; Zhang, H.; Liu, W.Q.; Yan, H.Y. Experimental study on plug-in filling hole for steel bar lapping of precast concrete structure. J. Harbin Inst. Technol. 2011, 43, 18–23. [Google Scholar] [CrossRef]
- Kurama, Y.; Pessiki, S.; Sause, R.; Lu, L.W. Seismic behavior and design of unbonded post-tensioned precast concrete walls. PCI J. 1999, 44, 72–89. [Google Scholar] [CrossRef]
- Kurama, Y.C. Hybrid post-tensioned precast concrete walls for use in seismic regions. PCI J. 2002, 47, 36–59. [Google Scholar] [CrossRef]
- Li, G.; Huang, X.; Liu, X. Experimental study on seismic behavior of monolithic precast concrete shear wall with rebar overlapped in pre-reserved area for subsequent concrete casting. J. Build. Struct. 2016, 37, 193–200. [Google Scholar] [CrossRef]
- Wu, B.; Tang, Y.; Li, Z.; Tang, K. Hierarchical modeling and damage prognosis on industrial RC building with preexisting defects. Mater. Des. Process. Commun. 2019, 2, e124. [Google Scholar] [CrossRef]
- Zhang, Z.N.; Wang, C.G.; Li, S.S.; Liu, X.; Wang, D.; Cao, X.; Zhang, Y. Seismic performance of prefabricated concrete shear wall with fluted grouting and anchor joint. J. Build. Struct. 2020, 41, 276–285. [Google Scholar] [CrossRef]
- Yang, J.; Fan, G.; Xiang, Y.; Zhang, H.; Zhu, W.; Zhang, H.; Li, Z. Low-frequency ultrasonic array imaging for detecting concrete structural defects in blind zones. Constr. Build. Mater. 2024, 425, 135948. [Google Scholar] [CrossRef]
- Xu, J.; Wang, Q.; Zhu, K.; Wu, J.; Wu, K. Experimental analysis of concrete defect detection based on synthetic aperture focusing technology. China Meas. Test 2021, 47, 47–51. [Google Scholar]
- Gao, C.H.; Zhu, W.; Xiang, Y.; Zhang, H.; Fan, G.; Zhang, H. Ultrasonic phased array imaging for defects in angle blind spots based on the solid directivity function. J. Nondestruct. Eval. 2024, 43, 26. [Google Scholar] [CrossRef]
- Feng, Q.X.; Xu, Z.T.; Xu, H.; Lin, H.; Gong, S. Study on flexural performance of T-shaped composite beams with defects. Build. Struct. 2021, 51, 88–93. [Google Scholar] [CrossRef]
- Zhang, X.J. Experimental Study on the Influence of Laminated Surface Defects on the Mechanical Behavior of Prefabricated Concrete Laminated Slabs. Master’s Thesis, China Academy of Building Research, Beijing, China, 2019. [Google Scholar]
- Xiao, S.; Wang, Z.; Li, X.; Harries, K.A.; Xu, Q.; Gao, R. Study of effects of sleeve grouting defects on the seismic performance of precast concrete shear walls. Eng. Struct. 2021, 236, 111833. [Google Scholar] [CrossRef]
- Cao, Z.; Li, Q. Effect of connection deficiency on seismic performance of precast concrete shear wall-frame structures. J. Earthq. Tsunami 2019, 13, 1940005. [Google Scholar] [CrossRef]
- Feng, P.; Qiang, H.L.; Ye, L.P. Discussion and definition on yield points of materials, members and structures. Eng. Mech. 2017, 34, 36–46. [Google Scholar] [CrossRef]
- Guo, Z.H. Reinforced Concrete Theory; Tsinghua University Press: Beijing, China, 2013. (In Chinese) [Google Scholar]
- JGJ/T 101-2015; Specification for Seismic Test of Buildings. China Architecture & Building Press: Beijing, China, 2015. (In Chinese)
- Nascimbene, R. An Arbitrary Cross Section, Locking Free Shear-flexible Curved Beam Finite Element. Int. J. Comput. Methods Eng. Sci. Mech. 2013, 14, 90–103. [Google Scholar] [CrossRef]
- GB 50011-2010; Code for Seismic Design of Buildings. China Architecture & Building Press: Beijing, China, 2015. (In Chinese)
- Zhou, J.; Ren, B.S.; Hou, J.Q. Finite element simulation of shear behaviors of shear wall with precast concrete hollow mould. Build. Struct. 2016, 46 (Suppl. S2), 443–447. [Google Scholar] [CrossRef]
- BS EN 1992-1-1; British Standards Institution. Eurocode 2: Design of Concrete Structures: Part 1: General Rules and Rules for Buildings. British Standards Institution: London, UK, 2004.
Disclaimer/Publisher’s Note: The statements, opinions and data contained in all publications are solely those of the individual author(s) and contributor(s) and not of MDPI and/or the editor(s). MDPI and/or the editor(s) disclaim responsibility for any injury to people or property resulting from any ideas, methods, instructions or products referred to in the content. |
© 2025 by the authors. Licensee MDPI, Basel, Switzerland. This article is an open access article distributed under the terms and conditions of the Creative Commons Attribution (CC BY) license (https://creativecommons.org/licenses/by/4.0/).