Abstract
The hardening soil model with small-strain stiffness (HSS model), capturing nonlinear stiffness of soils at small strains, offers advantages for deformation analysis of tunnels or deep excavations in soft clay areas such as Hangzhou City. However, its complex parameters are rarely determinable via conventional tests, and regional geological differences render parameter determination methods of other areas inapplicable to Hangzhou. To address this issue, this paper summarizes the geological genesis, spatial distribution, and physical–mechanical properties of Hangzhou soft clays, and clarifies significance and acquisition of HSS model parameters. Via statistical analysis of existing literature data, the relationships between key HSS model parameters and physical indices (e.g., void ratio) were established. A 3D finite element (FE) simulation of a Hangzhou excavation validated the proposed parameter determination method: simulated lateral retaining structure displacement and surface settlement closely matched field measurements. The simulation results employing the model parameters proposed herein are closer to the measurements than those based on the method of Shanghai, providing guidance for excavation design and geotechnical parameter selection in Hangzhou soft soil region.
1. Introduction
Hangzhou, a megacity in China, situated at the southern edge of the Yangtze River Delta and the western end of Hangzhou Bay, is a key transportation hub in southeastern China. With rapid economic growth, urban land has become increasingly scarce, spurring intensive underground-space development. Consequently, excavations and tunnels are now widely constructed across the city [1,2]. Many urban excavation projects are adjacent to existing structures and in environmentally sensitive settings, where small disturbances can trigger large deformations or even collapse of existing buildings, with substantial economic and societal consequences [3]. Accordingly, such projects must not only meet strength requirements but also strictly control their deformation. Traditional limit state bearing capacity analyses are insufficient for assessing influences of the excavations on surrounding structures, whereas finite-element (FE) modeling can effectively model soil-structure interaction, account for complex boundary conditions, and predict deformation of soils and structures. FE modeling has therefore become essential for deformation analysis and safety evaluations of excavations [4,5,6,7].
Mastering the physical and mechanical properties of geomaterials holds the key to engineering design and numerical simulations. As shown in Figure 1, Atkinson et al. [8] categorized soil behavior into three strain ranges: very small strain (smaller than 0.0001%), small strain (0.0001–0.1%), and large strain (greater than 0.1%). Extensive empirical data and analyses of excavations and tunnels [5,6,8,9,10,11,12] indicate that under typical working loads, the majority of soils exhibit small-strain behavior with highly nonlinear stiffness. Consequently, accurately describing the small-strain stiffness characteristics of soils is critical for predicting deformations induced by urban tunnel and excavations [5,6,10,11,12,13,14,15,16,17,18].
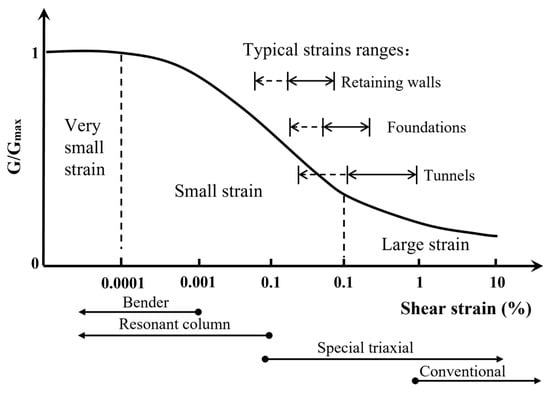
Figure 1.
Normalized stiffness degradation curve (adapted from [8,10]).
The soundness of the constitutive model and its parameters is the key determinant of the reliability of numerical simulation results. Accordingly, extensive research has been conducted on soil constitutive modeling, especially concerning the small-strain characteristics of soils, yielding substantial findings [16,17,18]. Among these studies, the hardening soil model with small-strain stiffness (HSS model), has gained increasing attention in underground engineering simulations, because it accurately captures both the nonlinear stiffness behavior of soils under small strains and their stress-path dependence [5,6,12,13,14,15,18].
The HSS model requires a relatively large number of parameters, many of which are typically obtained through advanced laboratory tests such as unloading–reloading triaxial, bender element, and resonant column tests. Because such procedures are rarely included in routine site investigations, direct parameter determination is often im-practical. To address this limitation, three principal strategies have been widely adopted in both domestic and international studies: back-analysis, advanced laboratory testing, and empirical or semi-empirical correlations. Back-analysis calibrates parameters by reproducing field monitoring results. This method has been applied in China (e.g., Mu et al. [19]; Zheng et al. [3]) and internationally in Canadian glacial tills [20], and Chicago excavations [5]. Laboratory testing provides direct measurements of stiffness and strength. Representative contributions include studies on Chinese soils by Liang et al. [21], Cao et al. [14], and Hu et al. [15], as well as investigations on Bangkok clays by Surarak et al. [22] and Wu et al. [23]’s experiment on soil from a highway in a certain region of the United States. Empirical or semi-empirical correlations estimate HSS parameters mainly through multiplier relationships among stiffness moduli. Surarak et al. [22] summarized such modulus ratios for Bangkok clays, while the PLAXIS manual [24] provides widely adopted recommendations for practical modeling. Huynh et al. [13] conducted a validation study on the simulation of deep foundation pits in Ho Chi Minh City using this method. In Shanghai, Gu et al. [12] developed a correlation-based framework linking HSS parameters to soil indices and modulus ratios, validated by engineering practice. These studies demonstrate the practicality and efficiency of ratio-based correlations, though their reliability remains strongly dependent on regional calibration and soil-specific conditions.
Although these strategies have advanced the practical application of the HSS model, their transferability across regions remains limited. The geological conditions in Hangzhou differ fundamentally from those in Shanghai, Southeast Asia, and North America, owing to variations in soil genesis, depositional environment, and microstructure. Consequently, the direct adoption of parameter determination schemes developed elsewhere is scientifically questionable. Several studies have attempted to characterize Hangzhou clays through laboratory investigations (e.g., Meng [25]; Deng [26]; Xia [27]; Chen [28]), yet a simple, robust, and region-specific framework for parameter determination has not been established to date.
To address the regional gap in constitutive modeling, this study establishes a novel and practical parameter selection framework for the HSS model, specifically adapted to the geotechnical characteristics of Hangzhou soft clay. Distinct from existing approaches that rely heavily on advanced laboratory testing or adopt empirical relations developed for other regions, the proposed method integrates localized experimental findings and correlations with basic soil index properties. Moreover, the framework’s applicability is validated through numerical simulations of deep excavations, which show good agreement with field monitoring data. This research represents the first systematic effort to formulate a regionally customized, empirically informed, and practically applicable method for HSS parameter determination in Hangzhou, offering valuable guidance for the use of HSS models in soft clay engineering.
2. Basic Characteristics of Hangzhou Clays
2.1. Geologic Origin and Distribution
Hangzhou borders Hangzhou Bay to the east and the Qiantang River to the south, and lies in the southwestern part of the Hangzhou-Jiaxing-Huzhou Plain, where the topography and geomorphology are notably complex [29]. Since the Quaternary, recurrent tectonic activity has led to continuous compression of the city’s sedimentary soils. During the Early Holocene, rising sea levels facilitated the progressive evolution of sediments into estuarine, lacustrine, and marine soft soil layers. By the Mid-Holocene, gray muddy soft soils had gradually formed, with deposit thickness reaching 12–30 m. By the Late Holocene, lacustrine environments emerged, accompanied by the deposition of black muddy and soft soils. This sedimentary evolution ultimately resulted in the development of marine-lagoon soft soil deposits characteristic of the Hangzhou region [30]. The main 12 soil layers formed are shown in Table 1 [31]. Among these, the first and second soft clay layers with greater thickness exert significant engineering impacts.

Table 1.
Geological layer of Hangzhou [31].
2.2. Basic Physical and Mechanical Properties
According to relevant studies [31,32], the basic physical and mechanical properties of Hangzhou soft clays are summarized in Table 2. The following characteristics are observed: (1) High water content, some strata reaching 50% and above; (2) Large void ratio, with the void ratio of most soft soils reaching 1.0 and above; (3) High compressibility and generally poor engineering performance. Consequently, in excavation stability analysis, the accuracy of soil parameters significantly influences deformation predictions.
Table 2.
Statistics of physical and mechanical properties of Hangzhou soft clays.
3. HSS Model Parameters and Parameter Determination
In the deformation analysis of underground structures, selecting an appropriate constitutive model is critical. Kim et al. [5] observed that elastic models inadequately capture the plastic deformation of soil. Ideal plastic models, such as the Mohr–Coulomb and Drucker–Prager models, fail to provide reasonable foundation deformation predictions due to their reliance on a single stiffness value. In contrast, strain-hardening models like the Modified Cam-Clay (MCC) model and Hardening Soil (HS) model better satisfy engineering requirements by accounting for soil hardening behavior. The HS model, introduced by Schanz et al. [33] and based on the Mohr–Coulomb failure criterion, incorporates stress path-dependent stiffness variations. Based on previous research, Benz [18] comprehensively considered the small strain characteristics of soil and proposed HSS model The HSS model not only considers soil compressibility but also accurately represents stiffness nonlinearity at small strains. Consequently, it is widely adopted in underground engineering analyses, with existing studies demonstrating its effectiveness in predicting excavation deformations in Hangzhou [34,35].
3.1. HSS Model Parameters and Their Definitions
The HSS model has 13 parameters in total (shown in Table 3) [18].
Table 3.
HSS model parameters and their definitions.
The strength parameters include the effective cohesion (c) and the effective friction angle (), which are commonly determined from triaxial tests. Notably, investigation reports typically provide cohesion and friction angle in terms of total stress, which should not be used directly. The stress dilatancy angle (Ψ) can be derived from drained consolidation tests; Ψ can be estimated as −30° for sandy soils, while for cohesive soils, it is generally assumed to be 0 [36].
The coefficient of earth pressure at rest (K0) represents the ratio of lateral stress to vertical stress in the soil under natural stress conditions, reflecting the soil’s horizontal stress state. It can be determined through a K0 consolidation test or estimated using Equation (1):
The soil moduli vary with depth and are stress-dependent; thus, a reference stress (pref) of 100 kPa is defined.
The failure ratio Rf is defined as the ratio of the deviatoric stress at failure to the shear strength, which can be determined from triaxial tests [18]. It characterizes the hyperbolic relationship between deviatoric stress and axial strain, as assumed in the HSS model. It can be calculated using Equation (2):
where εa is the axial strain; q is the deviatoric stress; qa the asymptotic value of deviatoric stress; qf is the deviatoric stress at failure; Ef is the initial modulus.
The reference tangent modulus of the soil () can be determined through standard consolidation tests. It represents the tangent compression modulus in the axial stress–strain curve when the consolidation stress equals the reference stress (). Additionally, for different consolidation stresses by Equation (3):
where is the initial horizontal stress in the field, with compressive stress as negative; is the vertical stress, which can be calculated as ; m is the power index related to the stress level.
The reference secant modulus () can be determined from drained consolidation tests and corresponds to the slope of the line connecting the origin to the deviatoric stress at half of the maximum deviatoric stress in the stress–strain curve under a consolidation stress of . for different consolidation stresses can be converted by Equation (4):
The reference unloading–reloading modulus is obtained through the unloading–reloading drained consolidation tests. The stress–strain curve has a hysteresis loop during unloading–reloading. The slope of the straight line obtained by connecting the two endpoints is . for different consolidation stresses can be converted by Equation (5):
The reference initial small strain shear modulus can be determined from field or laboratory tests. Field methods primarily involve wave velocity measurements, while common laboratory techniques include resonant column tests and bending element tests. Extensive experiment shows that depends on the average effective stress [18]. Consequently, at different stress levels should be calculated using Equation (6):
The shear strain represents the shear strain at which the shear modulus decreases to . It characterizes the modulus degradation of soil and is typically determined from resonant column tests.
The unloading–reloading Poisson’s ratio is the unloading–reloading Poisson’s ratio, which can be determined through unloading–reloading drained triaxial tests. It reflects the elastic characteristics of soil under small-strain conditions. In the absence of experimental data, the default value of 0.2 recommended in the PLAXIS manual [24] may be utilized as a reasonable approximation for this parameter.
The power index m, which reflects the stress-dependency of the modulus, indicates the sensitivity of the modulus to changes in the stress state [37]. Although different moduli correspond to distinct m values, the relevant software permits only a single input value. Existing sensitivity analyses suggest that the small-strain shear modulus is more sensitive than other parameters [14,38]. Therefore, the m value corresponding to the small-strain shear modulus is selected as the input value.
3.2. Parameter Determination
In engineering practice, obtaining all parameters of the HSS model through site investigations and laboratory tests is often challenging. A common approach is to estimate the elastic moduli (, , , and ) using data from site investigation reports. This method provides a practical solution for engineering applications [18,21,34].
The relationship between , , , and is illustrated in Figure 2 [25,26,27,34,39,40]. It can be seen that all moduli exhibit a strong linear correlation. Specifically, , where the coefficient (0.84) is slightly higher than that of Shanghai soil (0.81). Similarly, , with a coefficient (1.29) closely matching that of Shanghai soil (1.26) [12]. The relationship between and is presented in Figure 2c. As shown in the figure, the fitted line representing the relationship between the two variables does not intersect the origin, indicating that for softer soils (lower stiffness) the gap between and becomes greater. Moreover, and demonstrate a stronger correlation with each other than with , because both are derived from drained consolidation tests.
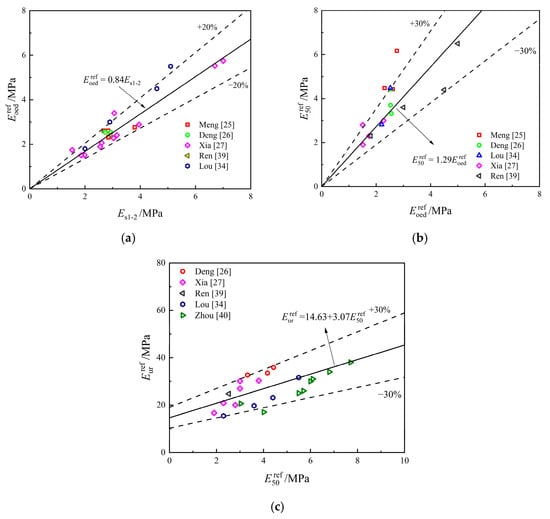
Figure 2.
Relationships between different elastic modulus: (a) and ; (b) and ; (c) and .
The relationship between the moduli , , , and the void ratio is presented in Figure 3 [25,26,27,34,39,40]. As shown in the figure, each modulus exhibits a strong logarithmic correlation with the void ratio, with most data points falling within of the predicted values. The overall fitting results differ slightly from the values obtained for Shanghai soil [12]. The relationship between and shows greater variability, which reflects the distinct unloading–reloading characteristics of different soft clays.
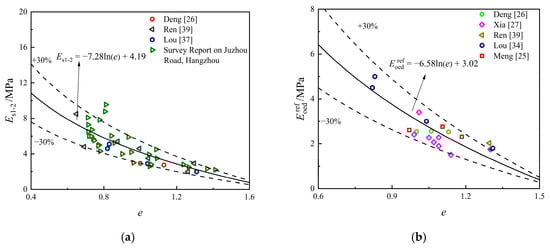
Figure 3.
Relationships between different modulus and : (a) Relationship between and ; (b) Relationship between and ; (c) Relationship between and ; (d) Relationship between and .
Figure 4 illustrates the relationship between effective friction angle () and void ratio (), revealing a strong logarithmic correlation [25,26,27,34,39]. While conventional site investigation reports typically provide shear strength in terms of total stress from consolidation tests, this parameter cannot theoretically serve as the strength parameters for the HSS model. Therefore, establishing a relationship between the void ratio and the effective friction angle is crucial for determining when the effective strength data are unavailable. Unlike the power function relationship observed in Shanghai clay [12], the logarithmic form more accurately describes the correlation in Hangzhou clay. Additionally, Figure 5 demonstrates a clear linear relationship between the effective friction angle and the effective cohesion () [25,26,27,34,39]. Thus, can first be estimated from , after which can be derived from .
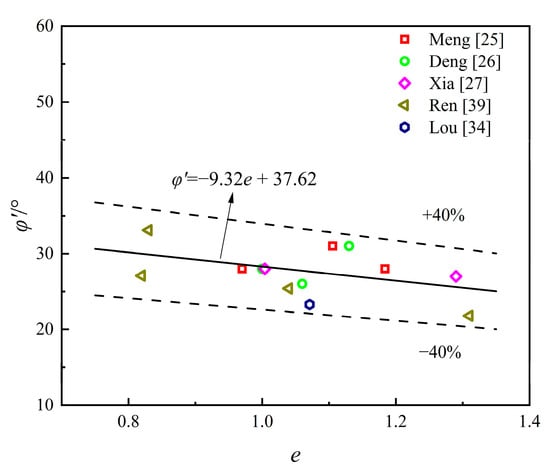
Figure 4.
Relationship between and .
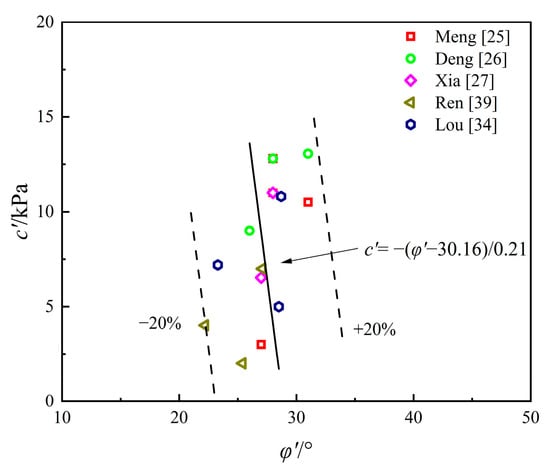
Figure 5.
Relationship between and .
Figure 6 illustrates the relationship between the failure ratio and the void ratio [25,26,27,28,34,39] In theory, when the soil is small, based on the hyperbolic stress–strain relationship, it can be inferred that the of the soil is large. Compared to Shanghai clay, the overall trend is similar. However, at the same void ratio, the failure ratio is comparatively smaller.
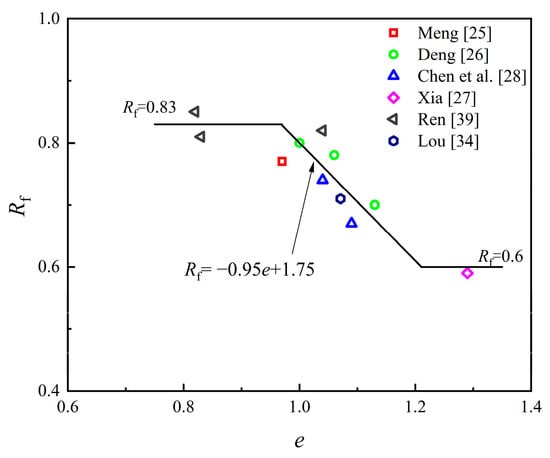
Figure 6.
Relationship between and .
Figure 7 illustrates the relationship between and the void ratio [41,42,43]. Overall, the values for Hangzhou clay range from 0.4 to 0.6 and exhibit an increasing trend with increasing void ratios. Compared with Shanghai clay, Hangzhou soft clay demonstrates a more pronounced increase in with increasing .
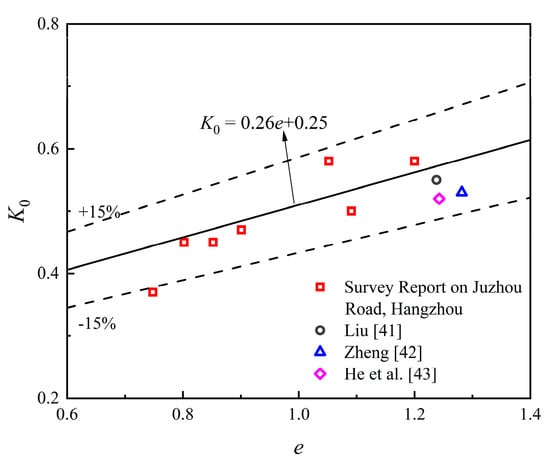
Figure 7.
Relationship between and .
In this study, empirical correlations between void ratio and HSS stiffness parameters (Figure 3, Figure 4, Figure 5, Figure 6 and Figure 7) are established via regression analysis. While the functional forms are data-driven, their trends are supported by microstructural theory. According to Zheng et al. [44], the compressibility of clays relates to fractal pore-size distributions, indicating that higher void ratios correspond to looser, less connected pore structures and lower stiffness. The observed relationships thus reflect not only statistical trends but also underlying structural mechanisms, suggesting the influence of pore-scale fractal characteristics.
Figure 8 presents the derived from in situ wave velocity tests conducted at the Hangzhou Juzhou road station excavation. Previous studies have demonstrated that values obtained from laboratory tests are typically lower than those from field wave velocity tests due to soil disturbance [45,46]. Consequently, this study focuses on statistics based on in situ shear wave velocity measurements. Hardin’s formula, widely employed for prediction, is expressed in Equation (7).
where and are the fit parameters, is the mean effective stress, and is the reference stress (taken as 100 kPa in this study), is a void ratio function. The two most common forms of are given in the following equations and this study adopts the form of the first equation [46]:
where is the fit parameters.
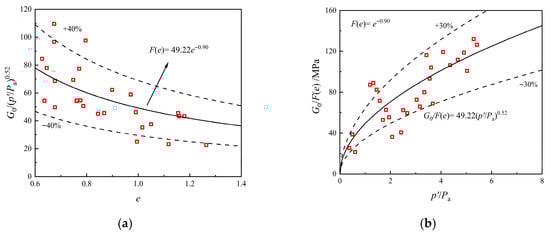
Figure 8.
determined by in situ wave velocity tests: (a) Relationship between and ; (b) Relationship between and .
As shown in Figure 8, the in situ wave velocity test results for determining exhibit some scatter, yet overall demonstrate strong regularity. This observation that is highly sensitive to the disturbance. Consequently, special attention must be paid to potential disturbances from the surrounding environment when conducting field wave velocity tests.
Since the degradation characteristics of the shear modulus cannot be directly obtained from in situ measurements, this study compiles relevant laboratory resonant column test results. The values derived from these tests are summarized in Figure 9 [47,48]. However, due to the limited number of resonant column test studies on Hangzhou clay, the available data are rather limited. The existing data indicate that for Hangzhou clay ranges from to , with a mean of . Additional resonant column tests on Hangzhou clay are recommended in future work to further improve the dataset.
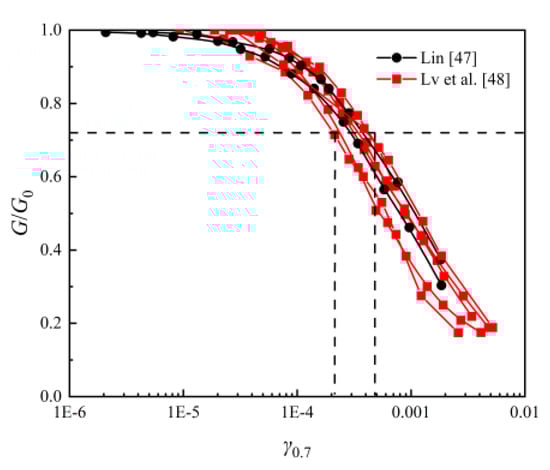
Figure 9.
determined by resonant column tests.
In this study, the parameters for the HSS model were determined using empirical regression relationships based on physical indices, such as void ratio. As highlighted by Zheng et al. [49], the pore structure of clays plays a crucial role in determining their mechanical behavior. A decrease in void ratio leads to a more compact soil structure, resulting in greater pore connectivity and consequently higher stiffness [50,51]. This trend is reflected in our parameter determination method, where a reduction in void ratio corresponds to an increase in stiffness parameters. Additionally, Zhang et al. [52] demonstrated that, as the void ratio decreases, particle interactions, including van der Waals and electrical double-layer forces, become more significant. These interactions contribute to an increase in shear modulus and small-strain stiffness.
By incorporating these microstructural insights, parameter determination method aligns with the underlying physical mechanisms that govern the mechanical behavior of Hangzhou soft clays [53]. This approach enhances the reliability and applicability of the derived HSS model parameters.
The proposed parameter determination method is distinct from previous studies primarily due to its regional focus and practical approach. Unlike methods based on general empirical correlations from other regions, this method simplifies the process by relying on physical indices (e.g., void ratio) and regional correlations, making it more applicable to routine engineering practice, without the need for advanced laboratory tests.
3.3. Summary of Model Parameters
Table 4 presents the parameter selection for the HSS model of soft clay in Hangzhou, determined from statistical analysis of extensive test data from the Hangzhou area. Most parameters can be derived from the soil’s physical properties such as the void ratio, while others are based on empirical or recommended values.
Table 4.
Comparison of HSS model parameters for clays in Hangzhou and Shanghai.
Compared with soft clays in Shanghai, the engineering properties of Hangzhou soft clays are significantly poorer. Therefore, when conducting engineering analyses in Hangzhou, region-specific empirical relationships should be applied. In subsequent research, in situ shear-wave velocity measurements and resonant column tests will be conducted to further improve the parameter determination method.
To facilitate readers’ intuitive understanding of the HSS model parameter determination method for Hangzhou soft clays and the logic of its engineering application, Table 5 presents a step-by-step procedure table. This table systematically organizes the entire process from the acquisition of basic physical indices to the final application of parameters, and clearly lists the input data, calculation basis, and corresponding output parameters for each link. Following the logic of this table, readers can efficiently grasp the core steps of the method and directly apply it to practical scenarios such as parameter selection in geotechnical numerical simulations.
Table 5.
Step-by-step procedure of parameter determination.
4. Case Study: Excavation of Juzhou Road Station, Hangzhou Metro Line 5
4.1. Project Overview
The Juzhou Road Station on Hangzhou Metro Line 5 is located at the intersection of Juzhou Road and Second Road in southeastern urban area of Hangzhou. The project location is shown in Figure 10. The underground station structure adopts a two-story, two-column three-span reinforced concrete frame configuration with critical dimensions as follows: a 12.6 m wide platform section, 21.3 m wide standard sections, and 25.4 m wide shield shaft sections. The excavation depth ranges from 16.6 m to 18.6 m below ground level, with a total station length of 190.35 m. The total constructed area measures 12,073 m2.
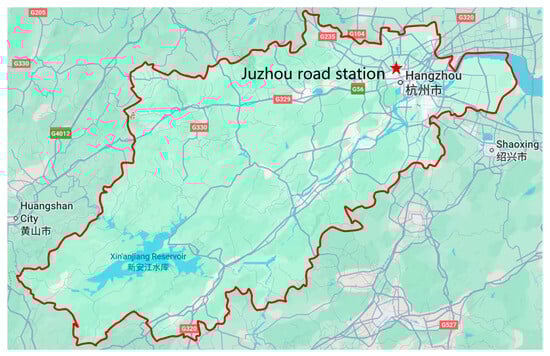
Figure 10.
Location of Juzhou Road Station in Hangzhou.
The excavation support system uses an 800 mm-thick diaphragm wall (D-wall) as the primary retaining structure, supplemented by a hybrid internal bracing system. In the standard sections, five levels of support were installed: the first level comprises 800 mm × 1000 mm cast-in-place reinforced concrete struts, whereas the remaining four levels adopt steel pipe struts (nominal diameter 609 mm, wall thickness 16 mm). The horizontal spacing ranges from 6 to 9 m for concrete struts and from 2 to 4 m for steel struts, with the longitudinal spacing between adjacent supports of approximately 3 m. The cross-section, geological conditions and excavation sequence are shown in Figure 11.
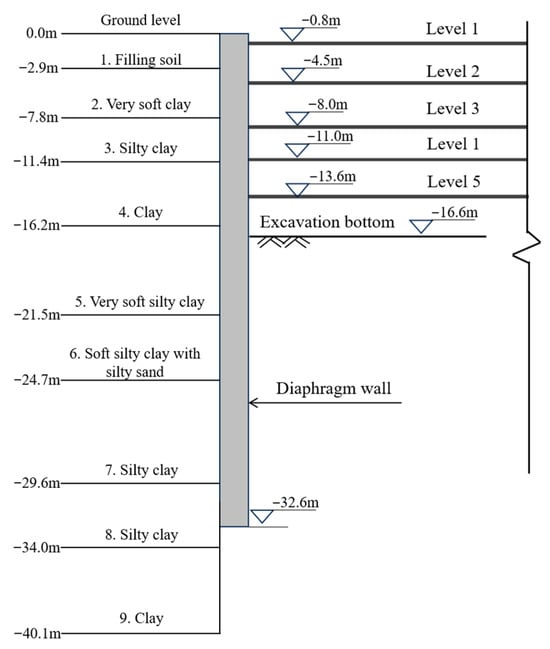
Figure 11.
Profile of the Excavation with Soil Layers and Support.
4.2. Three-Dimensional Finite Element Model Analysis
Based on the parameter determination method for the HSS model of soft clay in Hangzhou summarized herein, the HSS model parameters determined for each soil layer at Juzhou Road Station are detailed in Table 6. Noted that Table 1 presents the general geological stratigraphy of Hangzhou soft clays, while Table 5 summarizes the soil layers and parameters obtained from the site-specific geotechnical investigation of the case study project.
Table 6.
Input parameters of soil layers for the HSS model.
A three-dimensional finite element analysis of the Juzhou Road Station excavation was performed using PLAXIS 3D. To minimize the influence of boundary effects on calculation results, the model height was set to 2–4 times the excavation depth, with one side of the model positioned at 3–4 times the excavation depth from the pit edge [54]. The standard section excavation depth of the main pit is 16.62 m, while the left and right shafts have excavation depths of 18.76 m and 18.05 m, respectively. Accordingly, the model height was determined to be 45 m, with the left edge positioned 55 m from the excavation, ultimately establishing a computational model measuring 300 m × 150 m × 45 m. The finite element model is shown in Figure 12.
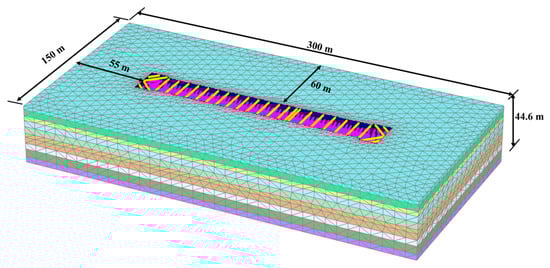
Figure 12.
Three-dimensional finite element model of excavation.
The numerical model incorporated three primary components: (1) the soil matrix, discretized using 10-node tetrahedral solid elements; (2) the retaining system (D-wall), represented by 6-node triangular plate elements; (3) the internal bracing system, modeled as 2-node point-to-point anchor elements.
The support configuration precisely replicated the construction design specifications. Material properties were assigned as follows: both the D-wall and primary concrete strut had an elastic modulus of 30 GPa, while steel pipe struts had a modulus of 206 GPa. The final mesh configuration comprised 178,756 finite elements with 246,159 nodal points, ensuring adequate resolution for the analysis.
The construction steps are listed in Table 7. Due to the presence of grouting at the pit bottom and a cut-off wall along the sides, combined with the low permeability of the clay layer, the excavation’s anti-seepage measures are highly effective. As a result, the dewatering process inside the pit has a negligible impact on the external groundwater table.
Table 7.
Three-dimensional finite element excavation construction steps.
The dewatering process was simulated using the similar—group groundwater head interpolation method. In each excavation step, the groundwater head of the soil mass within the pit was set to 0.5 m below the excavation surface, thereby simulating the actual in—pit water level condition. Conversely, the groundwater head outside the pit remained constant. As the excavation advanced incrementally, the groundwater head inside the pit decreased progressively.
4.3. Analysis of Three-Dimensional Finite Element Calculation Results
The finite element deformation results are illustrated in Figure 13. Both the field-measured deformation of the excavation’s D-wall and the finite element simulated results exhibit distinct three-dimensional spatial characteristics, with more significant deformation in the central region and relatively minor deformation at both end zones. This observation is consistent with in situ measurements reported by Tan et al. [55] for strip-type subway excavations in soft soil regions, showing that retaining-wall deformation at the pit extremities is less pronounced than at the mid-sections of the long sides. The layout of the monitoring points is shown in Figure 14.
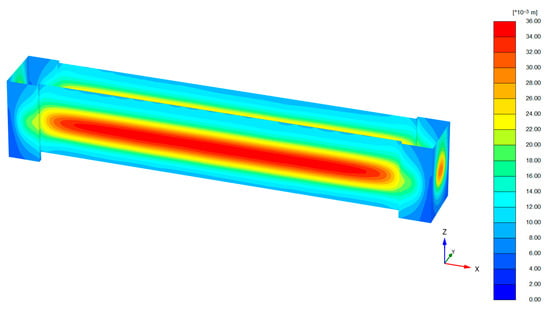
Figure 13.
Simulation results of lateral deformation of D-wall in excavation.
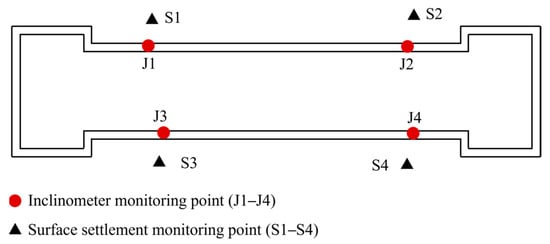
Figure 14.
The layout of monitoring points.
Figure 15 compares the measured and simulated lateral displacements of the diaphragm wall (D-wall) at multiple monitoring points. Two parameter determination methods for HSS model are evaluated: the Hangzhou-specific parameters proposed in this study and the Shanghai regional parameters reported by Gu et al. [12]. A 20% error band around the measured values is also provided. Using the Hangzhou regional parameters, the simulated lateral displacement profiles agree well with the field observations and consistently exhibit the characteristic bulging shape; the peak lateral dis-placements occur at essentially the same depth, slightly below the mid-depth of the excavation.
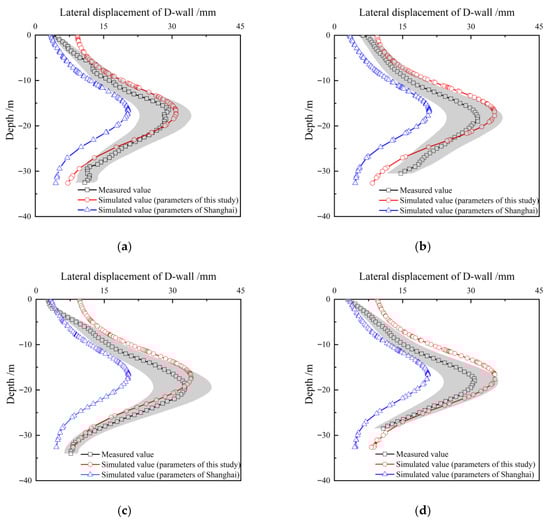
Figure 15.
Comparison of simulated obtained by different parameters and measured lateral displacement of D-wall: (a) Monitoring point 1; (b) Monitoring point 2; (c) Monitoring point 3; (d) Monitoring point 4.
In general, the simulation results based on the Hangzhou parameters summarized in this study demonstrate a closer correspondence with the measured values, confirming the regional specificity of HSS parameters. The use of a locality-adapted parameter determination method leads to predictions that are more consistent with observed excavation performance. Notably, the simulation results obtained using Hangzhou parameters slightly overestimate the measured displacements, while those using Shanghai parameters tend to underestimate them. From a design safety perspective, this conservative prediction pattern supports the use of Hangzhou parameters in local engineering practice. At a pit depth of −5 m, the simulation results using the Hangzhou parameters exhibit noticeable deviations from the field data at several monitoring points. This discrepancy is likely due to limitations in characterizing the shallow soil profile. First, the stiffness of the heterogeneous fill layers in the upper strata may have been underestimated during parameter selection, especially since these layers exhibit high variability and are difficult to characterize accurately. Second, the dewatering process inside the excavation was simplified in the model as a static reduction in hydrostatic pressure, without accounting for time-dependent consolidation effects that can stiffen shallow soils. Third, the stiffness of the diaphragm wall may have been conservatively estimated, further influencing the deformation pattern. These factors collectively suggest that while the proposed parameter framework offers reliable predictions overall, refinements are still needed for better characterization of near-surface behavior.
Figure 16 illustrates the simulated results of surface settlements outside the pit at various monitoring points. The simulation outcomes align with the deformation pattern of conventional slab-supported excavation retaining structures, exhibiting a uniformly groove shaped distribution [55,56].
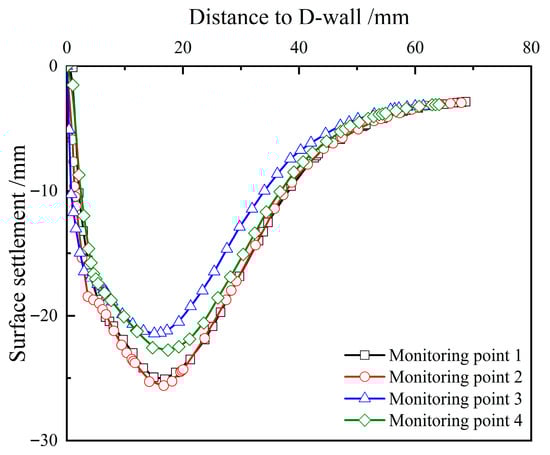
Figure 16.
Simulated surface settlement at Different Monitoring Points.
Figure 17 presents a comparison between the measured and simulated maximum surface settlements at different monitoring points. Except for Monitoring Point 1, the simulated maximum surface settlements at the remaining points are in close agreement with the measured values, with an absolute error that does not exceed 3.3 mm. The error bar is set to 20% of the measured value, and the calculated values at Observation Points 2 and 3 fall within the range of the measured value error bars, indicating that the simulated results are generally consistent with the measured values, and the fitting is satisfactory. At Monitoring Point 1, the measured settlement exceeds the simulated value, which may be attributed to the dewatering process within the excavation. This caused a decline in the groundwater level outside the pit at Monitoring Point 1, resulting in additional consolidation settlement of the soil.
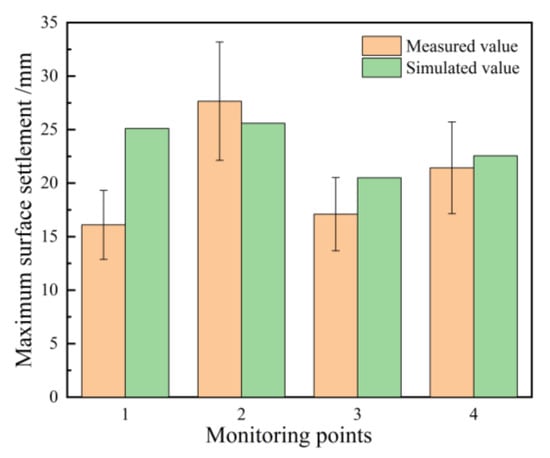
Figure 17.
Comparison of Measured and simulated Maximum surface settlement at Different Monitoring Points.
5. Discussions
Hangzhou soft clay, a typical marine-lagoonal sediment, exhibits unique engineering characteristics, including high water content (≥50%) and a high void ratio (≥1.0), resulting in high compressibility and significant nonlinear deformation. These properties necessitate a region-specific approach to HSS model parameter determination. This study presents a method that integrates physical indices, such as void ratio (e), with regional empirical data and provides a tailored solution for Hangzhou soft clay.
However, the HSS model has notable limitations. It assumes isotropy, which may be invalid for naturally anisotropic clays and can bias predictions under deep excavations or under lateral loading. Moreover, while HSS captures small-strain stiffness and strain-dependent degradation, it does not explicitly model rate effects under cyclic or earthquake loading. Even so, its ability to represent hardening/softening and distinct loading–unloading stiffness makes it effective for many practical problems. These limitations—anisotropy and rate dependence—should be addressed in future extensions and validations.
Compared with other published methods, the proposed parameter determination method offers distinct advantages. Unlike traditional methods based on empirical relationships or generalized correlations, our approach integrates region-specific empirical data and physical indices (such as void ratio) to determine key parameters like G0 and γ0.7. This method better reflects local soil behavior, especially in regions with unique characteristics, such as Hangzhou. In contrast, methods based on Shanghai or other regional soils may fail to capture local variations, as shown by our comparison, which highlighted discrepancies when Shanghai parameters were applied to Hangzhou soils.
Nevertheless, the robustness of the proposed method under varying stress states warrants further investigation. While it performed well with the excavation data from Juzhou Road Station, real-world stress conditions can be more complex. Future research should assess the method under dynamic loading and high confining pressures, and conduct sensitivity analyses to evaluate how different stress states affect parameter estimates.
In conclusion, this study provides a reliable method for determining HSS model parameters for Hangzhou soft clay. While the method effectively captures small-strain behavior and nonlinear characteristics, future work should address its limitations, including anisotropy and rate effects, and further test its robustness under complex stress conditions to ensure its broader applicability in engineering projects.
6. Conclusions
This paper commences with an analysis of the geological origin and basic physical properties of Hangzhou soft clay, and clarifies the definitions of all HSS model parameters and their acquisition methods. Subsequently, it performs statistical analysis on an extensive set of laboratory test data and in situ measurement data fron the Hangzhou area. Finally, a parameter-determination framework for the HSS model applicable to Hangzhou soft clay is established and validated using the Juzhou Road Station excavation of Hangzhou Metro Overall, this study presents the first comprehensive and validated framework for HSS parameter determination tailored to the unique properties of Hangzhou soft clay. The findings fill a regional gap in constitutive modeling and provide a practical and transferable method for improving numerical simulations in soft clay engineering.
- The soft clay in Hangzhou is classified as marine soft clay, characterized by two distinct soft clay layers, an average water content of 50%, an average void ratio of 1.0, high compressibility, and poor engineering properties. These unique characteristics must be accounted for in numerical simulations.
- A correlation-based method for HSS parameter determination was established by integrating laboratory tests and field shear wave velocity measurements, with particular attention to the influence of void ratio. Comparative analysis with Shanghai soft clay reveals significant regional differences, especially in small-strain stiffness parameters, underscoring the need for localized models.
- The parameter determination method obtained in this study was applied to the three-dimensional finite element analysis of excavation deformation at Juzhou Road Station on Hangzhou Metro. The simulated lateral displacement curve of the D-wall and the position where the maximum displacement occurs are almost consistent with the measured values, and the surface settlement outside the excavation is relatively close to the measured values, thereby verifying the reliability of the parameter determination method in this study. Comparisons with simulations using Shanghai parameters show that the proposed method yields results closer to the measurements.
Author Contributions
Conceptualization, X.Z. and X.G.; methodology, X.Z. and X.G.; formal analysis, X.Z. and X.W.; investigation, X.Z. and X.W.; resources, X.Z., K.S. and X.G. and X.W.; data curation, X.Z. and X.W.; writing—original draft preparation, X.Z. and X.W.; writing—review and editing, X.Z., K.S. and X.G.; visualization X.Z., X.G. and X.W.; supervision, X.Z., K.S. and X.G.; project administration, X.Z., K.S. and X.G.; funding acquisition, X.Z., K.S. and X.G. All authors have read and agreed to the published version of the manuscript.
Funding
This research was funded by POWERCHINA Huadong Engineering Corporation Limited (Grant No. KY2022-KC-02-10) and the China Postdoctoral Science Foundation (Grant No. 2023M740386).
Data Availability Statement
The datasets for this study are available from the corresponding author upon reasonable request.
Acknowledgments
We thank the staff of Zhejiang Huadong Geotechnical Investigation & Design Institute Corporation Limited for their technical assistance. We acknowledge constructive reviews by three anonymous reviewers which led to substantial improvement of the manuscript.
Conflicts of Interest
Authors Xing Zheng and Kanmin Shen was employed by the company POWERCHINA Huadong Engineering Corporation Limited. The remaining authors declare that the research was conducted in the absence of any commercial or financial relationships that could be construed as a potential conflict of interest.
References
- O’Rourke, T.D. Ground movements caused by braced excavations. J. Geotech. Eng. Div. 1981, 107, 1159–1178. [Google Scholar] [CrossRef]
- Fu, K.; Xue, Y.G.; Qiu, D.H.; Wang, P.; Lu, H.L. Multi-channel Fusion Prediction of TBM Tunneling Thrust Based on Multimodal Decomposition and Reconstruction. Tunn. Undergr. Space Technol. 2026, 167, 107061. [Google Scholar] [CrossRef]
- Zheng, G.; Zhu, H.; Liu, X. Control of safety of deep excavations and underground engineering and its impact on surrounding environments. China Civ. Eng. J. 2016, 49, 1–24. (In Chinese) [Google Scholar] [CrossRef]
- Fu, Y.B.; Zhang, H.S.; Yang, Y. Parameter analysis on hardening soil model of soft soil for foundation pits based on shear rates in Shenzhen Bay, China. Adv. Mater. Sci. Eng. 2020, 2, 7810918. [Google Scholar] [CrossRef]
- Kim, S.; Finno, R.J. Inverse Analysis of a Supported Excavation in Chicago. J. Geotech. Geoenviron. Eng. 2019, 145, 04019050. [Google Scholar] [CrossRef]
- Kawa, M.; Puła, W.; Truty, A. Probabilistic analysis of the diaphragm wall using the hardening soil—small (HSs) model. Eng. Struct. 2021, 232, 111869. [Google Scholar] [CrossRef]
- Pieczyńska-Kozłowska, J.M.; Puła, W.; Griffiths, D.V.; Fenton, G.A. Influence of embedment, self-weighting and anisotropy on bearing capacity reliability using the random finite element method. Comput. Geotech. 2015, 65, 121–130. [Google Scholar] [CrossRef]
- Atkinson, J.H.; Sallfors, G. Experimental determination of stress-strain-time characteristics in laboratory and in situ tests. In Proceedings of the 10th European Conference on Soil Mechanics and Foundation Engineering, Florence, Italy, 26–30 May 1991; Volume 3, pp. 915–956. [Google Scholar]
- Jardine, R.J.; Potts, D.M.; Fourie, A.B.; Burland, J.B. Studies of the influence of nonlinear stress-strain characteristics in soil-structure interaction. Géotechnique 1986, 36, 377–386. [Google Scholar] [CrossRef]
- Mair, R.J. Developments in geotechnical engineering research: Applications to tunnels and deep excavations. Proc. Inst. Civ. Eng. Civ. Eng. 1993, 97, 27–41. [Google Scholar] [CrossRef]
- Zheng, G.; Yang, X.; Zhou, H.; Du, Y.; Sun, J.; Yu, X. A simplified prediction method for evaluating tunnel displacement induced by laterally adjacent excavations. Comput. Geotech. 2018, 95, 119–128. [Google Scholar] [CrossRef]
- Gu, X.; Wu, R.; Liang, F. On HSS model parameters for shanghai soils with engineering verification. Rock Soil Mech. 2021, 42, 833–845. (In Chinese) [Google Scholar] [CrossRef]
- Huynh, Q.T.; Lai, V.Q.; Boonyatee, T.; Keawsawasvong, S. Verification of soil parameters of hardening soil model with small-strain stiffness for deep excavations in medium dense sand in Ho Chi Minh City, Vietnam. Innov. Infrastruct. Solut. 2021, 7, 15. [Google Scholar] [CrossRef]
- Cao, M.; Zhang, Z.; Du, Z.; Wang, L.; Lv, Y.; Zhang, J.; Wang, Y. Experimental study of hardening small strain model parameters for strata typical of zhengzhou and their application in foundation pit engineering. Buildings 2023, 13, 2784. [Google Scholar] [CrossRef]
- Hu, J.; Du, Q. Parameter Study and Engineering Verification of the Hardening Soil Model with Small-Strain Stiffness for Loess in the Xi’an Area. Appl. Sci. 2025, 15, 1278. [Google Scholar] [CrossRef]
- Jardine, R.J. Some observations on the kinematic nature of soil stiffiness. Soils Found. 1992, 32, 111–124. [Google Scholar] [CrossRef]
- Simpson, B. Retaining structures: Displacement and design. Géotechnique 1992, 42, 541–576. [Google Scholar] [CrossRef]
- Benz, T. Small-Strain Stiffness of Soils and Its Numerical Consequences. Ph.D. Thesis, University of Stuttgart, Stuttgart, Germany, 2007. [Google Scholar]
- Mu, L.L.; Huang, M.S. Small strain based method for predicting three—dimensional soil displacements induced by braced excavation. Tunn. Undergr. Space Technol. 2016, 52, 12–22. [Google Scholar] [CrossRef]
- Ma, E.; Cheong, M.V.T.; Terzaghi, S. Calibration of the Hardening Soil Small Strain Constitutive Model Parameters for Toronto Glacial Till. In Proceedings of the 2020 International Conference on Geotechnical Engineering, Toronto, ON, Canada, 14–16 September 2020; Available online: https://api.semanticscholar.org/CorpusID:228213741 (accessed on 19 October 2025).
- Liang, F.; Jia, Y.; Ding, Y. Experimental study on parameters of HSS model for soft soils in Shanghai. Chin. J. Geotech. Eng. 2017, 39, 269–278. (In Chinese) [Google Scholar] [CrossRef]
- Surarak, C.; Likitlersuang, S.; Wanatowski, D.; Balasubramaniam, A.; Oh, E.; Guan, H. Stiffness and Strength Parameters for Hardening Soil Model of Soft and Stiff Bangkok Clays. Soils Found. 2012, 52, 682–697. [Google Scholar] [CrossRef]
- Wu, J.T.H.; Tung, S.C.-Y. Determination of Model Parameters for the Hardening Soil Model. Transp. Infrastruct. Geotechnol. 2020, 1, 55–68. [Google Scholar] [CrossRef]
- Brinkgreve, R.B.; Kumarswamy, J.S.; Swolfs, W.M. PLAXIS 2015—Material Models Manual; PLAXIS B.V: Delft, The Netherlands, 2007. [Google Scholar]
- Meng, R. Parameter tests and engineering applications of small-strain hardening soil model of mucky silty clay in Hangzhou. J. Chengdu Univ. Technol. (Sci. Technol. Ed.) 2024, 51, 303–315. (In Chinese) [Google Scholar] [CrossRef]
- Deng, L. Parameter characteristics of the hardening constitutive model of the typical soft soil in Hangzhou. China Rural. Water Hydropower 2023, 5, 151–156. (In Chinese) [Google Scholar] [CrossRef]
- Xia, Y. Study of Mechanical Behavior of Hangzhou Clay Considering Small Strain Stiffness and Its Engineering Application; Shanghai Jiao Tong University: Shanghai, China, 2014. (In Chinese) [Google Scholar]
- Chen, L.; Gao, M.; Jia, H. The relationship between indoor geotechnical test indicators and the structure of soft clay in Hangzhou. Soil Eng. Found. 2020, 34, 326–328, 334. (In Chinese) [Google Scholar]
- Kou, B. Geological Survey Engineering Geological and Hydrogeological Conditions in Hangzhou Urban; Hangzhou Survey and Design Research Institute: Hangzhou, China, 1996. (In Chinese) [Google Scholar]
- Gu, X.Q.; Yang, J.; Huang, M.S. Combining bender element, resonant column and cyclic torsional shear tests to determine small strain shear modulus of sand. Chin. J. Geotech. Eng. 2016, 38, 740–746. (In Chinese) [Google Scholar] [CrossRef]
- Li, X.; Xu, R.; Wang, X. Assessment of engineering properties for marine and lacustrine soft soil in Hangzhou. J. Zhejiang Univ. (Eng. Sci.) 2013, 47, 1346–1352. (In Chinese) [Google Scholar] [CrossRef]
- Zhao, X.; Zhou, X.; Kang, H. Correlation analysis of physical and mechanical indicators of marine soft soil in Hangzhou area. Subgrade Eng. 2021, 5, 30–34. (In Chinese) [Google Scholar] [CrossRef]
- Schanz, T.; Vermeer, P.A.; Bonnier, P.G. The hardening soil model: Formulation and verification. In Beyond 2000 in Computational Geotechnics; Routledge: London, UK, 1999. [Google Scholar] [CrossRef]
- Lou, K. Risk Analysis and Control of Underground Continuous Wall Support Structure System in Cohesive Soil; Zhejiang University of Science and Technology: Hangzhou, China, 2021. (In Chinese) [Google Scholar]
- Jin, X.; Sun, S.; Qian, H. Analysis of deformation control during tunnel excavation in muddy soil in Hangzhou area. Highway 2018, 63, 269–275. (In Chinese) [Google Scholar]
- Bolton, M.D. The strength and dilatancy of sands. Géotechnique 1986, 36, 65–78. [Google Scholar] [CrossRef]
- Iwasaki, T.; Tatsuoka, F.; Takagi, Y. Shear modulus of sands under cyclic torsional shear loading. Soils Found. 1978, 18, 39–56. [Google Scholar] [CrossRef]
- Pu, X.; Huang, J.; Peng, T.; Wang, W.; Li, B.; Zhao, H. Application of Parameter Inversion of HSS Model Based on BP Neural Network Optimized by Genetic Algorithm in Foundation Pit Engineering. Buildings 2025, 15, 531. [Google Scholar] [CrossRef]
- Ren, X.Y. A study on the reasonableness of the small strain parameter G0 in Hangzhou area. Build. Technol. 2023, 7, 123–128. (In Chinese) [Google Scholar]
- Zhou, J. Numerical Simulation of Excavation and Support of Deep and Large Foundation Pit Based on HS Model. Master’s Thesis, Zhejiang University of Technology, Hangzhou, China, 2020. (In Chinese). [Google Scholar]
- Liu, Z. Study on Yielding Characteristics and Anisotropic Yield Surface Equation of Soft Clay. Ph.D. Thesis, Zhejiang University, Hangzhou, China, 2014. (In Chinese). [Google Scholar]
- Zheng, Q. Research on Dynamic Characteristics of Hangzhou Soft Clay Under Intermittent Cyclic Loading on Macro and Micro Scales. Ph.D. Thesis, Zhejiang University, Hangzhou, China, 2019. (In Chinese). [Google Scholar]
- He, S.; Zheng, Q.; Xia, T. Experimental study on long-term dynamic characteristics of marine soft soils under metro train loads considering time intermittent effect. Chin. J. Rock Mech. Eng. 2019, 38, 353–364. (In Chinese) [Google Scholar] [CrossRef]
- Zheng, Y.; Zhu, T.; Chen, J.; Shan, K.; Li, J. Relationship Between Pore-Size Distribution and 1D Compressibility of Different Reconstituted Clays Based on Fractal Theory. Fractal Fract. 2025, 9, 235. [Google Scholar] [CrossRef]
- Elbeggo, D.; Ethier, Y.; Dubé, J.-S.; Karray, M. Critical insights in laboratory shear wave velocity correlations of clays. Can. Geotech. J. 2022, 59, 935–951. [Google Scholar] [CrossRef]
- Lo Presti, D.C.F.; Jamiolkowski, M. Discussion: Estimate of elastic shear modulus in Holocene soil deposits. Soils Found. 1998, 38, 263–265. [Google Scholar] [CrossRef]
- Lin, D.Z. Experimental Study on Parameters of Small Strain Soil Hardening Model and Its Engineering Application, a Case Study of a Foundation Pit Project in Hangzhou. Master’s Thesis, Zhejiang University, Hangzhou, China, 2020. (In Chinese). [Google Scholar]
- Lv, X.F.; Chen, P.X.; Yang, Y.J.; Chen, X.L.; Li, D. The Resonant Column Test Study on Marine Silty Clay. World Earthq. Eng. 2010, 26, 1–5. (In Chinese) [Google Scholar]
- Zheng, Y.H.; Baudet, B.A. Pore Structure Response of Reconstituted Kaolin and Illite-Smectite Mixed-Layer Rich Clay to 1D Compression. Appl. Clay Sci. 2025, 276, 107892. [Google Scholar] [CrossRef]
- Tong, L.H.; Fu, L.; Wu, B.N.; Xu, C.J.; Lim, C.W.; Ding, H.B. Particle Shape Effect on Creep and Fluidity of Granular Packing. J. Eng. Mech. 2025, 151, 04025067. [Google Scholar] [CrossRef]
- Tong, L.H.; Fu, L.; Wu, B.N.; Xu, C.J.; Lim, C.W. Packing Fraction Effect on Dynamic Creep Deformation of Granular Materials. Acta Geotech. 2025, 20, 2135–2144. [Google Scholar] [CrossRef]
- Zhang, S.Q.; Tan, D.Y.; Zhu, H.H.; Pei, H.F.; Shi, B. Rheological Behaviors of Na-Montmorillonite Considering Particle Interactions: A Molecular Dynamics Study. J. Rock Mech. Geotech. Eng. 2025, 17, 4657–4671. [Google Scholar] [CrossRef]
- Luo, B.; Su, Y.H.; Ding, X.H.; Chen, Y.H.; Liu, C.J. Modulation of initial CaO/Al2O3 and SiO2/Al2O3 ratios on the properties of slag/fly ash-based geopolymer stabilized clay: Synergistic effects and stabilization mechanism. Mater. Today Commun. 2025, 47, 113295. [Google Scholar] [CrossRef]
- Zhu, C.; Huang, X.; Wang, F.; Huang, M.; He, C.; Guo, J. Optimization Study on Key Parameters for Mechanical Excavation of Deep-Buried Large-Section Metro Station. Appl. Sci. 2025, 15, 10218. [Google Scholar] [CrossRef]
- Tan, Y.; Wei, B.; Diao, Y.; Zhou, X. Spatial corner effects of long and narrow multipropped deep excavations in shanghai soft clay. J. Perform. Constr. Facil. 2014, 28, 04014015. [Google Scholar] [CrossRef]
- Alzabeebee, S. Numerical analysis of the interference of two active machine foundations. Geotech. Geol. Eng. 2020, 38, 5043–5059. [Google Scholar] [CrossRef]


Disclaimer/Publisher’s Note: The statements, opinions and data contained in all publications are solely those of the individual author(s) and contributor(s) and not of MDPI and/or the editor(s). MDPI and/or the editor(s) disclaim responsibility for any injury to people or property resulting from any ideas, methods, instructions or products referred to in the content. |
© 2025 by the authors. Licensee MDPI, Basel, Switzerland. This article is an open access article distributed under the terms and conditions of the Creative Commons Attribution (CC BY) license (https://creativecommons.org/licenses/by/4.0/).