Article

Estimation of the Bond Strength of Fiber-Reinforced Polymer Bars in Concrete Using Artificial Intelligence Systems

1
Department of Civil Engineering, Faculty of Engineering, Fahad Bin Sultan University, P.O. Box 15700, Tabuk 71454, Saudi Arabia
2
Civil Engineering Department, Faculty of Engineering, Jordan University of Science and Technology, P.O. Box 3030, Irbid 22110, Jordan
3
Civil and Environmental Engineering Department, Kennesaw State University, Marietta, GA 30060, USA
*
Author to whom correspondence should be addressed.
Buildings 2024, 14(2), 369; https://doi.org/10.3390/buildings14020369
Submission received: 25 November 2023 / Revised: 15 January 2024 / Accepted: 17 January 2024 / Published: 29 January 2024
(This article belongs to the Section Building Materials, and Repair & Renovation)

Abstract

:
Fiber-reinforced polymer (FRP) bars have recently been introduced to the market as an alternative to steel for internal reinforcement for concrete construction exposed to situations that could cause corrosion. The bond behavior of FRP bars varies from that of steel bars, mostly due to variations in material properties and surface textures. Because of the unexpected nature of the crucial FRP–concrete interfacial (FCI) bond strength, the bond strength between FRP bars and concrete cannot be exactly determined. Numerous experimental investigations have been conducted with related empirical models established in an attempt to resolve this problem. These models were found to have a restricted capacity for generalization due to the small sample sizes of the experiments. Therefore, a more powerful numerical technique capable of processing large data sets with all possible parameters that may affect the relationship and considering the nonlinearity of data tendency is needed. In this study, the artificial neural networks technique and adaptive neuro-fuzzy inference system were utilized to predict the FRP–concrete bond behavior based on 238 data points collected from different studies in the literature. The performance of the ANN and ANFIS models in predicting the bonding strength was compared to other models published in the literature and codes. The results showed that the ANN and ANFIS models gave higher prediction performance than other models, with a slight advantage for the ANN model. For instance, the R-squared values of the proposed ANN and ANFIS were 0.94 and 0.92, respectively, for 20 data points that were not used to develop the ANN and ANFIS models. Based on the sensitivity analysis, the FRP diameter and compressive strength of concrete were found to be the most effective parameters on the bond strength in both the ANN and ANFIS models. In contrast, the bar position and surface texture had a lower importance index.

1. Introduction

A fiber-reinforced polymer (FRP) is a composite material that consists of a resin matrix reinforced with fibers. The fibers provide strength and load-bearing capacity, while the matrix protects and joins the fibers together and transfers stress from fiber to fiber through shear stresses. Three main types of fibers are used in construction: carbon, glass, and aramid. The polymer is usually epoxy, vinyl ester, or polyester thermosetting plastic [1]. In recent decades, FRP composites have been commonly used in structural applications to strengthen existing structures and rehabilitate concrete structures due to their high tensile strength, light weight, nonmagnetic electrical properties, resistance to corrosion, and ease of application [2,3].
FRP can be attached to structures as a sheet or plate externally bonded from the outside or as a thin, narrow strip glued into a groove on the member. Although it has been demonstrated that externally bonded FRP is useful for reinforcing and mending concrete elements, debonding failure is a significant issue for externally bonded FRP repairing materials [4]. Despite the advantages of FRP over steel reinforcement, a direct replacement of FRP for the steel rebar is not possible or practical because of the differences in mechanical and physical properties [1,5]. Reinforcing concrete structures with FRP bars has some limitations, such as FRP being more expensive than steel and FRP behaving in a linear elastic manner up to failure, which means it does not have a yield point [6]. The non-ductile nature of FRP is particularly a concern in seismic strengthening applications. Moreover, the debonding of FRP due to its non-isotropic characteristics and high-stress concentrations at the concrete–FRP bond interface presents additional challenges [7].
The relatively lower debonding strength of FRP rebars to concrete is an obstacle researchers have faced for its implementation as an alternative material to steel [8,9,10,11]. Consequently, significant experimental studies were performed to determine the bond strength between FRP rebars and concrete. The experiments involve testing beam and pullout specimens using various types and sizes [12,13,14]. The results from the studies referenced reveal numerous factors that influence bond behavior, including concrete compressive strength, bond length, fiber type, fiber diameter, concrete cover, transverse reinforcement, bar position, and surface forms of FRP rebar. These factors have been employed in developing fracture mechanics and empirical models to evaluate the bond strength of FRP and concrete [15,16]. There are numerous studies in the literature that attempt to estimate the FRP bars-to-concrete bond strength, but their accuracy is low and their basis is restricted to small experimental data sets. A summary of available empirical formulas in the literature and various codes for FRP to concrete bond strength (ꞇm) are presented in Table 1. Most of these theoretical models are based on small data sets and only account for certain parameters while neglecting others, limiting their applications. The bond’s behavior is complicated and needs a more powerful numerical technique capable of processing large data sets, with all possible parameters that may affect the relationship and considering the nonlinearity of data tendency.
As computer technology develops, new strategies have been proposed for solving engineering problems more efficiently and accurately. Two of them are artificial neural networks (ANN) and adaptive neuro-fuzzy inference systems (ANFIS). ANN is based on schematic procedures performed inside a computer system that mimics the human nervous system [17]. The Takagi–Sugeno fuzzy inference approach is the basis for the artificial neural network known as the ANFIS, which combines fuzzy logic with neural networks [18]. Soft computing approaches (ANN and ANFIS) can perform prediction models without wasting time and materials on laboratory tests and without conducting sophisticated analyses. Furthermore, the model can be easily improved, retrained, and updated with new data from recent studies to produce more accurate predictions.
Civil engineering is a complex discipline with several issues, much like other engineering applications. It is rather challenging to analyze complex problems using conventional methods. Thus, more and more applications connected to civil engineering are being modeled using artificial intelligence methodologies. Over the last two decades, neural networks have been used to solve many problems related to the analysis and design of structural engineering systems. Adeli and Park used them [19] to predict the failure and maximum moments of simply supported rectangular plates subjected to concentrated loads. Mukherjee and Deshpande [20] used ANNs to provide an optimal design of rectangular reinforced concrete beams considering cost and size parameters, whereas Jia and Davalos [21] used them to study the fatigue behavior of bonded FRP–wood interfaces and to predict the crack growth rate. ANNs have been used to predict the mechanical properties of building materials, such as concrete’s compressive strength [22,23]. Barham et al. [24] used ANN and multivariate regression to predict rock’s unconfined compressive strength (UCS).
Haj-Ali and Kim [25] proposed a non-linear ANN constitutive model for fiber-reinforced polymeric (FRP) composites. Golafshani et al. [26] used a neural network with genetic programming to predict the bond strength of GFRP bars in concrete. Mansouri and Kisi [27] have predicted the debonding strength for masonry elements retrofitted with FRP composites using neuro-fuzzy and neural networks. Their results indicated that the ANN and neuro-fuzzy models performed better than the other models. Refs. [28,29,30] used databases from several previous experiments to create a novel artificial neural network (ANN) bond strength prediction model for FRP-reinforced concrete. Ref. [31] presented and analyzed a new empirical model for predicting the ultimate bond retention load between an FRP plate/strip and a rigid concrete substrate. It is based on an artificial neural network (ANN) approach applied to a large database with 368 accessible experimental findings. The proposed formulation was found to be beneficial in terms of precision and accuracy. Ref. [32] utilized the back propagation neural network (BPNN) technique to predict the bond strength of the FRP-concrete interface considering the impacts of concrete compressive strength, width, FRP elastic modulus, FRP thickness, FRP width, and FRP bond length. Based on the trained ANN model, an explicit user-friendly formula was created.
One of the significant drawbacks of ANNs is the absence of an explanation for the weight values that the model generates. Ref. [18] invented the ANFIS technique, which is a hybrid of ANN and fuzzy logic (FL). The ANFIS uses the ANN’s learning algorithm and fuzzy logic’s decision-making capacity. ANFIS is applicable to all sciences. By using ANFIS’s fuzzy inference approach, ANN drawbacks can be avoided. The predictability of ANFIS is dependent on the number of rules, the kind of membership function, and the learning mechanism used.
Recently, ANFIS has been used to model non-linear and complicated behaviors for many features of building materials in civil engineering. Using the ant colony optimization (ACO) algorithm and fuzzy c-means (FCM) clustering method, a hybrid model was developed by [33] and integrated into the adaptive neuro-fuzzy inference system (ANFIS) to predict the bond strength between fiber-reinforced polymer (FRP) sheets and the concrete surface under direct tension. Ref. [34] used ANFIS to investigate the relationship between concrete strength and mixing percentage. Ref. [35] used 935 data sets to create curve-fitting (CF) and adaptive neuro-fuzzy inference system (ANFIS) models to forecast the FRP-CBS. When the ANFIS model was compared to various analytical models and standard guidelines like ACI, TR-55 fib, CNR, and JCI, it fared better than the CF model. Ref. [36] studied the applicability of using the ANFIS technique to predict the shear strength of RC beams with steel stirrups. Nguyen et al. [37] presented ANFIS and particle swarm optimization (PSO) algorithms to evaluate the FRP–concrete bond strength.
Table 1. Summary of the existing models for bond strength between FRP and concrete.
Model ReferenceExpression
ACI440.1R-06 [1] τ f c = 0.33 + 0.025 c d b + 8.3 d b l d
CSA S806-06 [8] τ f c = d c s 1.15 K 1 K 2 K 3 K 4 K 5 π d b
Okelo and Yuan [38] τ = 14.7   f c d b
Lee et al. [39] τ = 3.3 f c 0.3
Here, f′c = the compressive strength of concrete (MPa); c = the concrete cover (mm); db = the diameter of FRP bars (mm); ld = the embedment length of FRP bar in concrete (mm); dcs = the smaller of two-thirds of the c-c spacing between the bars being formed or the distance between the center of the developing bar and the closest concrete surface (mm); K1 = bar location factor; K2 = concrete density factor; K3 = bar size factor; K4 = bar fiber factor; and K5 = bar surface profile factor.
The parameters presented in Table 1 are described in Figure 1, below.
The literature review reveals that several studies created empirical models for predicting the bond strength between FRP and concrete, but they relied on a small sample size of data points or evaluated a small set of critical factors [38,39]. Hence, there have been discrepancies in bond strength predictions and trend behaviors regarding the effect of certain essential parameters. This work mainly focuses on utilizing ANN and ANFIS to predict the bond strength of FRP bars using all possible factors that may affect FRP bond strength. ANFIS and ANNs are used to build and test a model using 238 data points collected from the technical literature. These points represent different ranges of experimental data and are arranged in a six-input and one-target format. The developed models were validated using twenty points from the data set that were not used in the model’s construction. Furthermore, a parametric or sensitivity analysis was conducted on different key parameters to detect their influence on the FRP–concrete bond strength.

2. Materials and Methods

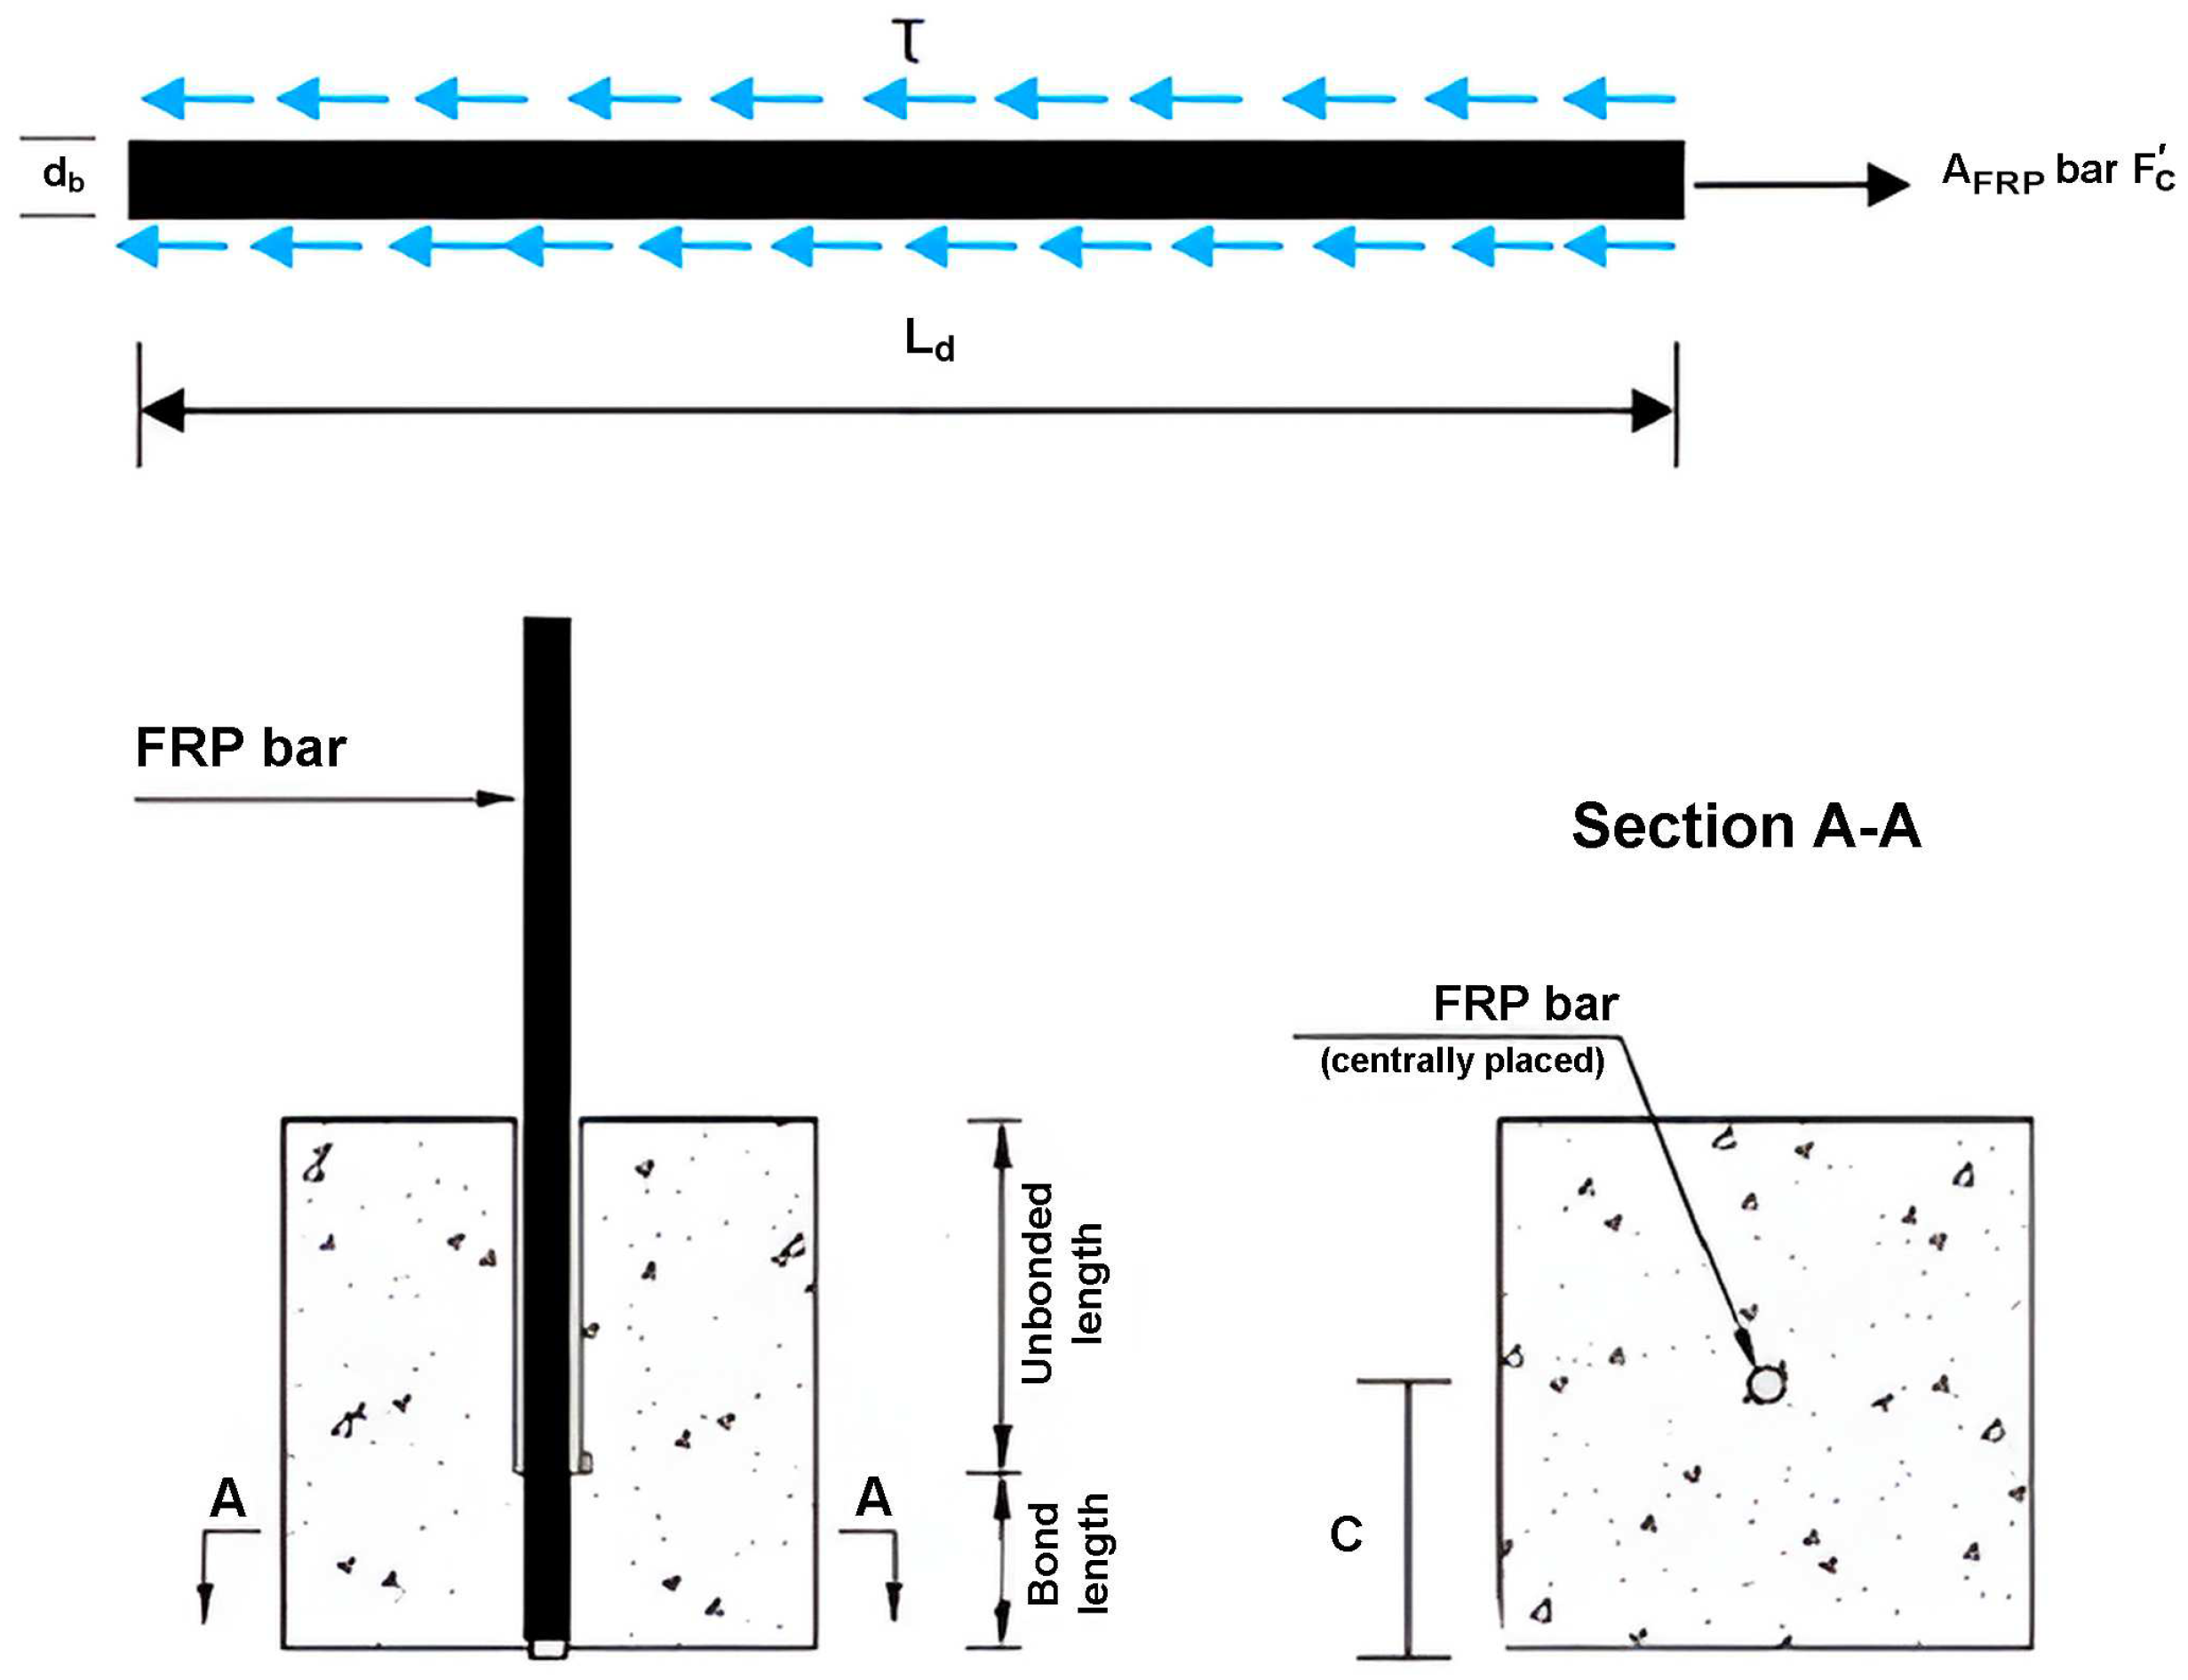
2.1. Data Description

The data set used in this study consists of 238 input–output sets gathered from various experimental research studies. The data mainly include the most critical parameters expected to affect the FRP–concrete bond strength. Table 2 shows the input ranges by numbers and their statistical parameters related to the collected data (where (a) Bar Position (1 = top, 2 = bottom); (b) Bar Surface Type (1 = helical lugged, 2 = spiral wrapped, 3 = sand coated bar)).
There are six inputs to be considered, with one targeted output; ultimate bond strength, as seen in Table 3. The data were divided into training data (218 points) and testing data (20 points), randomly selected using Statistical Package for Social Sciences (SPSS) software R2021a. The training process generally starts by dividing the training cases into two matrices: inputs and targeted outputs. After separating the data, a normalization process must be carried out to reduce the variance of the inputs and confine them to a small range that the network can handle. A flow chart of the training process is shown in Figure 2.
Normalization is essential for proper network performance because it compresses all the inputs from different types and ranges into a single range between 0 and 1, making the network more stable in predicting and handling the outputs of different input values. In this study, normalization is accomplished through the formula in the equation below:
z i = x i Min x Max x Min x
where zi is the normalized value of the input xi.
Min (x) and Max (x) are the minimum and maximum values for variables, respectively.

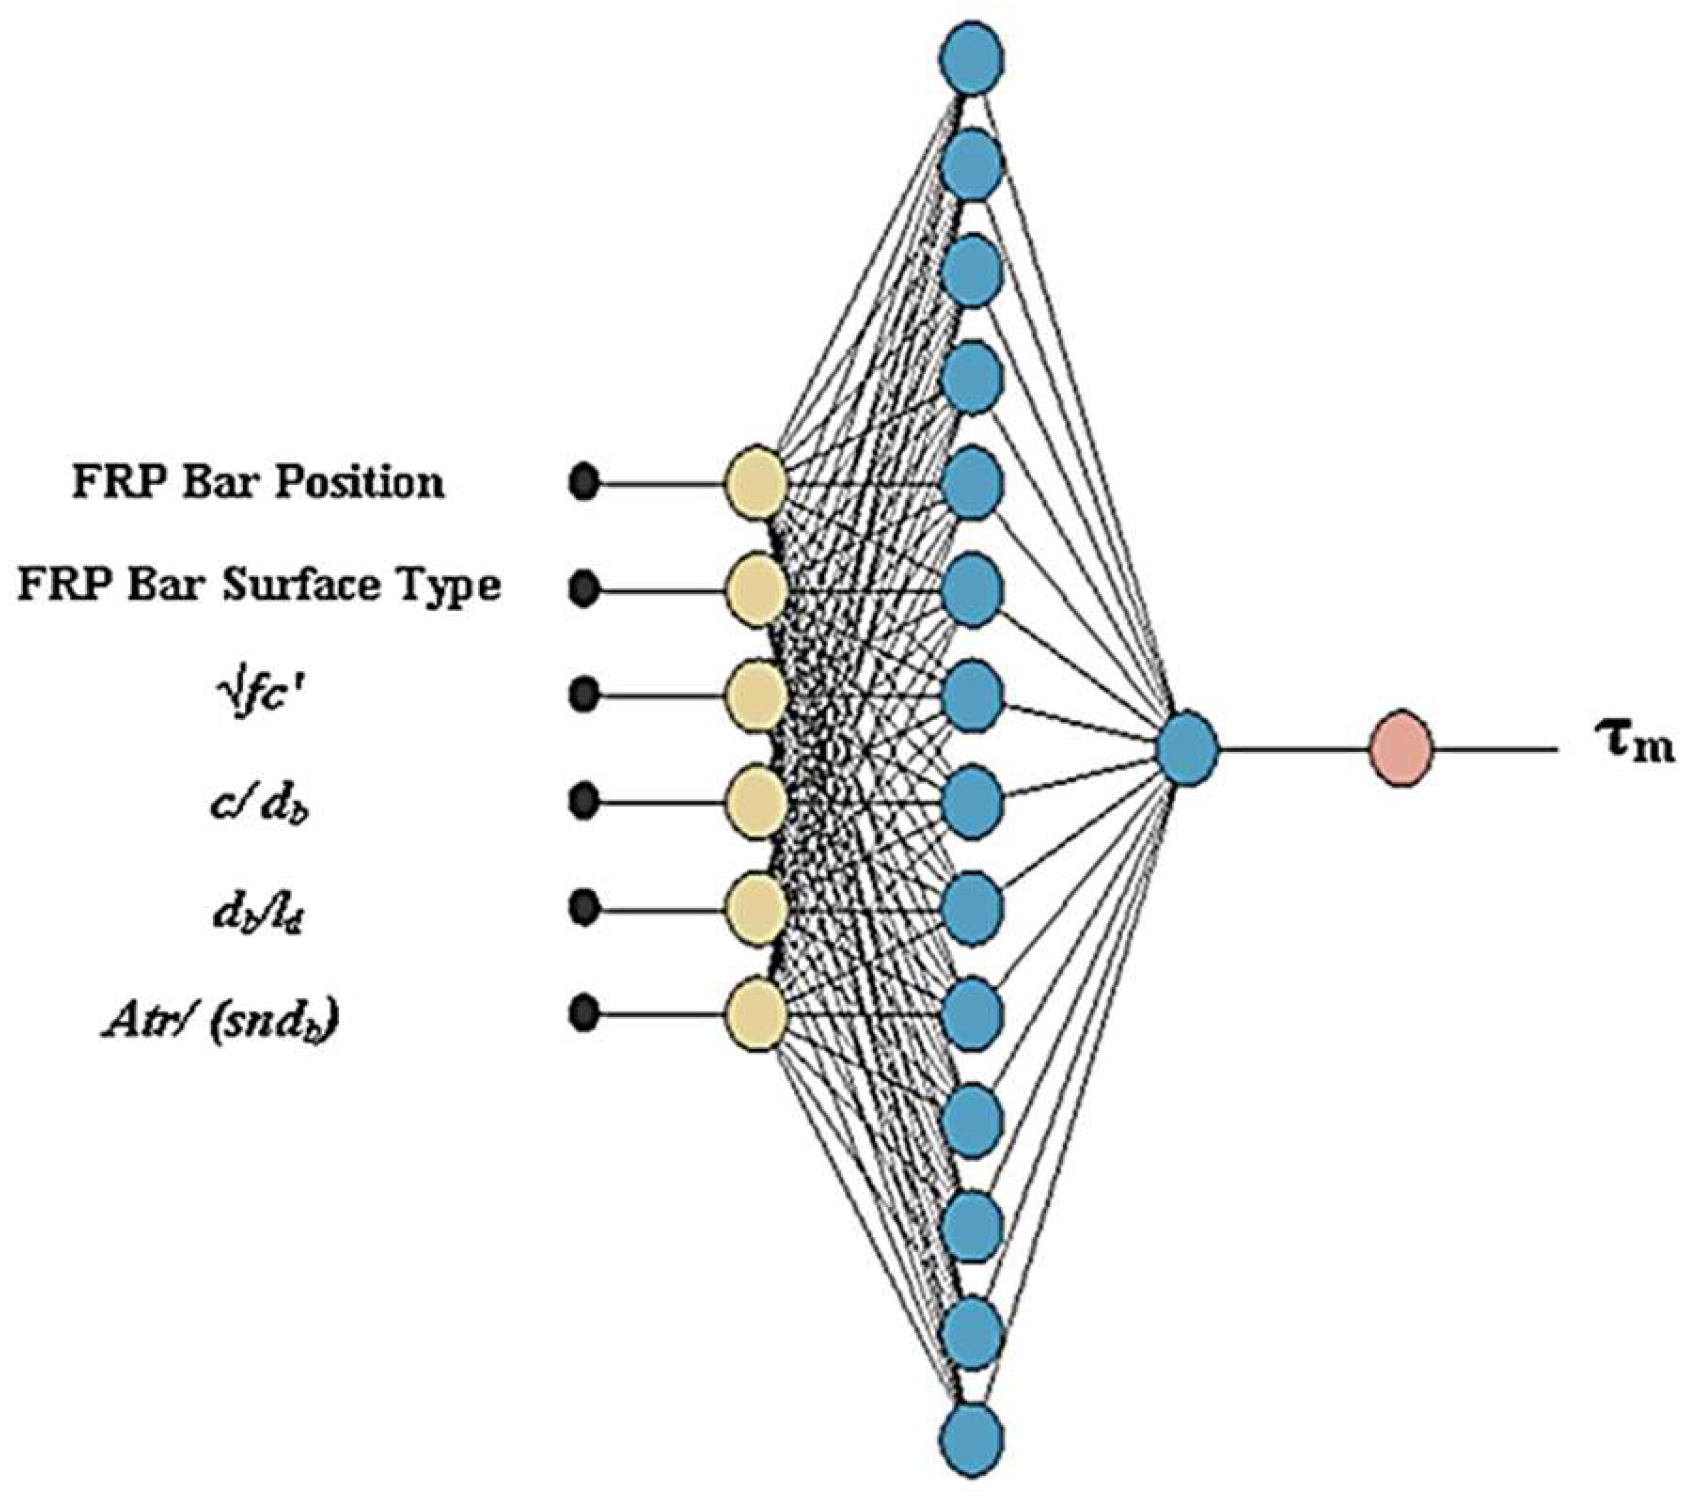
2.2. Construction of Artificial Neural Networks

The input layer, the intermediate or hidden layer(s), and the output layer are the three main components of the ANN design that may be separated based on their biological foundation. The heart of the ANN is the “hidden layer”, whereas the “input layer” is a vector of inputs. It is made up of many neurons. Each neuron performs mathematical operations on the input to produce the output. Links connect these neurons so that they may receive and deliver values. Each connection has a weight, determining how received values differ from sending ones. The weight means the value that is multiplied by the carried value before the result is passed to the next neuron. The weight value is changeable according to the intended task; it is decided by learning and memorizing the task. The neuron weights are design variables that may be changed in an ANN, which is an unrestricted optimization problem. Another element that might improve the neural network’s performance is a bias term built into each neuron in the hidden and output layers [40]. The backpropagation algorithm is one of the most used in building ANN models. It is a supervised learning algorithm for training multi-layer perceptron, and it looks for the minimum error function in weight space using the gradient descent method [17].
Therefore, constructing suitable architecture is the key to succeeding in ANN modeling. There are three primary steps in building a network, as outlined in the research:
  • Defining the problem’s input and output sets.
  • Training the network using the training sets to simulate the targeted task.
  • Checking the network’s performance before deciding whether to use it by testing data.

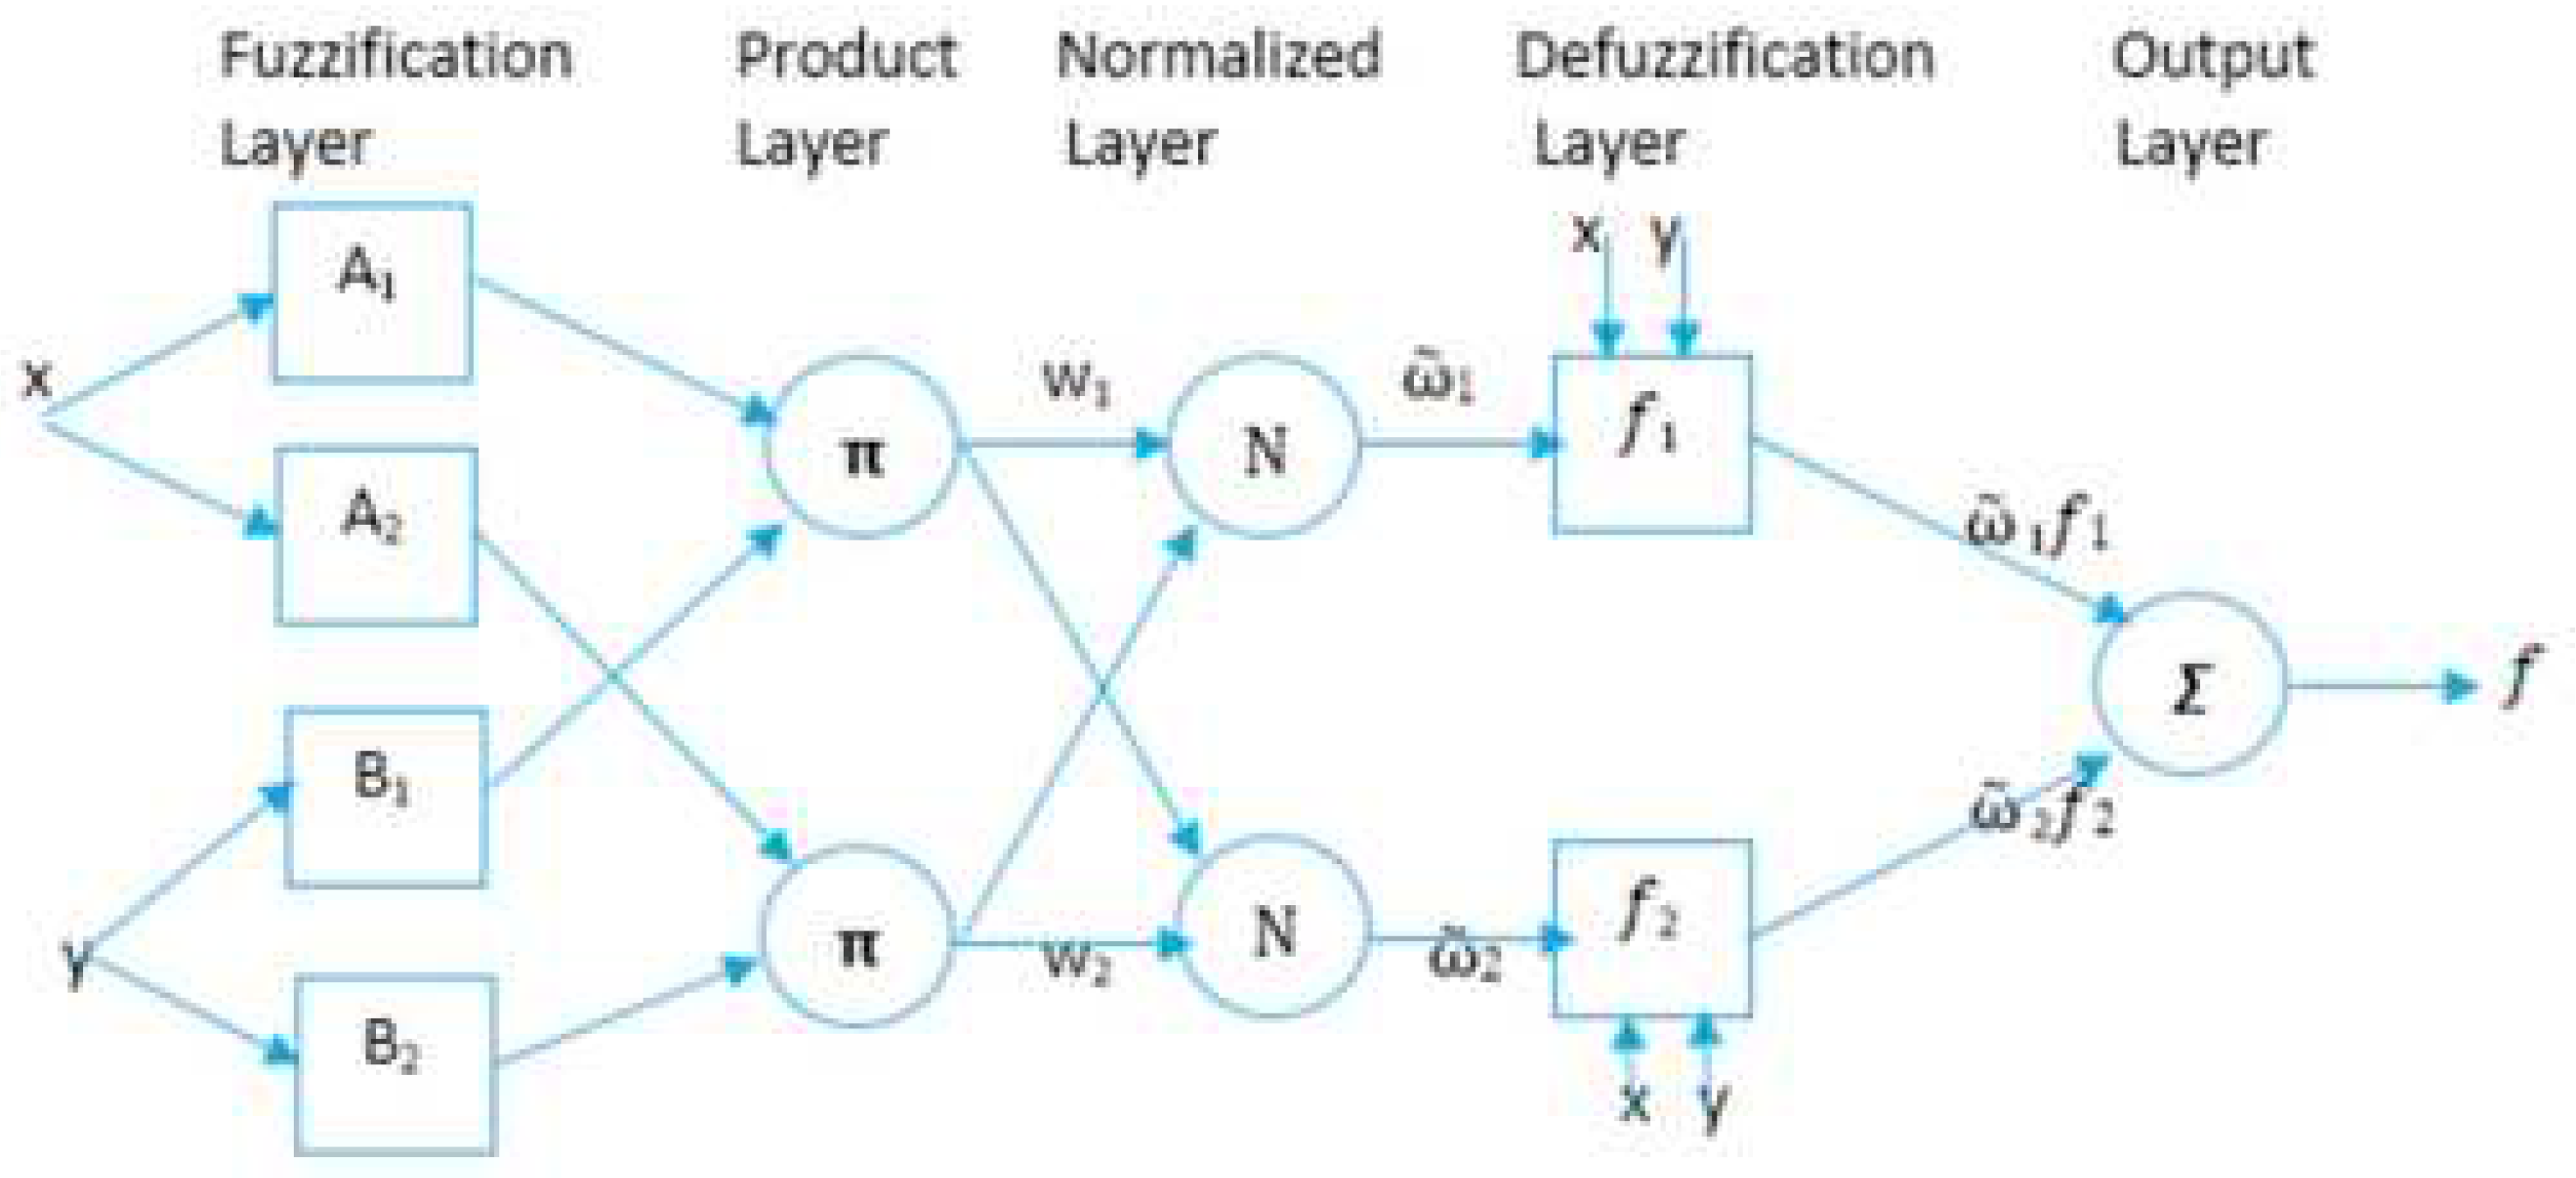
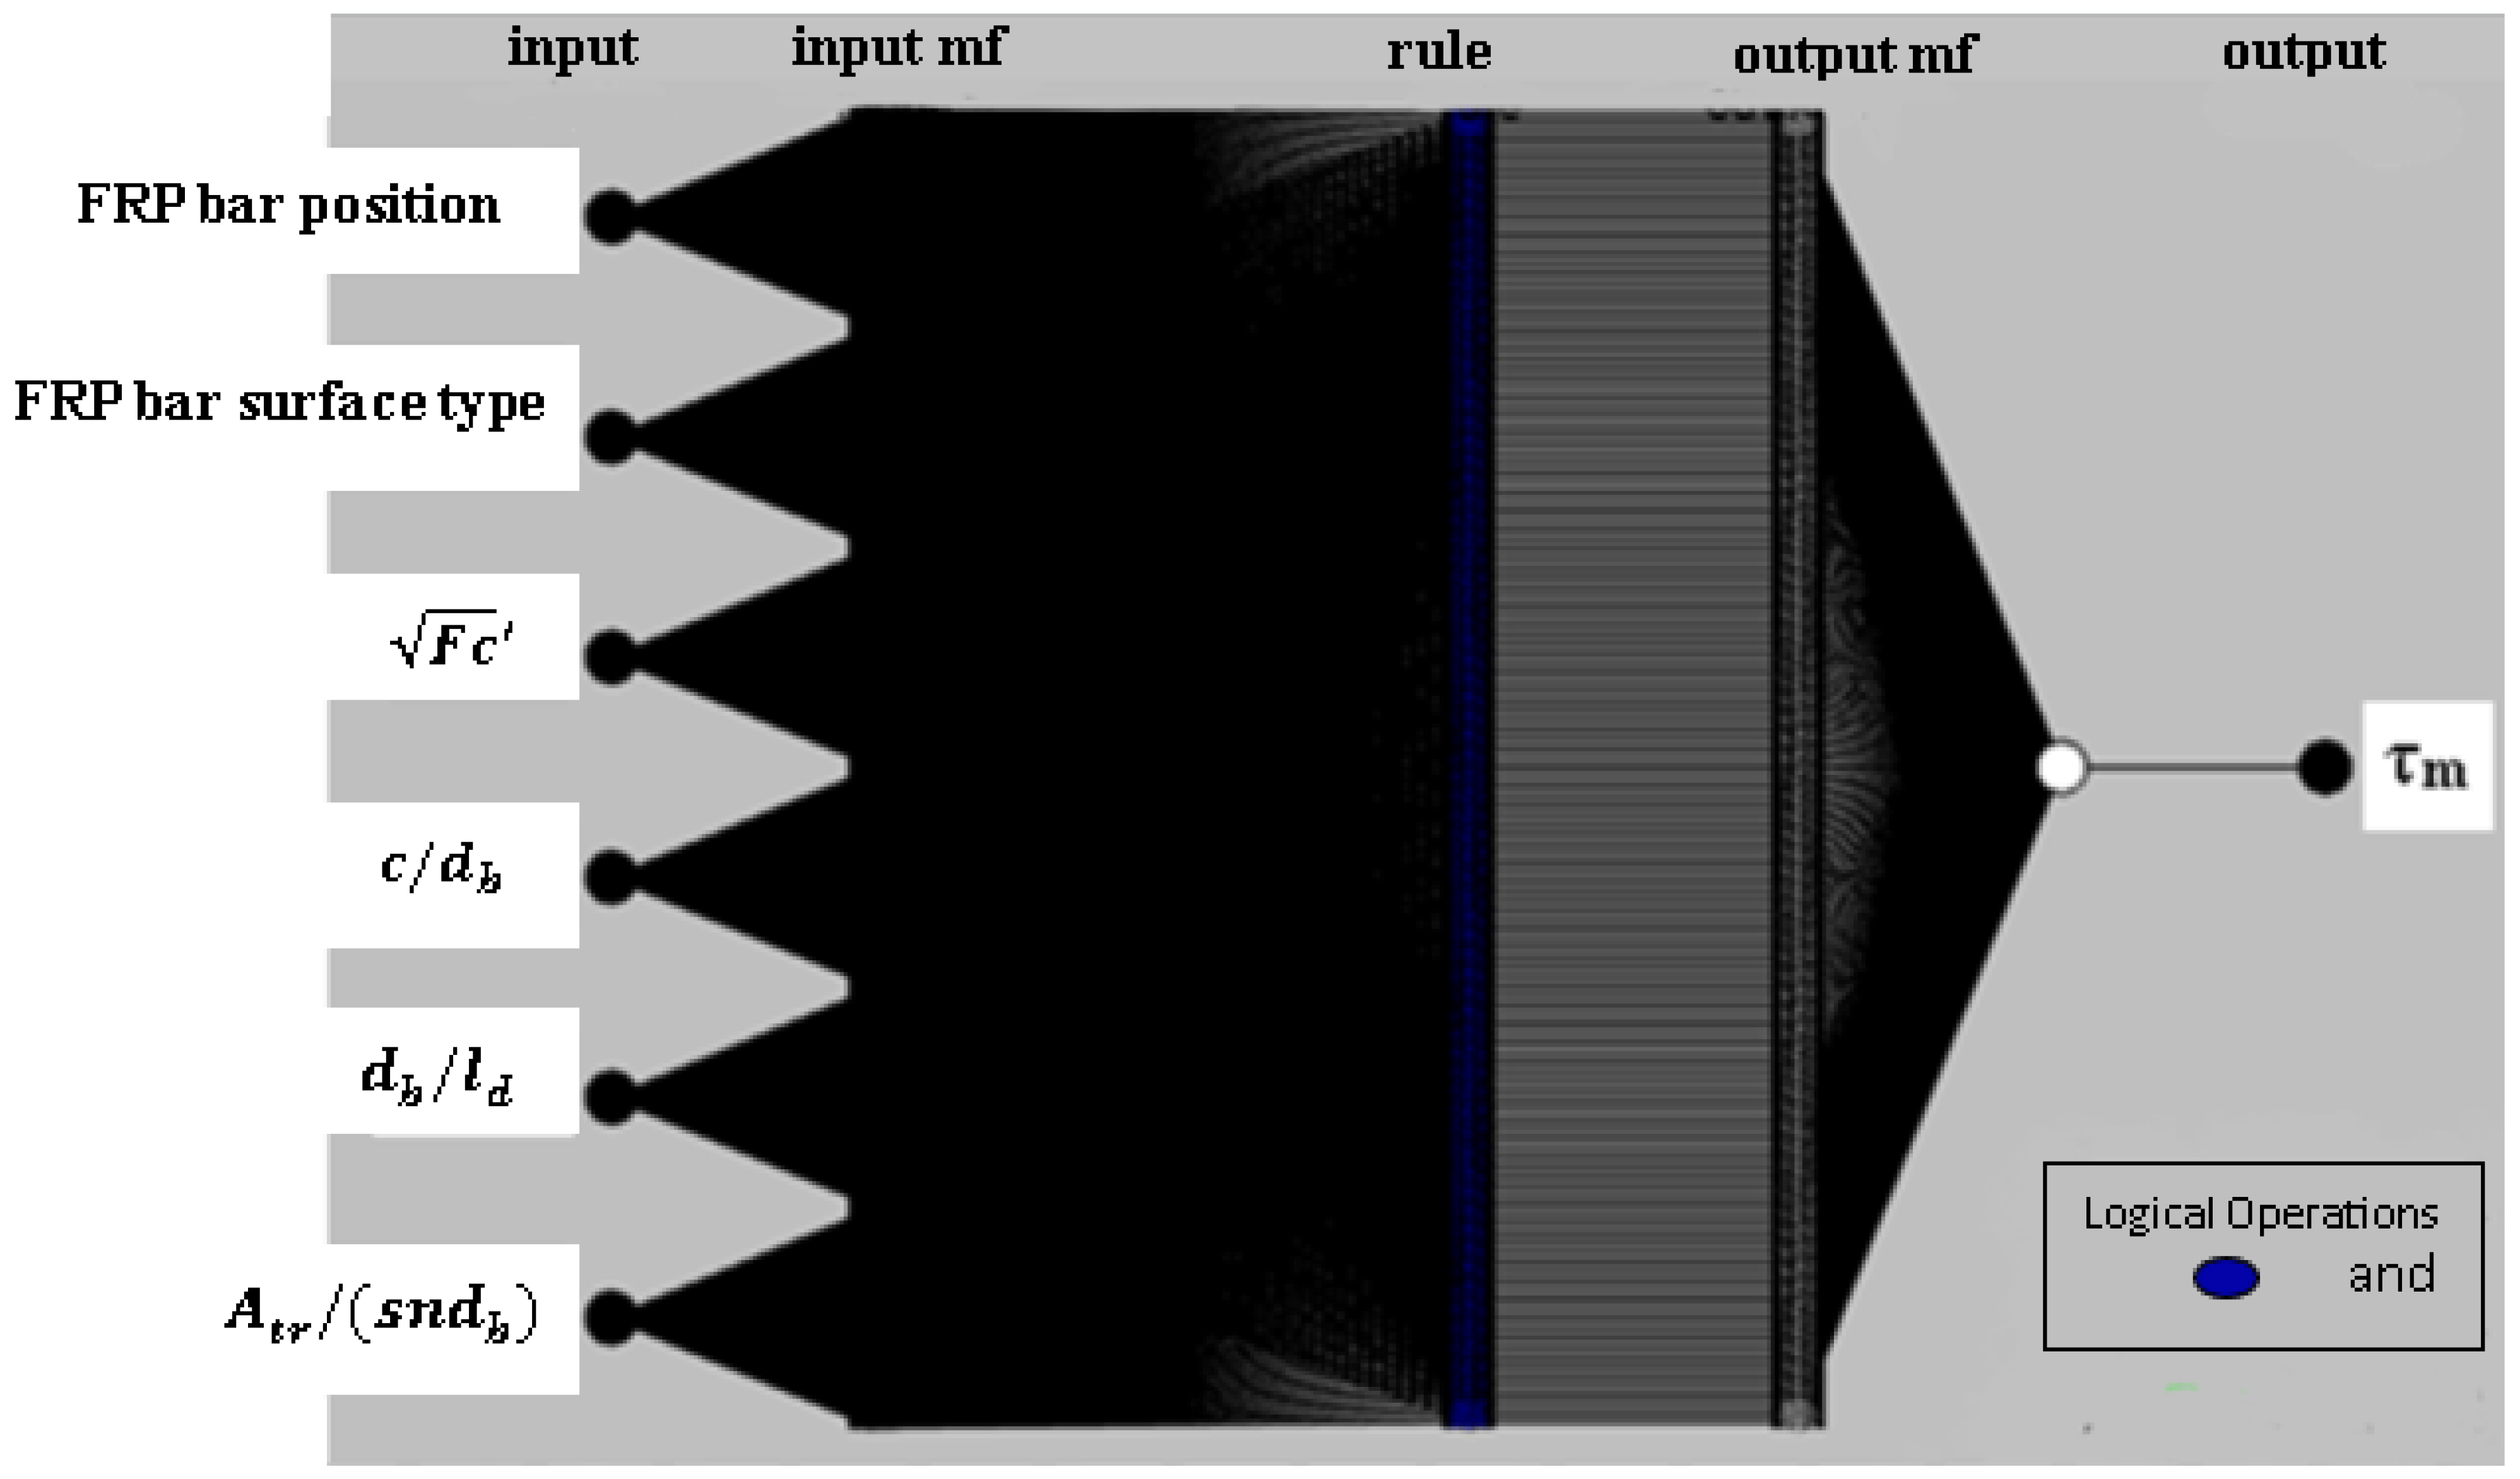
2.3. Construction of the Adaptive Neuro-Fuzzy Inference System (ANFIS)

The ANFIS is a soft computing technique that combines adaptive neural network (ANN) rules and fuzzy logic (FL) theories within an adaptive network framework to make a logical connection between inputs and outputs [41]. An optimization approach is used to determine the parameters of the ANFIS during the training process, and there are two main optimization approaches: hybrid and backpropagation algorithms. In the backpropagation method, all parameters are evaluated only by the gradient descent method, whereas the hybrid training method proposes parameters using the least square estimation (LSE) and gradient descent (GD) methods. The ANFIS process includes five layers: the fuzzification layer, the ule layer, the normalization layer, the defuzzification layer, and the summation layer. Each layer contains a unique set of nodes (adaptive nodes) that can either represent a square for factors that can be changed or a circle for factors that cannot, as shown in Figure 3.
The current work used the MATLAB MathWorks tool (https://www.mathworks.com/products/matlab.html, accessed on 16 January 2024) for neuro-fuzzy design to build and test the ANFIS model. The subtraction clustering technique was chosen to generate the fuzzy inference system. A hybrid learning technique was used for training, which chooses the type and number of membership functions alone. A trial-and-error method was used to find the best ANFIS architecture.

3. Results and Discussion

3.1. Development of the ANN Model

In this study, a backpropagation feed-forward neural network is determined to be the best form of network for input–output fitting issues. A Levenberg–Marquardt optimization-based Bayesian regularization method was utilized to adjust the weight and bias values for training. The network with the lowest MSE and highest R-value was determined to be the optimum ANN design after a process of trial and error. The final network considered, shown in Figure 4, consists of one input layer with six input parameters, one hidden layer with fourteen neurons, and one output layer for a single targeted output. A logistic sigmoid function was considered as an activation function in the hidden layer and a hyperbolic tangent sigmoid function for the output layer.
Figure 5 shows the convergence of the network into a solution at epoch 495, considering the 1000 epochs used to produce the network. As shown, the Mean Square Error (MSE) for training data was found to be 3.4 × 10⁻³, whereas that for testing data was 1.2 × 10⁻³. For the first few epochs, the ANN converged quite rapidly before remaining flat with a minimal change in the MSE. Figure 6 illustrates the fitting and predicting of the network’s performance utilizing the training and test data, with correlation factors (R) of around 0.96 and 0.93, respectively. The overall correlation was about 0.95 when both training and testing data were fit against real values. Figure 7 shows the validation carried out using the 20 experimental points not used in training. The figure illustrates high accuracy with a correlation (R) equal to 0.937.

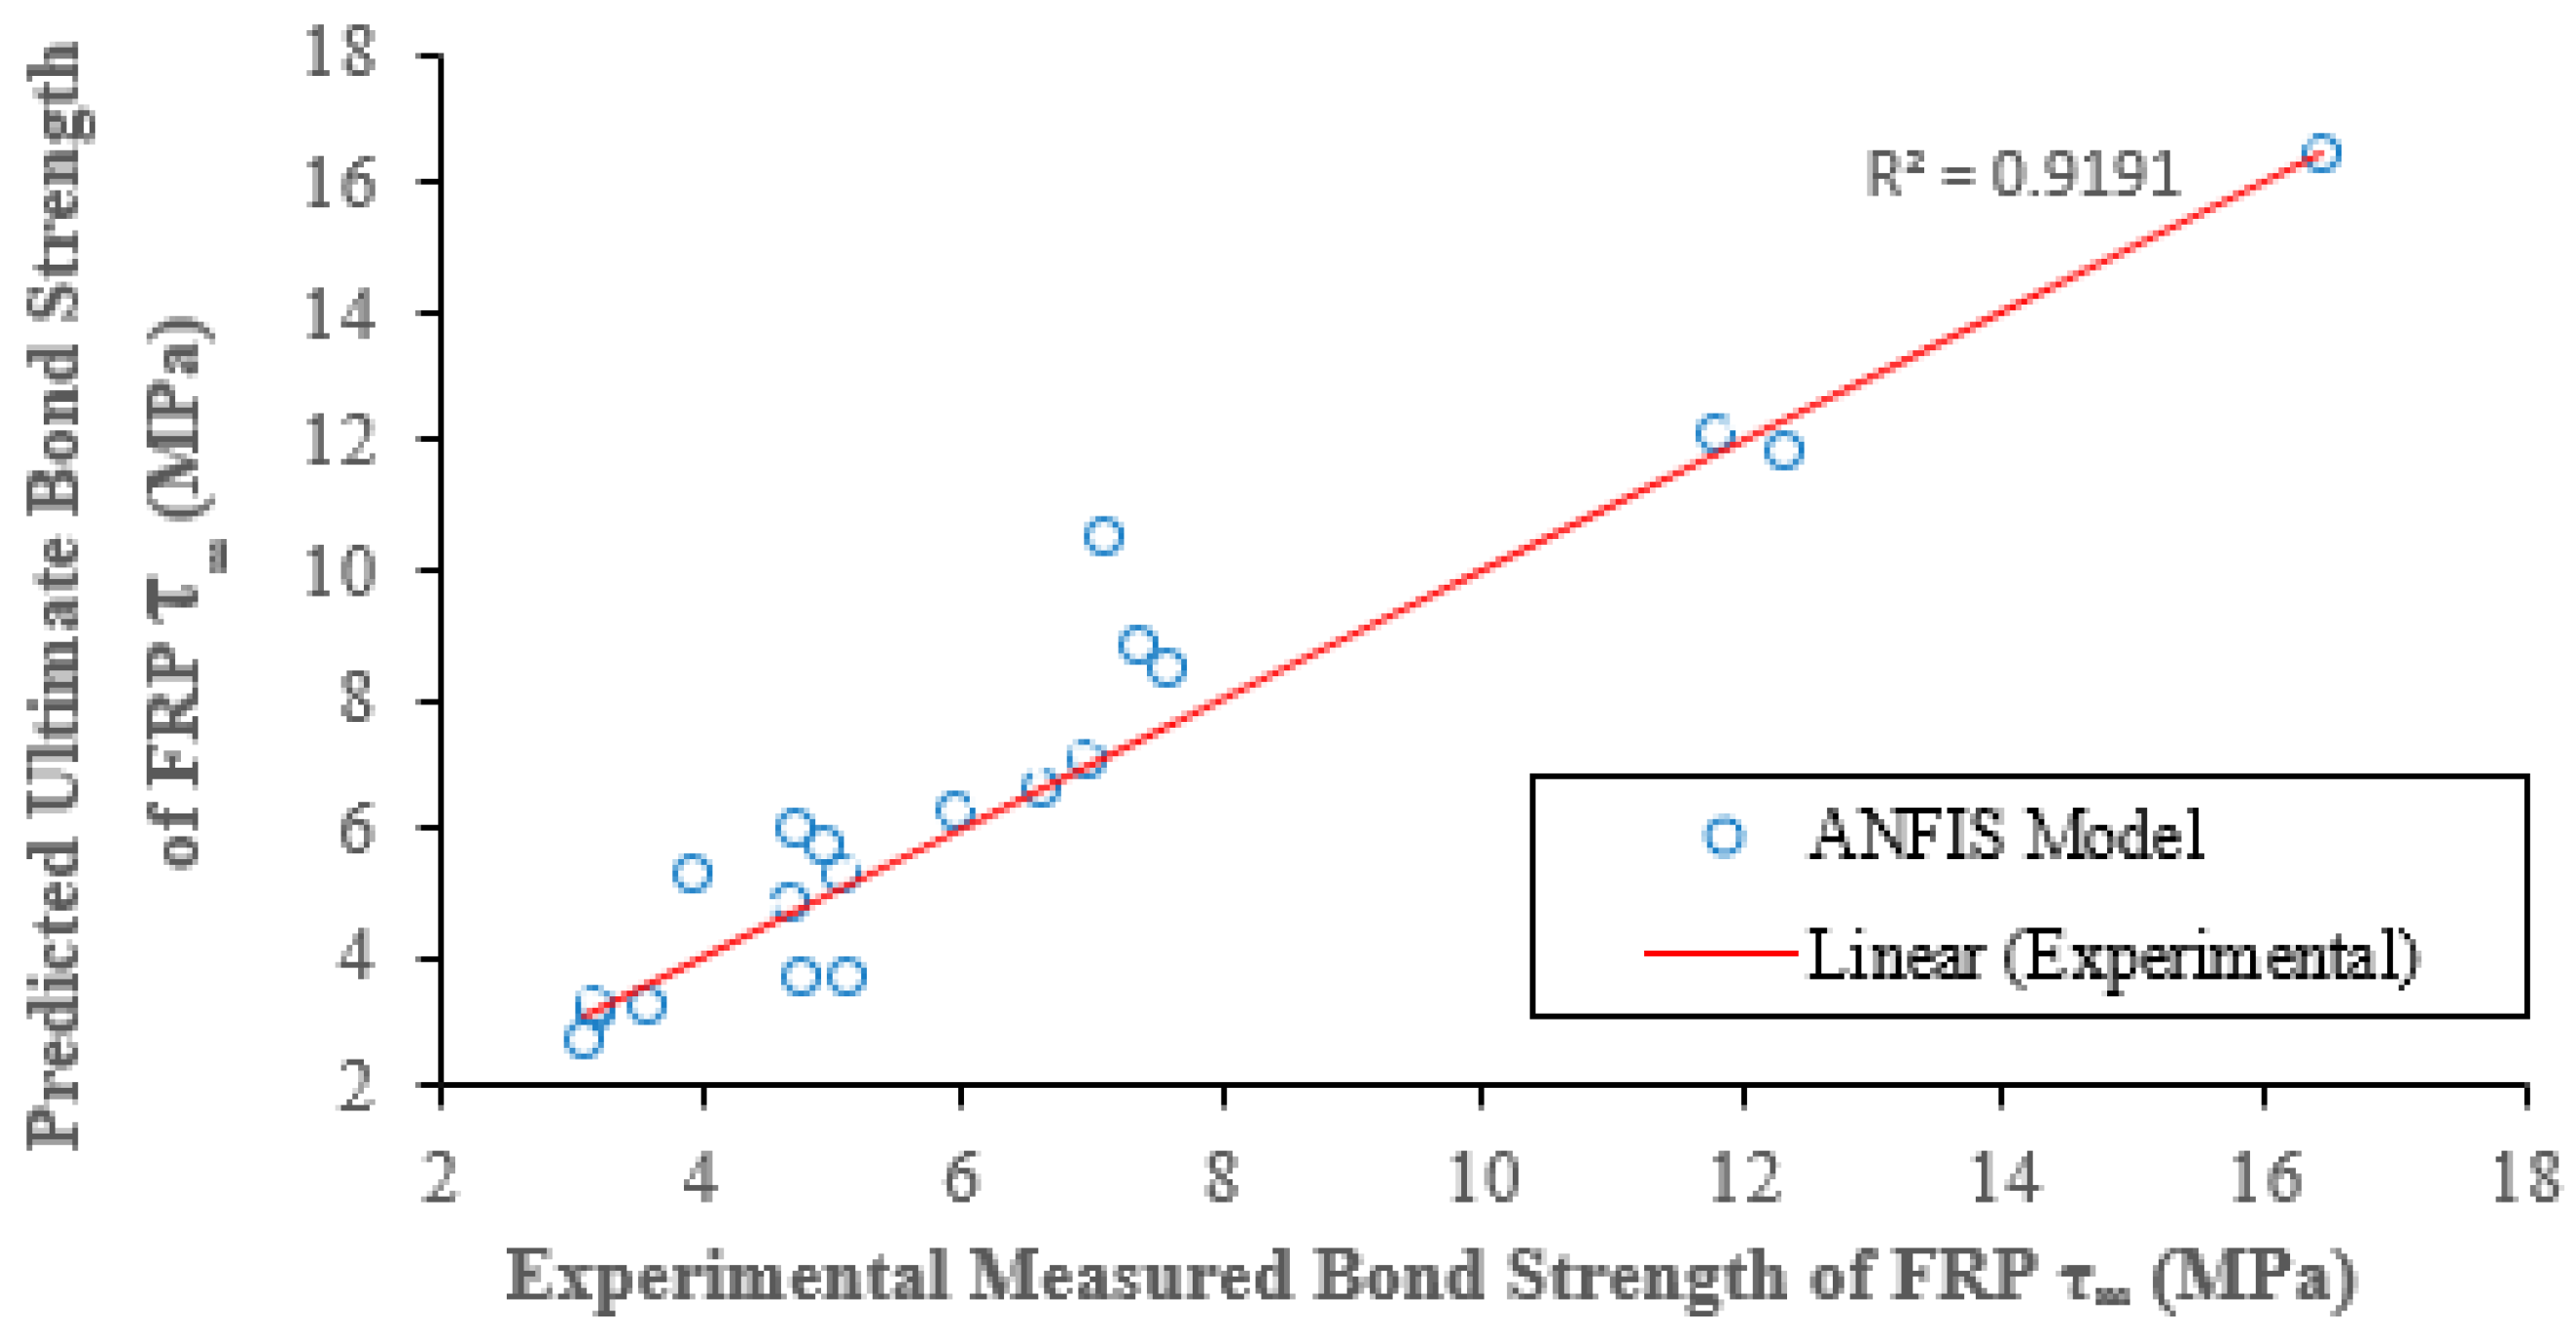
3.2. Development of the ANFIS Model

The current work uses the subtraction clustering technique to generate the fuzzy inference system. A hybrid learning technique was used for training, which chooses the type and number of membership functions alone and combines the least-squares method and gradient descent to determine a feasible set of subsequent and antecedent parameters. This rapid learning strategy was used to create the ANFIS model in the current prediction work, together with the Fuzzy Logic Toolbox and MATLAB (https://www.mathworks.com/products/matlab.html, accessed on 16 January 2024). A trial-and-error method was used to find the best ANFIS architecture. The model with the lowest RMSE was chosen, with 217 membership functions, as shown in Figure 8. During the training process, 10 epochs were used to produce the smallest error possible. According to the training results, the model obtains the smallest error possible after 3 epochs, and 10 epochs confirm the final probable convergence. Figure 9 and Figure 10 compare the projected FRP bond strength from training and testing data with the actual FRP bond strength values. Both figures show that the ANFIS model closely predicts the bond strength of FRP. The correlation for training data is 0.97, and for the 20 testing data points is 0.92 percent, whereas the expected values and experimental values are quite close based on the training error size. According to the analysis of results, most test findings align with projected values.

3.3. Comparison by Validation Points

A comparison between ANN and ANFIS models and the previous literature models [1,7,37,38] after the ANN and ANFIS models had been developed and validated by testing points is discussed in this section. The prediction capabilities, MSE and R-squared, of the proposed ANN and ANFIS were compared to those of the other published analytical models, using the 20 testing points that were not used to develop the models.
Table 4 and Figure 11 illustrate that the ANN and ANFIS have the lowest MSE and highest R-squared values. The previous models have been suggested to explain the bonding behavior of FRP rebars in concrete based on small data sets and only account for certain parameters while neglecting others or are based on specific experimental coefficients. In contrast, the proposed models can fully simulate the bond’s behavior while accounting for all critical factors that cannot be accommodated in a single available practical model. On the other hand, soft computing approaches (ANN and ANFIS) can perform prediction models without wasting time and materials on laboratory tests and without conducting sophisticated analyses. Furthermore, the model can be easily improved, retrained, and updated with new data from recent studies to produce more accurate predictions.

3.4. Comparisons for a Typical Reference Data Set

Predictions of bond strength from the proposed ANN and ANFIS models are compared to those from different models in the literature using a typical reference data set. It is beneficial to see how the bond strength outputs change as a function of a single varying input when all the others are fixed. Table 4 displays typical reference data that was used for bond strength predictions.
These values fall inside the experimental database’s ranges. Other parameters were maintained at a constant to produce bond strength while considering the spectrum of one particular parameter, except for situations when two or more parameters are connected. Figure 12, Figure 13, Figure 14, Figure 15, Figure 16, Figure 17 and Figure 18 show the relationships between bond strength and input parameters obtained from the proposed models and literature equations. The following is a detailed discussion of the trend behavior of ultimate bond strength versus some key parameters.

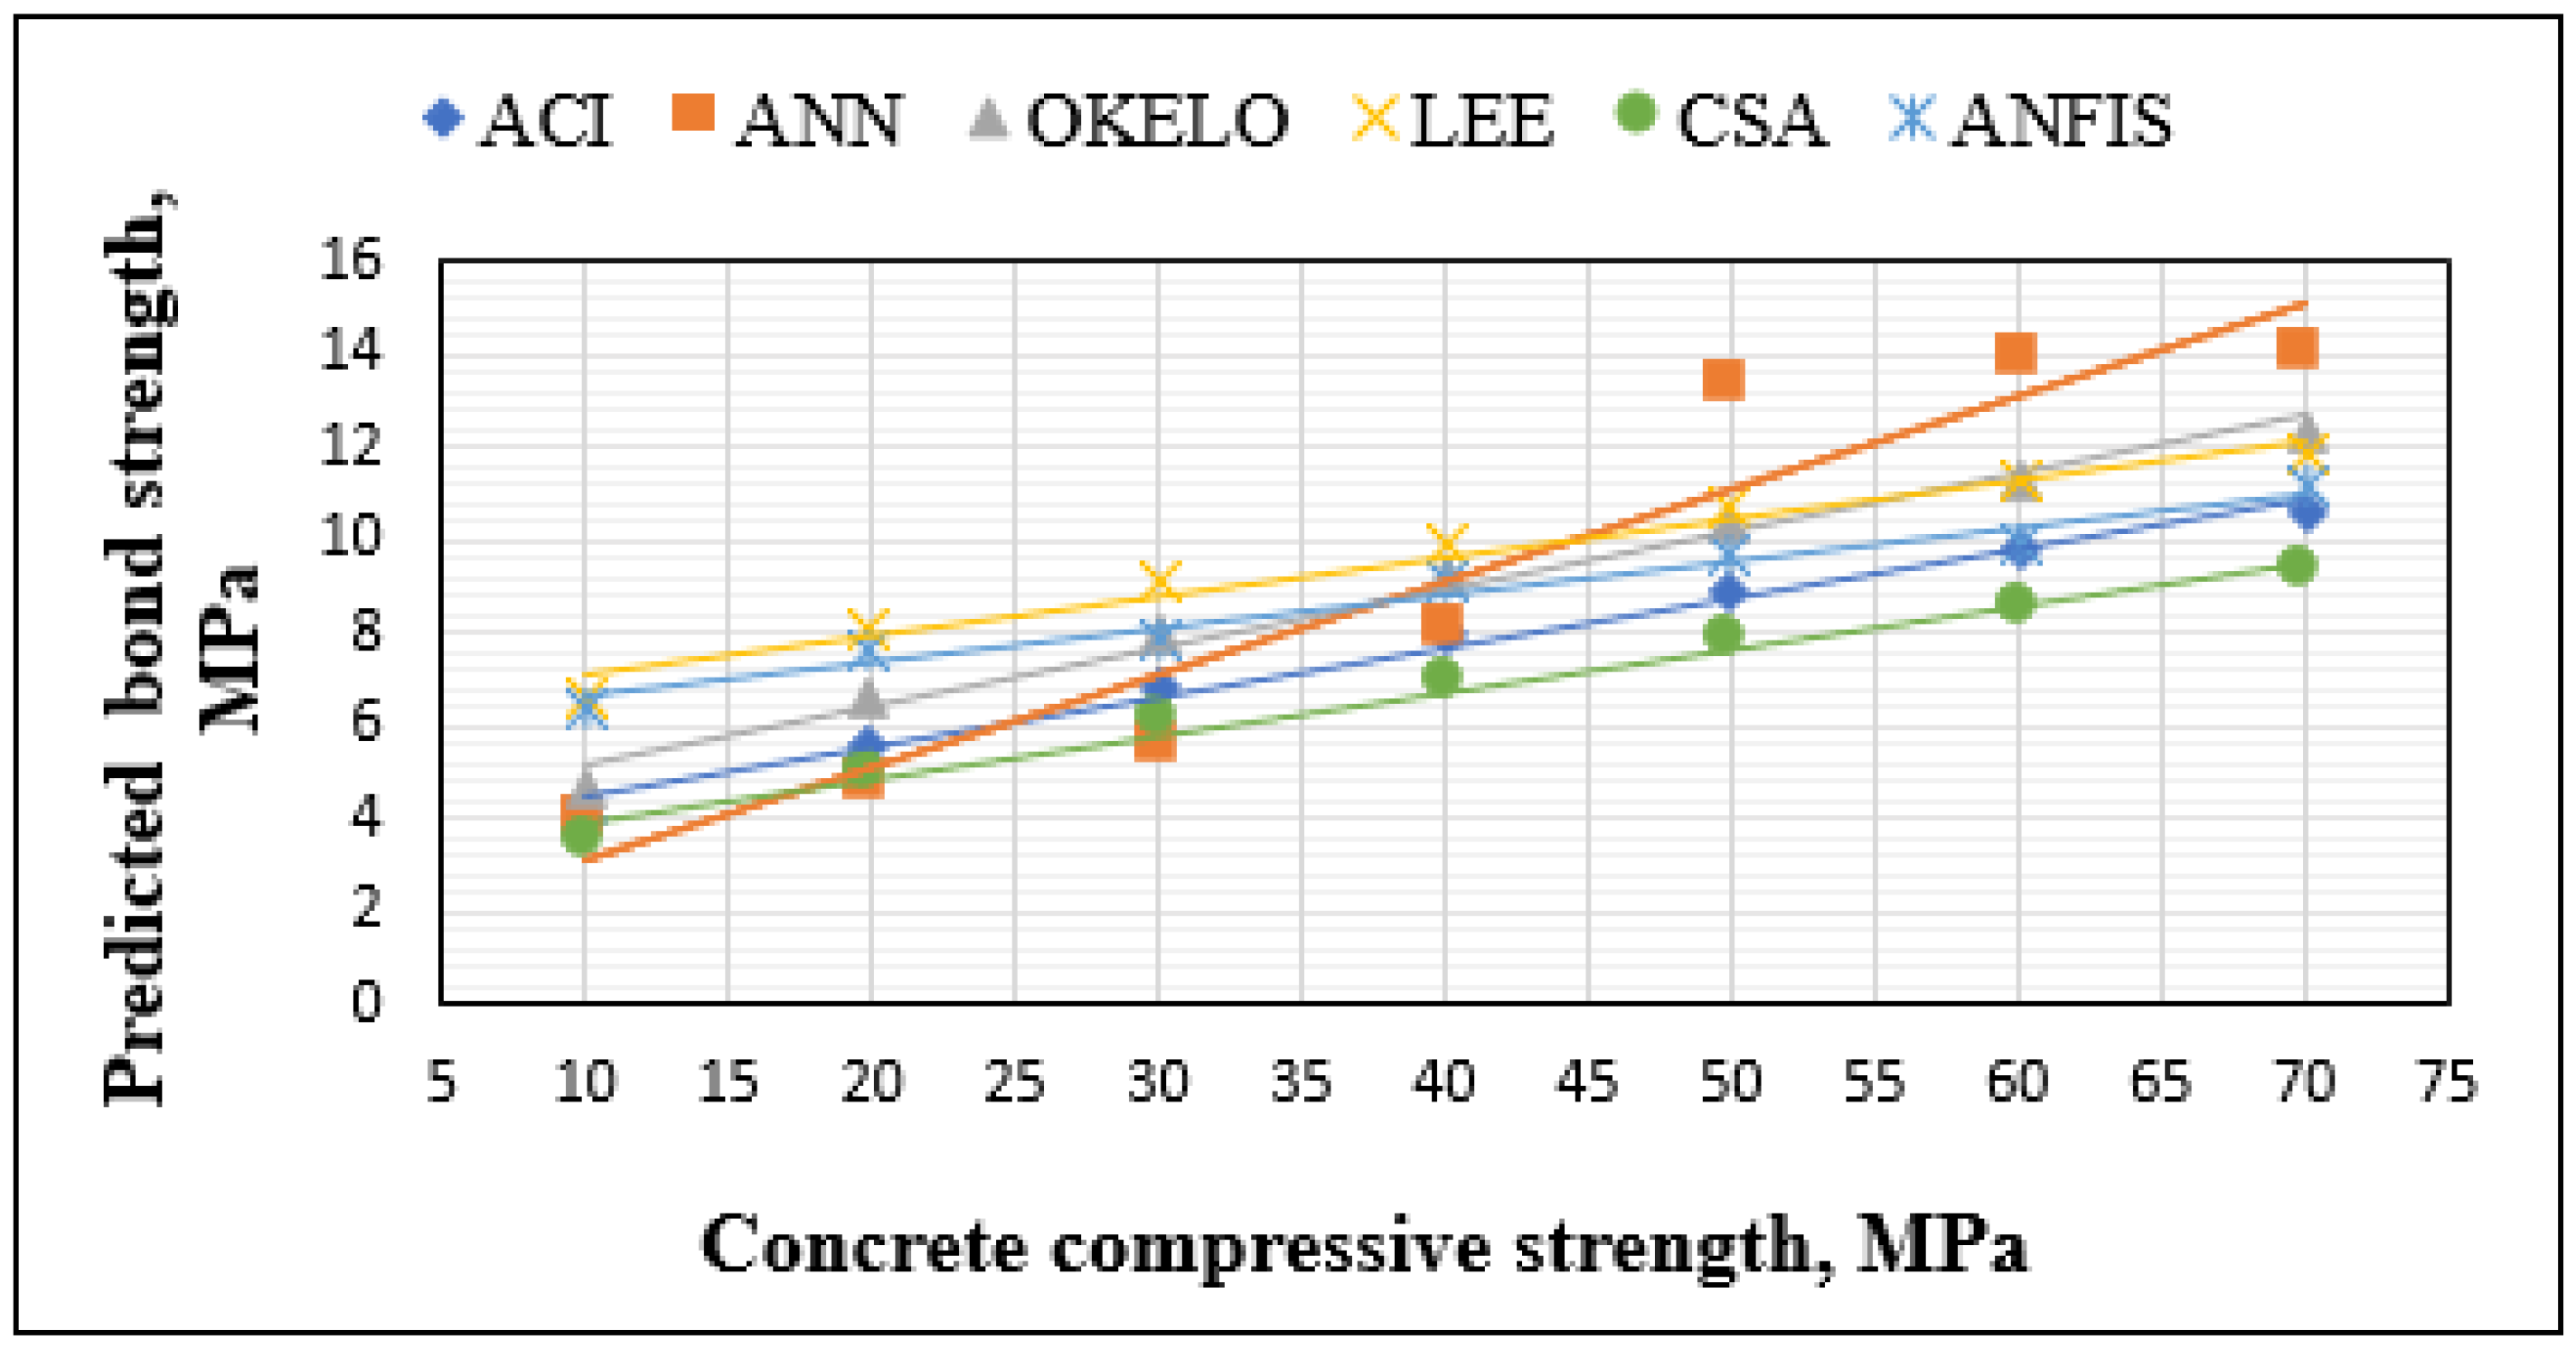
3.4.1. Compressive Strength of Concrete

Several published studies investigated the effect of concrete compressive strength on the strength of the FRP–concrete bond. In this situation, Quayyum [43] noticed that when the strength of the concrete increases, the bond strength also increases, which makes it less likely that the reinforcement will slip. According to Baena et al. [44], changes in the compressive strength of the concrete cause a shift in the failure mode. In addition, ACI 440.1R-06 [1], CSA S6-06 [42], Okelo and Yuan [38], and Lee et al. [39] stated that the bond strength of FRP increases as the compressive strength of concrete increases. Figure 12 shows that the ANFIS model’s estimates are much more in line with the results found in the literature. The estimated results from the ANN model have small validation values (MSE and R2) that prove that ANN was able to capture the complex behavior of the bond strength between FPR bars and concrete.

3.4.2. FRP Bar Diameter

Many studies have shown that the bar diameter significantly affects the bonding performance of FRP bars to concrete [41,43]. Previous studies indicate that bar diameter affects the bond strength of FRP bars in the same way that it affects the bonding strength of steel bars, i.e., the bond strength increases as the diameter of the bar decreases. Many researchers have pointed out that bleeding water accumulates beneath the bar as the diameter increases. As a result, there is a greater chance of voids forming around the bar during curing, leading to a reduced contact area between the concrete and the rebar [13]. As shown in Figure 13, the ANFIS and ANN plots show that the bond strength decreases as the bar diameter increases. Also, Okelo and Yuan [38] and the CSA-S6-06 [42] equations indicate that bond strength decreases for larger diameters. In contrast, as seen in the ACI 440.1R-06 [1] plot, bond strength improves as the bar diameter rises.

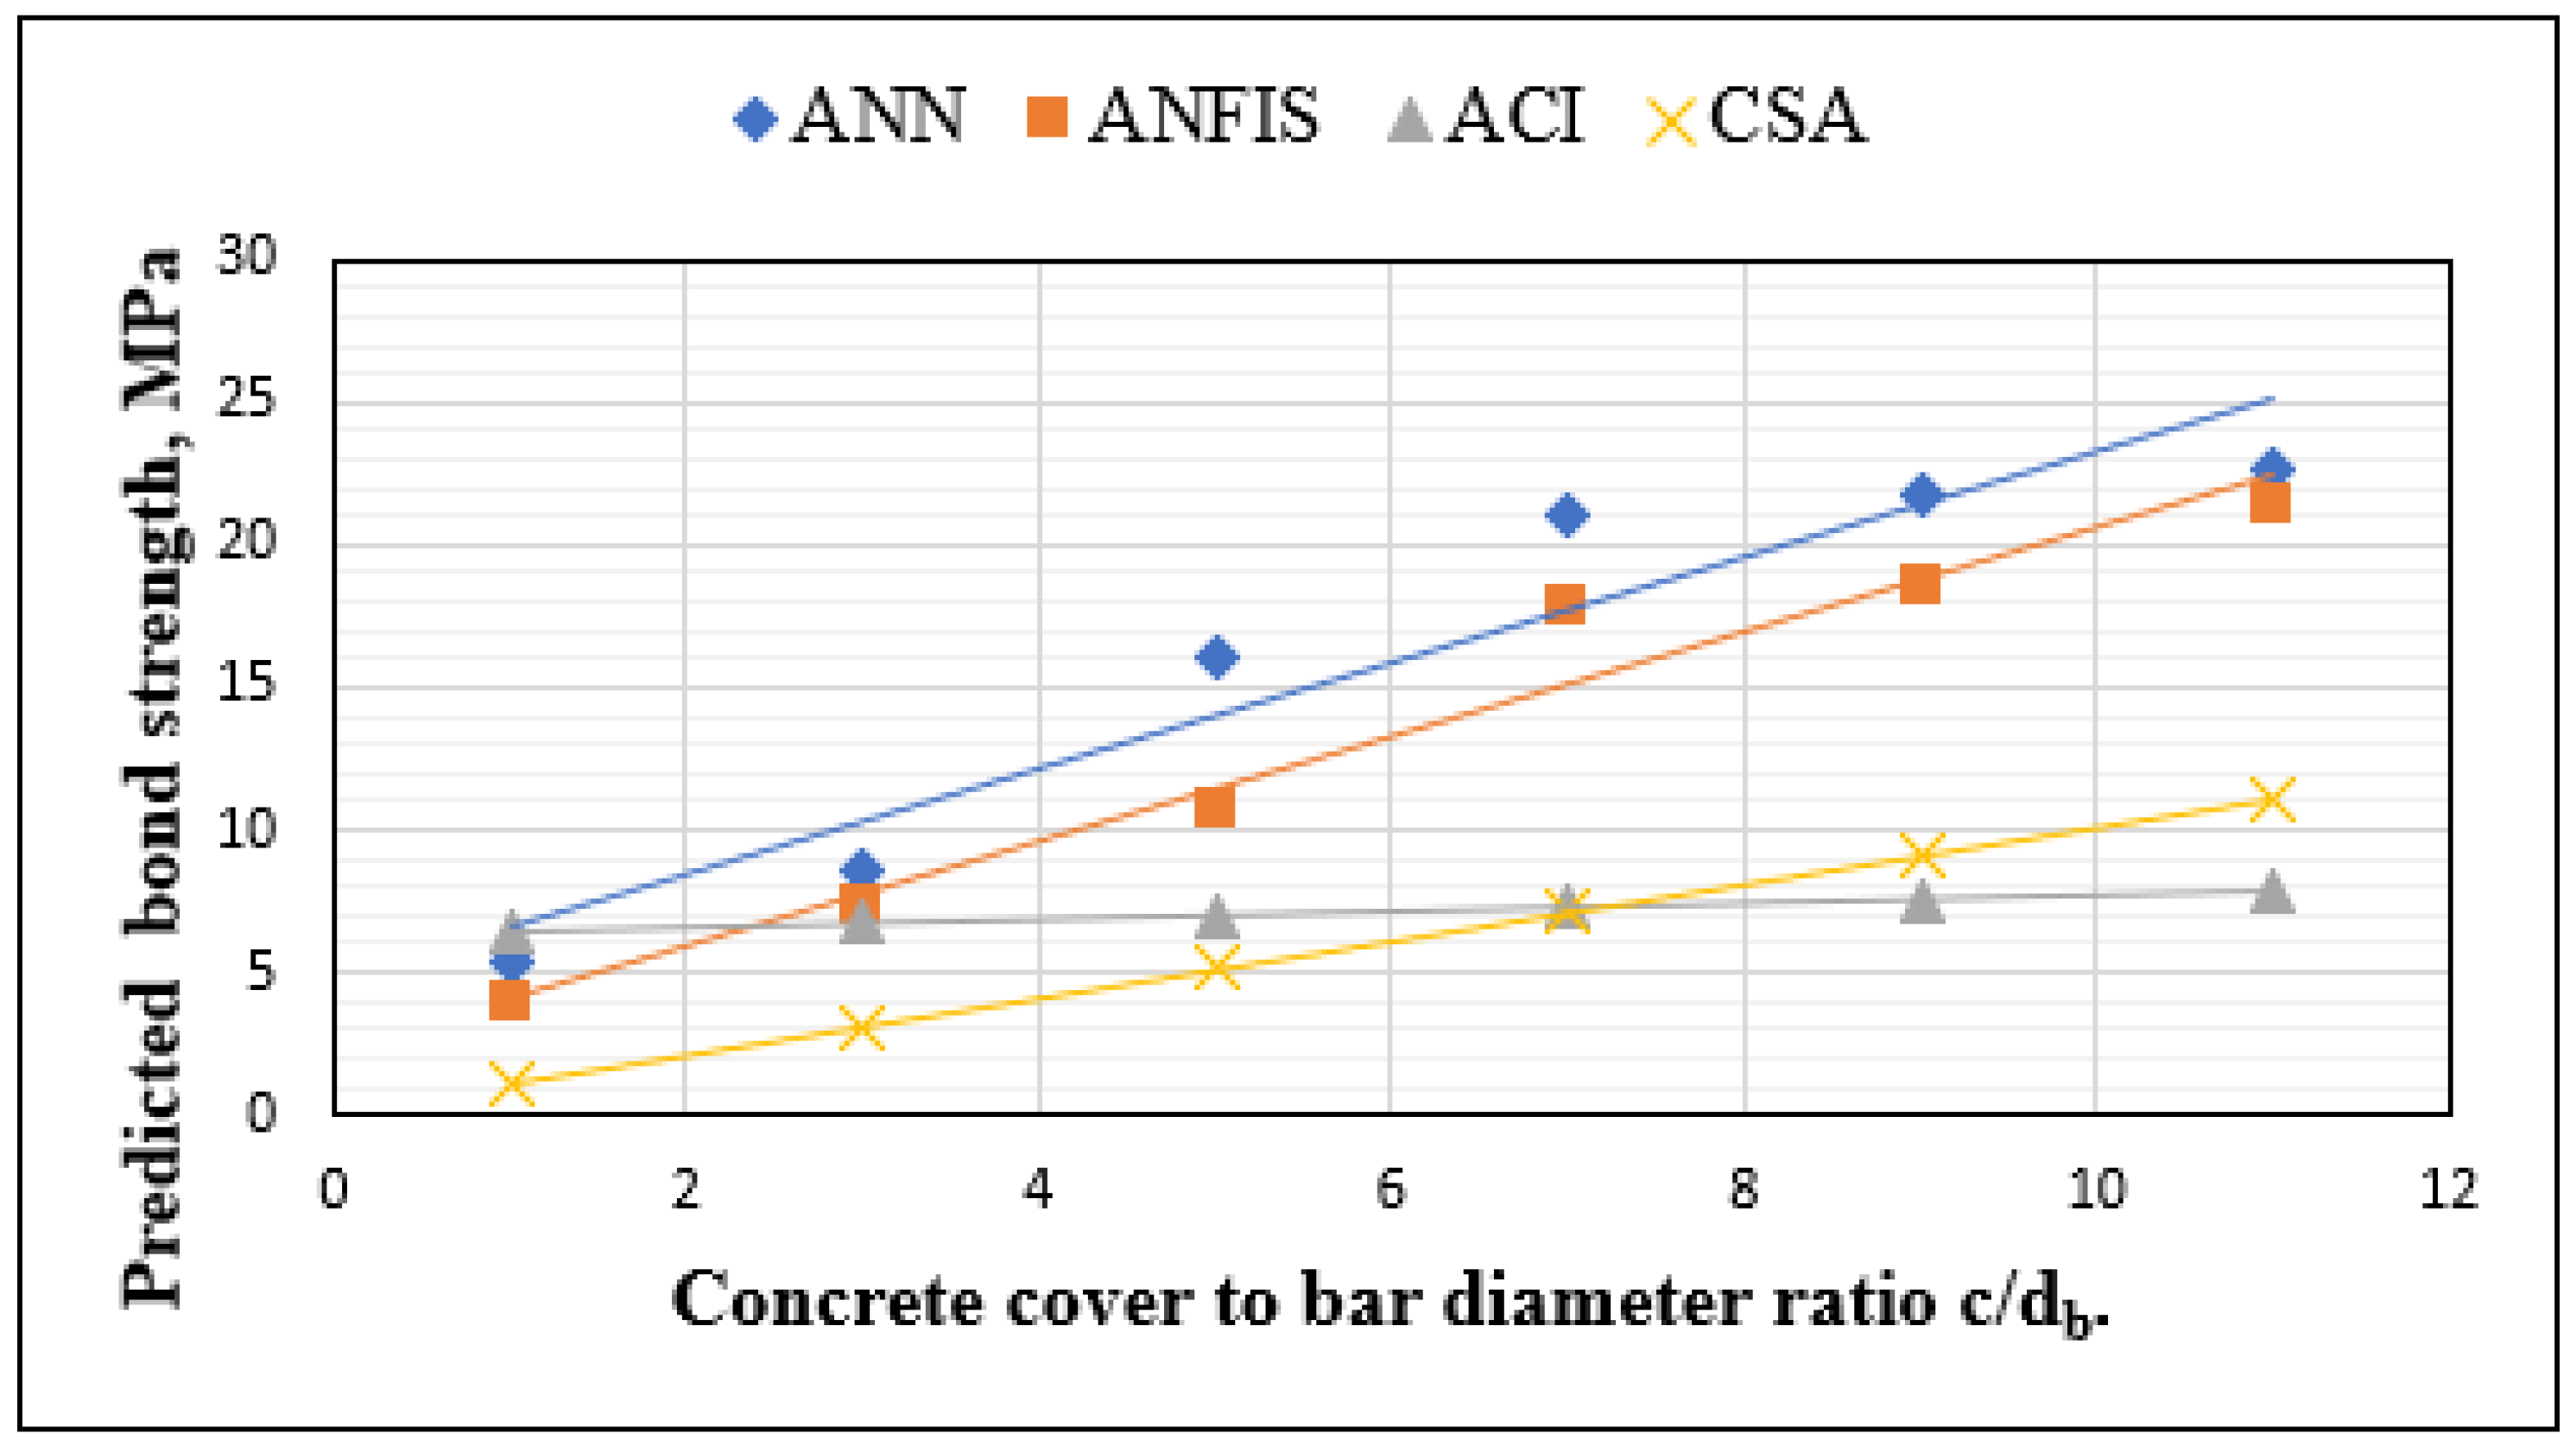
3.4.3. Concrete Cover

Another critical factor affecting bond behavior and the failure mode is the concrete cover, which confines the rebars and therefore improves the bond strength [45]. The splitting capacity of peripheral concrete around the bar increases as the concrete cover thickness increases, thereby maximizing the bond. Aly et al. [46] found that the bond strength improved by 27% when the concrete cover dimension rose from one to four bar diameters. Okelo and Yuan [38] state that mechanical interlocking forces also rise when cover thickness increases, improving the bond strength between concrete and FRP reinforcement. As shown in Figure 14, the CSA S6-06 [42] noticeably captures the increase in the bond strength of FRP as the concrete cover increases. However, the equations in ACI 440.1 R-06 [1] result in a minimal increase in bond strength with the increased concrete cover. The trends of the outputs from the ANN and ANFIS models are evident in Figure 14. There is a direct correlation between the cover size and FRP–concrete bond strength, consistent with the literature results.

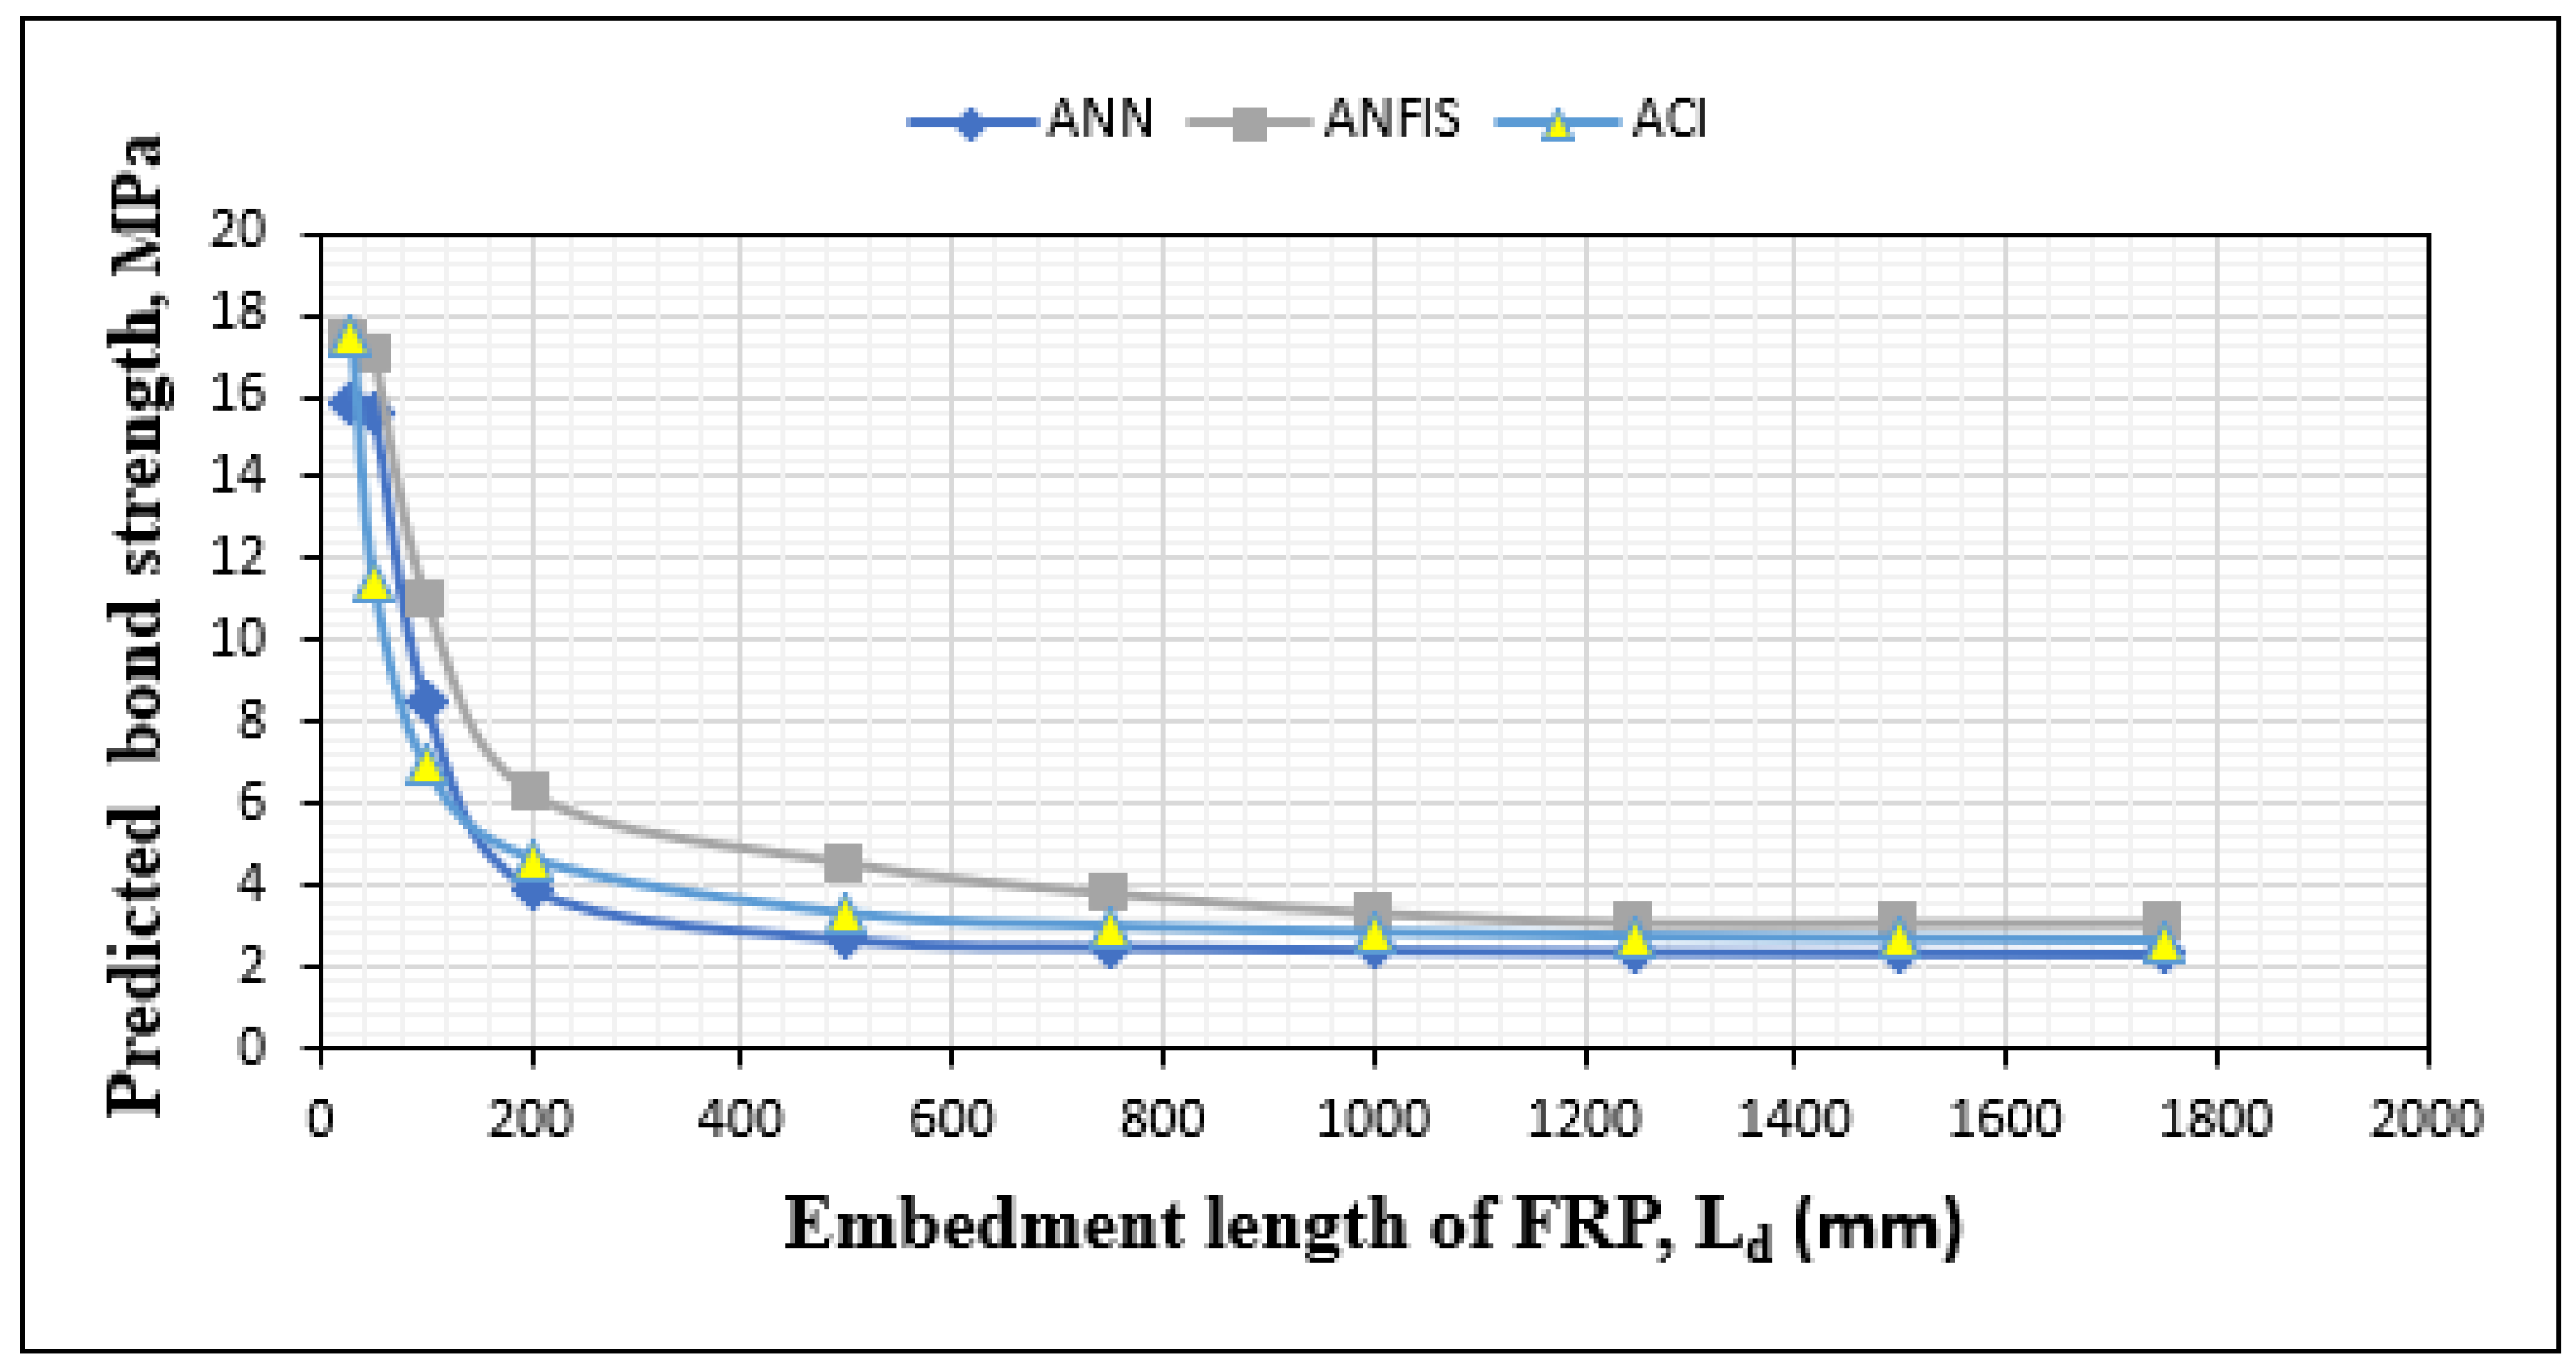
3.4.4. Embedment Length of FRP

Figure 15 depicts the relationship between bond strength and embedment length. Similar to previous investigations [16,47], the experiments demonstrate that bond strength diminishes as embedment length increases. This is attributable primarily to the non-linear distribution of the bond stress along the reinforcing bar, as shown schematically in an inserted plot in Figure 15. As the embedment length increases, the stress is unequally distributed across a longer length, reducing the average bond stress. The specimens with an embedment length of 2.5 db developed the highest bond strength, whereas after Ld = 200 the curves became a plateau for all models. The ANN and ANFIS models reflect a positive impact of increasing the bond width ratio, supporting and consistent with the predictions by ACI 440.1R-06 [1].

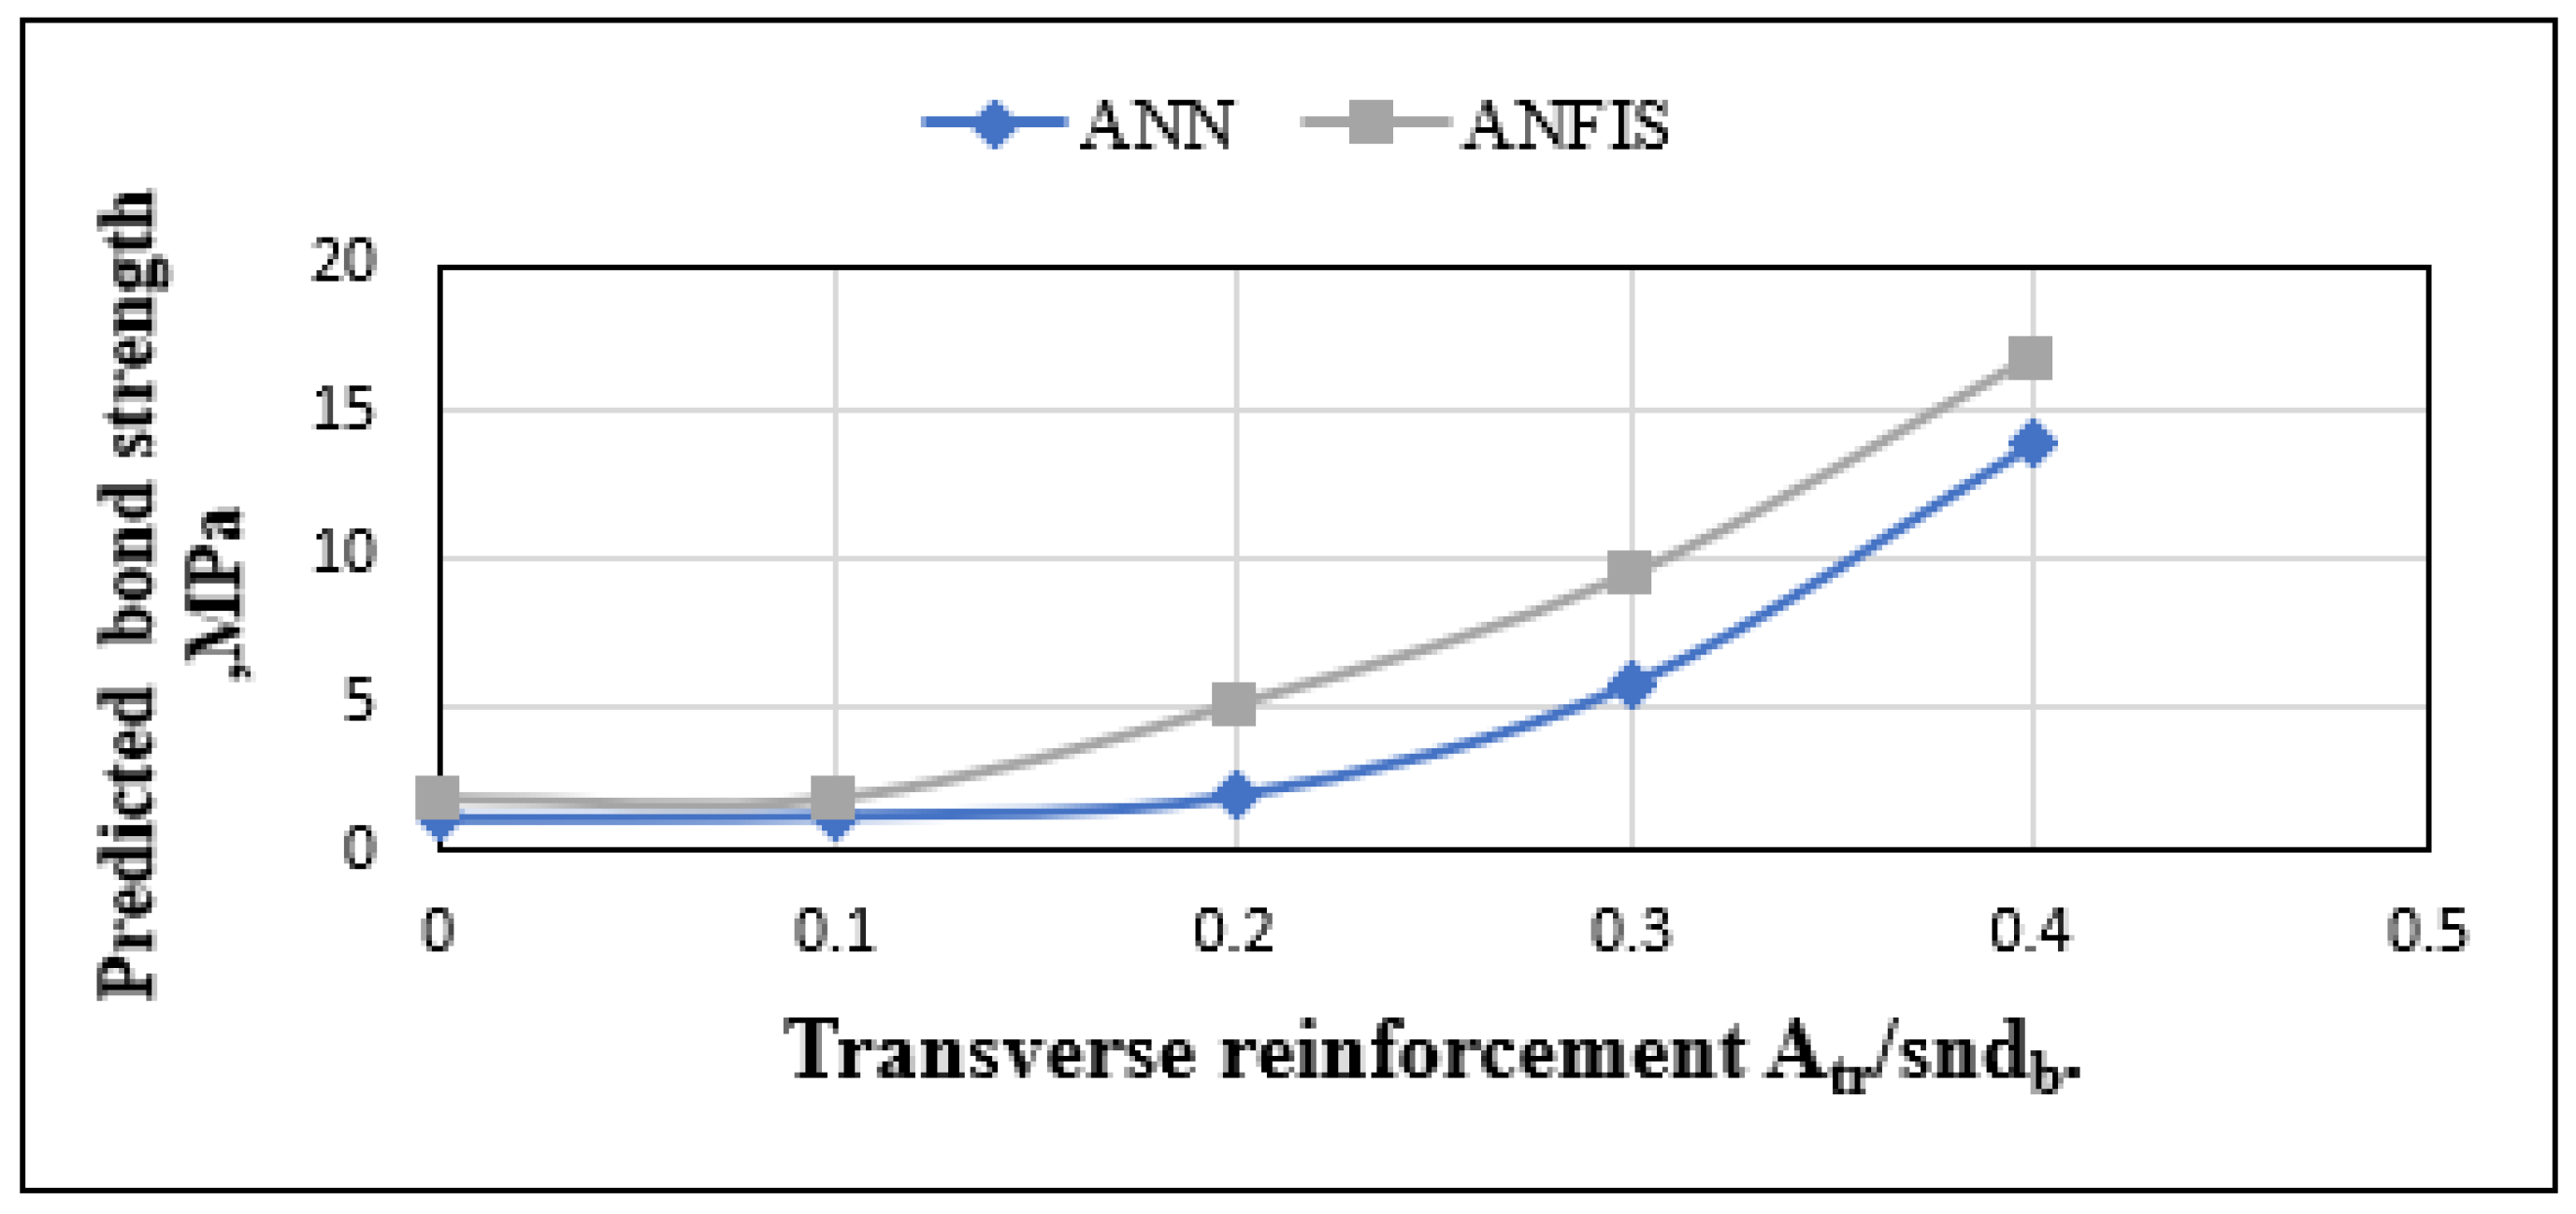
3.4.5. Transverse Reinforcement

The transverse rebar stitches surfaces may potentially split together and increase the concrete’s confinement around the rebar. Several studies have demonstrated that transverse reinforcement significantly increases the bond strength of the steel bars. As the bond strength increases with the addition of transverse reinforcement, the failure mode converts from splitting to pullout [8,47]. Quayyum [7] showed that transverse reinforcement enhanced the bond strength by about 10–15%. The ANN and ANFIS models demonstrated that transverse reinforcement enhances the FRP-to-concrete bond strength, as shown in Figure 16. This parameter is not considered in the equations provided in the current standards and previous research [1,6,38,39]

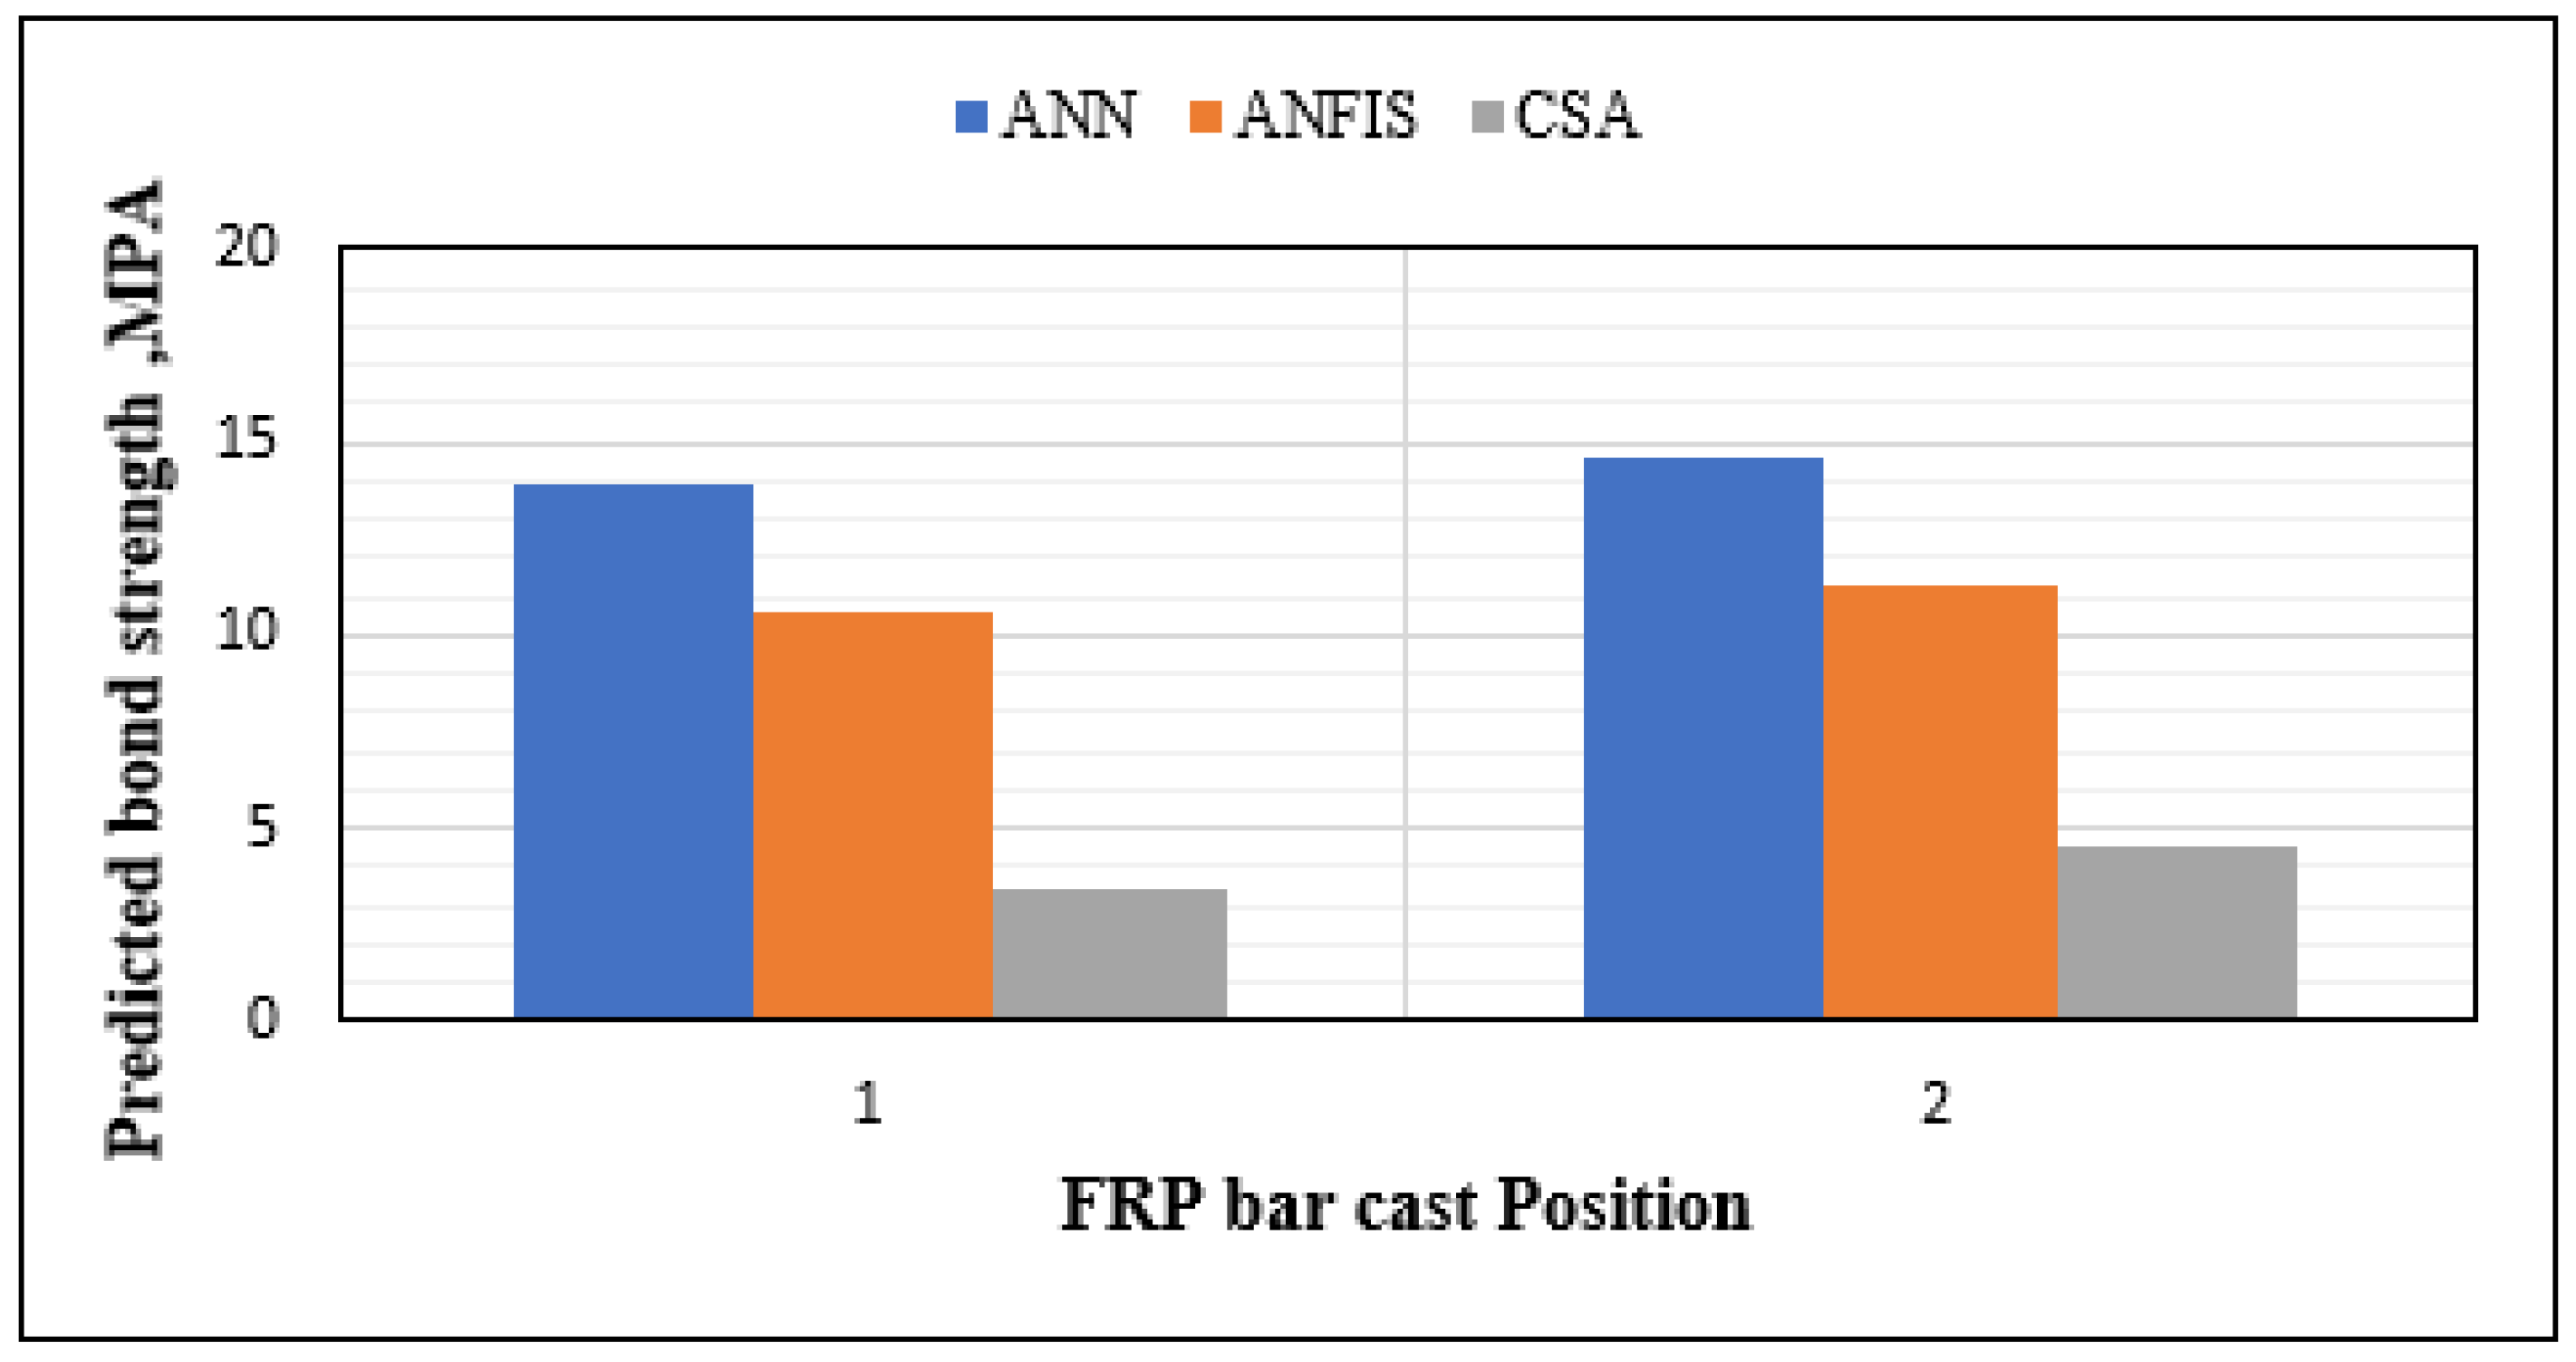
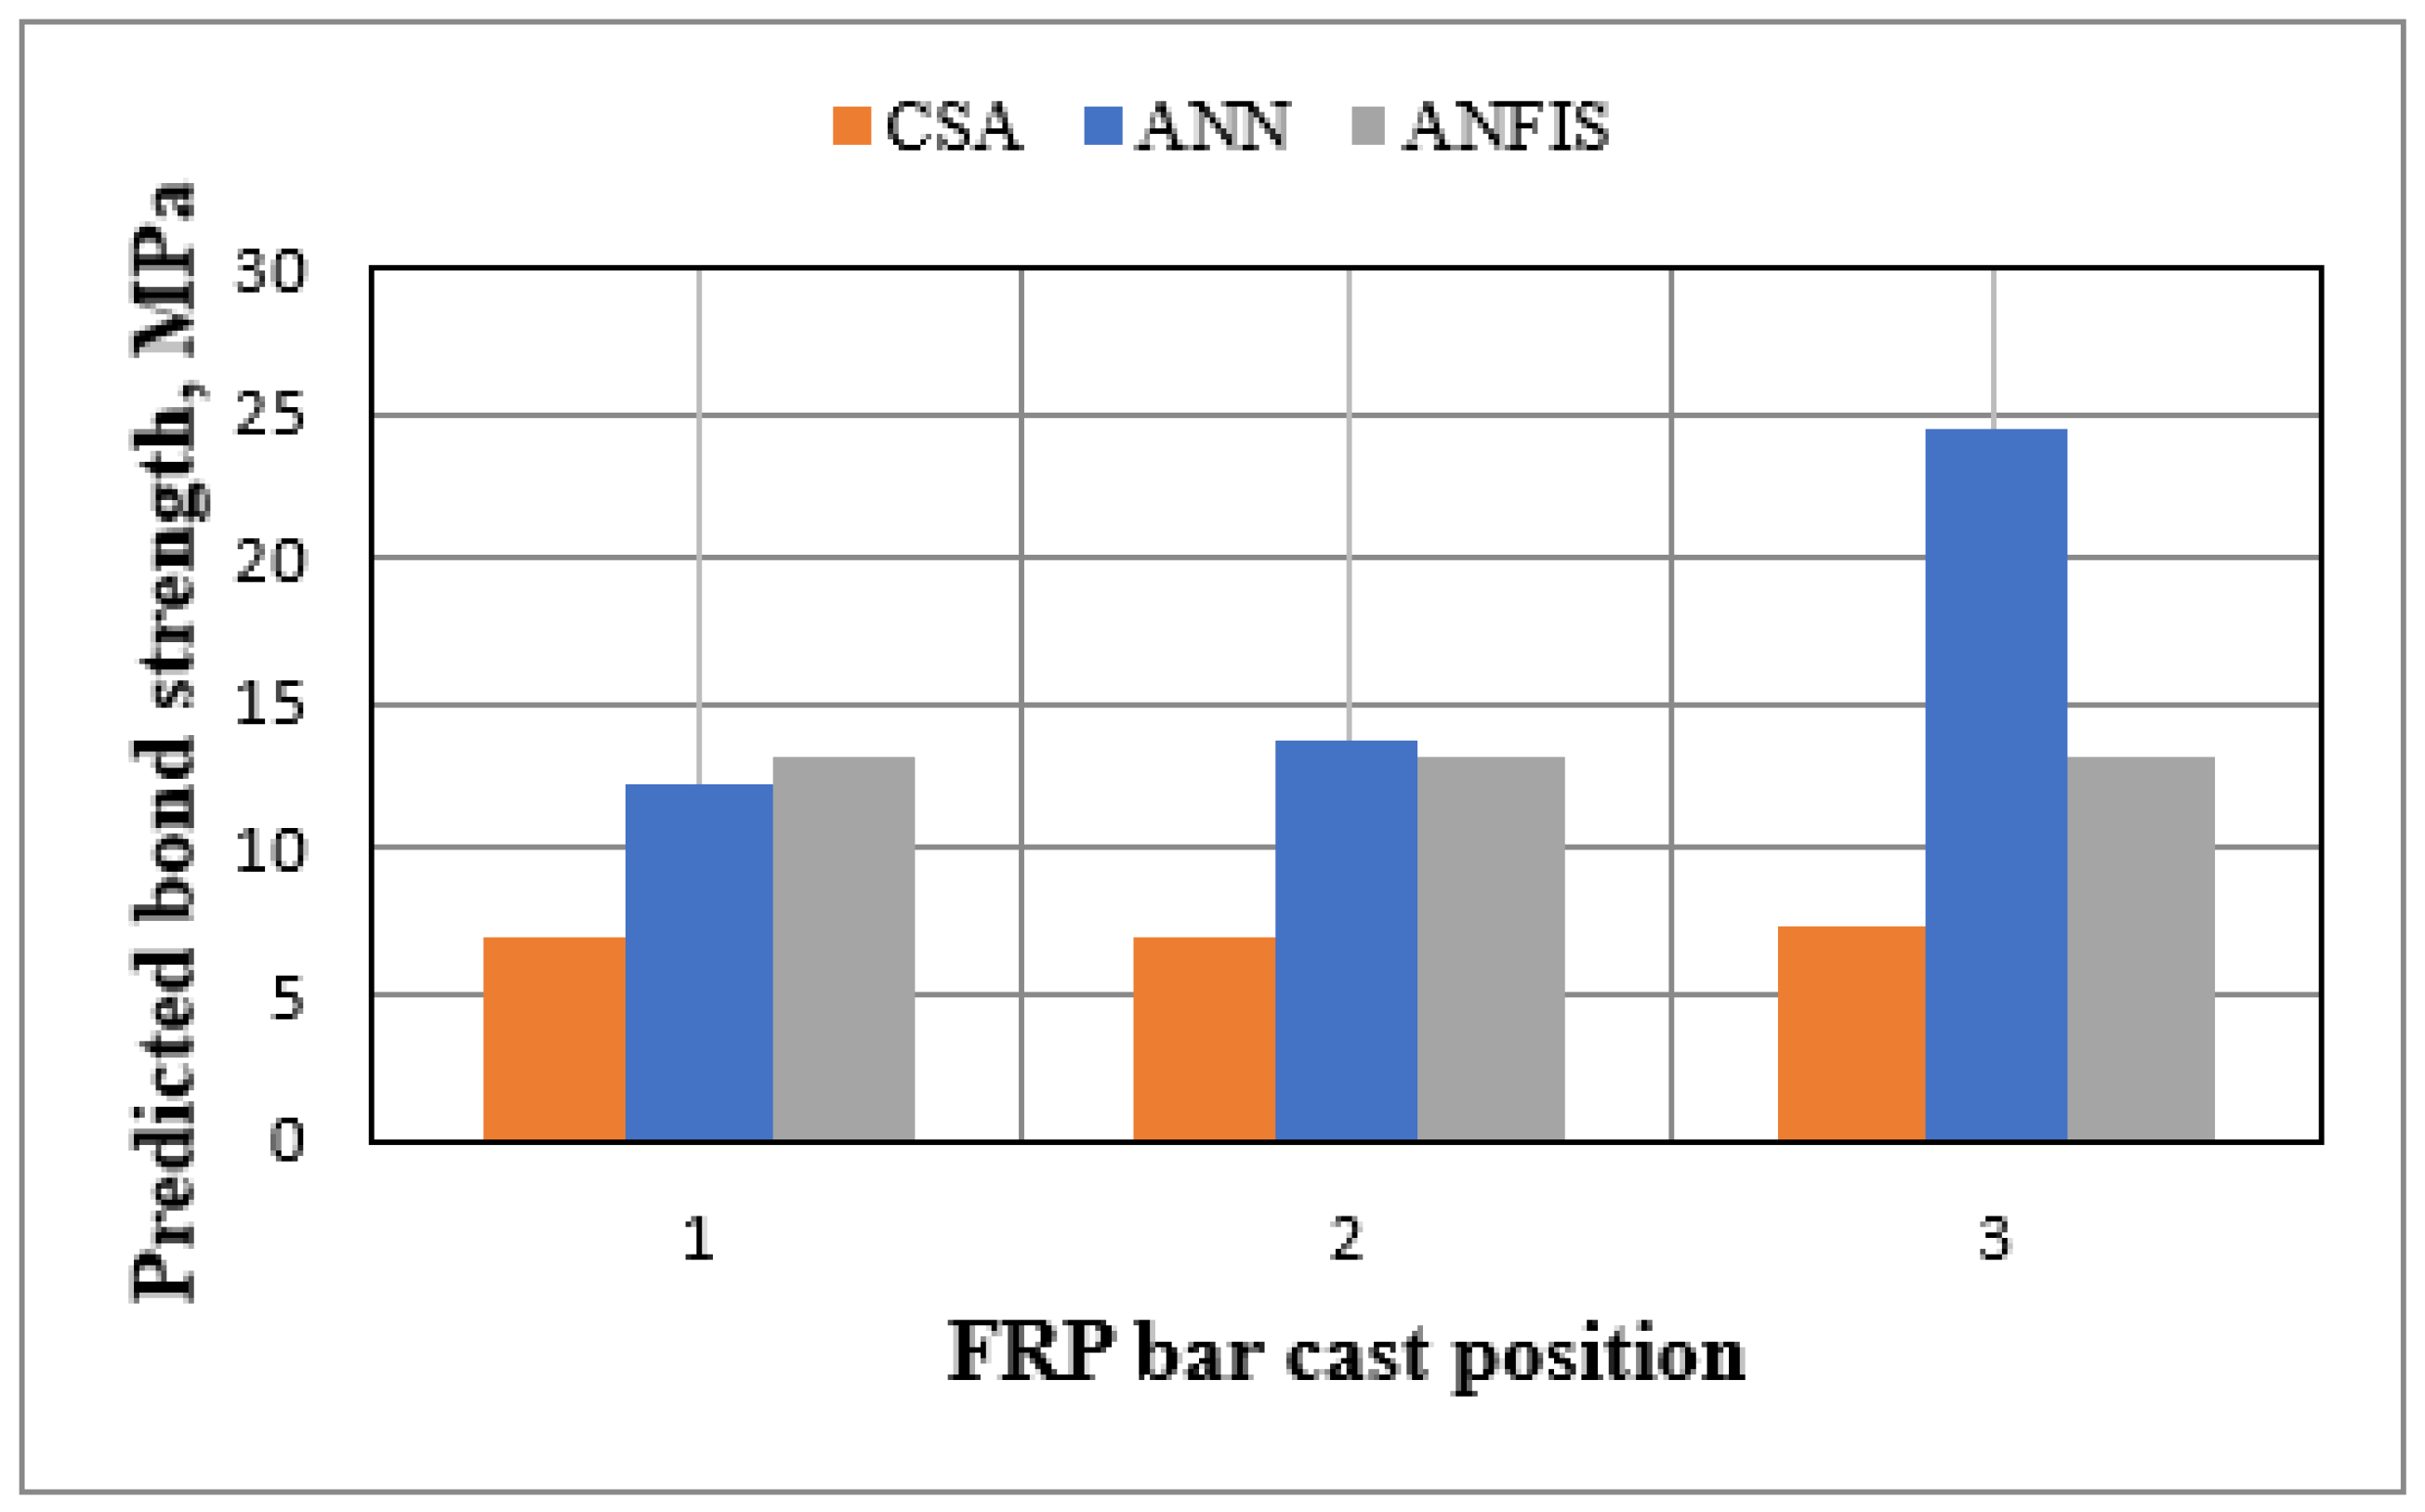
3.4.6. Bar Cast Position

Based on the previous findings of [14], top-cast bars had a bond strength of roughly 66% less than bottom-cast bars. When concrete is poured, air, water, and small particles rise through it and become trapped beneath the rebar as it hardens. As a result of this phenomenon, the bond strength of top-cast bars decreases significantly. The ACI guide [1] proposed a modification factor for the top bar cast position of 1.3 based on Tighiouart et al.’s results [12]. Wambeke and Shield [48] revised this modification factor, which is now 1.5 in ACI 440.1R-06 [1] for top-cast bars and 1.3 in CSA S806-02 [42]. In Figure 17, the ANN and ANFIS model outputs matched code values and previous observations. All have greater FRP bond strength at the bottom than at the top.

3.4.7. FRP Bar Surface Texture Type

Deformed bars are preferred over plain bars because the roughness of the rebar surface improves concrete–FRP bonding. The effect of FRP bar texture on the development length is considered by using varying adjustment factors for different types in CSA S806-12 [49] (1.0 for rough, sand-coated, or braided surfaces; 1.05 for the spiral pattern or ribbed surfaces; and 1.8 for indented surfaces). ACI 440.1R-06 [1] ignores the rebar surface texture type. Ref. [48] suggested that FRP texture type did not affect the concrete bond strength. Baena et al. [44] pulled out 88 FRP bars and found that the rebar surface texture does not make a difference to the bond strength when the FRP bar fails. Figure 18 shows the FRP–concrete bond strength variation corresponding to the rebar texture type. It was observed that the output of the ANFIS model is not affected by texture type, while ANN showed that spiral-wrapped and helical-lugged have the same value, which agrees with the CSA code, which gives them the same modification factors.

4. Sensitivity Analysis of the ANN and ANFIS Models

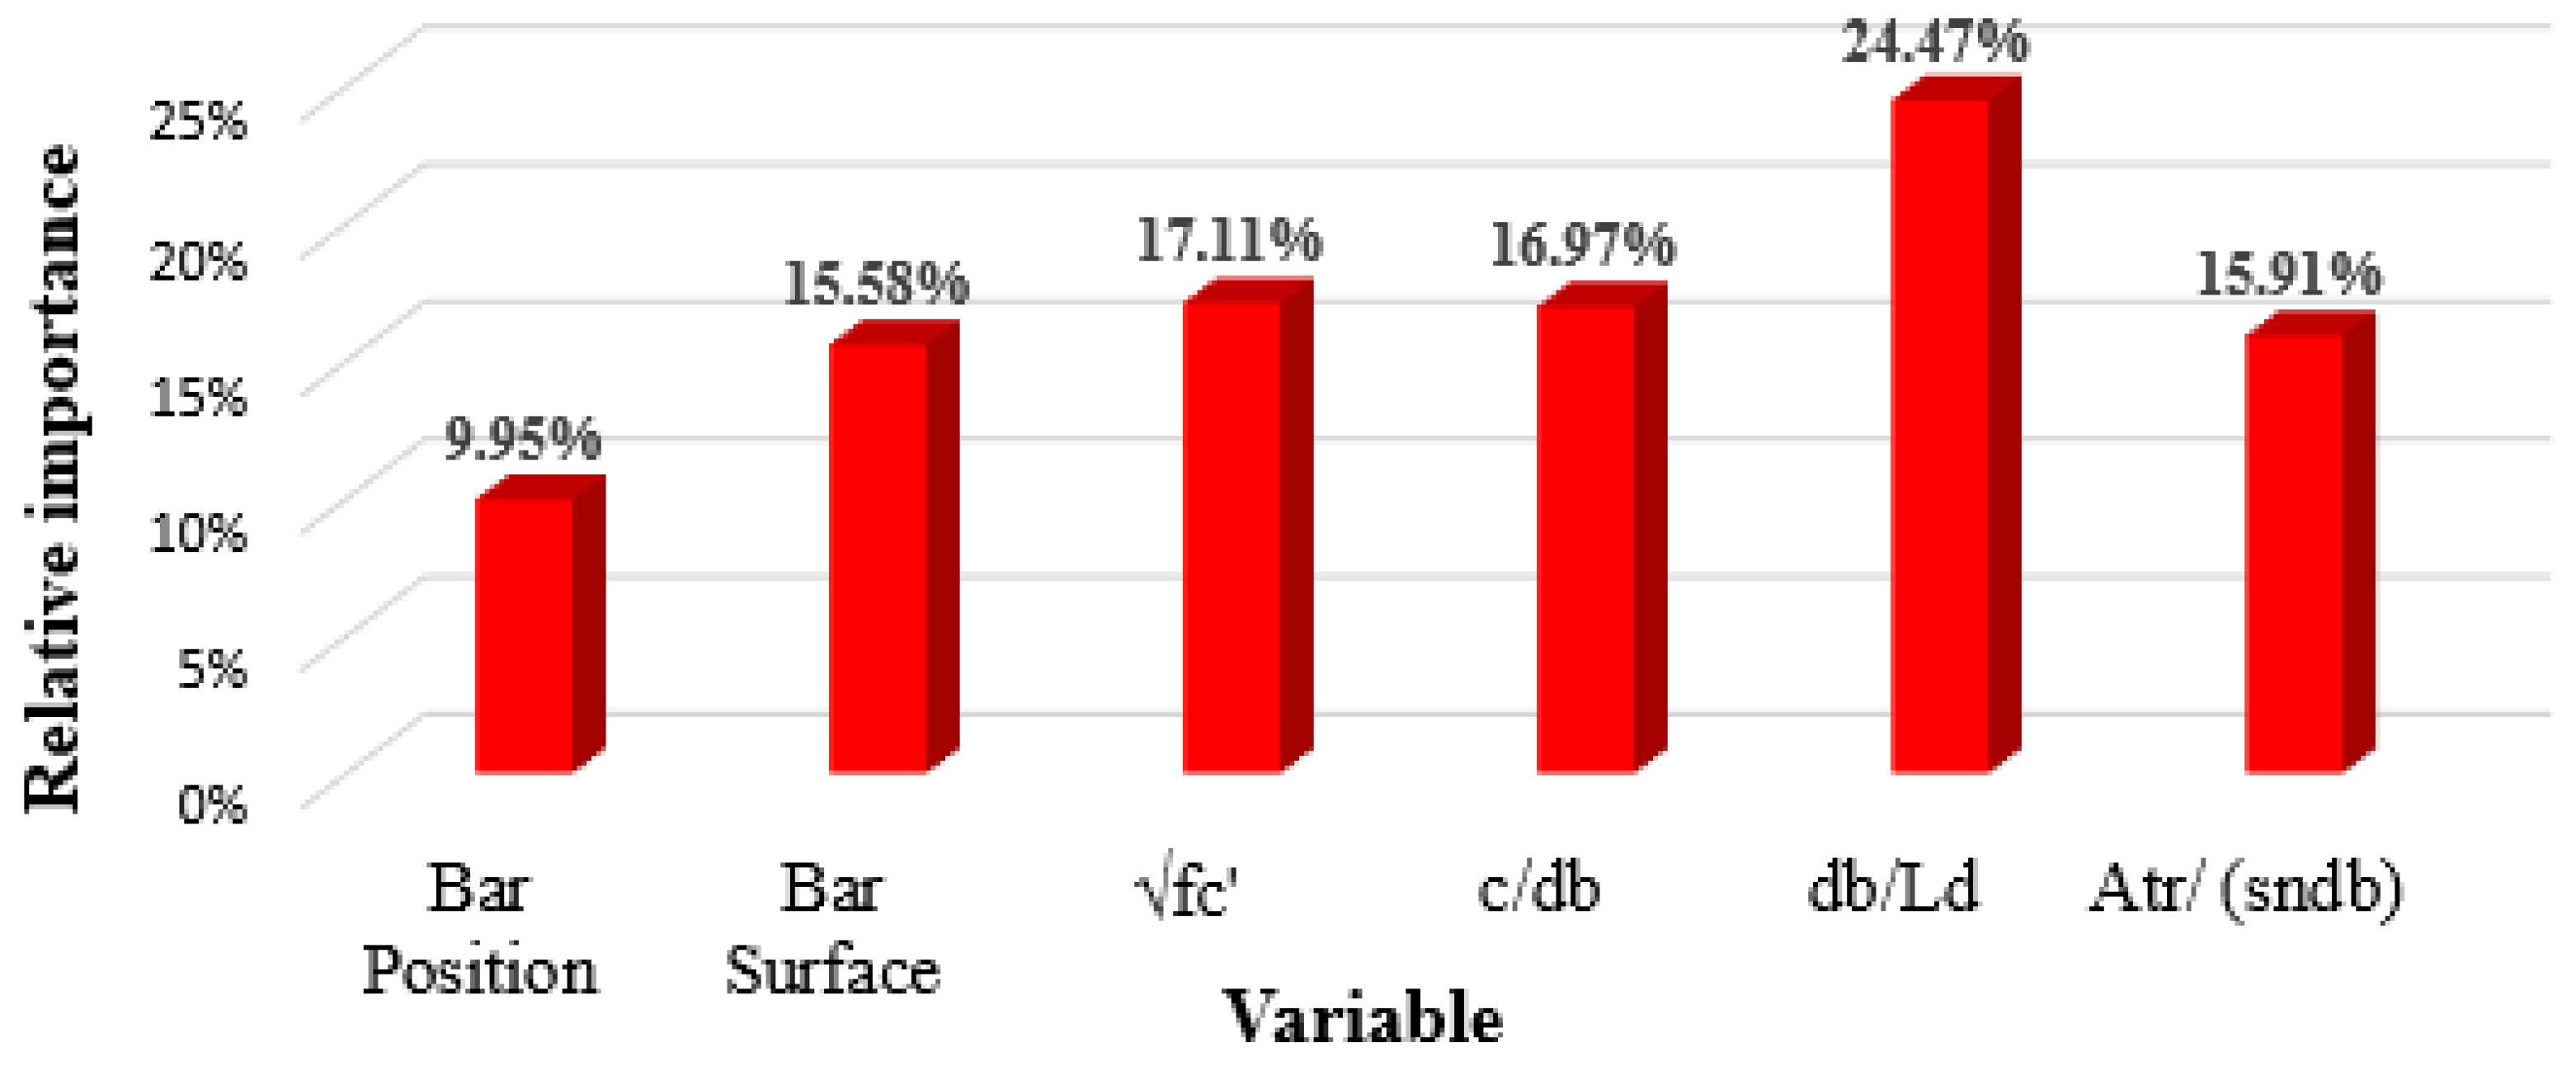
4.1. Sensitivity Analysis of the ANN Model using Garson’s Formula

A parametric or sensitivity analysis is carried out to identify each critical parameter’s unique impact on the bond strength using the relative importance (RI) factor. Garson’s approach [50], which depends on the weights from the input layer to the hidden nodes in the hidden layer to the output layer, is utilized for this purpose. These variables are then used to calculate the proportion of the output prediction related to each input variable. When there is only one layer of hidden units, the equation is as follows:
R I x = y = 1 m W x y W y z y = 1 m W x y W y z
where Wxy is the weight between the input neuron and the hidden unit, Wyz is the weight between the hidden unit and the output neuron, m is the total number of hidden neural nodes, and z is the output neuron. It is important to note that this technique calculates variable contributions using the absolute values of the final connection weights.
It is clear from Figure 19 and Table 5 that the key factors, such as concrete compressive strength and diameter-to-embedment length ratio, significantly impact the bond strength. In contrast, other parameters, such as the bar position and surface texture, have a lower importance index, which is consistent with published literature equations [1,38,39,42].

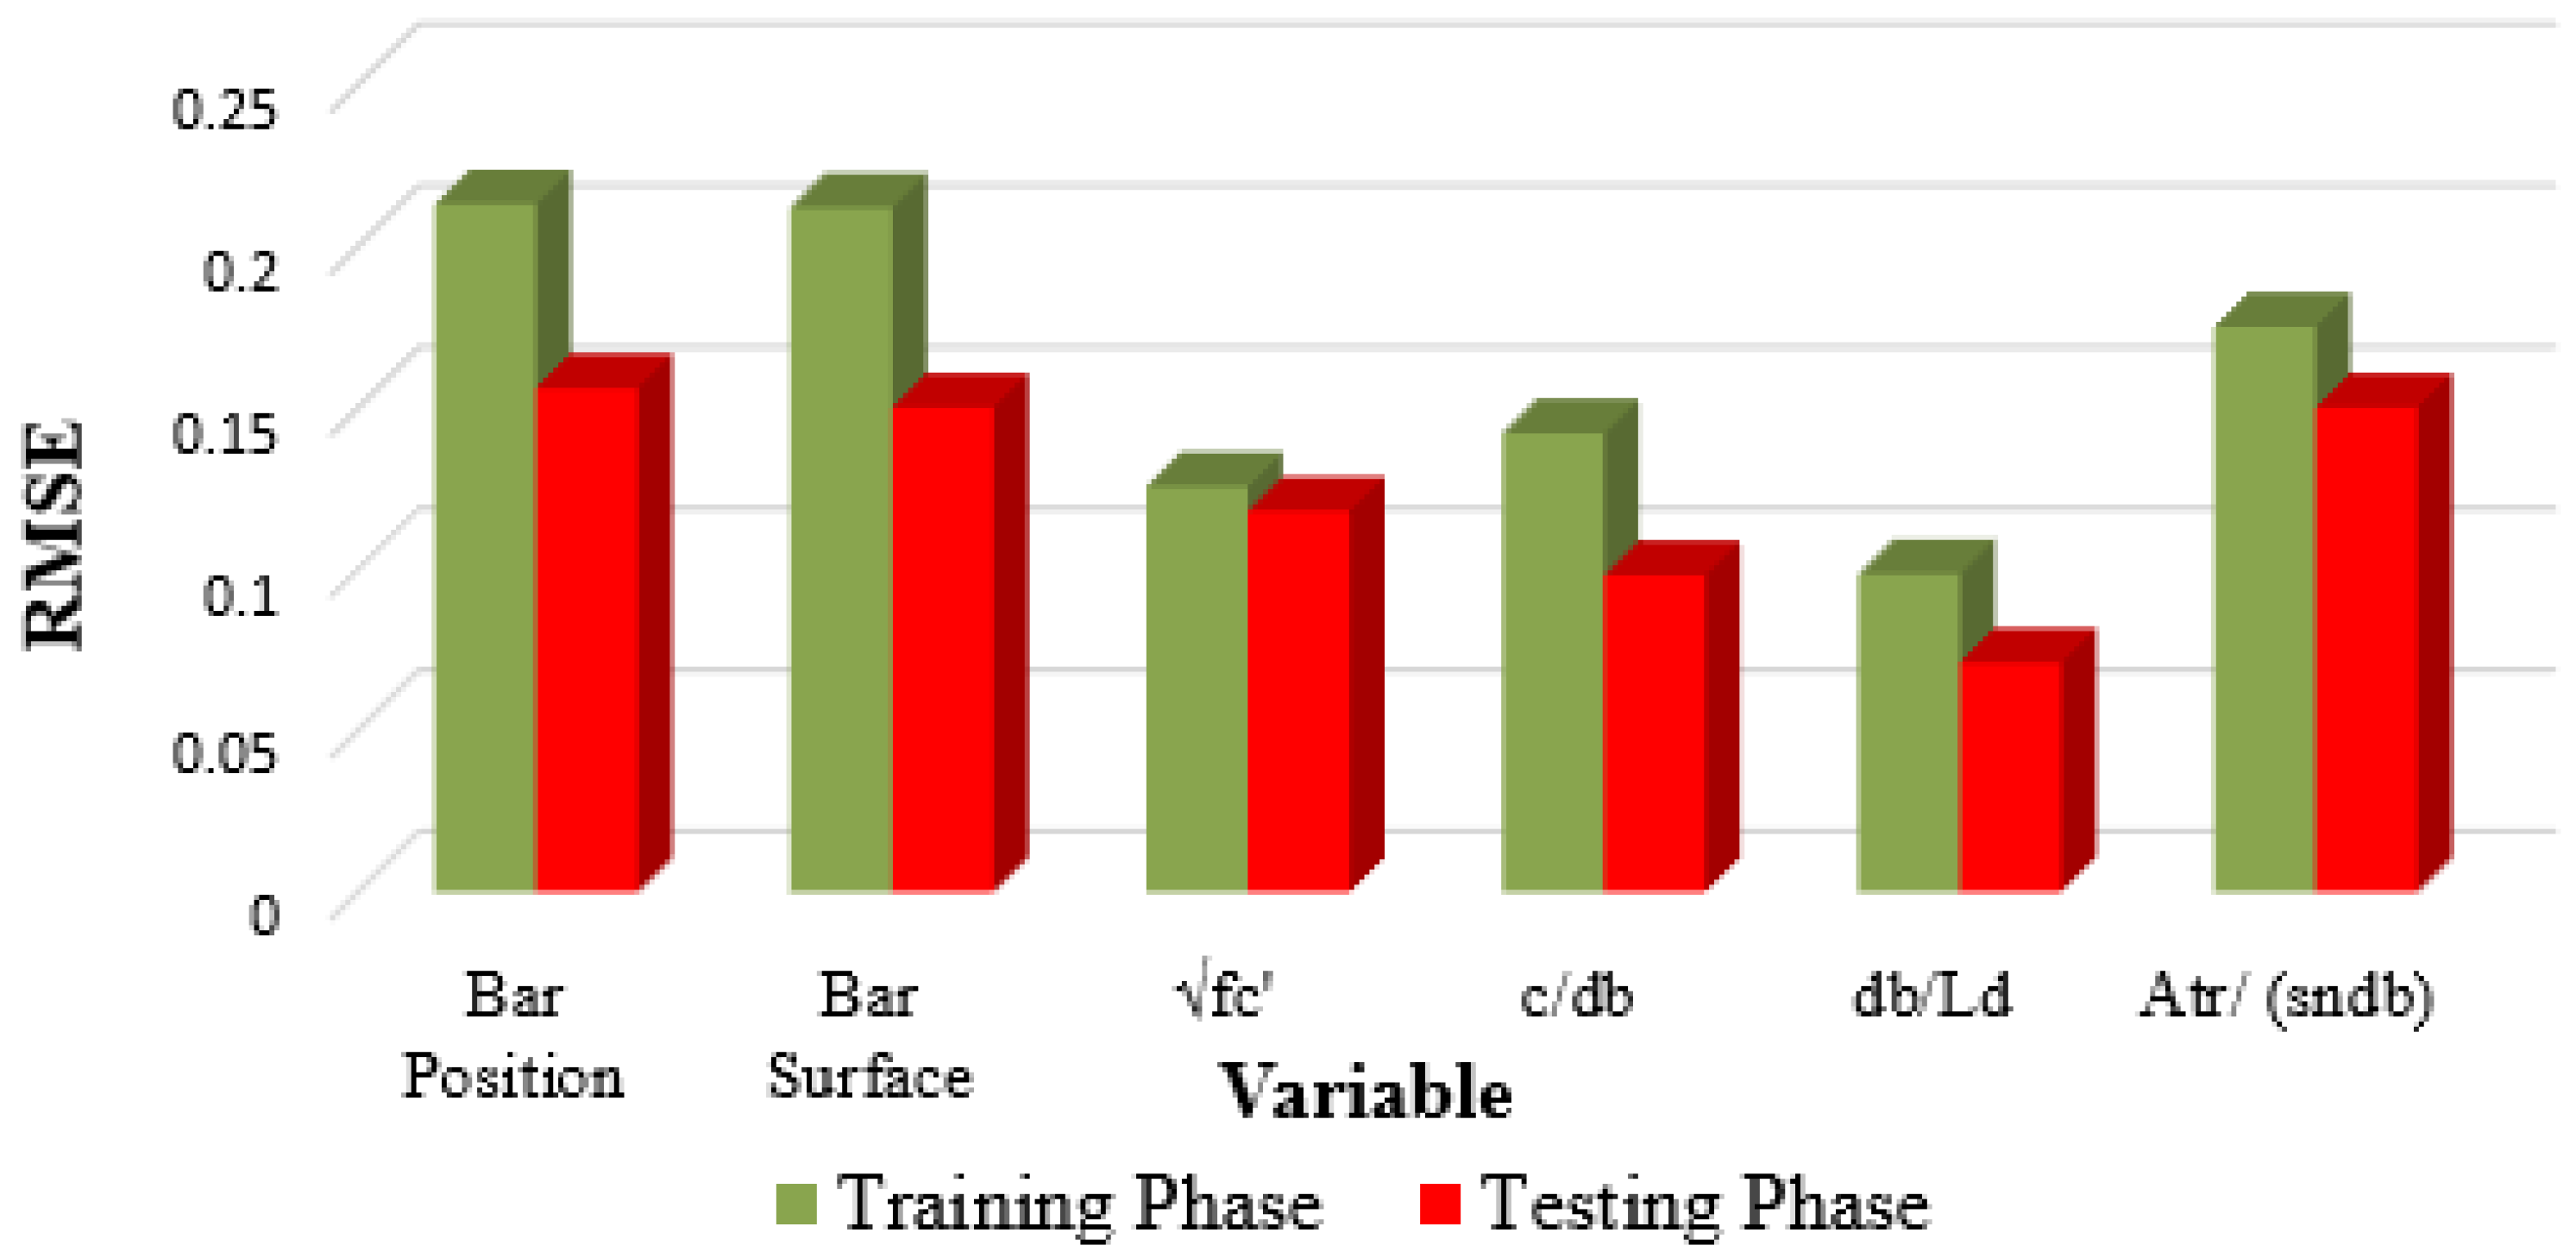
4.2. Sensitivity Analysis of the ANFIS Model

A similar analysis was conducted for the ANFIS model to determine which input parameter significantly impacts the output. The root-mean-square error (RMSE) is used to determine which parameters are most likely to affect the bond strength. The low values of the RMSE indicate that the ANFIS model is more accurate in predicting the output [51]. Therefore, the input parameter with the lowest RMSE influences the output parameter the most, as shown in Figure 20.
Comparing the RMSE values in Table 6 and Table 7 shows that the FRP bar diameter and compressive strength of concrete are the most influential parameters on the bond strength between frp bars and concrete for both the ANN and ANFIS models which is consistent with the sensitivity analysis from previous analytical models [1,38,39,42].

5. Conclusions

This work aims to predict the bond strength between FRP composites and concrete utilizing ANN and ANFIS modeling capabilities. The models considered the various parameters that may control bond behavior while employing 238 experimental data points in the training and testing of the program. The database was collected from bond test results that had accumulated over the past twenty years or so. MATLAB software was used to build, train, and test the network with one target output and six input variables. Then, a comparison was made between the machine learning methods (ANN and ANFIS) and the equations of two different international FRP-reinforced concrete codes, ACI 440.1R-06 [1] and CSA S6-06 [42], as well as previous equations from the literature (Okelo and Yuan [38], Lee et al. [39]). The conclusions of the study are summarized below:
  • Forecasting the bond strength of FRP bars is difficult since it is affected by many variables. The ANN and ANFIS models were shown to be robust computational techniques that can handle large databases, a wide range of essential parameters, and the nonlinearity of variables.
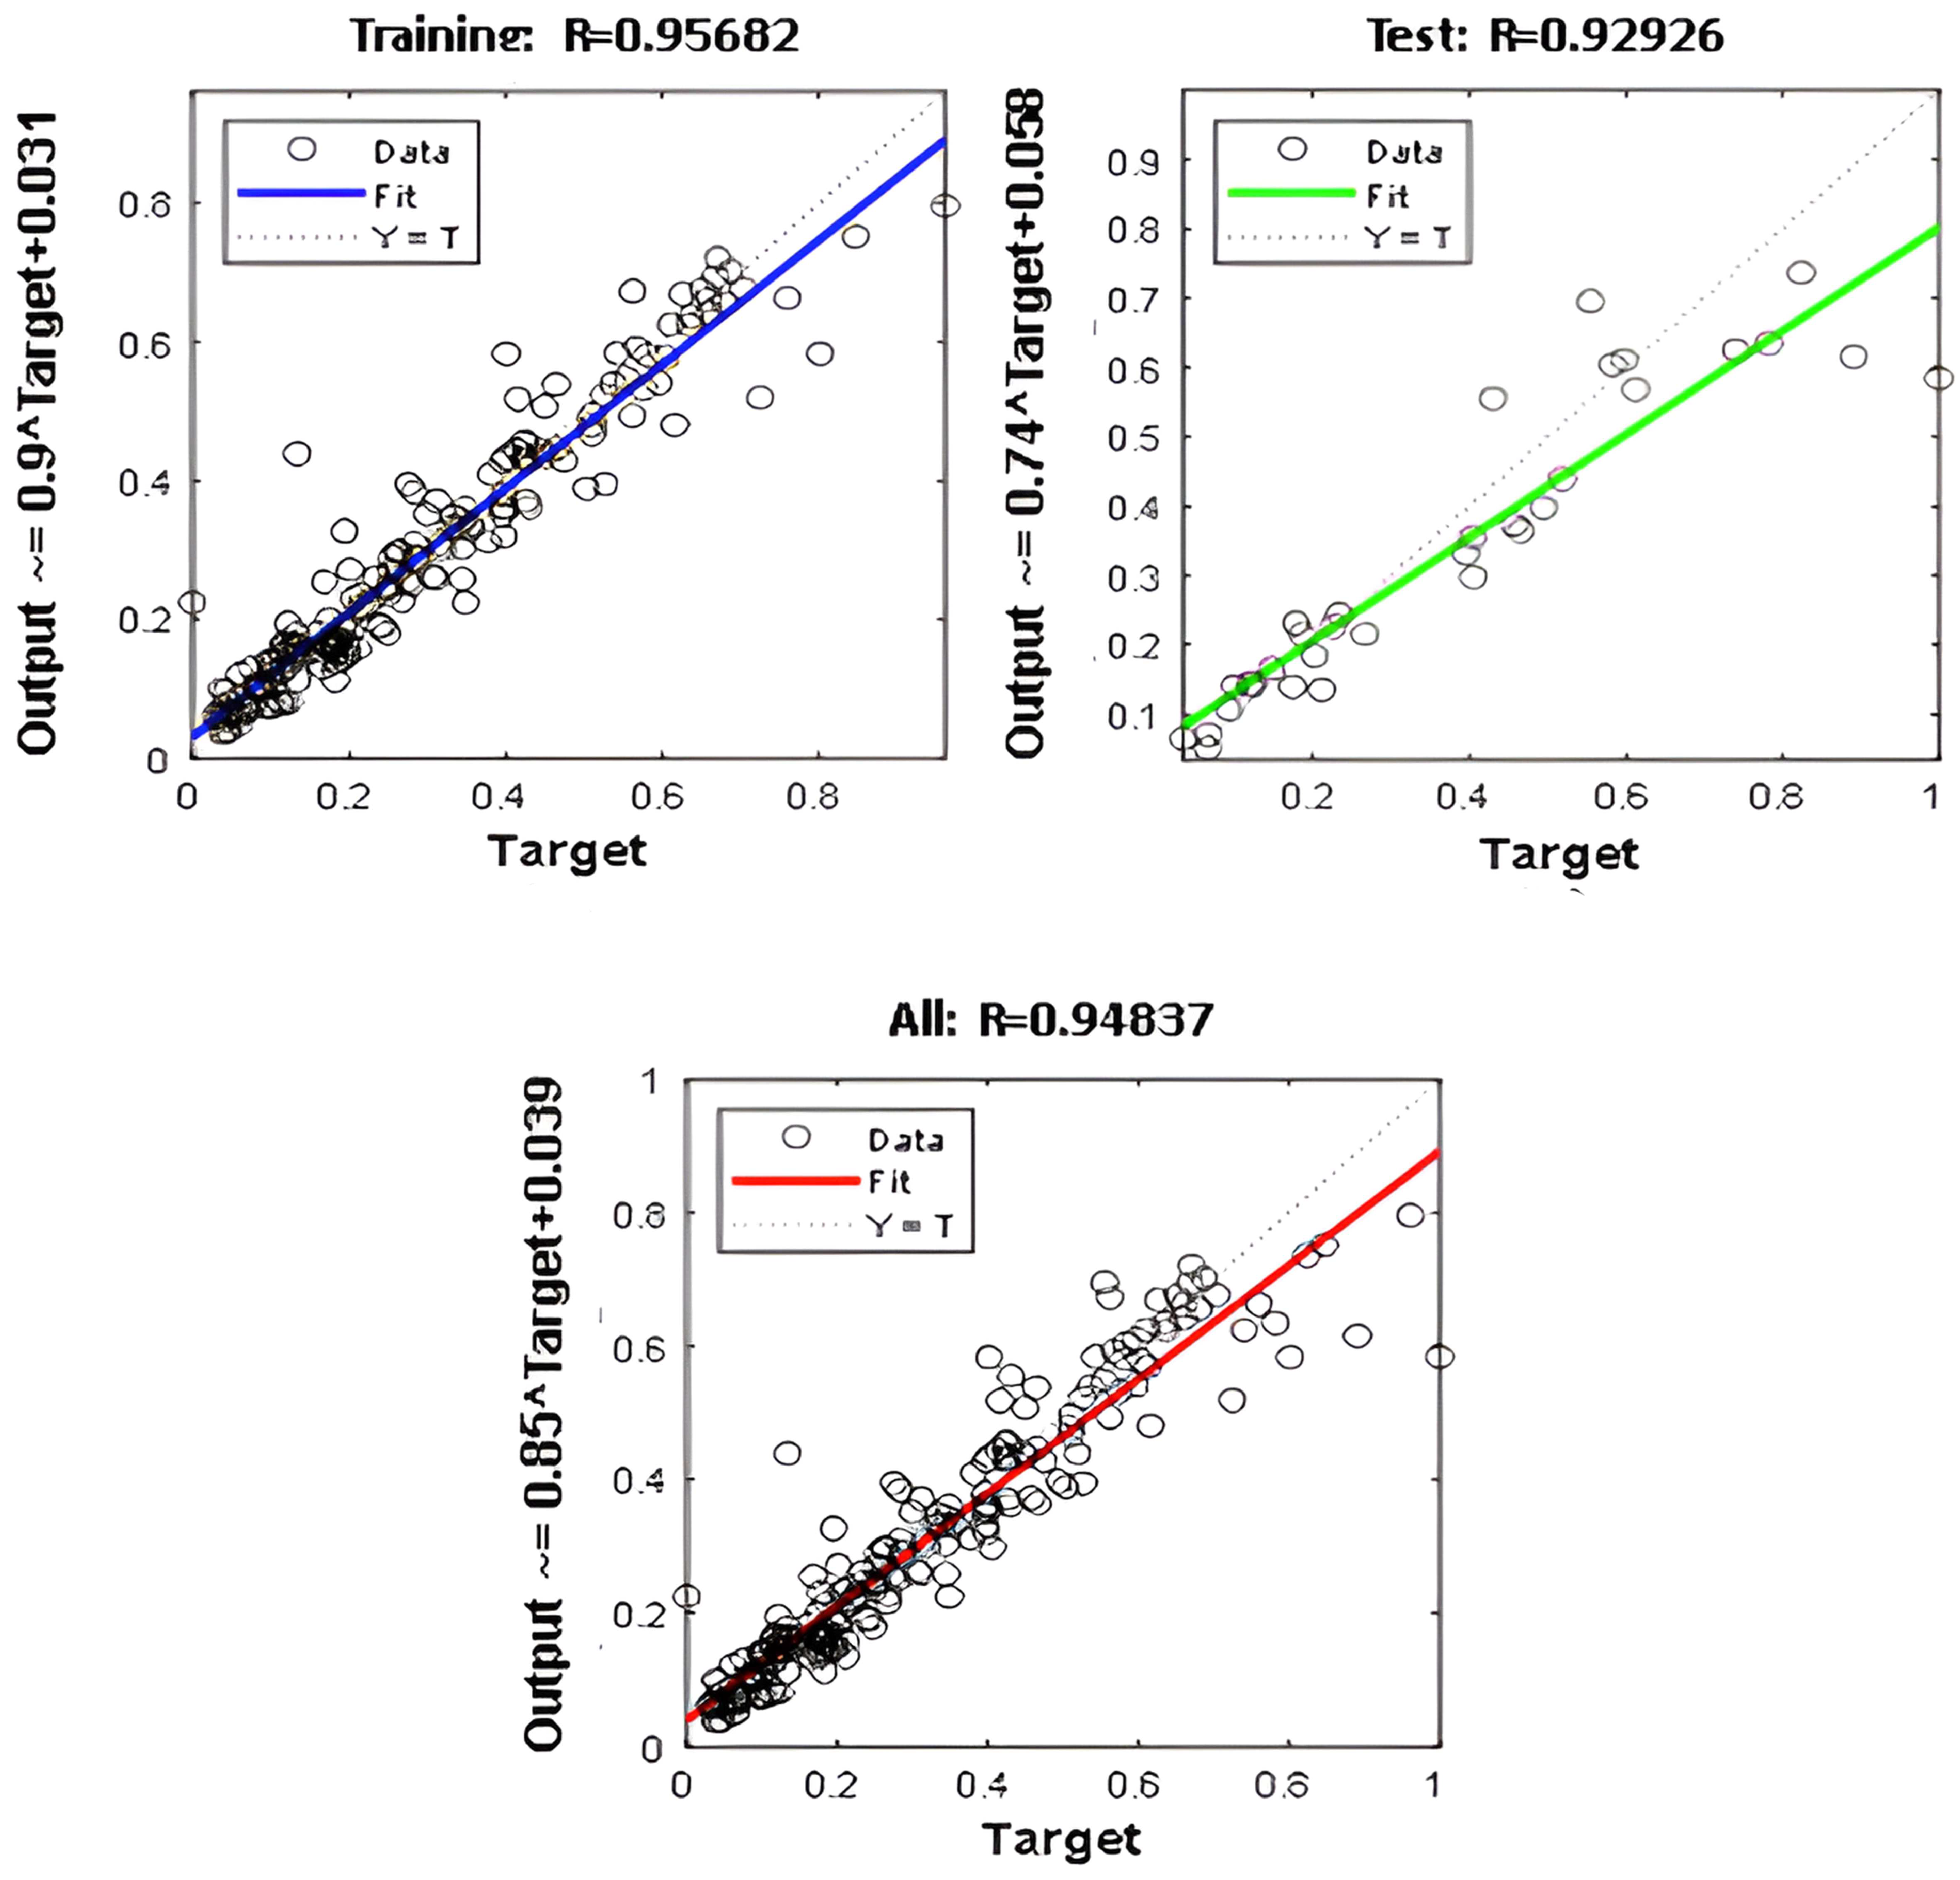
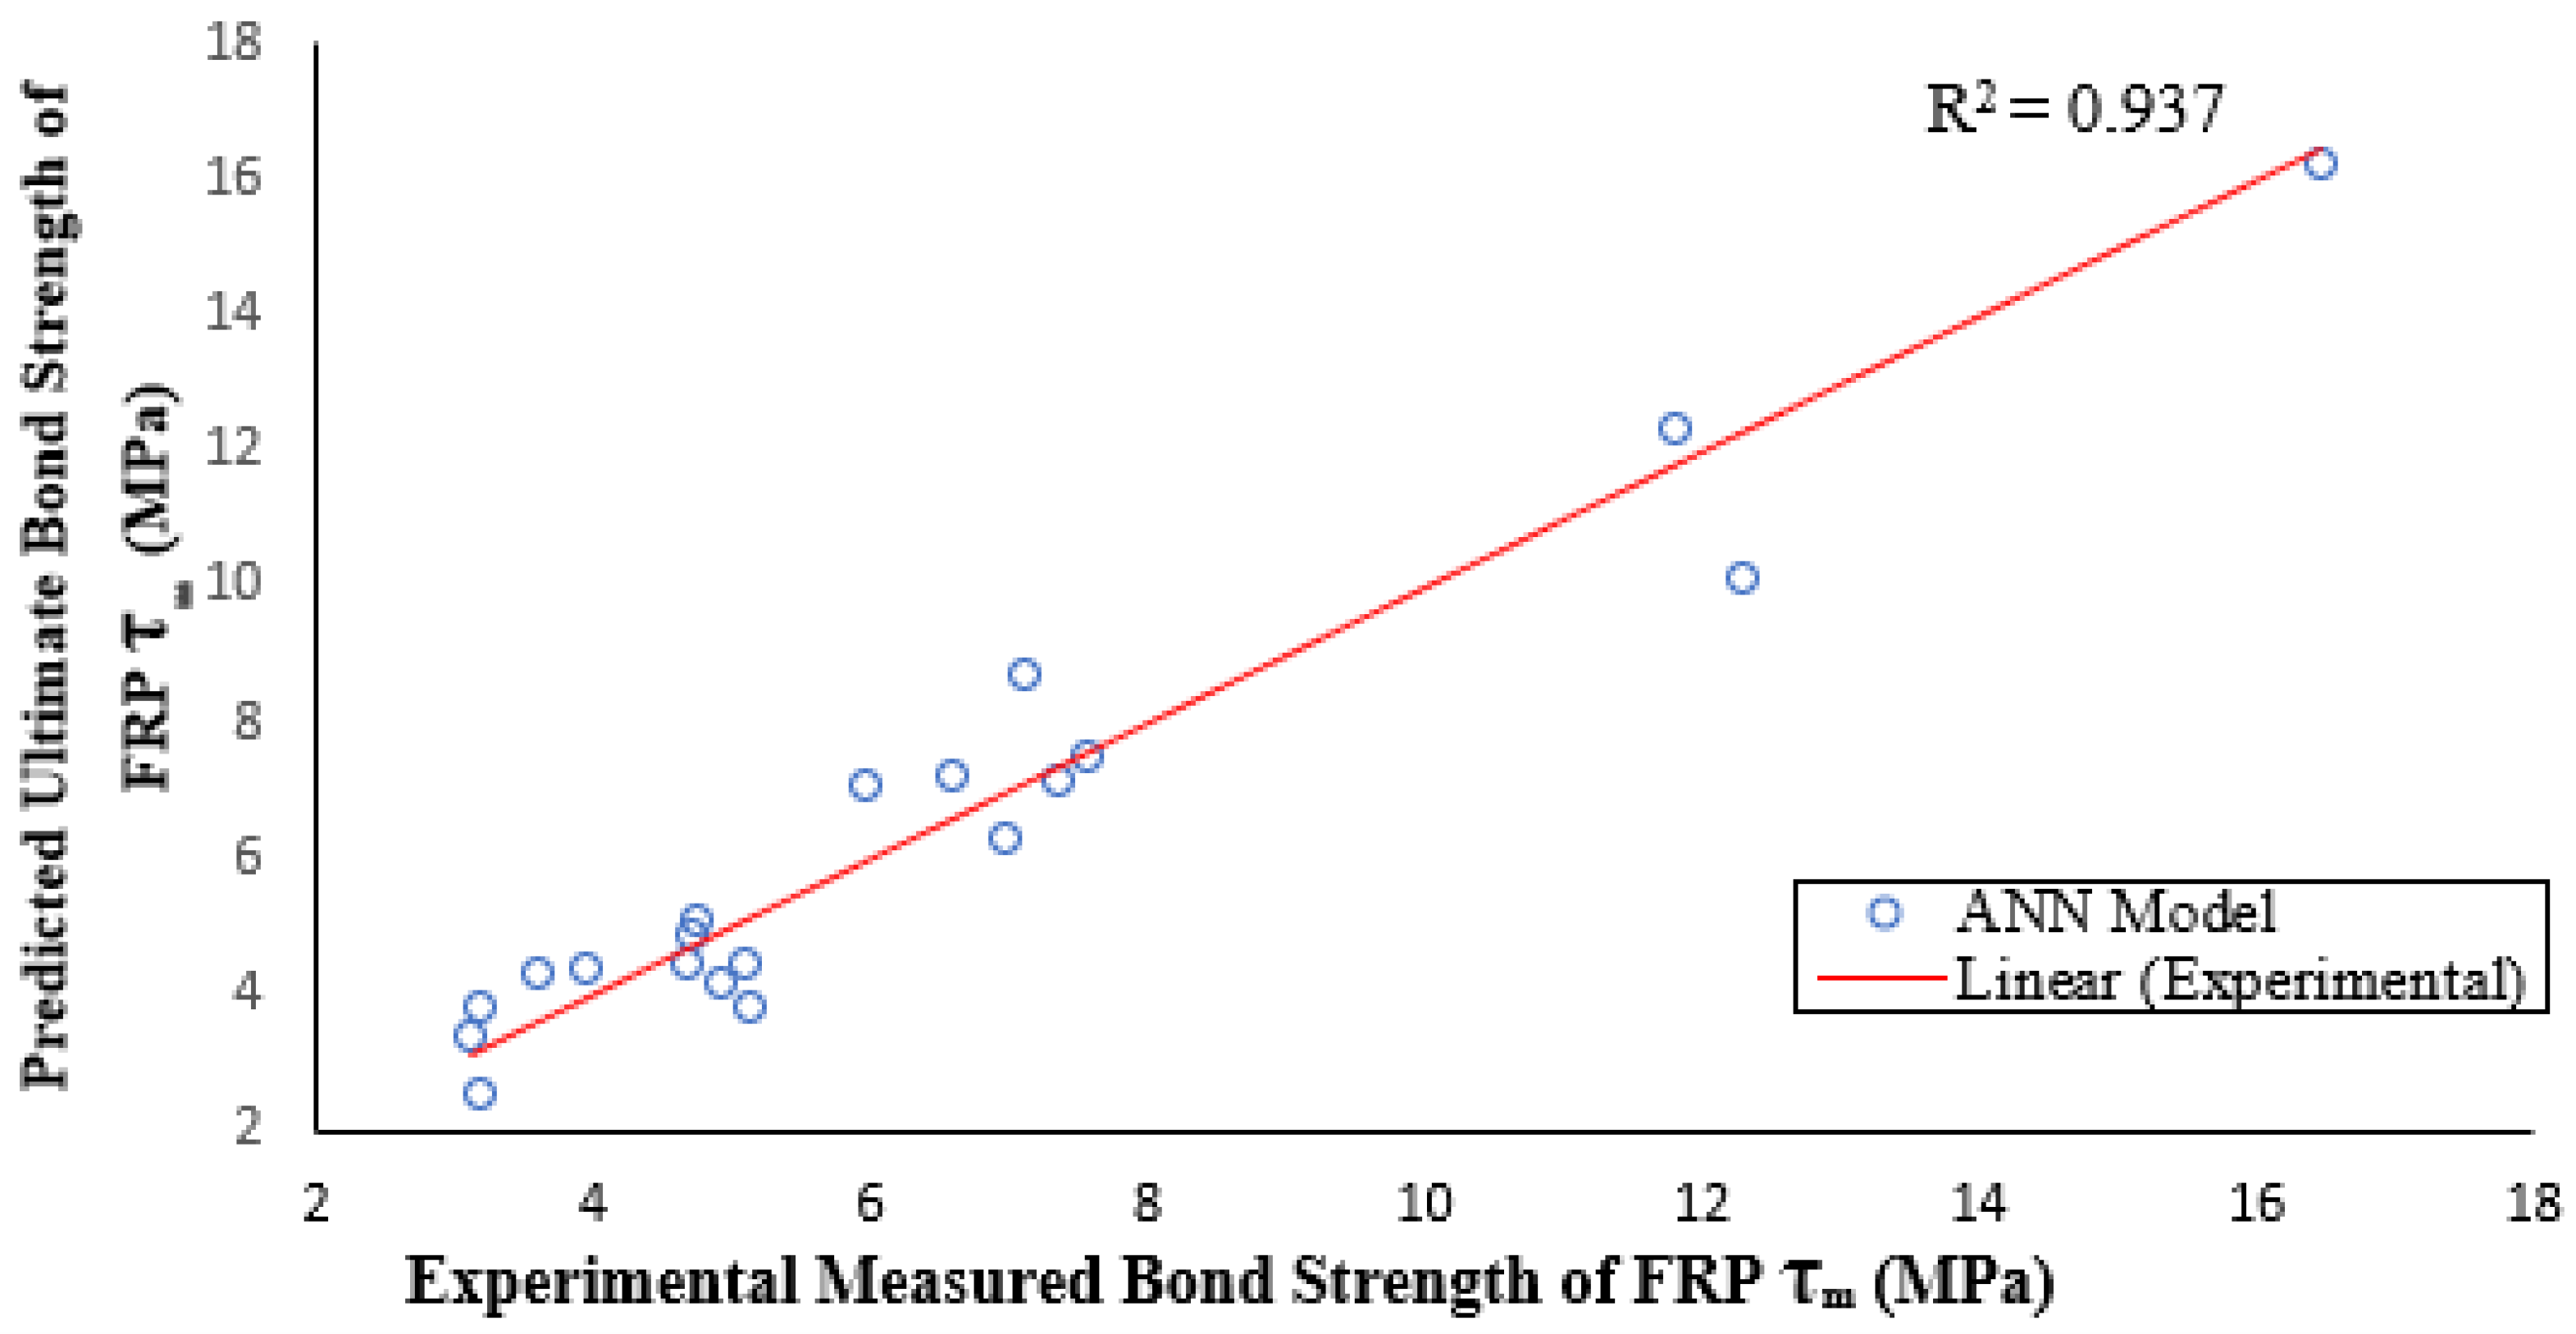
  • The network’s fitting and prediction capabilities were evaluated using training and test data representing approximately 90% and 10% of the total database, respectively. The correlation coefficients (R) were determined to be 0.96 and 0.93 for the two techniques. When both training and testing data were fitted against actual experimental values, the overall correlation was 0.937.
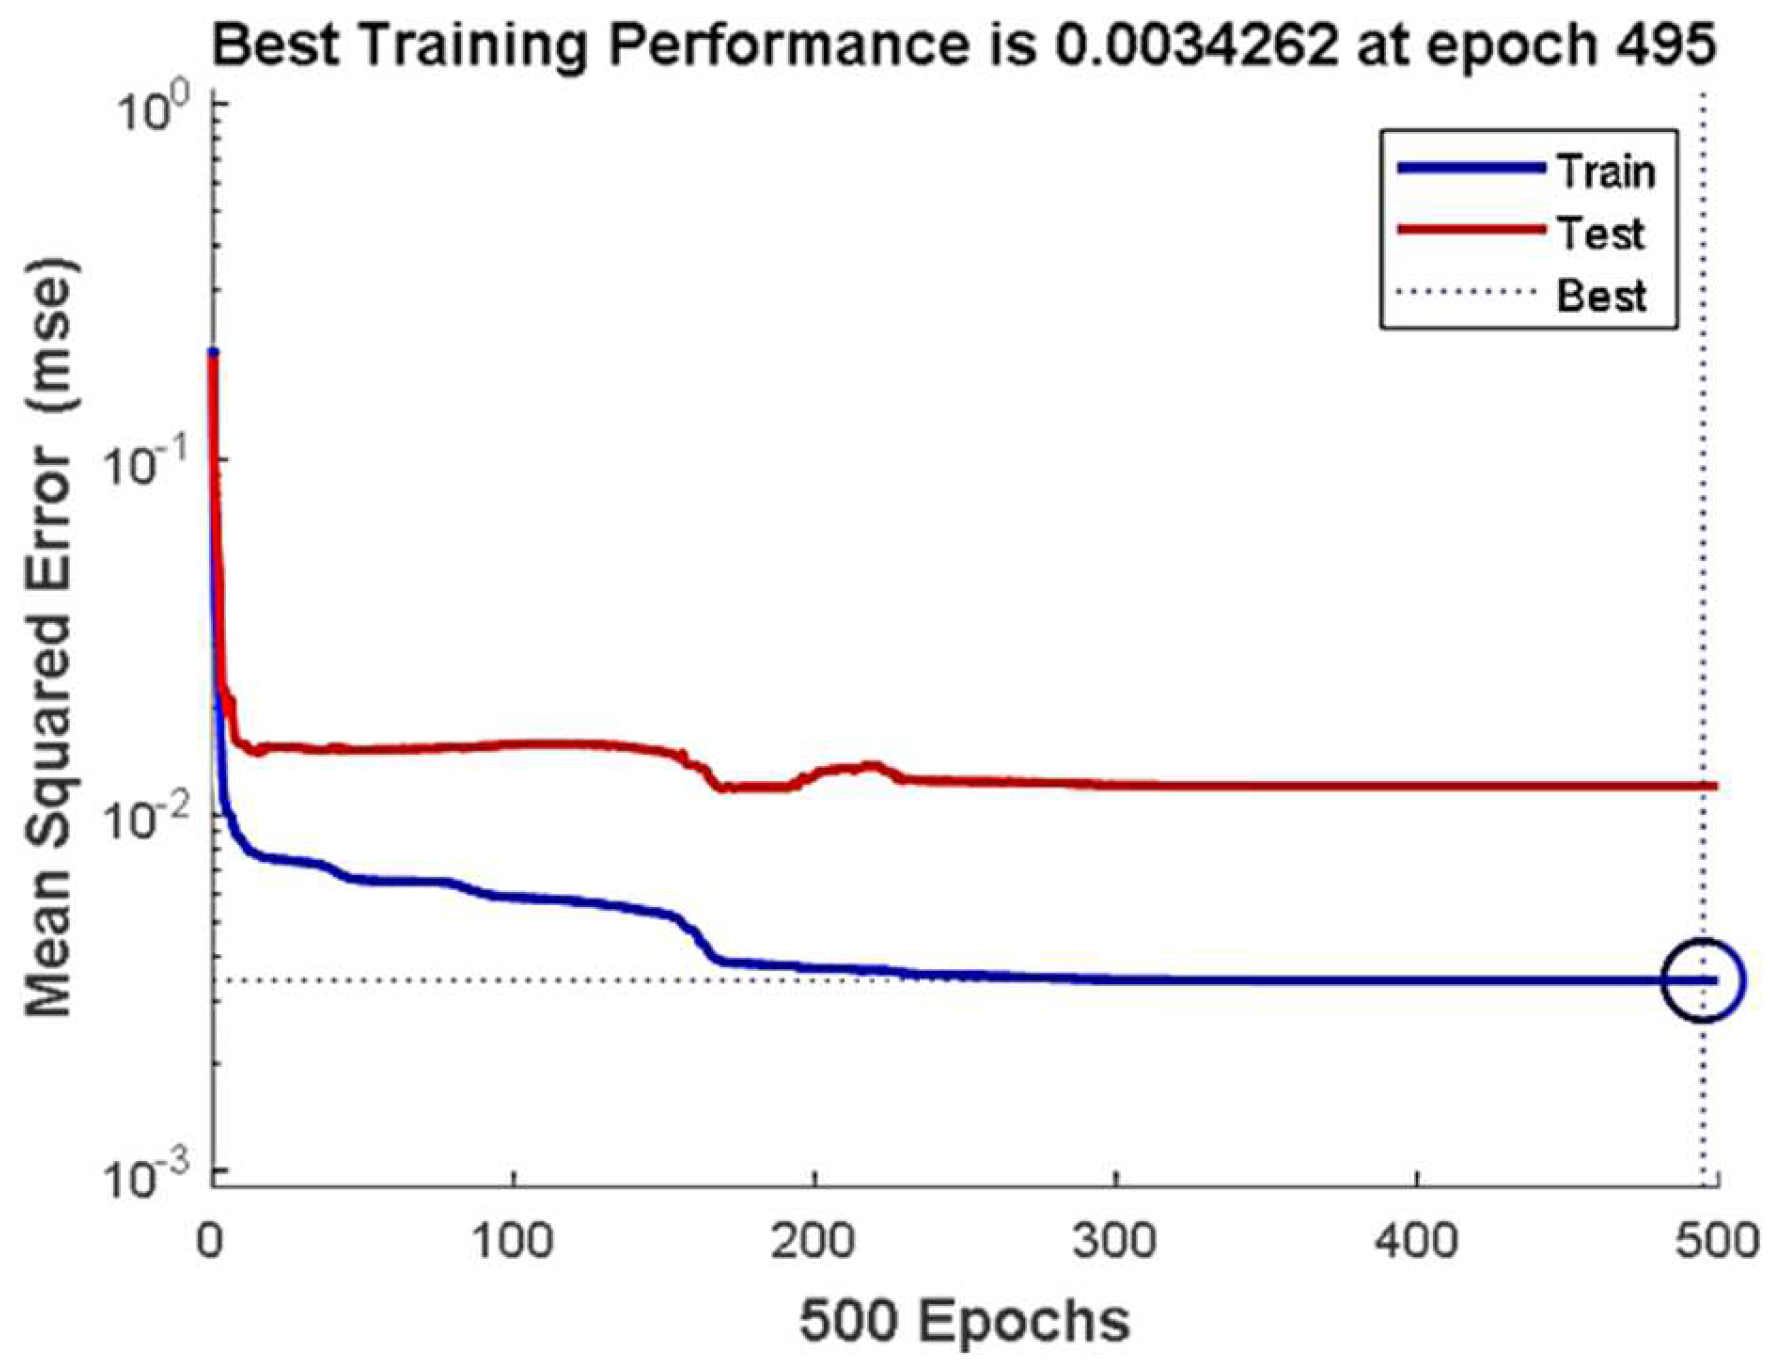
  • Within the first few epochs, the ANN converged rapidly, and the mean square error (MSE) mainly remained flat, determined to be 3.4 × 10⁻³ for training data and 1.2 × 10⁻³ for testing data.
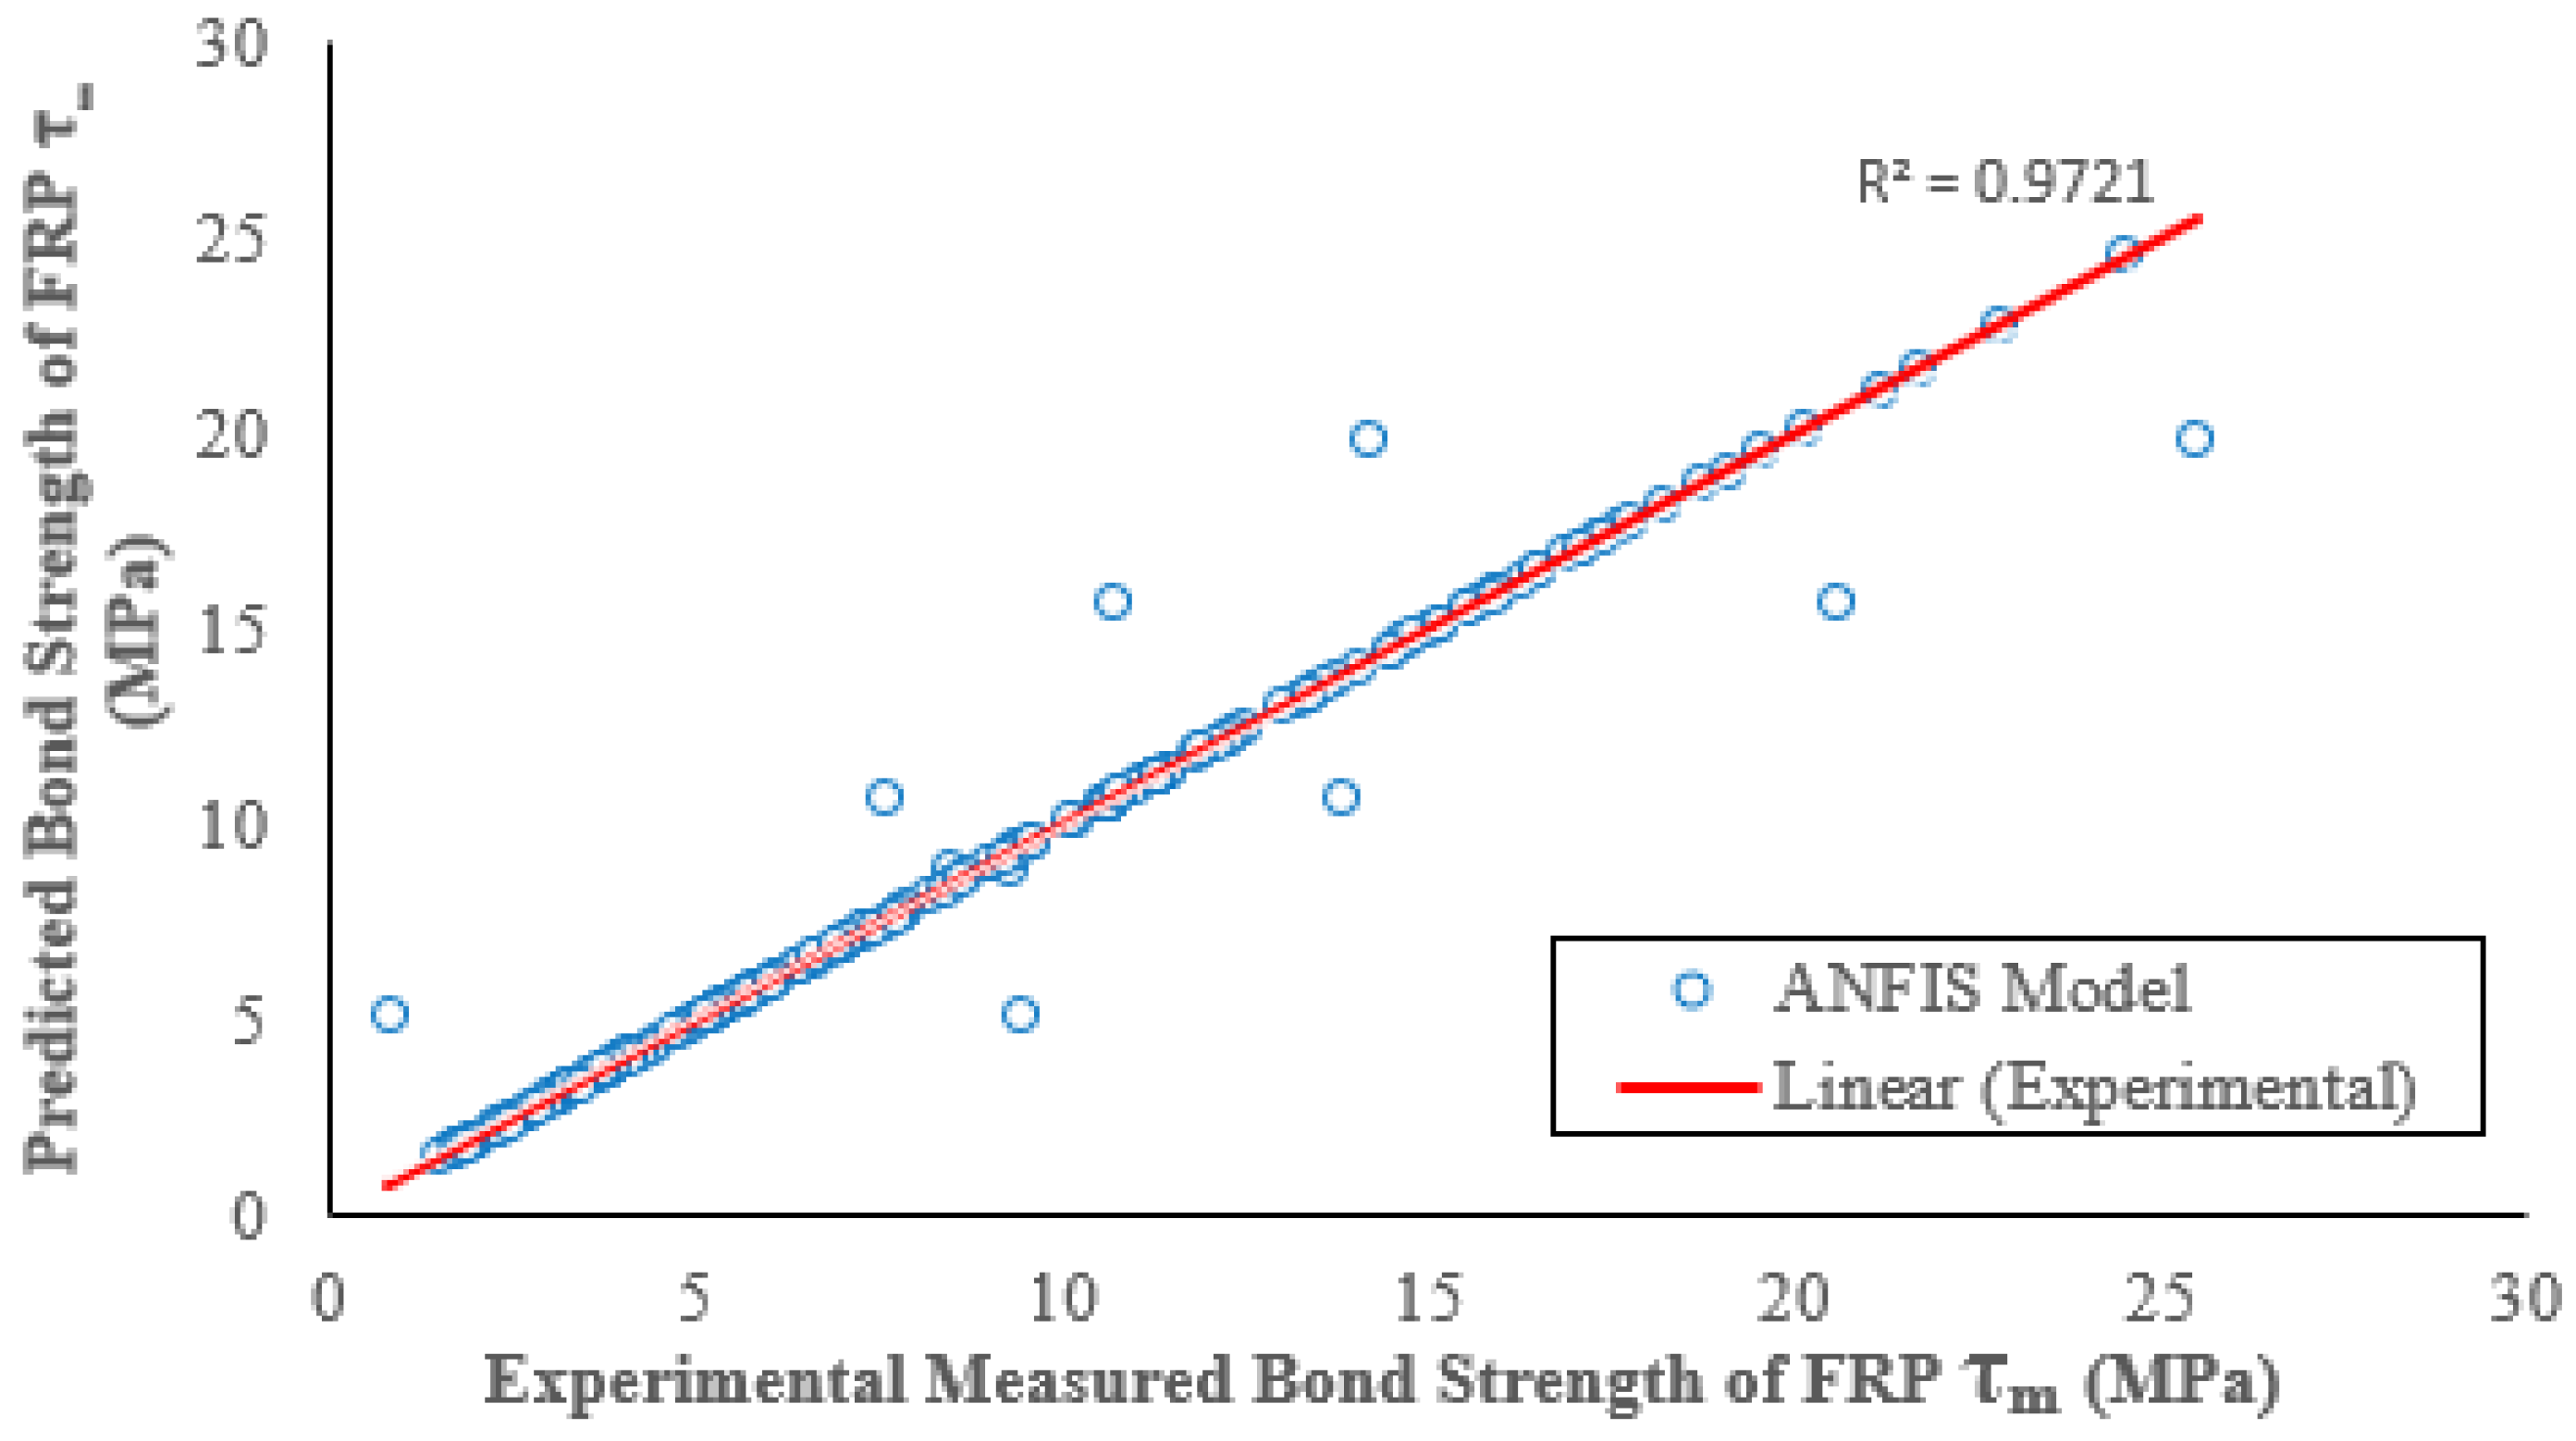
  • Similar to ANN, the ANFIS model was constructed using training data and subsequently validated using testing data. The root mean square error (RMSE) was found to be 0.036 for training data and 0.0615 for testing data, while the correlation factor was determined to be 0.97 and 0.92 for training and testing data, respectively.
  • The sensitivity analysis conducted for the ANN and ANFIS models indicated that the FRP db/Ld and compressive strength of concrete are the most important parameters for evaluating the bond strength of FRP.
  • The ANN and ANFIS models give greater FRP bond strength for the bottom bars than the top bars, matching the recommendations in the standards and observations in previous studies.
  • The results demonstrate that FRP bond strength diminishes as embedment length increases.
  • The rate of increase in bond strength reduces as the concrete cover increases. A minimum thickness is always required when using fiber and steel reinforcements in concrete pours.
  • The ANN model discovered that when transverse reinforcement increases, bond strength increases.

Author Contributions

Conceptualization, N.I.S. and W.S.B.; methodology, W.S.B. and A.A.K.; software, N.I.S. and A.A.K.; validation, N.I.S. and A.A.K.; formal analysis, All Authors; writing first draft—A.A.K.; writing—review and editing, All Authors; supervision, W.S.B. and N.I.S. All authors have read and agreed to the published version of the manuscript.

Funding

This research received no external funding.

Data Availability Statement

The data presented in this study are available on request from the corresponding author.

Conflicts of Interest

The authors declare no conflict of interest.

References

  1. Committee, A.C.I. Guide for the Design and Construction of Structural Concrete Reinforced with FRP Bars: ACI 440.1R-06; American Concrete Institute: Farmington Hills, MI, USA, 2015. [Google Scholar]
  2. Shbeeb, N.I.; Al-Rousan, R.; Issa, M.A.; Al-Salman, H. Impact of bonded carbon fibre composite on the shear strength of reinforced concrete beams. Proc. Inst. Civ. Eng. Struct. Build. 2018, 171, 364–379. [Google Scholar] [CrossRef]
  3. Obaidat, Y.T.; Ashteyat, A.M.; Obaidat, A.T. Performance of RC beam strengthened with NSM-CFRP strip under pure torsion: Experimental and numerical study. Int. J. Civ. Eng. 2020, 18, 585–593. [Google Scholar] [CrossRef]
  4. Barham, W.S.; Obaidat, Y.T.; Al-Maabreh, A.I. Effect of aggregate size on the bond behavior between carbon fiber–Reinforced polymer sheets and concrete. J. Mater. Civ. Eng. 2019, 31, 04019295. [Google Scholar] [CrossRef]
  5. Faza, S.S.; GangaRao, H.V. Bending and bond behavior of concrete beams reinforced with plastic rebars. In Transportation Research Record; West Virginia University: Morgantown, WV, USA, 1991. [Google Scholar]
  6. Cosenza, E.; Manfredi, G.; Realfonzo, R. Behavior and modeling of bond of FRP rebars to concrete. J. Compos. Constr. 1997, 1, 40–51. [Google Scholar] [CrossRef]
  7. Quayyum, S. Bond Behaviour of Fibre Reinforced Polymer (FRP) Rebars in Concrete; University of British Columbia: Kelowna, BC, Canada, 2010. [Google Scholar]
  8. Tepfers, R.; Hedlund, G.; Rosinski, B. Pull-out and tensile reinforcement splice tests with GFRP bars. In Proceedings of the Second International Conference on Composites in Infrastructure National Science Foundation, Tucson, AZ, USA, 5–7 January 1998. [Google Scholar]
  9. Robert, M.; Benmokrane, B. Effect of aging on bond of GFRP bars embedded in concrete. Cem. Concr. Compos. 2010, 32, 461–467. [Google Scholar] [CrossRef]
  10. Hao, Q.; Wang, Y.; He, Z.; Ou, J. Bond strength of glass fiber reinforced polymer ribbed rebars in normal strength concrete. Constr. Build. Mater. 2009, 23, 865–871. [Google Scholar] [CrossRef]
  11. Taly, N.; GangaRao, H. Bond behavior of FRP reinforcing bars- the-state-of-the-art. In Proceedings of the SAMPE 2001, Long Beach, CA, USA, 6–10 May 2001; pp. 1784–1796. [Google Scholar]
  12. Tighiouart, B.; Benmokrane, B.; Gao, D. Investigation of bond in concrete member with fibre reinforced polymer (FRP) bars. Constr. Build. Mater. 1998, 12, 453–462. [Google Scholar] [CrossRef]
  13. Daniali, S. Development length for fiber-reinforced plastic bars. In Proceedings of Advanced Composite Materials in Bridges and Structures; Canadian Society for Civil Engineering: Sherbrooke, QC, Canada, 1992. [Google Scholar]
  14. Larralde, J.; Silva-Rodriguez, R. Bond and slip of FRP rebars in concrete. J. Mater. Civ. Eng. 1993, 5, 30–40. [Google Scholar] [CrossRef]
  15. Yun, Y.; Hao, Z. Experimental study on bonding property between FRP and concrete. In Proceedings of the 5th International Conference on Advanced Design and Manufacturing Engineering (ICADME), Shenzhen, China, 19–20 September 2015. [Google Scholar]
  16. Yang, S.; Xu, X. Discussion on bonding performance between FRP bars and concrete. In IOP Conference Series: Earth and Environmental Science; IOP Publishing: Ireland, UK, 2018. [Google Scholar]
  17. Haykin, S. Neural Networks and Learning Machines, 3rd ed.; Pearson Education India: New Delhi, India, 2009. [Google Scholar]
  18. Jang, J.-S. ANFIS: Adaptive-network-based fuzzy inference system. IEEE Trans. Syst. Man Cybern. 1993, 23, 665–685. [Google Scholar] [CrossRef]
  19. Adeli, H.; Park, H.S. A neural dynamics model for structural optimization—Theory. Comput. Struct. 1995, 57, 383–390. [Google Scholar] [CrossRef]
  20. Mukherjee, A.; Deshpande, J.M. Modeling initial design process using artificial neural networks. J. Comput. Civ. Eng. 1995, 9, 194–200. [Google Scholar] [CrossRef]
  21. Jia, J.; Davalos, J.F. An artificial neural network for the fatigue study of bonded FRP–wood interfaces. Compos. Struct. 2006, 74, 106–114. [Google Scholar] [CrossRef]
  22. Nikoo, M.; Torabian Moghadam, F.; Sadowski, Ł. Prediction of concrete compressive strength by evolutionary artificial neural networks. Adv. Mater. Sci. Eng. 2015, 2015, 849126. [Google Scholar] [CrossRef]
  23. Alshihri, M.M.; Azmy, A.M.; El-Bisy, M.S. Neural networks for predicting compressive strength of structural light weight concrete. Constr. Build. Mater. 2009, 23, 2214–2219. [Google Scholar] [CrossRef]
  24. Barham, W.S.; Rabab’ah, S.R.; Aldeeky, H.H.; Al Hattamleh, O.H. Mechanical and physical based artificial neural network models for the prediction of the unconfined compressive strength of rock. Geotech. Geol. Eng. 2020, 38, 4779–4792. [Google Scholar] [CrossRef]
  25. Haj-Ali, R.; Kim, H.-K. Nonlinear constitutive models for FRP composites using artificial neural networks. Mech. Mater. 2007, 39, 1035–1042. [Google Scholar] [CrossRef]
  26. Golafshani, E.; Rahai, A.; Sebt, M. Artificial neural network and genetic programming for predicting the bond strength of GFRP bars in concrete. Mater. Struct. 2015, 48, 1581–1602. [Google Scholar] [CrossRef]
  27. Mansouri, I.; Kisi, O. Prediction of debonding strength for masonry elements retrofitted with FRP composites using neuro fuzzy and neural network approaches. Compos. Part B Eng. 2015, 70, 247–255. [Google Scholar] [CrossRef]
  28. Concha, N.C. Neural network model for bond strength of FRP bars in concrete. Structures 2022, 41, 306–317. [Google Scholar] [CrossRef]
  29. Haddad, R.; Haddad, M. Predicting fiber-reinforced polymer–concrete bond strength using artificial neural networks: A comparative analysis study. Struct. Concr. 2020, 22, 38–49. [Google Scholar] [CrossRef]
  30. Salmi, A. Prediction of the Bond Strength of Externally Bonded FRP Sheets Applied to Concrete via Grooves Technique Using Artificial Neural Networks. Compos. Sci. 2024, 8, 30. [Google Scholar] [CrossRef]
  31. Cascardi, A.; Micelli, F. ANN-Based Model for the Prediction of the Bond Strength between FRP and Concrete. Fibers 2021, 9, 46. [Google Scholar] [CrossRef]
  32. Zhou, Y.; Zheng, S.; Huang, Z.; Sui, L.; Chen, Y. Explicit neural network model for predicting FRP-concrete interfacial bond strength based on a large database. Compos. Struct. 2020, 240, 111998. [Google Scholar] [CrossRef]
  33. Pei, Z.; Wei, Y. Prediction of the bond strength of FRP-to-concrete under direct tension by ACO-based ANFIS approach. Compos. Struct. 2022, 282, 115070. [Google Scholar] [CrossRef]
  34. Sadrmomtazi, A.; Sobhani, J.; Mirgozar, M. Modeling compressive strength of EPS lightweight concrete using regression, neural network and ANFIS. Constr. Build. Mater. 2013, 42, 205–216. [Google Scholar] [CrossRef]
  35. Kumar, A.; Arora, H.C.; Kumar, K.; Garg, H.; Jahangir, H. Development of Efficient Prediction Model of FRP-to-Concrete Bond Strength Using Curve Fitting and ANFIS Methods. Arab. J. Sci. Eng. 2023, 1–30. [Google Scholar] [CrossRef]
  36. Naderpour, H.; Mirrashid, M. Shear Strength Prediction of RC Beams Using Adaptive Neuro-Fuzzy Inference System. Sci. Iran. 2020, 27, 657–670. [Google Scholar] [CrossRef]
  37. Nguyen, T.A.; Lý, H.B. Estimation of the bond strength between FRP and concrete using ANFIS and hybridized ANFIS machine learning models. J. Sci. Transp. Technol. 2021, 36–47. [Google Scholar] [CrossRef]
  38. Okelo, R.; Yuan, R.L. Bond Strength of Fiber Reinforced Polymer Rebars in Normal Strength Concrete. J. Compos. Constr. 2005, 9, 203–213. [Google Scholar] [CrossRef]
  39. Lee, J.-Y.; Kim, T.-J.; Yi, C.-K.; Park, J.-S.; You, Y.-C.; Park, Y.-H. Interfacial bond strength of glass fiber reinforced polymer bars in high-strength concrete. Compos. Part B Eng. 2008, 39, 258–270. [Google Scholar] [CrossRef]
  40. Mcculloch, W.S.; Pitts, W.H. A logical calculus of the ideas immanent in nervous activity. Bull. Math. Biophys. 1943, 5, 115–133. [Google Scholar] [CrossRef]
  41. Mathur, N.; Glesk, I.; Buis, A. Comparison of adaptive neuro-fuzzy inference system (ANFIS) and Gaussian processes for machine learning (GPML) algorithms for the prediction of skin temperature in lower limb prostheses. Med Eng. Phys. 2016, 38, 1083–1089. [Google Scholar] [CrossRef]
  42. CAN/CSA-S6-06; Canadian Highway Bridge Design Code. CSA Group: Toronto, ON, Canada, 2006.
  43. Quayyum, S.; Rteil, A. Bond Strength of FRP Rebar to Concrete: Effect of Concrete Confinement. In Advances in FRP Composites in Civil Engineering; Springer: Berlin/Heidelberg, Germany, 2011; pp. 581–584. [Google Scholar]
  44. Baena, M.; Torres, L.; Turon, A.; Barris, C. Experimental study of bond behaviour between concrete and FRP bars using a pull-out test. Compos. Part B Eng. 2009, 40, 784–797. [Google Scholar] [CrossRef]
  45. Shield, C.K.; French, C.W.; Hanus, J.P. Bond of glass fiber reinforced plastic reinforcing bar for consideration in bridge decks. Spec. Publ. 1999, 188, 393–406. [Google Scholar]
  46. Aly, R.S.M. Experimental and Analytical Studies on Bond Behaviour of Tensile Lap Spliced FRP Reinforcing Bars in Concrete; eLibrary: Moscow, Russia, 2005. [Google Scholar]
  47. Achillides, Z.; Pilakoutas, K. Bond Behavior of Fiber Reinforced Polymer Bars under Direct Pullout Conditions. J. Compos. Constr. 2004, 8, 173–181. [Google Scholar] [CrossRef]
  48. Wambeke, B.W.; Shield, C.K. Development length of glass fiber-reinforced polymer bars in concrete. ACI Mater. J. 2006, 103, 11. [Google Scholar]
  49. Hassan, M.; Deifalla, A. Evaluating the new CAN/CSA-S806-12 torsion provisions for concrete beams with FRP reinforcements. Mater. Struct. 2016, 49, 2715–2729. [Google Scholar] [CrossRef]
  50. Garson, D.G. Interpreting neural network connection weights. AI Expert 1991, 6, 47–51. [Google Scholar]
  51. Shariati, M.; Mafipour, M.S.; Haido, J.H.; Yousif, S.T.; Toghroli, A.; Trung, N.T.; Shariati, A. Identification of the most influencing parameters on the properties of corroded concrete beams using an Adaptive Neuro-Fuzzy Inference System (ANFIS). Steel Compos. Struct. 2020, 34, 155. [Google Scholar]
Figure 1. FRP–concrete parameters.
Buildings 14 00369 g001
Figure 2. Research program.
Buildings 14 00369 g002
Figure 3. General ANFIS architecture.
Buildings 14 00369 g003
Figure 4. Artificial neural networks architecture as used in the present work (Brown: input layer; Blue: hidden layer; Pink: output layer).
Buildings 14 00369 g004
Figure 5. ANN convergence performance for training and testing phases.
Buildings 14 00369 g005
Figure 6. The correlation between predicted and experimental values.
Buildings 14 00369 g006
Figure 7. Accuracy of ultimate bond strength prediction using the ANN model.
Buildings 14 00369 g007
Figure 8. Proposed ANFIS architecture in this study.
Buildings 14 00369 g008
Figure 9. The correlation between predicted and experimental values for training data.
Buildings 14 00369 g009
Figure 10. The correlation between predicted and experimental values for the 20 testing data points.
Buildings 14 00369 g010
Figure 11. Comparison between proposed and published analytical models for testing data. (ACI440.1R-06 [1]; CSA S806-06 [8]; Okelo and Yuan [38]; Lee et al. [39]).
Buildings 14 00369 g011
Figure 12. FRP bond strength vs. concrete strength according to different models [38,39].
Buildings 14 00369 g012
Figure 13. Ultimate bond strength versus bar diameter according to different models [38].
Buildings 14 00369 g013
Figure 14. Ultimate bond strength versus concrete-cover-to-bar-diameter ratio c/db according to different models.
Buildings 14 00369 g014
Figure 15. Ultimate bond strength versus embedment length.
Buildings 14 00369 g015
Figure 16. Ultimate bond strength versus transverse reinforcement.
Buildings 14 00369 g016
Figure 17. Ultimate bond strength versus FRP bar cast position.
Buildings 14 00369 g017
Figure 18. Ultimate bond strength versus FRP bar surface type.
Buildings 14 00369 g018
Figure 19. The relative importance of input variables to output bond strength.
Buildings 14 00369 g019
Figure 20. Training and testing RMSE values of the affecting parameters on τm.
Buildings 14 00369 g020
Table 2. Descriptive statistics of parameters.
ParametersMin.Max.AverageStd. DeviationVariance
InputsFRP Bar Position (a)12---
FRP Bar Surface Type (b)13---
Square root of concrete Compressive Strength, (√fc′), MPa4.848.085.930.620.38
Concrete cover to FRP bar diameter ratio, (c/db)19.343.071.52.26
FRP bar diameter to embedment length ratio, (db/ld)0.0090.280.0860.0670.004
Transverse Reinforcement (Atr/sndb)00.390.0570.1030.011
OutputFRP bond strength (τ), MPa0.80225.58.155.1826.82
Table 3. Sample data set.
No.InputsOutput
Bar
Position
Bar
Surface
√fc
(MPa)
c/dbdb/ldAtr/sndbτm (MPa)Failure Mode
1215.573.440.100.08210.61Pullout
2215.2520.25017.09Pullout
3116.2620.06305.20Pullout
4226.2220.09607.89Splitting
5215.562.60.09907.28Pullout
6226.630.05205.79Splitting
7116.372.40.0520.0222.78Splitting
8225.384.40.20.01520.11Pullout
9236.562.520.0160.0264.71Splitting
10236.41.680.0240.0183.30Splitting
Table 4. Comparison of validation data.
ModelLee et al.Okelo and YuanCSA-S6-06ACI 440.1 R-06ANFISANN
[39][38][42][1]
MSE23.868.910.772.81.150.68
R20.0070.260.330.760.920.94
Table 5. Typical reference data.
ParameterValue
FRP bar position2
FRP bar surface type1
Square root of concrete compressive strength, (√fc′)5.48
Concrete cover to FRP diameter ratio, (c/db)4
FRP diameter to embedment length ratio, (db/ld)0.1
Transverse reinforcement (Atr/sndb)0
Table 6. Relative importance using Garson’s method.
VariableBar
Position
Bar
Surface
√fc′c/dbdb/LdAtr/(sndb)
RI (%)9.9515.5817.1116.97924.4715.91
Rank652314
Table 7. RMSE values in the testing and training ANFIS models.
VariableBar PositionBar
Surface
√fc′c/dbdb/LdAtr/(sndb)
RMSE Training0.2130.2120.12560.1420.09840.175
RMSE Testing0.1560.1560.1560.1560.1560.156
Rank652314
Disclaimer/Publisher’s Note: The statements, opinions and data contained in all publications are solely those of the individual author(s) and contributor(s) and not of MDPI and/or the editor(s). MDPI and/or the editor(s) disclaim responsibility for any injury to people or property resulting from any ideas, methods, instructions or products referred to in the content.

