Abstract
Air-cooled steel is a high-strength steel widely used in automotive subframe applications. In this study, the microstructural evolution and fatigue performance of air-cooled steel welded joints subjected to a one-step heat treatment and an additional two-step heat treatment were systematically investigated. The results indicate that, after the one-step heat treatment, the microstructure of the welded joints transformed from coarse lath martensite to a mixture of tempered martensite and newly formed martensite. After the two-step heat treatment, the microstructure of the welded joints evolved from coarse lath martensite to newly formed martensite, M-A islands, bainitic ferrite, and a small amount of polygonal ferrite. Under both heat treatment conditions, the fatigue limits of the welded specimens were lower than those of the base metal, which can be attributed to the reduced overall deformation compatibility induced by the welded joints. In addition, the welded joints exhibited superior crack propagation resistance compared with the base metal after both heat treatment processes, which is likely related to the enhanced ability of dislocation structures and grain boundaries to impede crack propagation.
1. Introduction
Air-cooled steel is a newly developed advanced high-strength steel (AHSS). After heat treatment, it can be strengthened by cooling in air without the need for quenching media [1,2,3]. This unique self-strengthening property simplifies the heat treatment process and reduces the risks of deformation and cracking associated with traditional quenching processes [4]. Additionally, air-cooled steel exhibits excellent fatigue properties, showing its potential for applications in components requiring high fatigue resistance [5]. Currently, it has been initially applied in critical parts, such as automotive subframes, which are subjected to cyclic loads. However, in practical applications, air-cooled steel often requires welding for structural connections. The presence of welded joints may affect the fatigue properties of the components. Therefore, a detailed understanding of the microstructural evolution and fatigue behavior of air-cooled steel weld joints is crucial for ensuring its safe and reliable service in key structural components.
In recent years, extensive research has focused on the fatigue behavior of AHSS. Particular attention has been paid to the micro-mechanisms of fatigue crack initiation and propagation. Figure 1 summarizes the evolution of fatigue damage at different length scales. In general, fatigue damage is influenced by multiple factors, including microstructural characteristics, defects and inclusions, and residual stresses. Among these factors, the microstructure plays a dominant role in both crack initiation and crack propagation [6].
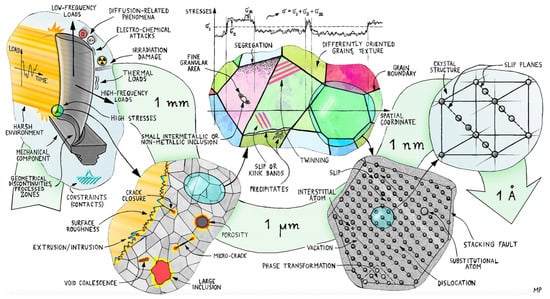
Figure 1.
Fatigue damage mechanisms at different length scales. Reprinted from Ref. [6].
Regarding fatigue crack initiation, previous studies have shown that the initiation site is strongly dependent on microstructural size. Zhao et al. [7] investigated the high-cycle fatigue behavior of bainitic/martensitic dual-phase steels produced under different processing conditions. They reported that fatigue cracks tend to initiate within the microstructure when it is relatively coarse. In contrast, crack initiation preferentially occurs at inclusions when the microstructure is refined. This observation indicates a competitive relationship between microstructural features and inclusions during crack initiation. Gao et al. [8] further investigated crack initiation mechanisms using focused ion beam techniques. They found that cracks preferentially initiate at retained austenite when the bainitic ferrite is fine. However, crack initiation shifts to the bainitic ferrite itself as its size increases. Dai et al. [9] also reported that fatigue cracks are prone to initiate within large martensitic laths. During subsequent growth, cracks preferentially propagate along the longitudinal direction of the laths.
During the fatigue crack propagation stage, both the type and size of the microstructure significantly influence crack growth behavior. Cheng et al. [10] systematically studied fatigue crack propagation in bainitic–martensitic steels. Their results showed that bainitic ferrite exhibits superior plastic deformation capability compared with martensite. It can accommodate greater strain and dissipate more energy during crack propagation. As a result, the crack growth resistance is enhanced. For martensitic steels, Li et al. [11] found that the martensite block size and the number of interfaces play critical roles in early crack propagation. As the martensite block size decreases, the number of interfaces increases accordingly. Fine martensite blocks generally exhibit higher strength. They therefore provide additional barriers to fatigue crack propagation.
Based on these studies, it can be concluded that microstructural type, size, and interfacial characteristics jointly control fatigue crack initiation and propagation in AHSS. These factors are key microstructural parameters governing fatigue performance.
In addition, extensive studies have been conducted on the fatigue behavior of welded specimens in other steels. Pramanick et al. [12] investigated the fatigue performance of welded joints between DP steel and CP steel. They found that all welded specimens fractured in the softened zone after fatigue loading. The softened zone became the weakest region during fatigue. This behavior was attributed to the fact that fatigue cracks preferentially initiate and propagate in softer phases. Guo et al. [13] studied welded joints of QP980 steel and reported different failure behavior. Fatigue failure occurred in the fusion zone (FZ) rather than in the softened zone. The fatigue limit of the welded specimens was approximately 171 MPa, which was about 35% lower than that of the base metal (BM). Fracture in the FZ was attributed to surface depression formed during welding. This geometric imperfection caused stress concentration during fatigue loading. Similar results were reported by Xu et al. [14] for DP980 steel. They observed that fatigue fracture occurred in the FZ instead of the softened zone. The fatigue strength decreased by more than 100 MPa due to the presence of welding-induced depression in the fusion zone. Parkes et al. [15] investigated HSLA–HSLA and DP–HSLA welded joints and found that the fatigue failure location depended strongly on the applied stress level. Under high stress amplitudes, cracks initiated in the HSLA base metal. Under low stress amplitudes, failure occurred in the welded joint. At high stress levels, the applied stress exceeded the yield strength of the base metal, leading to fracture in the base material. At low stress levels, the applied stress was below the yield strength of the base metal. In this case, fatigue performance became more sensitive to weld geometry and joint defects, resulting in fracture at the welded joint. These results indicate a competitive relationship between weld defects and microstructural factors in determining fatigue performance.
Beyond commonly reported effects such as weld defects and softened zones, other microstructural changes in welded joints can also influence fatigue crack initiation and propagation. Xie et al. [16] studied welded joints of duplex stainless steel 2205 and observed a significant reduction in fatigue performance after welding. Fatigue fracture did not occur in the lower-strength matrix but instead in the welded joint. This behavior was attributed to the presence of coarse and interconnected austenite grains in the welded joint. Such coarse microstructures promoted fatigue crack propagation and led to a reduction in fatigue limit of approximately 60 MPa. Based on the above studies, the degradation of fatigue performance in welded joints is commonly associated with the presence of softened zones, poor deformation compatibility between the welded joint and the base metal, welding-induced defects, and coarse microstructures in the welded joint.
At present, the fatigue performance of air-cooled steel after welding has not yet been systematically investigated. It remains unclear whether welding leads to a significant degradation in fatigue performance. In addition, the fatigue fracture mechanisms of welded air-cooled steel specimens have not been fully clarified. Therefore, a systematic investigation of the microstructure and fatigue behavior of welded joints is required to clarify the fatigue fracture mechanisms and fatigue performance of air-cooled steel after welding. In this study, air-cooled steel is chosen as the research material. The microstructural evolution of welded joints under two different heat treatment processes is systematically examined, and the high-cycle fatigue performance after welding is evaluated. The results are expected to provide theoretical support for the engineering application of air-cooled steel.
2. Materials and Experimental Procedure
2.1. Experimental Materials and Heat Treatments
The experimental material was laboratory-produced annealed air-cooled steel plates, and the chemical composition is listed in Table 1. In previous studies, the phase transformation temperatures of this steel were determined by dilatometry, with an Ac1 temperature of 726 °C and an Ac3 temperature of 850 °C. The initial hardness of the annealed air-cooled steel plates was 187 HV ± 5.

Table 1.
The elemental composition of air-cooled steel (wt.%).
After one-step and two-step heat treatments, air-cooled steel with a martensite-ferrite (ACS-FM) and air-cooled steel with a fibrous M-A island-bainitic ferrite (ACS-BMA) were obtained. The welding process was completed before heat treatment, and the welded joints underwent the same thermal history as the base metal. The one-step heat treatment involved directly heating the annealed plates to the two-phase region (between Ac1 and Ac3), holding for a specified time, and then air cooling. The heat treatment temperature of 820 °C was selected based on the mechanical property requirements for air-cooled steel in practical applications. A tensile strength of about 800 MPa and a total elongation of approximately 15% are required. Heat treatment at 820 °C can achieve these target properties. The temperature selection was also guided by the study of Yang et al. [2]. The two-step heat treatment process consisted of two stages. First, the material was heated to the fully austenitized temperature range (above Ac3), held for a certain time, and then air cooled. Subsequently, a second intercritical annealing treatment was applied. The first heating step to 1100 °C was applied to obtain sufficiently large bainitic ferrite precursors. The second heating step to 790 °C was used to form uniformly distributed fibrous M-A islands. At lower temperatures, the M-A islands cannot be uniformly distributed, whereas higher temperatures promote the formation of blocky M-A islands. The specific heat treatment processes are shown in Figure 2. The mechanical properties before and after heat treatment are summarized in Table 2.
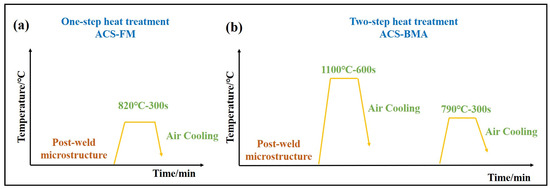
Figure 2.
(a) Heat treatment process for ACS-FM; (b) heat treatment process for ACS-BMA.
Table 2.
Mechanical properties of air-cooled steel before and after heat treatment.
2.2. Laser Welding Procedure
The laser welding experiment was conducted using a multimode fiber laser (IPG YLS-6000, IPG Photonics Corporation, Oxford, MA, USA). A five-axis CNC motion platform was employed to precisely control the welding path and process parameters. Based on the welding parameters for high-strength steel sheets reported by Wang et al. [17], the laser power and welding speed were set to 1300 W and 2.0 m/min, respectively. Under these conditions, the welded joints exhibited no defects such as spatter or lack of penetration and showed good mechanical performance. The output wavelength range of the laser was 1060–1070 nm, and the focused spot diameter was approximately 0.3 mm. The specimens were fixed on the worktable using clamps to minimize deformation during the welding process. Prior to welding, the surfaces were cleaned with acetone to remove oil, oxide scales, and dust, ensuring the cleanliness of the welding area. During welding, high-purity nitrogen gas was used as the shielding gas at a flow rate of 10 L/min to isolate the molten pool from the atmosphere and prevent oxidation or nitridation reactions. The laser beam was incident at a slight angle relative to the normal of the plate surface. The welding device is shown in Figure 3a, with a diagram of the laser welding procedure shown in Figure 3b.
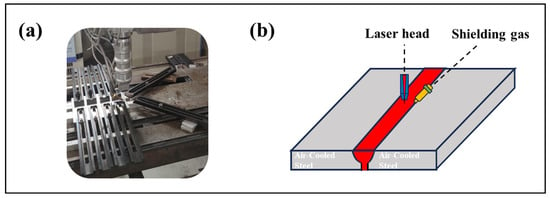
Figure 3.
(a) Schematic of the welding experimental setup; (b) illustration of the laser welding process.
2.3. Material Characterization
Microstructural characterization of the specimens was performed using optical microscopy (OM, BX53M, Olympus Corporation, Tokyo, Japan), scanning electron microscopy (SEM, Sigma 300, Carl Zeiss AG, Oberkochen, Germany), electron backscatter diffraction (EBSD, Quanta FEG 450, FEI Company, Hillsboro, OR, USA), and field-emission transmission electron microscopy (FE-TEM, Tecnai G2 F20, FEI Company, Hillsboro, OR, USA). The SEM specimens were mounted and polished to a mirror-like finish. Final etching was carried out using a 4% nitric acid alcohol solution. SEM observations were conducted on a ZEISS Sigma 500 field-emission scanning electron microscope at an accelerating voltage of 15 kV. EBSD specimens were prepared by electrolytic polishing using a solution of 10% perchloric acid and 90% acetic acid, with polishing parameters of 25 V, and 0.1 A. EBSD analysis was performed using an FEI Quanta FEG 450 (Quanta FEG 450, FEI Company, Hillsboro, OR, USA) scanning electron microscope equipped with an EDAX Hikari XP detector system at an accelerating voltage of 20 kV. TEM specimens were mechanically thinned to approximately 60 μm and then twin-jet electropolished at −30 °C and 25 V. The electrolyte used for twin-jet thinning was a mixture of 15 vol % perchloric acid and 85 vol % acetic acid.
2.4. Mechanical Properties Test
High-cycle tension-tension fatigue tests were performed on a servo-hydraulic fatigue tester (LFV-100KN, Walter + Bai AG, Löhningen, Switzerland) using a stress-controlled method. The fatigue test was conducted in accordance with standard GB/T-3075-2021 [18]. All fatigue tests were conducted at room temperature in air. Sinusoidal loading was applied with a frequency of 30 Hz and a stress ratio of R = 0.1. The loading frequency of 30 Hz was selected by considering both testing efficiency and the avoidance of self-heating effects in the specimens. Similar frequency ranges have been widely used in high-cycle fatigue studies of advanced high-strength steels and steels with comparable strength levels [12]. A stress ratio of R = 0.1 was adopted to avoid specimen bending caused by compressive stresses during cyclic loading. This stress ratio has also been commonly applied in fatigue testing of high-strength steel sheet specimens [13]. At least three specimens were tested at each stress level to ensure experimental repeatability. The standard deviation and coefficient of variation of the fatigue life at different stress levels are provided in the Supplementary Materials (Tables S1–S4). In this study, the fatigue limit was defined as the maximum stress at which the specimen could withstand 1 × 10⁷ loading cycles without failure. The S-N data were analyzed on a logarithmic scale. Linear regression was performed between the stress amplitude and the logarithm of fatigue life to obtain the S-N curves of the material. The geometry of the fatigue specimens is shown in Figure 4a. To eliminate the influence of surface roughness on fatigue properties, all fatigue specimens were mechanically polished to a mirror finish prior to testing.
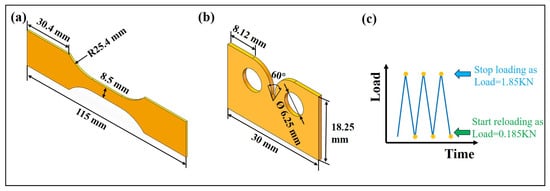
Figure 4.
(a) Geometry of the fatigue specimen; (b) geometry of the fatigue crack propagation specimen; (c) stress loading mode for fatigue crack propagation test.
Fatigue crack propagation tests were carried out on an electronically controlled universal testing machine equipped with a custom-designed in situ optical observation system, which enables real-time monitoring of surface morphology during crack propagation. The testing apparatus was equipped with a high-precision load cell and displacement measurement system to accurately control the applied load and deformation. The stress loading mode for the fatigue crack propagation test is illustrated in Figure 4c, and the loading frequency was set to 0.1 Hz. The notches in the fatigue specimens were machined using wire electrical discharge machining. No additional mechanical loading was introduced during notch fabrication. This approach effectively avoids plastic deformation and residual stress concentration commonly associated with conventional mechanical machining, thereby improving the reliability of the experimental results.
3. Results and Discussion
3.1. Microstructure After Welding
Figure 5 shows the surface morphology of the specimen after welding. Under the process parameters of 1300 W laser power, a welding speed of 2.0 m/min, and a defocus distance of +4 mm, the weld surface is smooth and free from visible surface defects such as undercut or porosity. Full penetration is achieved at the bottom of the weld, and the overall weld is continuous.
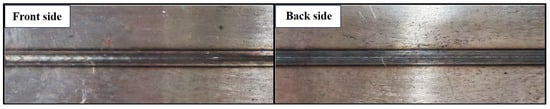
Figure 5.
Post-weld macroscopic morphology.
Figure 6 presents microstructural morphology of different zones in the welded joint. Figure 6a presents the macrostructure of the joint, where the weld exhibits a funnel-shaped profile with a width of approximately 1600 μm. Due to the varying thermal cycles experienced by different zones, significant differences in microstructural features are observed. Based on these morphological differences, the welded joint can be separated into the fusion zone (FZ), coarse-grained heat-affected zone (CGHAZ), fine-grained heat-affected zone (FGHAZ), inter-critical heat-affected zone (ICHAZ), and base metal (BM) [19,20].
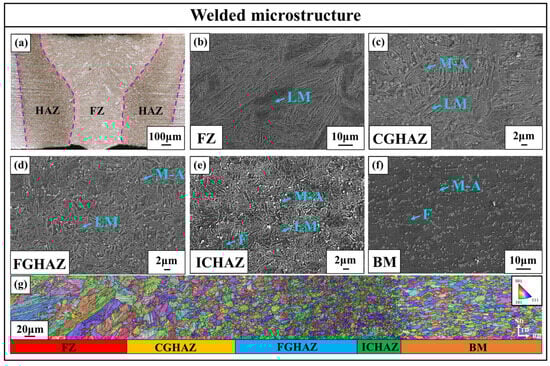
Figure 6.
(a) Macrostructure of the welded joint; (b) SEM image of FZ; (c) SEM image of CGHAZ; (d) SEM image of FGHAZ; (e) SEM image of ICHAZ; (f) SEM image of BM; (g) IPF map of the welded joint.
Figure 6b–f show the microstructures of different zones within the welded joint. As shown in Figure 6f, the microstructure of the BM consists of ferrite, M-A islands, and carbides. As shown in Figure 6b, the FZ is composed of coarse lath martensite with significantly coarsened grains. This is attributed to the fact that, during welding, the temperature in this zone exceeds the Ac3, causing the original microstructure to fully transform into coarse austenite. Upon rapid cooling, the coarse austenite transforms directly into coarse lath martensite (Figure S1 in the Supplementary Materials provides TEM images of martensite). Figure 6b,c show the microstructures of the CGHAZ and FGHAZ. Both zones are composed of lath martensite and a small number of M-A islands. During welding, the peak temperatures in these two zones exceeded the Ac3 temperature, leading to complete austenitization of the original microstructure. Upon rapid cooling after welding, the austenite transformed into martensite, resulting in microstructures primarily dominated by lath martensite [21]. Although the microstructural types are the same, there are clear differences in morphology. The CGHAZ is located adjacent to the FZ, where the heat input is higher, resulting in significant coarsening of austenite grains and subsequently coarser martensite after transformation. In contrast, the FGHAZ is situated on the side farther from the laser beam, where lower heat input suppresses grain growth, leading to the formation of relatively finer martensite. Additionally, M-A islands can be observed in both zones, with similar morphology and distribution to those in the BM. Due to the extremely high cooling rate during laser welding and the fact that both the CGHAZ and FGHAZ did not undergo melting, some M-A islands in the base metal did not fully transform during rapid heating and cooling, and were retained in the final microstructure. Figure 6e shows the microstructure of the ICHAZ. This zone is mainly composed of ferrite, lath martensite, and a small number of M-A islands, exhibiting typical characteristics of partial phase transformation. Such a microstructural feature is attributed to the peak temperature in this zone during the welding thermal cycle falling between Ac1 and Ac3. This temperature range is sufficient to partially re-austenitize the base metal microstructure but insufficient to induce complete austenitization. During cooling, the re-austenitized regions transform into lath martensite, while the untransformed regions retain their original ferrite morphology. Additionally, the M-A islands observed in this zone originate from the base metal. As this zone was not melted and the welding speed was relatively high, these microstructures were preserved in the final weld.
Figure 6g presents the inverse pole figure maps of different zones in the welded joint, clearly illustrating the grain morphology and crystallographic orientation characteristics. It can be observed that the FZ exhibits coarse columnar grains with a pronounced preferential growth along the heat flow direction [22]. Moving away from the fusion line, the grains gradually transition into equiaxed structures within the HAZ, while the BM retains its original equiaxed grain morphology. The variation in grain size is primarily governed by the distribution of heat input during the welding process.
3.2. Microstructure of the Welded Joint After One-Step Heat Treatment
Figure 7 presents the microstructures of various zones in the welded joint of ACS-FM after one-step heat treatment (ACS-FM-WJ). Figure 7d clearly presents the overall morphology of microstructure within the welded joint. As depicted in Figure 7(a1,a2), the microstructure of the FZ transforms from coarse martensite formed during welding into tempered martensite and newly formed martensite. During the heat treatment process, the holding temperature lies between Ac1 and Ac3, and the holding time is relatively short. As a result, carbon atoms in the coarse lath martensite of the FZ begin to precipitate and form carbides, leading to changes in the martensitic lattice structure and thereby forming tempered martensite. Meanwhile, austenite forms along the martensitic laths or grain boundaries, which subsequently transforms into newly formed martensite during rapid cooling. As shown in Figure 7(b1,b2), the microstructure of CGHAZ transforms from martensite and a small number of M-A islands into tempered martensite and newly formed martensite. During the heating and holding stage, the M-A islands are re-austenitized and subsequently transformed into martensite under rapid cooling conditions. The microstructural types in the HAZ were similar. Therefore, only the microstructure of the CGHAZ is presented here, while the microstructures of the other HAZ regions are provided in the Supplementary Materials. During heat treatment, the microstructure in the FGHAZ transformed from martensite with a small amount of M-A islands into tempered martensite, newly formed martensite, and a small fraction of ferrite. Due to the finer lath martensite structure in the as-welded FGHAZ, the lath structure is more susceptible to recovery during heat treatment, leading to the formation of some ferrite. After heat treatment, the microstructure in the ICHAZ transformed from ferrite, lath martensite, and a small amount of M-A islands into tempered martensite, newly formed martensite, and ferrite. As shown in Figure 7d, the grain size in the ICHAZ region is smaller than that in the FGHAZ. During intercritical heat treatment, partial austenite forms in the BM and transforms into martensite during rapid cooling, leading to a microstructure consisting of ferrite and martensite.
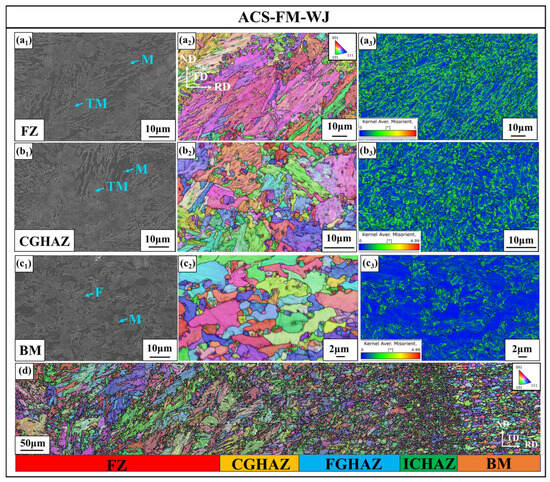
Figure 7.
(a1–a3) SEM, IPF, and KAM maps of FZ; (b1–b3) SEM, IPF, and KAM maps of CGHAZ; (c1–c3) SEM, IPF, and KAM maps of BM; (d) IPF map of the welded joint.
Figure 7(a3–c3) show the Kernel Average Misorientation (KAM) maps of different zones in the welded joint. In these KAM maps, the color represents the degree of local crystallographic orientation deviation, which reflects the dislocation distribution within the material: colors closer to red indicate larger local misorientations and thus higher dislocation densities, while colors closer to blue suggest more uniform orientations and lower dislocation densities [23,24,25]. Table 3 presents the KAM values of various zones in the ACS-FM-WJ. It is evident that the KAM values in the welded joint are significantly higher than those in the base metal, indicating a higher dislocation density in the welded zones.
Table 3.
KAM values in different zones of the ACS-FM welded joint.
3.3. Microstructure of the Welded Joint After Two-Step Heat Treatment
Figure 2b shows that the two-step heat treatment process involves heating to 1100 °C and air cooling, then reheating to 790 °C with subsequent air cooling. Characterizing the intermediate microstructure formed after heating to 1100 °C and air cooling helps to reveal the microstructural evolution throughout the heat treatment process. Figure 8 presents the microstructures of the welded joint after heating to 1100 °C and air cooling. According to Figure 8a–d, the microstructures in all zones of the welded joint were transformed into lath bainite after heating. Since the heating temperature exceeded Ac3, the microstructures were fully austenitized and subsequently transformed into lath bainite upon air cooling [26]. As shown in Figure 8e, it is worth noting that although all zones exhibit lath bainite, the bainitic grain sizes vary significantly among different zones. The average grain sizes of lath bainite, measured using Image J 1.54i, were 14.6 ± 1.65 μm in the FZ, 21.1 ± 3.97 μm in the CGHAZ, 9.6 ± 2 μm in the FGHAZ, and 67.2 ± 16.5 μm in the BM. The smaller average grain size in the HAZ is primarily attributed to the formation of martensitic microstructures in this zone after welding. During heat treatment, austenite tends to nucleate more easily at the interfaces of martensite laths [27]. Compared with the ferrite-dominated BM, the HAZ contains more nucleation sites for austenite, thereby promoting more austenite formation and ultimately resulting in smaller austenite grain sizes in the HAZ compared to the BM.
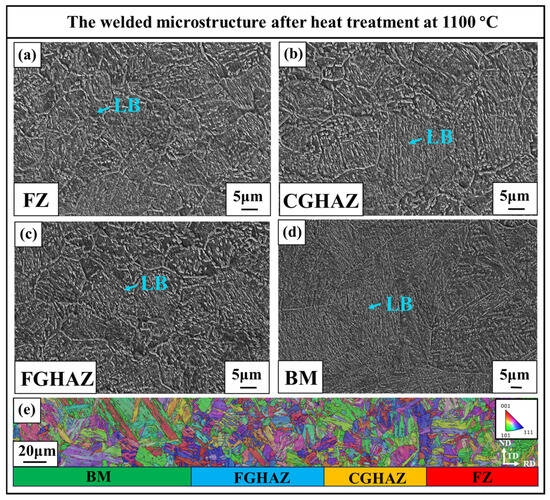
Figure 8.
(a) SEM image of FZ; (b) SEM image of CGHAZ; (c) SEM image of FGHAZ; (d) SEM image of BM; (e) IPF map of the welded joint.
Figure 9 shows the microstructures of the welded joint after heating to 1100 °C followed by air cooling, and subsequently reheating to 790 °C followed by air cooling. Figure 9d presents the morphology of the ACS-BMA welded joint (ACS-BMA-WJ). The observations show that, even after the brief second-stage reheating, a significant grain size difference remains between the base metal and the welded joint. This difference may affect the fatigue properties of the welded joint and is discussed in detail in the following sections. The microstructural types in the HAZ were similar. Therefore, only the microstructure of the CGHAZ is presented here, while the microstructures of the other HAZ regions are provided in the Supplementary Materials. As shown in Figure 9, after the two-stage heat treatment, the microstructures in the FZ, CGHAZ, and FGHAZ were transformed from lath bainite into newly formed martensite, M-A islands, bainitic ferrite, and a minor fraction of polygonal ferrite. During heat treatment, austenite tends to nucleate preferentially at grain boundary intersections and then grow rapidly, forming martensite upon cooling [28]. In contrast, austenite nucleates later at lath boundaries, which may lead to elemental segregation due to the limited time for diffusion, and subsequently promote the formation of M-A islands during cooling. Moreover, a portion of coarse bainitic ferrite remained untransformed due to the short heat treatment duration, while a small portion of bainitic ferrite gradually lost its lath morphology and transformed into polygonal ferrite. In the BM, the original lath bainite was transformed into M-A islands and bainitic ferrite. Due to the large grain size in the BM (67.2 μm), the number of grain boundaries is relatively low, so austenite primarily nucleates along bainitic ferrite lath bundles and grows along their direction [25]. During cooling, the austenite converts into fibrous M-A islands, producing a final microstructure consisting of fibrous M-A islands and bainitic ferrite. Figure 9(a3–c3) show the KAM maps of each region of the welded joint. Table 4 summarizes the KAM values for each zone in the ACS-BMA-WJ. The results show that the dislocation densities in the welded joint zones are comparable to that in the BM.
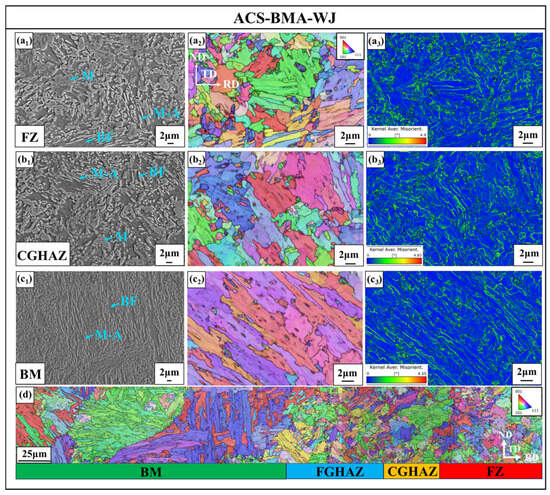
Figure 9.
(a1–a3) SEM, IPF, and KAM maps of FZ; (b1–b3) SEM, IPF, and KAM maps of CGHAZ; (c1–c3) SEM, IPF, and KAM maps of BM; (d) IPF map of the welded joint.
Table 4.
KAM values in different regions of the ACS-BMA welded joint.
3.4. Microhardness of the Welded Joint After Heat Treatment
Figure 10 presents the hardness distributions of welded joints following the two heat treatment methods. As shown in the figure, after one-step heat treatment, the hardness of the FZ and HAZ is higher than that of the BM. In contrast, after two-step heat treatment, hardness values of the welded joint are comparable to those of the BM. It has been demonstrated in earlier studies that material hardness is closely linked to dislocation density [29]. As shown in Table 3, after one-step heat treatment, the dislocation density in the FZ and HAZ is higher than in the BM, resulting in increased hardness. Correspondingly, Table 4 indicates that the dislocation densities in the welded joint are nearly the same as those in the BM after two-step heat treatment, leading to similar hardness values.
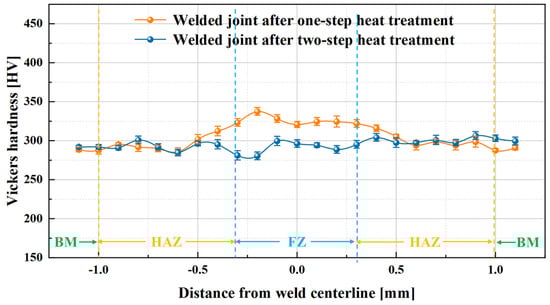
Figure 10.
Microhardness profiles of the welded joints after the two heat treatment processes.
3.5. Fatigue Properties of the Welded Specimens
Figure 11a presents the S-N curves of both welded and unwelded specimens of ACS-FM and ACS-BMA. The fatigue limit is defined as the maximum stress value under which no fracture occurs after 1 × 10⁷ loading cycles. Table 5 summarizes the fatigue limits and fatigue life of the air-cooled steel base metal and welded specimens. As shown in Table 5, the fatigue limit of ACS-FM-WJ is 630 MPa, while that of ACS-FM is 640 MPa. The fatigue limit of the welded specimen is reduced by 10 MPa compared with the unwelded specimen. For ACS-BMA-WJ, the fatigue limit is 650 MPa, compared to 670 MPa for ACS-BMA, showing a 20 MPa decrease due to welding. Both welded fatigue specimens fractured at the base metal, and the underlying mechanisms related to the effect of microstructure on fatigue fracture will be discussed in detail later.
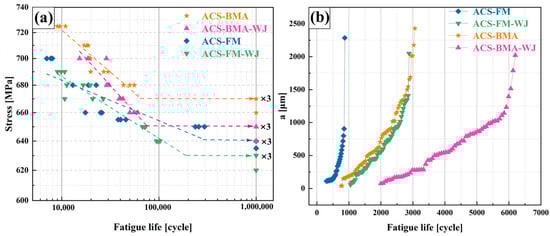
Figure 11.
(a) High-cycle fatigue properties of welded and base metal specimens; (b) crack length versus number of cycles for welded joints and base metal.
Table 5.
Fatigue limits and fatigue life at rapid fracture of welded joints and base metal.
In addition, statistical analysis of the fatigue life data was performed to calculate the standard deviation and coefficient of variation for each group of specimens. The results are provided in the Supplementary Materials (Tables S1–S4). The calculations indicate that both the welded joint specimens and the base metal specimens exhibit small standard deviations and low coefficients of variation. This suggests that, under the same stress level, the performance differences among specimens are minor, and the data are consistent and reliable.
To further quantify the fatigue performance of the welded joints, fatigue crack growth behavior was analyzed for both the welded joints and the base metal. Figure 11b presents the crack length (a) versus the number of cycles (N) during fatigue crack growth tests for ACS-FM and ACS-BMA, comparing welded joints and base metal specimens. As shown in Table 5, rapid fracture occurred in the ACS-FM base metal specimen after 870 cycles, whereas the ACS-FM-WJ exhibited rapid fracture after 2880 cycles. For ACS-BMA, rapid fracture occurred at 3063 cycles, while ACS-BMA-WJ sustained up to 6200 cycles before rapid fracture. These results indicate that both welded joints exhibit superior resistance to fatigue crack propagation compared to their respective base metal specimens.
4. Discussion
4.1. Fatigue Fracture Surface Analysis
To further clarify the fatigue crack initiation mechanisms of the welded specimens, an investigation of the fatigue fracture surfaces was conducted. Figure 12 presents the fatigue fracture surface of ACS-FM-WJ after failure under a stress amplitude of 640 MPa at 8 × 10⁵ cycles. The final fracture occurred in the base metal rather than in the welded joint. The fracture surface can be separated into four zones: the crack initiation zone, the stable propagation zone, the transition zone, and the fast propagation zone [30]. Figure 12a–c present that the fatigue crack initiated at the specimen surface. This is primarily due to the intrusion and extrusion of persistent slip bands during cyclic loading, which resulted in localized surface roughening and subsequent stress concentration, ultimately leading to crack initiation [31]. The stable propagation zone exhibits a characteristic fan-shaped pattern (Figure 12a), with river-shaped morphology observed on the fracture surface (Figure 12d), which generally indicates the crack growth direction. In addition, typical fatigue striations are observed in this zone (Figure 12g). Under cyclic loading, the crack front advances a small distance during each load cycle. Each advance leaves a striation on the fracture surface. The spacing between striations generally reflects the crack growth rate; narrower spacing indicates slower propagation [32,33]. Figure 12e shows the morphology of the transition zone, where a mixture of dimples and river-shaped morphology appears, indicating a gradual transition in fracture mechanism from stable fatigue crack growth to fast propagation [34]. The fast propagation zone (Figure 12f) is dominated by dimpled morphology, suggesting that ductile fracture is the governing mechanism in this zone.
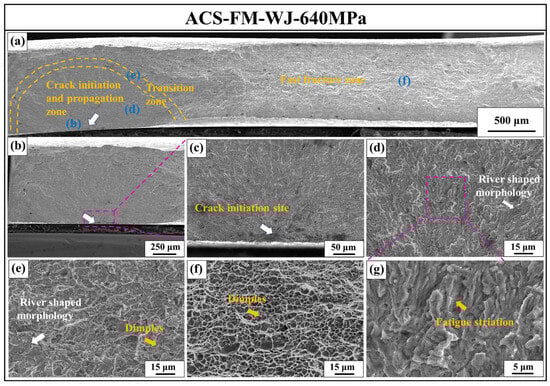
Figure 12.
(a) Macroscopic morphology of the fatigue fracture surface of ACS-FM-WJ under a stress amplitude of 640 MPa; (b,c) crack initiation zone; (d) stable propagation zone; (e) transition zone; (f) fast propagation zone; (g) fatigue striations.
Figure 13 presents the fatigue fracture surface of ACS-FM-WJ after failure under a stress amplitude of 680 MPa and 2.25 × 10⁵ cycles. The final fracture again occurred in the BM. As seen in Figure 13a–c, under the higher stress amplitude, crack initiation still occurred at the specimen surface. Compared to the stable propagation zone observed at 640 MPa, the extent of the current stable propagation zone is smaller, which is consistent with the reduced total number of cycles. Figure 13d,g present that the stable propagation zone still exhibited river-shaped morphology and pronounced fatigue striations. Compared to those at 640 MPa, the striation spacing is wider, indicating a faster crack growth rate. Figure 13e,f shows the morphologies of the transition zone and the fast propagation zone, where a large number of uniformly distributed dimples are observed, indicating that ductile fracture remained the dominant failure mechanism in this zone.
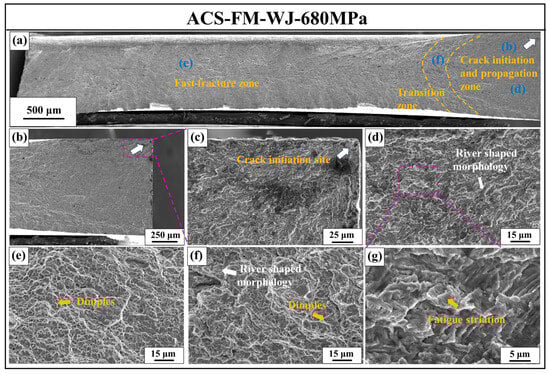
Figure 13.
(a) Macroscopic fracture surface of ACS-FM-WJ under a stress amplitude of 680 MPa, (b,c) crack initiation zone, (d) stable crack propagation zone, (e) fast fracture zone, (f) transition zone, (g) fatigue striations.
Figure 14 presents the fatigue fracture surface of ACS-BMA-WJ after failure under a stress amplitude of 660 MPa and 5.51 × 10⁵ cycles. The final fracture occurred in the BM. As shown in Figure 14b,c, the crack again initiated at the specimen surface. In the stable crack propagation zone, river-shaped morphology, fatigue striations, and secondary cracks perpendicular to the crack growth direction were observed (Figure 14c–e). Compared with ACS-FM-WJ, the river-shaped morphology in ACS-BMA-WJ appeared straighter, suggesting fewer deflections during crack propagation. This may be attributed to the larger grain size of the bainitic ferrite in the BM of ACS-BMA. Larger grains imply fewer grain boundaries, which reduces the likelihood of crack deflection along grain boundaries and promotes crack propagation along straighter paths [35]. Additionally, as shown in Figure 14f,g, numerous dimples were observed in the transition and fast fracture zones, indicating that the dominant fracture mechanism remained ductile.
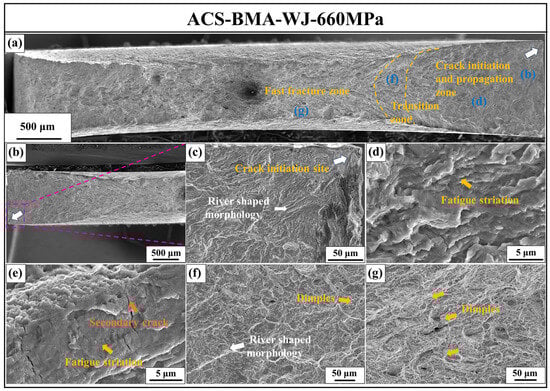
Figure 14.
(a) Macroscopic fracture surface of ACS-BMA-WJ under a stress amplitude of 660 MPa; (b,c) crack initiation zone; (d) stable crack propagation zone; (e) fatigue striation and secondary crack morphology; (f) transition zone; (g) fast fracture zone.
Figure 15 presents the fatigue fracture surface of ACS-BMA-WJ after failure under a stress amplitude of 700 MPa following 2.87 × 10⁵ cycles. The final fracture still occurred in the BM. According to Figure 15a–c,e, multiple crack initiation sites were observed at both the surface and interior under this higher stress amplitude. However, it should be emphasized that the crack initiated inside the specimen propagated only a very short distance, indicating that its growth was significantly hindered. This inhibited propagation is likely related to the abundant distribution of fibrous M-A islands in the ACS-BMA microstructure. M-A islands typically exhibit high dislocation density, which can effectively impede crack propagation and thus restrict crack growth to a limited extent [9]. As shown in Figure 15d,f,g, the fracture surface morphologies in the stable crack propagation zone, transition zone, and fast fracture zone are consistent with those observed under the stress amplitude of 660 MPa, all exhibiting similar fatigue propagation and fracture behaviors.
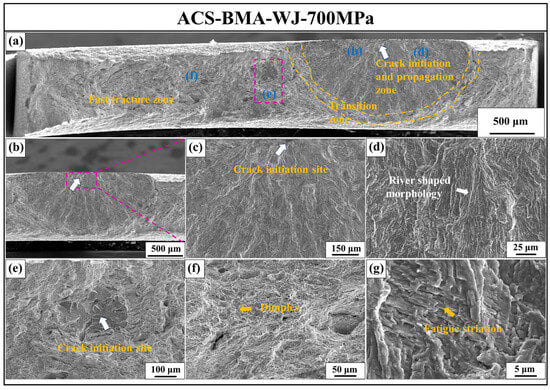
Figure 15.
(a) Macroscopic fracture surface of ACS-BMA-WJ under a stress amplitude of 700 MPa, (b,c) crack initiation zone, (d) stable crack propagation zone, (e) internal crack initiation site, (f) fast fracture zone, (g) fatigue striation.
4.2. The Effect Mechanism of Welded Joints on Fatigue Properties
As shown in Figure 11, both types of air-cooling steel exhibited a certain degree of reduction in fatigue limit after welding, while the crack propagation rates in the welded joints were lower than those in the base metal. To gain a deeper understanding of the underlying mechanisms, further analysis and interpretation of this behavior are necessary. Figure 16 presents the macroscopic morphology of fatigue crack propagation in the welded joint and BM of ACS-FM. It is evident that during fatigue loading, the BM exhibited more pronounced slip band features. Some of these slip bands evolved into secondary cracks, whereas few distinct slip bands were observed in the welded joint. This indicates that the BM possesses a higher plastic deformation capacity, which facilitates stress relaxation and coordinated deformation during the fatigue process. Combined with Table 3 and Figure 10, it is observed that the dislocation density and microhardness of the welded joint are both higher than those of the base metal. The tempered and newly formed martensite within the welded joint has a higher dislocation density. This hinders the transmission of slip systems during plastic deformation, resulting in a reduced plastic deformation capacity [36]. The limited plasticity in the welded joint constrains the overall deformation compatibility of the specimen [4]. This reduced coordinated deformation ability is regarded as a primary reason for the decreased fatigue limit of the welded specimens.
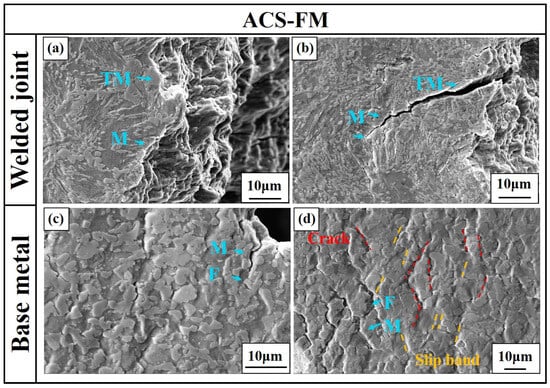
Figure 16.
(a,b) Microstructures near the main fatigue crack in the welded joint of ACS-FM; (c,d) microstructures near the main fatigue crack in the base metal of ACS-FM.
Moreover, the slower crack propagation rate observed in the welded joint is also closely related to its microstructural characteristics. The welded joint is mainly composed of tempered martensite and newly formed martensite, while the base metal consists of newly formed martensite and ferrite. Compared to ferrite, tempered martensite typically exhibits a higher dislocation density, which provides greater resistance to crack propagation. Dai et al. [9] demonstrated pronounced crack deflection when cracks propagate through regions with a high dislocation density. This suggests that dense dislocations act as effective barriers to crack propagation. In contrast, ferrite exhibits a lower dislocation density and greater plasticity, making it more susceptible to crack initiation and growth. Therefore, the ferritic microstructure in the base metal may promote easier crack propagation, resulting in a higher crack growth rate compared to the welded joint.
The fatigue limit of ACS-BMA-WJ was approximately 20 MPa lower than that of ACS-BMA, while the welded joint demonstrated stronger resistance to crack propagation. This indicates that the microstructure in the welded joint of ACS-BMA influenced the fatigue properties of the material. As shown in Figure 9d, the bainitic ferrite grains in the BM were significantly larger than those in the welded joint. Larger grains facilitate activation and extension of slip bands, which enhances the capacity for plastic deformation [37]. As illustrated in Figure 17, the bainitic ferrite in the BM contained more abundant and longer slip bands, whereas the welded joint exhibited significantly fewer slip bands. Therefore, the smaller grain size in the welded joint limited slip band development and reduced local plasticity. This decrease in deformation compatibility ultimately led to a lower overall fatigue limit.
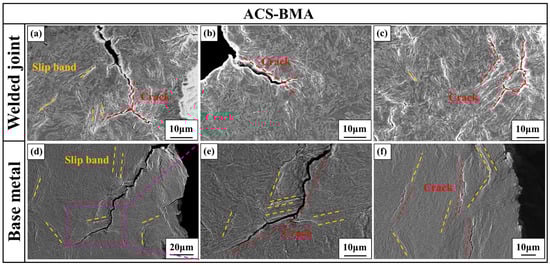
Figure 17.
(a–c) Microstructures near the main fatigue crack in the welded joint of ACS-BMA; (d–f) microstructures near the main fatigue crack in the base metal of ACS-BMA.
In addition, the superior crack resistance observed in the welded joint was closely related to its finer grain size. As shown in Figure 17, secondary cracks in the welded joint frequently exhibited branching and deflection during propagation, while cracks in the base metal followed relatively straight paths. The finer grains in the welded joint resulted in a higher density of grain boundaries. This increased the likelihood of crack deflection and changes in crack path, thereby requiring more energy for crack propagation. In contrast, coarser grains in the BM resulted in fewer grain boundaries, allowing cracks to propagate along more direct paths with lower resistance. Consequently, frequent crack deflection in the welded joint effectively increased the energy barrier for propagation, leading to enhanced crack resistance.
5. Conclusions
This study systematically investigated the microstructural evolution and fatigue properties of air-cooling steel welded joints under two different heat treatment processes. The main conclusions are as follows:
- After the one-step heat treatment, the welded joint transformed from coarse lath martensite into tempered martensite and newly formed martensite.
- After the two-step heat treatment, the welded joint evolved from coarse lath martensite into newly formed martensite, M–A islands, bainitic ferrite, and a small amount of polygonal ferrite.
- After the one-step heat treatment, the fatigue limit of the welded specimen decreased by 10 MPa compared to that of the base metal. After the two-step heat treatment, the fatigue limit decreased by 20 MPa. The welded joints subjected to both heat treatments exhibited better crack resistance than the base metal.
- The reduction in fatigue limit of the welded specimens under both heat treatment conditions may be related to the difference in plastic deformation capacity between the welded joint and the BM. This difference may lead to a decrease in overall deformation compatibility, potentially affecting the fatigue performance.
- ACS-FM-WJ exhibited superior crack resistance compared with ACS-FM, which may be attributed to the higher dislocation density in the newly formed and tempered martensite. ACS-BMA-WJ also showed higher crack resistance than ACS-FM, possibly due to the smaller grain size and higher grain boundary density in the welded joint, potentially hindering fatigue crack propagation.
- In this study, the dislocation density calculated from KAM was used only to show relative differences among microstructures. No strict quantitative relationship with fatigue crack initiation or propagation has been established. Future studies will use in situ fatigue testing and other multi-scale techniques. These efforts will help clarify the relationship between dislocation structures, microstructural features, and fatigue crack evolution, thereby providing guidance for microstructure design and fatigue performance optimization in engineering applications.
Supplementary Materials
The following supporting information can be downloaded at: https://www.mdpi.com/article/10.3390/met16010065/s1. Figure S1: TEM image of lath martensite. Table S1: Standard deviation and coefficient of variation of fatigue life for the ACS-FM at different stress levels. Table S2: Standard deviation and coefficient of variation of fatigue life for ACS-FM-WJ at different stress levels. Table S3: Standard deviation and coefficient of variation of fatigue life for the ACS-BMA at different stress levels. Table S4: Standard deviation and coefficient of variation of fatigue life for ACS-BMA-WJ at different stress levels.
Author Contributions
Conceptualization, X.F., Y.-X.W. and X.-Y.Y.; Methodology, X.F., Y.-X.W. and Z.-L.M.; Validation, Y.-G.Y.; Formal analysis, X.F., Y.-X.W. and X.-Y.L.; Investigation, W.-N.Z. and Q.Z.; Resources, X.-Y.Y., Q.Z. and Z.-L.M.; Data curation, Y.-X.W., X.-Y.L., W.-N.Z. and Q.Z.; Writing—original draft, X.F.; Visualization, X.F. and F.-D.C.; Supervision, W.-N.Z., X.-Y.Y., F.-D.C. and Z.-L.M.; Project administration, X.-Y.L., X.-Y.Y., F.-D.C., Y.-G.Y. and Z.-L.M.; Funding acquisition, Y.-G.Y. and Z.-L.M. All authors have read and agreed to the published version of the manuscript.
Funding
This research was funded by National Natural Science Foundation of China grant number [52274372], and the Fundamental Research Funds for the Central Universities grant number [FRF-TP-22-013A1].
Data Availability Statement
Data will be made available on request.
Conflicts of Interest
The authors declare that they have no known competing financial interests or personal relationships that could have appeared to influence the work reported in this paper.
Nomenclature
| BM | Base metal |
| FZ | Fusion zone |
| HAZ | Heat-affected zone |
| CGHAZ | Coarse-grained heat-affected zone |
| FGHAZ | Fine-grained heat-affected zone |
| ICHAZ | Intercritical heat-affected zone |
| M–A | Martensite–austenite constituent |
| DP | Dual-phase microstructure |
| CP | Complex-phase microstructure |
| QP | Quenching and Partitioning |
| Ac1 | Austenite start temperature |
| Ac3 | Austenite finish temperature |
| ACS-FM | Air-cooled steel with ferrite–martensite microstructure |
| ACS-BMA | Air-cooled steel with bainitic ferrite–M-A microstructure |
| ACS-FM-WJ | Air-cooled steel welded joint with ferrite–martensite microstructure |
| ACS-BMA-WJ | Air-cooled steel welded joint with bainitic ferrite–M-A microstructure |
| R | Stress ratio (σmin/σmax) |
| S-N | Stress-Number of cycles |
| a | Crack length |
| N | Number of cycles to failure |
| KAM | Kernel average misorientation |
| AHSS | Advanced high-strength steels |
| OM | Optical microscopy |
| SEM | Scanning electron microscopy |
| EBSD | Electron backscatter diffraction |
| FE-TEM | Field-emission transmission electron microscopy |
References
- Schaper, M.; Grydin, O.; Nürnberger, F. Microstructure evolution of the air-hardening steel LH800® due to heat treatment. HTM J. Heat Treat. Mater. 2013, 68, 42–48. [Google Scholar] [CrossRef]
- Yang, Y.; Luo, X.; Lei, M.; Fang, X.; Li, S.; Wu, Y.; Mi, Z. Microstructure evolution and strengthening mechanism of air-hardening steel subjected to the austenitizing annealing treatment. Mater. Res. Express 2023, 10, 106502. [Google Scholar] [CrossRef]
- Luo, X.; Mi, Z.; Wu, Y.; Yang, Y.; Hu, H.J.K. Effect of austenitizing temperature on the work hardening behavior of air-hardening steel LH800. Metals 2022, 12, 1026. [Google Scholar] [CrossRef]
- Fang, X.; Wu, Y.; Yang, X.; Yang, Y.; Cheng, L.; Zhang, Q.; Liu, X.; Mi, Z. Microstructure and mechanical properties of the laser welded air-hardening steel joint. Mater. Charact. 2024, 213, 114048. [Google Scholar] [CrossRef]
- Xu, J.T.; Song, Y.D. Analysis of Life-cycle Fatigue for a Car’s Front Sub-frame. Appl. Mech. Mater. 2011, 63, 361–364. [Google Scholar] [CrossRef]
- Salvati, E. Evaluating fatigue onset in metallic materials: Problem, current focus and future perspectives. Int. J. Fatigue 2024, 188, 108487. [Google Scholar] [CrossRef]
- Misra, R.D.K.; Gao, G.; Zhao, P.; Bai, B. Effect of microstructure on the very high cycle fatigue behavior of a bainite/martensite multiphase steel. Mater. Sci. Eng. A 2015, 630, 1–7. [Google Scholar] [CrossRef]
- Gao, G.; Liu, R.; Fan, Y.; Qian, G.; Gui, X.; Misra, R.; Bai, B. Mechanism of subsurface microstructural fatigue crack initiation during high and very-high cycle fatigue of advanced bainitic steels. J. Mater. Sci. Technol. 2022, 108, 142–157. [Google Scholar] [CrossRef]
- Dai, Y.; Wang, S.; He, Q.; Liu, C.; Wang, X.; Li, X.; Li, L.; Liu, Y.; He, C.; Wang, Q. Effect of microstructure on slip-induced crack initiation and early propagation of martensitic steel during high cycle fatigue. Int. J. Fatigue 2023, 167, 107275. [Google Scholar] [CrossRef]
- Cheng, Z.; Jiang, A.; Cao, C.; Cheng, L.; Yu, W. In-Situ investigation of crack initiation and propagation in bainite-martensite dual-phase microstructures. J. Mater. Res. Technol. 2025, 36, 2640–2651. [Google Scholar] [CrossRef]
- Liu, Y.X.; Chen, H.; Wang, R.Z.; Jia, Y.F.; Tu, S.T. Fatigue behaviors of 2205 duplex stainless steel with gradient nanostructured surface layer. Int. J. Fatigue 2021, 147, 106170. [Google Scholar] [CrossRef]
- Pramanick, A.K.; Das, H.; Lee, J.; Jung, Y.; Cho, H.; Hong, S.; Shome, M. Texture analysis and joint performance of laser-welded similar and dissimilar dual-phase and complex-phase ultra-high-strength steels. Mater. Charact. 2021, 174, 111035. [Google Scholar] [CrossRef]
- Guo, W.; Wan, Z.; Peng, P.; Jia, Q.; Zou, G.; Peng, Y. Microstructure and mechanical properties of fiber laser welded QP980 steel. J. Mater. Res. Technol. 2018, 256, 229–238. [Google Scholar] [CrossRef]
- Xu, W.; Westerbaan, D.; Nayak, S.S.; Chen, D.L.; Goodwin, F.; Zhou, Y. Tensile and fatigue properties of fiber laser welded high strength low alloy and DP980 dual-phase steel joints. Mater. Des. 2013, 43, 373–383. [Google Scholar] [CrossRef]
- Parkes, D.; Xu, W.; Westerbaan, D.; Nayak, S.S.; Zhou, Y.; Goodwin, F.; Bhole, S.; Chen, D.L. Microstructure and fatigue properties of fiber laser welded dissimilar joints between high strength low alloy and dual-phase steels. Mater. Des. 2013, 51, 665–675. [Google Scholar] [CrossRef]
- Xie, X.; Li, J.; Jiang, W.; Dong, Z.; Tu, S.; Zhai, X.; Zhao, X. Nonhomogeneous microstructure formation and its role on tensile and fatigue performance of duplex stainless steel 2205 multi-pass weld joints. Mater. Sci. Eng. A 2020, 786, 139426. [Google Scholar] [CrossRef]
- Wang, M.; Wu, Y.; Chang, J.; Mi, Z. Microstructural evolution and hydrogen embrittlement susceptibility in laser-welded joints of oxidation-resistant press-hardened steel. Int. J. Hydrogen Energy 2025, 101, 1209–1220. [Google Scholar] [CrossRef]
- GB/T 3075-2021; Metallic Materials—Axial Force-Controlled Fatigue Test Method. Standards Press of China: Beijing, China, 2021.
- Strakova, D.; Jambor, M.; Novy, F.; Trsko, L. Microstructure evolution in the heat affected zone of the S960MC weld joint. Int. J. Adv. Manuf. Technol. 2025, 139, 3015–3025. [Google Scholar] [CrossRef]
- Dong, Y.; Qi, X.Y.; Du, L.X.; Yan, L.; Misra, R.D.K. Effect of Welding Thermal Cycle on Microstructural Characteristics and Toughness in Simulated Heat Affected Zone of Low-C Medium-Mn High Strength Steel. J. Mater. Eng. Perform. 2022, 31, 2653–2663. [Google Scholar] [CrossRef]
- de Almeida, D.T.; Clarke, T.G.R.; de Souza, J.H.C.; de Lima, M.S.F.; Mohrbacher, H. The effect of laser welding on microstructure and mechanical properties in heavy-gage press hardening steel alloys. Mater. Sci. Eng. A 2021, 821, 141341. [Google Scholar] [CrossRef]
- Xue, J.; Guo, W.; Zhang, Y.; Xia, M.; Jia, Q.; Chi, J.; Shi, J.; Wu, Y.; Zhang, H. Local microstructure and mechanical characteristics of HAZ and tensile behavior of laser welded QP980 joints. Mater. Sci. Eng. A 2022, 854, 143862. [Google Scholar] [CrossRef]
- Amar, A.; Wang, M.; Huang, R.; Zhang, L.; Lu, Y. Ultra-strong and ductile medium entropy alloy with a dual heterogeneous microstructure. Acta Mater. 2025, 284, 120645. [Google Scholar] [CrossRef]
- Kubin, L.P.; Mortensen, A. Geometrically necessary dislocations and strain-gradient plasticity: A few critical issues. Scr. Mater. 2003, 48, 119–125. [Google Scholar] [CrossRef]
- Calcagnotto, M.; Ponge, D.; Demir, E.; Raabe, D. Orientation gradients and geometrically necessary dislocations in ultrafine grained dual-phase steels studied by 2D and 3D EBSD. Mater. Sci. Eng. A 2010, 527, 2738–2746. [Google Scholar] [CrossRef]
- Fang, X.; Wu, Y.X.; Yang, X.Y.; Yang, Y.G.; Liu, X.Y.; Chen, F.D.; Mi, Z.L. Enhancing the Strength and Ductility of Air-Hardening Steel by Introducing Fibrous M-A Islands in Bainitic Ferrite. Mater. Sci. Eng. A 2025, 942, 148742. [Google Scholar] [CrossRef]
- Zhang, X.; Miyamoto, G.; Toji, Y.; Nambu, S.; Koseki, T.; Furuhara, T. Orientation of austenite reverted from martensite in Fe-2Mn-1.5Si-0.3C alloy. Acta Mater. 2017, 144, 601–612. [Google Scholar] [CrossRef]
- Zhang, X.; Miyamoto, G.; Toji, Y.; Zhang, Y.; Furuhara, T. Role of cementite and retained austenite on austenite reversion from martensite and bainite in Fe-2Mn-1.5Si-0.3C alloy. Acta Mater. 2021, 209, 116772. [Google Scholar] [CrossRef]
- Ramesh, R.; Dinaharan, I.; Ravikumar, R.; Akinlabi, E.T. Microstructural characterization and tensile behavior of Nd:YAG laser beam welded thin high strength low alloy steel sheets. Mater. Sci. Eng. A 2020, 780, 139178. [Google Scholar] [CrossRef]
- Jiang, C.; Wang, M.; Zhang, Y.; Wu, Y.X.; Yang, Y.; Jiang, H.; Bai, L.; Zhang, Y.; Mi, Z. Fatigue crack initiation and competitive crack propagation behavior in 500 MPa grade automobile beam steel. J. Mater. Res. Technol. 2023, 24, 2595–2610. [Google Scholar] [CrossRef]
- Tian, J.; Wang, W.; Li, H.; Yang, K.; Jiang, Z. Understanding main factors controlling high cycle fatigue crack initiation and propagation of high strength maraging stainless steels with Ti addition. Mater. Sci. Eng. A 2021, 805, 140589. [Google Scholar] [CrossRef]
- Li, H.F.; Zhang, P.; Zhang, Z.F. A new fatigue crack growth mechanism of high-strength steels. Mater. Sci. Eng. A 2022, 840, 142969. [Google Scholar] [CrossRef]
- Li, W.P.; He, B.B.; Sun, Y.H.; Yen, H.W.; Huang, M.X.; Jiang, C. Revealing the roles of martensitic transformation in affecting the fatigue resistance of austenitic stainless steel with heterogeneous grain size distribution. Scr. Mater. 2024, 246, 116029. [Google Scholar] [CrossRef]
- Yuan, C.; Li, S.; Huang, J.; Lin, X.; Chen, J. Effect of hierarchical martensitic microstructure on fatigue crack growth behavior of ultra-high strength hot stamping steel. Mater. Charact. 2021, 174, 111041. [Google Scholar] [CrossRef]
- Kim, S.; Lee, S.; Lee, B.S. Effects of grain size on fracture toughness in transition temperature region of Mn-Mo-Ni low-alloy steels. Mater. Sci. Eng. A 2003, 359, 198–209. [Google Scholar] [CrossRef]
- Gao, Q.; Sang, B.; Wang, W.; Wang, Q.; Ren, J.; Lu, X.; Qiao, J. In-situ study of dislocation coordinated plastic deformation mechanism in as-cast Ni33Co40Mn27 medium entropy alloy. Mater. Sci. Eng. A 2025, 924, 147878. [Google Scholar] [CrossRef]
- Veerababu, J.; Nagesha, A.; Shankar, V. Slip to twinning to slip transition in polycrystalline BCC-Fe: Effect of grain size. Phys. B 2024, 694, 416465. [Google Scholar] [CrossRef]


Disclaimer/Publisher’s Note: The statements, opinions and data contained in all publications are solely those of the individual author(s) and contributor(s) and not of MDPI and/or the editor(s). MDPI and/or the editor(s) disclaim responsibility for any injury to people or property resulting from any ideas, methods, instructions or products referred to in the content. |
© 2026 by the authors. Licensee MDPI, Basel, Switzerland. This article is an open access article distributed under the terms and conditions of the Creative Commons Attribution (CC BY) license.