Abstract
This study reports the fabrication of copper-based metal matrix composites reinforced with a combination of micro- and nano-sized titanium carbide (TiC) particles using the powder metallurgy route. The micro-TiC content was maintained at 5 wt.%, while the nano-TiC addition was systematically varied between 1 and 3 wt.% in increments of 1 wt.%. The consolidation of the blends was achieved by uniaxial compaction at 500 MPa, followed by sintering in a nitrogen atmosphere at 750–900 °C for 2 h. Tribological assessment under dry sliding conditions was performed using a pin-on-disk apparatus. Structural and microstructural examinations using X-ray diffraction (XRD), scanning electron microscopy (SEM), and energy-dispersive spectroscopy (EDS) confirmed a uniform incorporation of the reinforcements within the Cu matrix. The incorporation of nano-TiC up to 2 wt.% significantly enhanced density, hardness, and wear resistance, after which a marginal decline was observed. SEM analysis of worn surfaces revealed that adhesive wear, abrasion, and delamination were the primary wear mechanisms. To better understand the relationship between processing conditions and material responses, response surface methodology (RSM) was employed. The developed models for density, hardness, and wear loss showed good agreement with the experimental results, with confirmatory tests yielding errors of 1.59%, 2.06%, and 2%, respectively, thereby validating the approach’s reliability.
1. Introduction
Copper and its alloys are widely utilized as engineering materials owing to their excellent thermal and electrical conductivity, superior corrosion resistance, and ease of fabrication [1]. Despite these advantages, their relatively low hardness, limited strength, and poor tribological performance restrict their use in demanding environments. To overcome these shortcomings, researchers have increasingly explored copper-based composites, in which hard ceramic or carbonaceous reinforcements are introduced to enhance mechanical and tribological performance. Reported reinforcements generally fall into two main categories: (i) ceramic particles such as oxides [2], carbides [3], and borides [4], and (ii) carbonaceous additives such as graphite, graphene, and carbon nanotubes [5].
Numerous studies have demonstrated the benefits of introducing hard ceramic reinforcements into copper. For example, Chmielewski et al. [6] compared spark plasma sintered (SPS) and hot-pressed Cu-SiC composites, highlighting the superior bonding achieved via SPS. Gular et al. [7] investigated alumina-reinforced Cu composites and observed enhanced mechanical and electrical properties when silver-coated Al2O3 was incorporated. Similarly, Guo et al. [8] reported that adding up to 3 vol.% CrB2 to copper improved its strength, although excessive reinforcement led to degradation of properties related to agglomeration. Buytoz et al. [9] synthesized Cu–TiC composites by hot pressing and powder metallurgy, finding that hardness consistently increased with TiC content, while electrical conductivity peaked at lower reinforcement levels. Akbarpour et al. [10] demonstrated that nano-SiC additions improved both hardness and wear resistance up to 2 vol.%. Rahimian et al. [11] showed that finer alumina particles yielded higher hardness and strength compared to coarser ones. Saber et al. [12] investigated nano-TiO2-reinforced Cu composites and confirmed improvements in hardness and corrosion resistance. Likewise, Wu et al. [13] reported that the addition of TiC, in combination with B4C, significantly enhanced the wear resistance of Cu composites.
From this literature, it is evident that copper composites offer great potential, yet the development of novel reinforcements and hybrid approaches remains a priority. Notably, the combination of micro- and nano-sized titanium carbide (TiC) has not been extensively investigated for tribological applications. However, TiC is well recognized for providing high hardness and favorable interfacial bonding with Cu. The incorporation of micron-sized TiC can improve load-bearing capacity during sliding, while nano-TiC can refine the microstructure and enhance hardness. However, achieving a homogeneous distribution of such fillers is challenging and critically influences the final properties of the composites [14].
Powder metallurgy (PM) is widely recognized as an efficient processing route for fabricating copper composites, as it ensures relatively uniform reinforcement dispersion, lower processing temperatures that suppress intermetallic formation, and the potential for near-net-shape component production, thereby reducing manufacturing costs [15].
In addition to experimental investigations, statistical modeling approaches, such as response surface methodology (RSM), have been increasingly applied to analyze and optimize the effects of processing parameters on composite properties. RSM provides a robust framework for quantifying the impact and interactions of variables such as reinforcement fraction and sintering conditions, enabling the prediction of performance outcomes [16,17,18].
From a microstructural perspective, the performances of Cu–TiC composites are strongly governed by the nature of the Cu–TiC interface. Previous studies have shown that TiC exhibits good interfacial compatibility with copper, characterized by mechanical interlocking and limited interfacial reactions due to TiC’s thermodynamic stability [9,13]. Literature indicates that Cu–TiC composites achieve the best balance between strength, hardness, and functional properties at moderate TiC contents (≈10 wt.%), where micron-sized TiC enhances load-bearing and wear resistance. At the same time, nano-sized TiC promotes grain refinement and strengthening, although excessive TiC, particularly at the nanoscale, can lead to agglomeration, porosity, and a loss of ductility [19,20].
Considering these factors, the present study focuses on fabricating Cu-based composites reinforced with 5 wt.% micro-TiC and varying contents (1–3 wt.%) of nano-TiC using powder metallurgy. The combined effects of nanoparticle addition and sintering temperature on tribological performance are systematically examined. Worn surface characterization is conducted using SEM to elucidate the dominant wear mechanisms. At the same time, RSM is employed to establish correlations between processing parameters and key responses, such as density, hardness, and wear loss.
2. Materials and Methods
2.1. Raw Materials
For the present study, commercially available micron-sized copper powder (supplied by SRL Pvt. Ltd., Mumbai, India) with a stated purity of 99.9% and an average particle size of 76 µm was used as the matrix material. Titanium carbide (TiC) powders in both micro- and nano-sized forms, also procured from SRL Pvt. Ltd., were employed as reinforcements. According to the manufacturer’s specifications, the micro-sized TiC (TiCµ) particles have an average particle size in the range of 10–30 µm, whereas the nano-sized TiC (TiCn) particles possess a nominal particle size of <100 nm. Representative SEM images of the raw powders, obtained using a scanning electron microscope (SEM, JEOL JSM-6510LV, Tokyo, Japan) operated at 15 kV in secondary-electron mode, are shown in Figure 1a–c. Phase identification was conducted by X-ray diffraction (XRD, Shimadzu XRD-6100, Kyoto, Japan) with Cu Kα radiation (λ = 1.5406 Å), operating at 40 kV and 30 mA. Data were collected over a 2θ range of 10–80° at a scan rate of 0.1°/s and processed using PMGR software (part of PCXRD, Shimadzu Corporation, Kyoto, Japan; version 7.0).
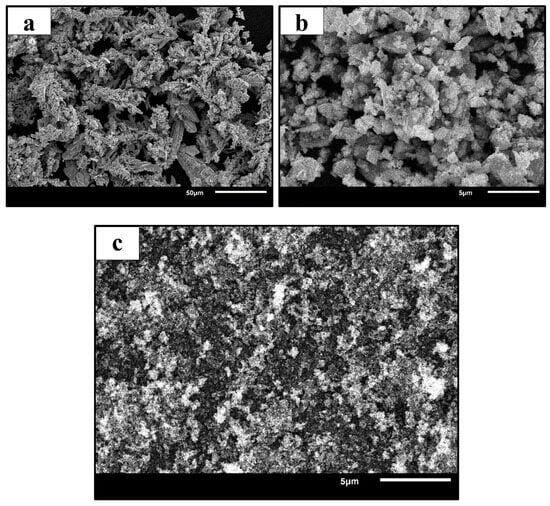
Figure 1.
SEM images of the initial powders showing (a) Cu particles, (b) micro-sized TiC particles, and (c) nano-sized TiC particles.
2.2. Blending of Powders
Hybrid Cu-TiC composites were synthesized by fixing the content of micron-sized TiC at 5 wt.% for all compositions, while the amount of nano-TiC was varied between 1 and 3 wt.% in steps of 1 wt.%. The complete composition of the different samples is provided in Table 1. The powders were weighed using a digital balance (Precisa ES 225SM-DR, Dietikon, Switzerland) according to the desired weight fractions and subsequently mixed in a vibratory ball mill (Fritsch Pulverisette MM-1552, Idar-Oberstein, Germany) at 300 rpm for 5 h. Hardened stainless-steel balls of 10 mm diameter were used as the grinding media, and the ball-to-powder ratio (BPR) was maintained at 10:1 to ensure homogeneous mixing [14,21,22]. Although the composite compositions are expressed in terms of weight fraction, the corresponding volume fractions were also considered due to the density difference between Cu (≈8.96 g/cm3) and TiC (≈4.9 g/cm3). Based on these densities, the total TiC volume fraction in the composites lies approximately in the range of 10–18 vol.%, depending on the nano-TiC content. Such volume fractions were deliberately selected to ensure effective load transfer, improved hardness, and enhanced wear resistance, while remaining within the range commonly reported for Cu-TiC composites processed by powder metallurgy.

Table 1.
Composition details of synthesized Cu-TiC composites containing fixed 5 wt.% TiCµ and varying TiCn content (1–3 wt.%).
2.3. Powder Compaction and Sintering in a Nitrogen Environment
The blended powders were compacted into cylindrical green pellets of 12 mm diameter using a manually operated uniaxial hydraulic press (Type KE, Sr. No. 1327, Kimaya Engineers, Mumbai, India). A compaction pressure of 500 MPa was applied at room temperature (~23 °C) with a dwell time of 25 s. Zinc stearate (C36H70O4Zn) was used as a die lubricant to minimize friction, prevent cold welding of Cu particles along the die walls, and facilitate the easy ejection of compacts. The initial height of the green pellets for all compositions is summarized in Table 1.
The green compacts were sintered for 2 h in a tubular electric furnace at four different temperatures (750, 800, 850, and 900 °C). Sintering was carried out under a continuous nitrogen flow of 1 L/min to protect against oxidation. After sintering, the specimens were furnace-cooled to room temperature. The overall fabrication route adopted in this investigation is schematically represented in Figure 2 [21].
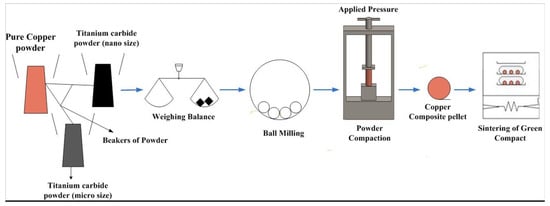
Figure 2.
Schematic representation of the fabrication process for Cu-TiC composites by powder metallurgy.
2.4. Density Measurement
The sintered density of pure Cu and Cu–TiC composites was determined using Archimedes’ principle with a high-precision digital balance equipped with an integrated densiometer (Precisa, Dietikon, Switzerland, Model ES225SM-DRSCS, 5-digit resolution). Measurements were carried out at room temperature using distilled water as the immersion medium. For each specimen, density measurements were repeated four times, and the reported values correspond to the average of these measurements. The repeat measurements exhibited minimal scatter, indicating good measurement repeatability and reliability.
2.5. Hardness Measurement
The hardness of the sintered composites was evaluated using a digital Rockwell hardness tester (Model TRS-DM, Krutam Techno, Ahmedabad, India) under a 100 kgf load, in accordance with ASTM E18-15 [23]. All measurements were conducted at room temperature (~30 °C). For each specimen, hardness was measured at four locations on the polished surface, and the reported value represents the mean hardness. The variation among repeated measurements was slight, confirming the consistency and reliability of the hardness data.
2.6. Pin-On Disk Wear Test
The tribological behavior of the fabricated composites was examined using a pin-on-disk wear tester (Model TR-201 CL, Ducom, Bangalore, India) in compliance with ASTM G99-95a (reapproved 2000) [24]. Disk specimens with a diameter of 12 mm and a thickness of 5 mm were prepared and polished with 600-grit emery paper before testing. The tests were carried out at ambient temperature (~30 °C) under a normal load of 40 N, with the specimen sliding against an EN32 steel disk (case-hardened, surface hardness is 65 HRC, core hardness significantly lower, 80 mm diameter, 8 mm thickness) rotating at 500 rpm for 6.25 min. Further, the pin was positioned at a fixed wear track diameter of 76 mm (track radius of 38 mm).
2.7. Experimental Design
To analyze the influence of processing factors on composite performance, Response Surface Methodology (RSM) was employed. A Central Composite Design (CCD) was specifically adopted to capture both linear and interaction effects of the selected parameters. The concentration of nano-TiC and the sintering temperature were considered as independent input variables, while the content of micro-TiC was fixed at 5 wt.%. CCD was chosen because it can generate a second-order model with improved reliability by including additional axial and center points [18].
The levels of the process parameters are summarized in Table 2. The response variables selected for this study were density, hardness, and wear loss. The design matrix and the corresponding experimental observations for the considered responses are presented in Table 3. Multiple experimental runs at the center point (2 wt.% TiCn and 825 °C) were intentionally performed as part of the CCD to estimate experimental (pure) error and to assess the adequacy and reliability of the developed RSM models.
Table 2.
Input variables and Design of Experiments (DOE) levels limits.
Table 3.
Matrix of design (central composite design).
3. Results
3.1. Characterization of As-Received Powders and Composites
Figure 1 illustrates the SEM micrographs of the as-received Cu, TiCµ, and TiCn powders. The micrograph in Figure 1a shows that the Cu powders possess a relatively uniform size distribution with a mean particle size of ~76 μm and exhibit a typical dendritic morphology [4,5,6,7,8,9]. The TiCµ powders (Figure 1b) reveal angular and irregularly shaped particles ranging between 10 and 30 μm in size. In addition, nanoscale TiC powder was used in this study, as the incorporation of nanometric reinforcements generally refines the microstructure of sintered composites, thereby enhancing their mechanical performance [2].
Figure 3a depicts the XRD spectrum of the as-received Cu powder, which shows the characteristic peaks corresponding to Cu (111), Cu (200), and Cu (220) at diffraction angles of 2θ = 44.5°, 52.5°, and 75.2°, respectively [5]. The XRD patterns of TiCµ and TiCn powders are presented in Figure 3b,c. For both powders, distinct peaks at 2θ ≈ 35.9°, 41.9°, and 60.7° were observed, representing the (111), (200), and (220) planes of TiC [9]. These results verify the crystalline phases of the reinforcements.
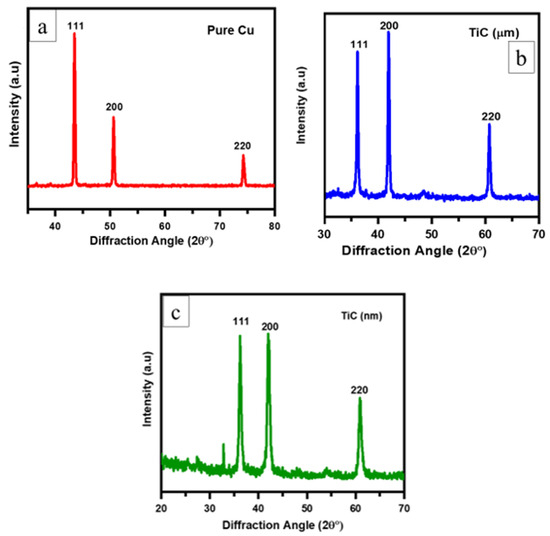
Figure 3.
XRD analysis (a) Pure Cu powder (b) TiCµ powder, (c) TiCn powder.
Figure 4 presents the XRD profiles of the Cu–TiCµ–TiCn composites fabricated with different reinforcement ratios. The diffraction peaks confirm the presence of both Cu and TiC phases, with no evidence of additional phase formation. The addition of TiC to the Cu matrix did not result in the formation of new phases, indicating that no chemical reactions occurred during sintering. Moreover, with increasing nano-TiC content, the relative intensity of TiC peaks became more pronounced, consistent with earlier reports [5,6]. Importantly, no oxide-related peaks were detected, suggesting that the nitrogen atmosphere effectively prevented oxidation. The absence of secondary phases and the uniform TiC distribution observed by SEM and XRD suggest that TiC remains chemically stable during sintering and forms a predominantly mechanical interface with the Cu matrix, consistent with reported Cu–TiC interfacial behavior [9,13]. Thus, it can be concluded that the fabricated materials are Cu–TiC composites, with TiC serving solely as a reinforcement phase.
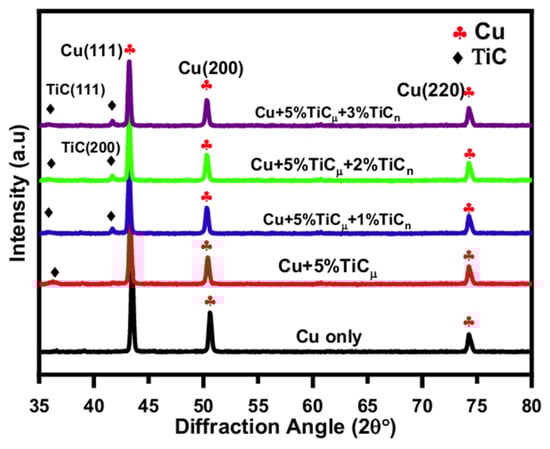
Figure 4.
XRD peaks pattern of Cu-5 wt.% TiCµ % TiCn (x = 0, 1, 2 and 3) composites.
Figure 5 and Figure 6 show elemental mapping of a sintered sample containing 5 wt.% TiCµ and 2 wt.% TiCn. The elemental distribution maps indicate that the TiC phase, present as TiCµ particles and TiCn-rich agglomerates, is broadly and homogeneously distributed across the composite cross-section at the microscale. The presence of Cu, Ti, and C was consistently observed across the scanned regions, confirming the expected phase composition of the composites.
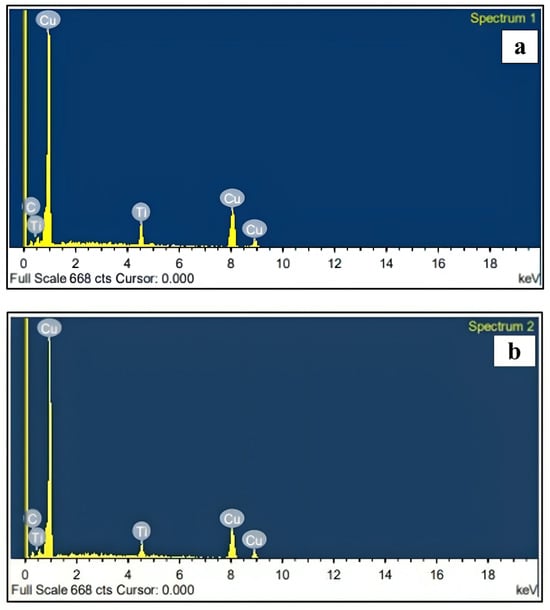
Figure 5.
EDS analysis of prepared composites: (a) Cu-5% TiCµ composite, (b) Cu-5% TiCµ-1% TiCn.
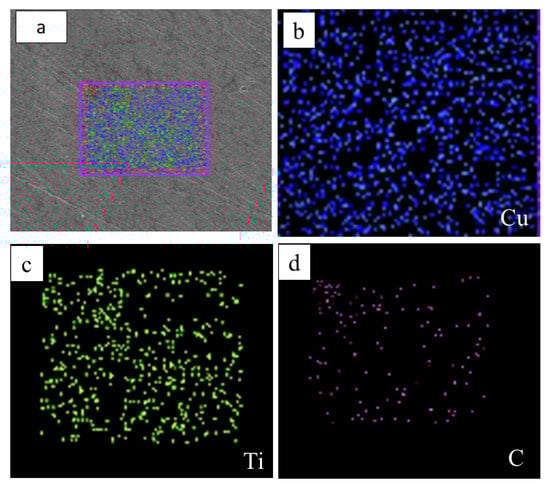
Figure 6.
Elemental mapping of the Cu + 5 wt.% TiCµ + 2 wt.% TiCn composite showing the distribution of (a) Mix, (b) Cu, (c) Ti, and (d) C.
3.2. Sintered Density and Hardness
The effect of TiC content on the density and hardness of the composites is presented in Figure 7a. The introduction of 5 wt.% TiCµ reduced the sintered density compared to pure Cu. This reduction is directly related to the lower density of the reinforcement compared to that of copper. A further decrease in density was recorded as the nano-TiC fraction increased, with the lowest density observed for the composite containing 3 wt.% TiCn. The reduction is attributed to the lower intrinsic density of TiCn and, more importantly, to agglomeration at higher nanoparticle concentrations, which hinders particle packing and densification during sintering [9]. Lower densification at higher reinforcement contents aligns with observations in copper-based sintering studies, where particle crowding and agglomeration reduce achievable density [22].
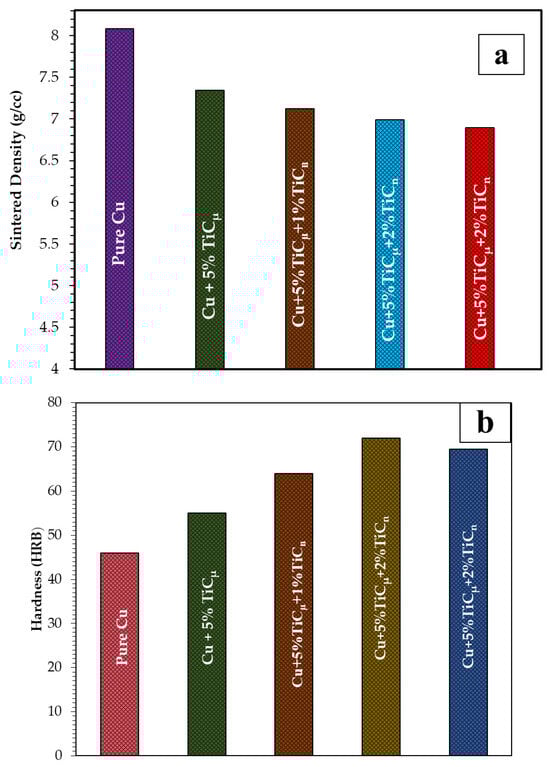
Figure 7.
Effect of TiC reinforcement on (a) sintered density and (b) Rockwell hardness of Cu–TiCµ–TiCn composites as a function of nano-TiC (TiCn) content. Both measurements were performed at room temperature (~30 °C) under ambient atmospheric conditions.
Figure 7b depicts the Rockwell hardness of the composites. The incorporation of TiCµ into the Cu matrix resulted in a marked increase in hardness, primarily due to (a) the intrinsic hardness of TiC particles, and (b) their uniform dispersion within the relatively softer copper matrix. These findings align with previous reports [8]. The introduction of TiCn further enhanced the hardness of the composites up to 2 wt.%, beyond which hardness declined. The observed improvement can be explained by two mechanisms: (i) increased dislocation density generated by the mismatch in thermal expansion coefficients of TiC and Cu, and (ii) grain refinement resulting from the homogeneous dispersion of nanoparticles [10]. However, when the TiCn content exceeded 2 wt.%, the composites exhibited a decline in hardness. This deterioration is primarily attributed to nanoparticle agglomeration, weak interfacial bonding, and reduced sinterability at high reinforcement levels. Similar outcomes have been reported by other investigators [12].
3.3. Wear Behavior of Cu and Cu-Sand Composites
3.3.1. Wear Loss
Figure 8 presents the wear loss of Cu-TiC composites sintered at 900 °C under dry sliding conditions. Wear resistance improved markedly with the addition of TiC due to its high hardness and ability to distribute the applied load. A mechanically mixed layer (MML) formed during sliding, incorporating TiC particles and enhancing surface protection, while plastic deformation of the Cu matrix contributed to material removal.
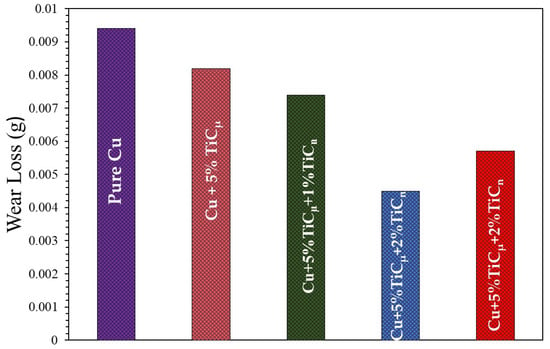
Figure 8.
Wear loss of Cu–TiCµ–TiCn composites sintered at 900 °C and tested under dry sliding conditions at a normal load of 40 N, sliding speed of 2.0 m/s, and sliding distance of 750 m.
The Cu–5TiCµ composite showed reduced wear compared with pure Cu, but clustering of coarse TiCµ particles limited surface coverage. Nano-TiC additions further decreased wear loss through more uniform load distribution, with 2 wt.% TiCn provides the lowest wear. At higher nano-TiC content, agglomeration reduced the effectiveness of the protective layer, increasing material removal. These results align with Archard’s wear model [18] and previous reports on load-bearing contributions of hard reinforcements [22,25].
3.3.2. Worn Surfaces Analysis
The worn surfaces were examined to identify the dominant wear mechanisms. Pure Cu (Figure 9a) exhibited deep grooves, severe plastic deformation, and delamination, indicating strong contributions from adhesive and abrasive wear [15]. These features are consistent with Archard’s wear model and the abrasive wear descriptions of Kruschov and Babichev [16,17,18,19,20,21], which highlight the influence of material hardness on wear resistance.
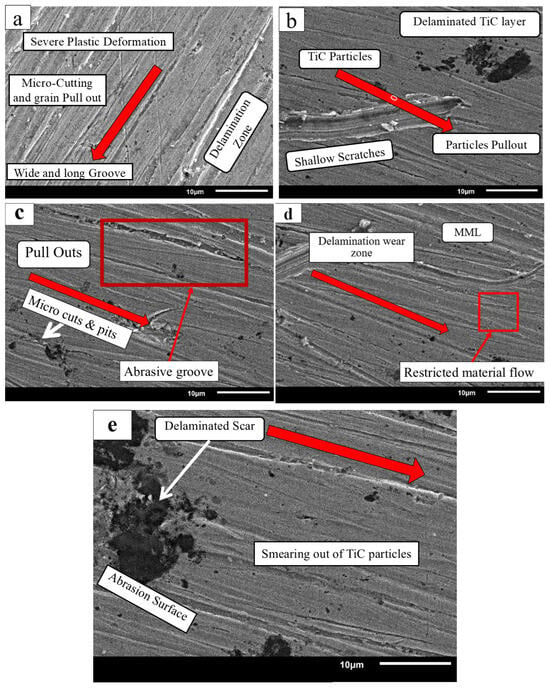
Figure 9.
SEM micrographs of worn surfaces after dry sliding wear tests conducted at a normal load of 40 N, sliding speed of 2.0 m/s, and sliding distance of 750 m: (a) pure Cu, (b) Cu + 5 wt.% TiCµ, (c) Cu + 5 wt.% TiCµ + 1 wt.% TiCn, (d) Cu + 5 wt.% TiCµ + 2 wt.% TiCn, and (e) Cu + 5 wt.% TiCµ + 3 wt.% TiCn. Arrows indicate the sliding direction.
For the Cu–5TiCµ composite (Figure 9b), the presence of hard TiCµ particles reduced delamination and produced shallower grooves compared with pure Cu. The addition of nano-TiC further improved surface integrity: the 1 wt.% TiCn composite (Figure 9c) showed reduced adhesion and a shift toward milder abrasive wear due to better particle distribution [25]. The 2 wt.% TiCn composite (Figure 9d) displayed the smoothest surface, with narrow, shallow grooves, indicating effective load sharing and restricted plastic deformation. At 3 wt.% TiCn (Figure 9e), the worn surface became rougher, and material removal increased, likely due to nanoparticle agglomeration creating weak interfacial regions. Nevertheless, its wear remained lower than that of pure Cu [25,26].
3.4. Response Surface Methodology (RSM)
Response Surface Methodology (RSM) is a well-established statistical approach that combines mathematical modeling and regression analysis to evaluate the relationship between experimental inputs and measured outputs. It not only enables the identification of significant parameters but also facilitates optimization of process conditions in systems with multiple interacting variables. For a successful application, the following steps are typically followed:
- Defining the key process parameters that influence the responses.
- Establishing the range of variation for these parameters.
- Designing the experimental matrix based on a suitable statistical model.
- Conducting experiments in accordance with the design.
- Developing regression equations to describe the empirical relationship.
- Validating the predictive capability of the model using confirmatory tests.
In the present study, the experimental design was generated using Design Expert software version 13. The experimental matrix was prepared as shown in Table 2 to investigate the influence of input factors on the sintered density, hardness, and wear loss of the Cu–TiC composites.
The RSM models for each response variable, namely, density, hardness, and wear loss, were established using second-order polynomial regression equations. The selected control variables were TiCn concentration (A) and sintering temperature (B), with the TiCµ reinforcement content fixed at 5 wt.% throughout the study. This allowed the isolated examination of the effect of nano-TiC content and sintering temperature on the performance characteristics of the composites.
Accordingly, the regression equations incorporated both linear and interaction terms between variables A and B. These models serve as predictive tools for evaluating how reinforcement level and sintering conditions collectively affect the material responses. The coded form of the variables used in the regression analysis is summarized as:
A = TiCn concentration (wt.%)
B = Sintering temperature (°C)
Statistical Analysis and Model Validation
As outlined earlier, three key aspects must be examined when applying RSM:
- ✓
- the statistical significance of the regression models;
- ✓
- the significance of individual coefficients in the model;
- ✓
- the adequacy of the model through lack-of-fit testing.
These checks were performed using Analysis of Variance (ANOVA). Table 4 summarizes the ANOVA results for sintered density. The p-value for the density model was less than 0.05, indicating that the model is statistically significant at the 95% confidence level. Moreover, the p-values for the individual terms indicate that factors A (TiCn concentration), B (sintering temperature), A2, and B2 exert a statistically significant effect, as their p-values are <0.05. The lack-of-fit test further supports model adequacy. The computed F-ratio for lack of fit was 4.51, which is below the tabulated F-value of 9.01 (95% confidence), confirming that the regression adequately represents the experimental data.
Table 4.
ANOVA table for Sintered density.
The predictive performance of various models for sintered density is compared in Table 5. The quadratic model exhibits the highest coefficient of determination (R2), along with high adjusted R2 and predicted R2 values, indicating a strong correlation between the experimental and expected outcomes.
Table 5.
Density Model Summary Statistics.
A similar analysis was performed for Rockwell hardness, as presented in Table 6. The ANOVA results confirm that the hardness model is significant (p < 0.05). Once again, the terms A, B, A2, and B2 emerged as essential contributors. The lack-of-fit F-value was 1.05, substantially lower than the standard F-value of 9.01, verifying the model’s adequacy. The model summary (Table 7) reveals that the quadratic model provides the best predictive capability, with consistently high R2 values.
Table 6.
ANOVA table for Hardness.
Table 7.
Hardness Model Summary Statistics.
For wear loss, the ANOVA summary (Table 8) shows that the overall model is significant (p < 0.05). Among the model terms, A, B, and A2 were found significant, while the interaction term AB and quadratic term B2 were not, as their p-values exceeded 0.05. The lack-of-fit F-value of 2.50 was again well below the critical value of 9.01, thereby validating the adequacy of the quadratic wear loss model. Table 9 confirms that the quadratic model offers the strongest predictive performance for wear loss, with high values of R2, adjusted R2, and predicted R2.
Table 8.
ANOVA table for Wear.
Table 9.
Wear model Summary Statistics.
3.4.1. Effect Analysis of Process Variables on Hardness, Sintered Density, and Wear Loss
The combined influence of TiCn reinforcement content and sintering temperature on the functional properties of the Cu–TiC composites is illustrated through the response surface plots in Figure 10.
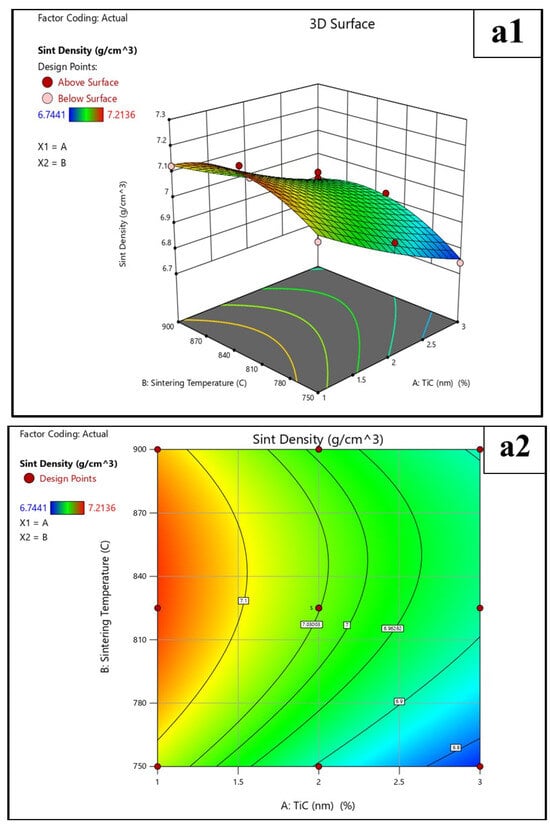
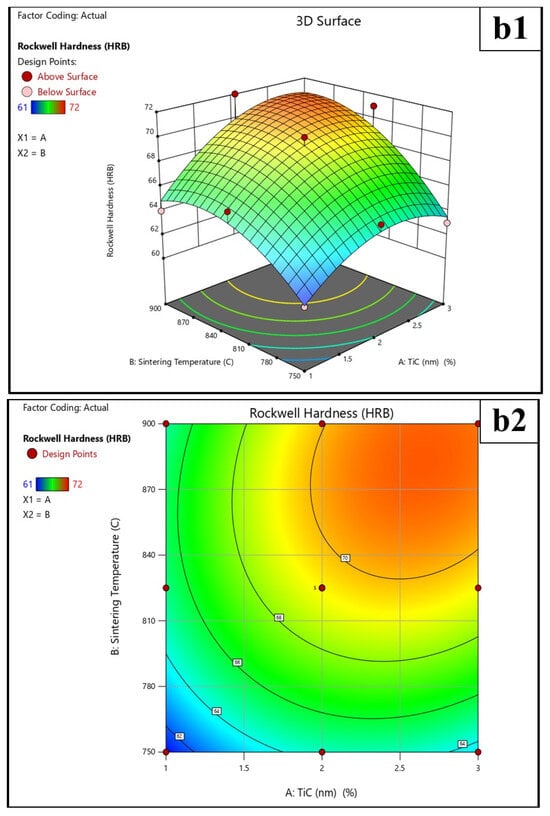
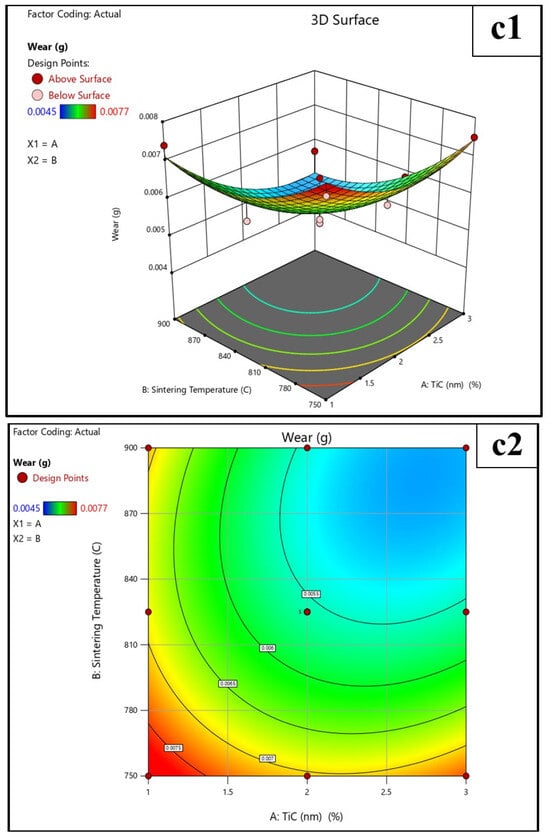
Figure 10.
Three-dimensional and 2D Surface plot for the effect of TiCµ, TiCn concentration, and sintering temperature on (a1,a2) Sintered density, (b1,b2) Rockwell Hardness, and (c1,c2) Wear loss response.
- ✓
- Effect on Sintered Density (Figure 10(a1,a2)):
The addition of TiCn nanoparticles reduces the overall density of the hybrid composites. This trend stems from the lower density of TiC relative to copper, leading to a decrease in bulk density as the reinforcement content increases. Another contributing factor is the tendency of nanoparticles to agglomerate at higher loadings, which creates porosity within the microstructure and obstructs densification. On the other hand, sintering temperature plays a dominant role in improving density. As the temperature increases from 750 °C to 900 °C, the rate of solid-state diffusion increases, leading to enhanced particle rearrangement and neck growth between particles. Pore shrinkage and elimination are also more effective at higher temperatures, thereby increasing the density. The interplay between these two factors means that, while nanoparticle loading reduces density, the adverse effect can be partly compensated by adopting an elevated sintering temperature.
- ✓
- Effect on Hardness (Figure 10(b1,b2)):
Hardness is strongly dependent on reinforcement content. The inclusion of TiCµ (5 wt.%) provides the initial strengthening due to the hard ceramic phase, but the incorporation of TiCn further enhances hardness through grain refinement and dislocation–particle interactions. At an optimum level of ~2 wt.% TiCn nanoparticles are uniformly distributed in the copper matrix, resulting in effective load transfer and dislocation motion restriction. This enhances the composite’s resistance to plastic deformation. Beyond this concentration, however, hardness declines due to nanoparticle agglomeration, leading to poor interfacial bonding and creating stress-concentration zones that serve as easy paths for crack propagation.
Sintering temperature also influences hardness but to a lesser extent than reinforcement content. Higher sintering temperatures enhance atomic diffusion and grain boundary consolidation, thereby improving the bonding between the matrix and reinforcement. However, the trend is relatively flat compared to TiCn concentration, confirming that reinforcement loading is the dominant parameter in hardness optimization.
- ✓
- Effect on Wear Loss (Figure 10(c1,c2)):
Copper’s wear resistance is inherently poor due to its ductile nature. Reinforcement with TiCµ and TiCn significantly reduces wear loss by introducing challenging phases that resist plastic deformation and by forming a mechanically mixed tribolayer during sliding. At 2 wt.% TiCn, the tribological response reaches an optimum, with wear loss being minimized. This can be explained by the fact that uniformly distributed nanoparticles provide effective load-sharing during sliding and delay subsurface crack propagation. At higher loadings (3 wt.%), the agglomerated nanoparticles act as weak zones, destabilizing the tribolayer and increasing material removal.
Sintering temperature further modifies wear response. Samples sintered at ~825 °C showed the best wear resistance, as the microstructure was sufficiently densified to withstand surface deformation without excessive porosity. At 900 °C, although density is higher, excessive grain coarsening may reduce the effectiveness of load transfer at the particle–matrix interface, leading to slightly higher wear. This indicates that an intermediate sintering temperature provides the most favorable balance between densification and microstructural stability.
In summary, the interaction between TiCn content and sintering temperature indicates that optimal performance is achieved with moderate nanoparticle reinforcement (2 wt.%) and an intermediate-to-high sintering temperature (~825 °C).
3.4.2. Validation Test
The adequacy of the developed quadratic models was validated through a combination of statistical indicators and experimental confirmation (as indicated in Figure 11). The high R2, adjusted R2, and predicted R2 values indicated that most of the variability in sintered density (Figure 11a), hardness (Figure 11b), and wear loss (Figure 11c) could be reliably explained by the regression models, with the difference between adjusted and predicted R2 remaining below 0.2, within the acceptable statistical limit. All precision values were greater than 4, confirming a strong signal-to-noise ratio and the robustness of the models. Residual analysis further indicated normal error distribution with no obvious outliers, validating the absence of systematic bias. In addition, confirmatory experiments conducted at randomly selected process conditions showed close agreement between experimental and predicted values, with deviations within ±5%. Taken together, these results confirm that the quadratic models are statistically reliable and can be effectively used to predict and optimize the mechanical and tribological responses of Cu–TiC composites under a wide range of process conditions.
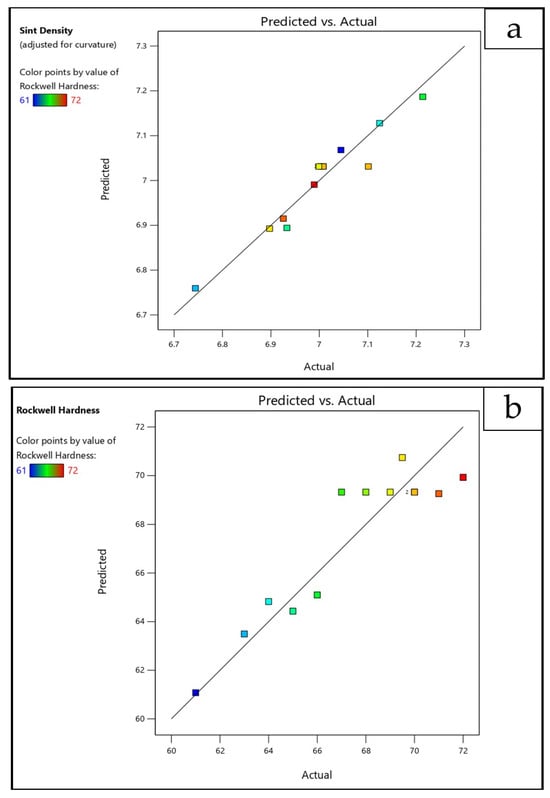
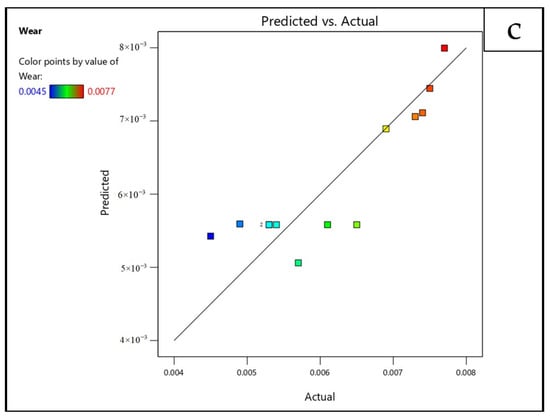
Figure 11.
Predicted vs. actual plot for (a) sintered density, (b) hardness, and (c) wear loss.
3.4.3. Perturbation Plots of Process Parameters
The perturbation plots presented in Figure 12 illustrate the influence of individual process parameters on the selected responses, namely hardness, sintered density (SD), and wear loss (WL), with a central reference point set at 0.00.
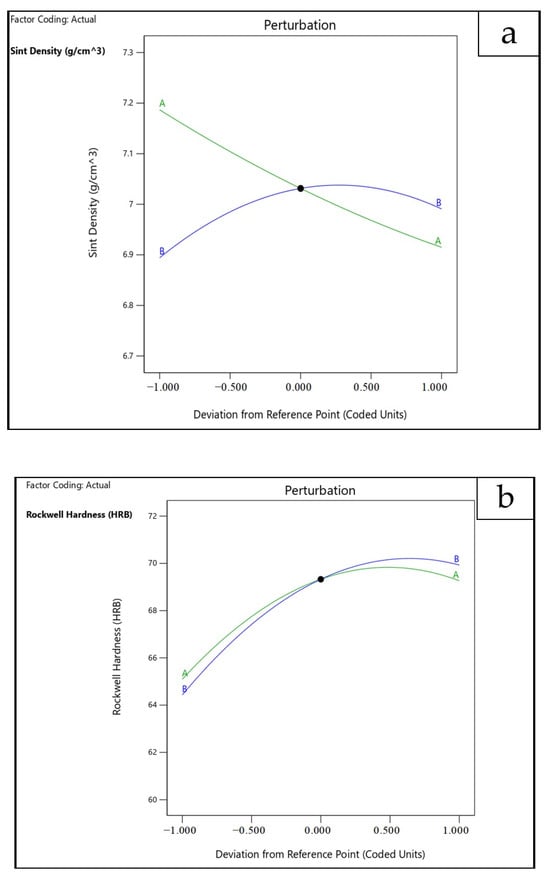
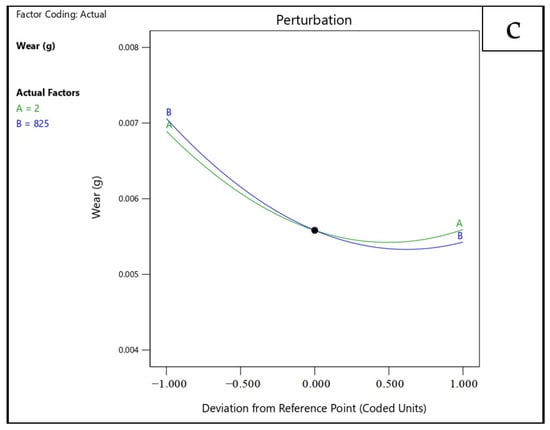
Figure 12.
Perturbation plot depicting the effects of all variables simultaneously with a central reference point of 0.00 on the (a) hardness, (b) sintered density, and (c) wear loss.
As shown in Figure 12a, hardness is positively affected by the incorporation of graphene into the copper matrix. This enhancement is primarily due to the restriction of dislocation mobility imparted by graphene, which acts as a reinforcing agent within the metallic matrix. However, an excessive increase in graphene content results in a decline in hardness, possibly due to agglomeration of graphene platelets and the creation of weak interfacial regions. Such observations are consistent with earlier reports [25].
The variation in sintered density with respect to the process parameters is illustrated in Figure 12b. It is observed that density decreases with increasing graphene addition, which can be attributed to the lower intrinsic density of graphene relative to copper. Conversely, the density increases with higher sintering temperatures. This improvement can be attributed to enhanced diffusion and pore elimination at elevated temperatures, which promote densification. Similar density trends have been documented in the literature [18].
The perturbation plot for wear loss (WL) is shown in Figure 12c. The inclusion of graphene significantly improves wear resistance of the composites up to an optimum level. Beyond 0.2 wt.% graphene, wear resistance decreases, which could result from (a) destabilization of the protective tribolayer at higher graphene contents, and (b) loss of hardness at excessive reinforcement levels (0.3 wt.%). Regarding the sintering temperature, WL shows a decreasing trend up to 900 °C, at which the minimum wear loss is observed. This reduction can be associated with improved densification and mechanical strength achieved at elevated temperatures.
3.4.4. Optimization Analysis of Process Variables
Table 10 presents the defined input constraints and response goals employed for multi-response optimization using the numerical optimization module of Design Expert software. The primary objective was to maximize the beneficial responses, sintered density, and hardness, while minimizing wear loss, thereby ensuring improved overall performance of the fabricated composites.
Table 10.
Constraints to optimize the response.
Based on the experimental dataset and the quadratic regression equations, the optimization module identified the optimal set of process parameters using the desirability function approach. This approach provides a single numerical index ranging from 0 to 1, with values closer to 1 indicating stronger agreement between predicted responses and defined goals. As shown in Table 11, the proposed optimal solution has a relative desirability of 0.706, confirming its suitability for achieving balanced performance across all considered responses.
Table 11.
Numerical optimization and composite desirability values.
The optimal conditions were determined to be a TiCn content of 1.844 wt.% and a sintering temperature of 858.607 °C, which collectively result in a predicted maximum hardness of 68.974 HRB, a sintered density of 7.083 g/cm3, and a minimum wear loss of 0.006 g (depicted in Figure 13). These optimized values clearly demonstrate the efficiency of the RSM-based design strategy in guiding the manufacturing process toward superior mechanical strength and tribological resistance. Moreover, the outcomes serve as a practical reference for fine-tuning reinforcement content and thermal processing in the development of advanced copper-based MMCs.
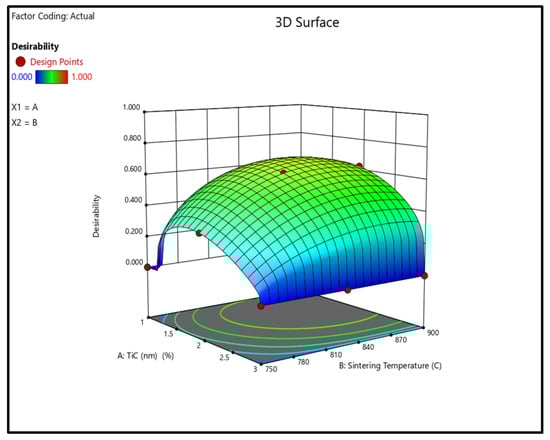
Figure 13.
Desirability plot at optimum process variables.
3.4.5. Experiment Validation on Optimal Process Variable Conditions
To evaluate the reliability of the predicted optimum conditions obtained through the response surface methodology, five confirmatory experiments were performed under the same process settings as recommended by Solution 1 in Table 11. The experimental outcomes are summarized in Table 12, and a direct comparison reveals that the measured responses are in close agreement with the model-predicted values.
Table 12.
Comparison of Experimental and predicted values to verify optimum conditions.
The statistical evaluation of the results was carried out using error analysis and standard deviation calculations. The mean percentage errors between the experimental and predicted responses were 2.032% for sintered density, 2.206% for Rockwell hardness, and 2.214% for wear loss, respectively. The standard deviation (σ) was calculated according to Equation (4):
These relatively low error percentages and standard deviation values confirm the high predictive accuracy of the developed quadratic models. Thus, the RSM approach, coupled with Design-Expert optimization, has been empirically validated as a robust tool for predicting the process–response relationship and guiding the manufacture of Cu–TiC composites with enhanced mechanical and tribological properties.
4. Conclusions
In the present study, copper-based composites reinforced with micro- and nano-sized titanium carbide (TiC) particles were successfully fabricated using the powder metallurgy route. The relationships between processing parameters and composite properties were systematically analyzed using Response Surface Methodology (RSM). The following conclusions can be drawn:
- i.
- Microstructural and phase characterization: XRD, SEM, and EDS analyses confirmed the presence of TiC reinforcement within the copper matrix without the formation of secondary phases. Elemental mapping indicated a broadly homogeneous distribution of TiCµ particles and TiCn-rich regions at the microscale, while localized agglomerates were observed at higher nano-TiC contents. The incorporation of TiC significantly enhanced the composites’ wear resistance.
- ii.
- Physical and mechanical properties: The addition of nano-TiC up to 2 wt.% resulted in notable improvements in relative density, hardness, and wear resistance due to effective load transfer, grain refinement, and increased dislocation density; however, a further increase to 3 wt.% TiCn led to deterioration in properties, primarily due to nanoparticle agglomeration, reduced sinterability, and weakened interfacial bonding.
- iii.
- Tribological behavior and wear mechanisms: Worn surface analysis revealed adhesive wear, abrasive wear, and delamination as the dominant wear mechanisms under dry sliding conditions. The incorporation of nano-TiC reduced the severity of these wear features, particularly at the optimal reinforcement level of 2 wt.%, where a more mechanically stable mixed layer formed.
- iv.
- Model validation and optimization: Confirmatory experiments validated the accuracy of the developed RSM models, with percentage errors of 1.59% for sintered density, 2.06% for hardness, and 2.00% for wear loss, demonstrating the reliability of the predictive approach.
Overall, this study demonstrates that the hybrid incorporation of micro- and nano-sized TiC particles via powder metallurgy is an effective strategy for enhancing the tribological and mechanical performance of copper composites. An optimal nano-TiC content of 2 wt.% was identified as providing superior hardness and wear resistance while maintaining adequate densification.
Author Contributions
Conceptualization, A.U.K., S.A. and M.M.; methodology, S.A., M.M. and A.A. (Ateyah Alzahrani); software, M.M. and M.S.; validation, S.A., M.S., M.M. and A.A. (Ateyah Alzahrani); formal analysis, S.A., A.A. (Ateyah Alzahrani), M.S. and A.U.K.; investigation, A.U.K., M.S., M.M. and A.A. (Ateyah Alzahrani); resources, S.A., A.A. (Ateyah Alzahrani), A.A. (Ahmad Alghamdi) and A.U.K.; data curation, S.A., M.S., M.M. and A.A. (Ateyah Alzahrani); writing—original draft preparation, S.A., M.S., M.M. and A.A. (Ateyah Alzahrani); writing—review and editing, S.A., M.M., A.A. (Ateyah Alzahrani), A.A. (Ahmad Alghamdi) and A.U.K.; visualization, M.S., M.M. and A.A. (Ahmad Alghamdi); supervision, S.A., A.A. (Ateyah Alzahrani) and A.A. (Ahmad Alghamdi); project administration, S.A., A.A. (Ateyah Alzahrani), A.A. (Ahmad Alghamdi) and A.U.K.; funding acquisition, A.U.K., A.A. (Ateyah Alzahrani) and A.A. (Ahmad Alghamdi). All authors have read and agreed to the published version of the manuscript.
Funding
This research work was funded by Umm Al-Qura University, Saudi Arabia under grant number: 25UQU4340327GSSR02.
Institutional Review Board Statement
Not applicable.
Informed Consent Statement
Not applicable.
Data Availability Statement
The original contributions presented in the study are included in the article, further inquiries can be directed to the corresponding authors.
Acknowledgments
The authors extend their appreciation to Umm Al-Qura University, Saudi Arabia for funding this research work through grant number: 25UQU4340327GSSR02.
Conflicts of Interest
The authors declare no conflict of interest.
References
- Davis, J.R. Copper and Copper Alloys; ASM International: Materials Park, OH, USA, 2001. [Google Scholar]
- Arif, S.; Alam, M.T.; Ansari, A.H.; Siddiqui, M.A.; Mohsin, M. Study of mechanical and tribological behaviour of Al/SiC/ZrO2 hybrid composites fabricated through powder metallurgy technique. Mater. Res. Express 2017, 4, 096507. [Google Scholar] [CrossRef]
- Arif, S.; Alam, M.T.; Aziz, T.; Ansari, A.H. Morphological and wear behaviour of new Al–SiCmicro–SiCnano hybrid nanocomposites fabricated through powder metallurgy. Mater. Res. Express 2018, 5, 046534. [Google Scholar] [CrossRef]
- Sathiskumar, R.; Murugan, N.; Dinaharan, I.; Vijay, S.J. Characterization of boron carbide particulate reinforced in situ copper surface composites synthesized using friction stir processing. Mater. Charact. 2013, 84, 16–27. [Google Scholar] [CrossRef]
- Hidalgo-Manrique, P.; Lei, X.; Xu, R.; Zhou, M.; Kinloch, I.A.; Young, R.J. Copper/graphene composites: A review. J. Mater. Sci. 2019, 54, 12236–12289. [Google Scholar] [CrossRef]
- Chmielewski, M.; Nosewicz, S.; Strojny-Nędza, A.; Pietrzak, K.; Jarząbek, D. Investigations of interface properties in copper–silicon carbide composites. Arch. Metall. Mater. 2017, 62, 1561–1566. [Google Scholar] [CrossRef]
- Güler, O.; Varol, T.; Alver, Ü.; Canakci, A. Effect of Al2O3 content and milling time on the properties of silver-coated Cu matrix composites fabricated by electroless plating and hot pressing. Mater. Today Commun. 2020, 24, 101153. [Google Scholar] [CrossRef]
- Guo, X.; Jia, L.; Lu, Z.; Xing, Z.; Xie, H.; Kondoh, K. Preparation of Cu/CrB2 composites with well-balanced mechanical properties and electrical conductivity by ex-situ powder metallurgy. J. Mater. Res. Technol. 2022, 20, 4638–4647. [Google Scholar] [CrossRef]
- Buytoz, S.; Dagdelen, F.; Islak, S.; Kok, M.; Kir, D.; Ercan, E. Effect of the TiC content on microstructure and thermal properties of Cu–TiC composites prepared by powder metallurgy. J. Therm. Anal. Calorim. 2014, 117, 1277–1283. [Google Scholar] [CrossRef]
- Akbarpour, M.R.; Najafi, M.; Alipour, S.; Kim, H.S. Hardness, wear and friction characteristics of nanostructured Cu–SiC nanocomposites fabricated by powder metallurgy route. Mater. Today Commun. 2019, 18, 25–31. [Google Scholar] [CrossRef]
- Rahimian, M.; Ehsani, N.; Parvin, N.; Baharvandi, H.R. The effect of particle size, sintering temperature and sintering time on the properties of Al–Al2O3 composites made by powder metallurgy. J. Mater. Process. Technol. 2009, 209, 5387–5393. [Google Scholar] [CrossRef]
- Saber, D.; Khalil, K.A.; Almajid, A.A.; Allam, N.K.; Fathy, A. Characterization and performance evaluation of Cu-based/TiO2 nanocomposites. Sci. Rep. 2022, 12, 11344. [Google Scholar] [CrossRef]
- Wu, J.; Liu, Y.; Wang, X.; Zhou, S.; Zhang, Y. Influence of synergistic strengthening effect of B4C and TiC on tribological behavior of copper-based powder metallurgy composites. Ceram. Int. 2022, 48, 32709–32720. [Google Scholar]
- Xiang, S.; Du, X.; Liang, Y.; Zhou, M.; Zhang, X. Optimizing phase interface of titanium carbide-reinforced copper matrix composites fabricated by electropulsing-assisted flash sintering. Mater. Sci. Eng. A 2021, 819, 141506. [Google Scholar] [CrossRef]
- Dixit, M.; Srivastava, R. The effect of copper granules on interfacial bonding and properties of copper–graphite composites prepared by flake powder metallurgy. Adv. Powder Technol. 2019, 30, 3067–3078. [Google Scholar] [CrossRef]
- Radhika, N.; Raghu, R. Dry sliding wear behaviour of aluminium Al–Si12Cu/TiB2 metal matrix composite using response surface methodology. Tribol. Lett. 2015, 59, 2. [Google Scholar] [CrossRef]
- Kumar, R.; Chauhan, S. Study on surface roughness measurement for turning of Al7075/10/SiCp and Al7075 hybrid composites by using response surface methodology and artificial neural networking. Measurement 2015, 65, 166–180. [Google Scholar] [CrossRef]
- Alam, M.A.; Hamdan, H.Y.; Azeem, M.; Hussain, P.B.; Salit, M.S.; Khan, R.; Arif, S.; Ansari, A.H. Modelling and optimisation of hardness behaviour of sintered Al/SiC composites using RSM and ANN: A comparative study. J. Mater. Res. Technol. 2020, 9, 14036–14050. [Google Scholar] [CrossRef]
- Zhang, D.; He, X.; Liu, Y.; Bai, F.; Wang, J. The effect of in situ nano-sized particle content on the properties of TiCx/Cu composites. J. Mater. Res. Technol. 2021, 10, 453–459. [Google Scholar] [CrossRef]
- Zhai, Z.; Dong, H.; Li, D.; Wang, Z.; Sun, C.; Chen, C. Effect of TiC Particles on the Properties of Copper Matrix Composites. Inorganics 2024, 12, 120. [Google Scholar] [CrossRef]
- Saberi, Y.; Oveisi, H. Development of novel cellular copper–aluminium composite materials: The advantage of powder metallurgy and mechanical milling approach for lighter heat exchangers. Mater. Chem. Phys. 2022, 279, 125742. [Google Scholar] [CrossRef]
- Shan, M.; Khairi Faiz, M.; Muhammad, M.; Wong, Y.H.; Yoshida, M. Advancements in copper and silver sintering as interconnect materials in electronics applications: Review. J. Mater. Sci. Mater. Electron. 2025, 36, 1767. [Google Scholar] [CrossRef]
- ASTM E18-17e1; Standard Test Methods for Rockwell Hardness of Metallic Materials. ASTM International: West Conshohocken, PA, USA, 2017. [CrossRef]
- ASTM G99-95a; Standard Test Method for Wear Testing with a Pin-on-Disk Apparatus. ASTM International: West Conshohocken, PA, USA, 1995; Reapproved 2000.
- Shaik, M.A.; Golla, B.R. Development of highly wear resistant Cu–Al alloys processed via powder metallurgy. Tribol. Int. 2019, 136, 127–139. [Google Scholar] [CrossRef]
- Arif, S.; Alam, T.; Ansari, A.H.; Shaikh, M.B.N. Morphological characterization, statistical modelling and tribological behaviour of aluminium hybrid nanocomposites reinforced with micro–nano silicon carbide. J. Asian Ceram. Soc. 2019, 7, 434–448. [Google Scholar] [CrossRef]
Disclaimer/Publisher’s Note: The statements, opinions and data contained in all publications are solely those of the individual author(s) and contributor(s) and not of MDPI and/or the editor(s). MDPI and/or the editor(s) disclaim responsibility for any injury to people or property resulting from any ideas, methods, instructions or products referred to in the content. |
© 2026 by the authors. Licensee MDPI, Basel, Switzerland. This article is an open access article distributed under the terms and conditions of the Creative Commons Attribution (CC BY) license.