


Abstract
Tuberculosis (TB) remains a major global cause of morbidity and mortality. Current tools for monitoring treatment response rely on sputum-based microscopy and culture, which are often insensitive, time-consuming, and impractical in extrapulmonary or pediatric TB and in individuals unable to produce sputum. Metabolomics has emerged as a promising approach for identifying host-derived biomarkers that reflect treatment-associated immunometabolic changes; however, the available evidence remains heterogeneous and has not been comprehensively synthesized. We conducted a comprehensive literature review of human studies evaluating metabolomic biomarkers in relation to TB treatment response or outcomes. PubMed, Scopus, and EMBASE were searched for human studies evaluating targeted or untargeted metabolomics (NMR, LC-MS, GC-MS, CE-MS) in relation to treatment response or outcomes. Two reviewers independently screened studies, extracted data, and assessed risk of bias using QUIPS and PROBAST. Findings were synthesized using a structured framework organized across treatment stages and outcomes. Of 218 records identified, 139 titles and abstracts were screened and 42 full texts assessed; 15 studies met the inclusion criteria. Recurrent treatment-associated signals involved amino acid metabolism, particularly the tryptophan–kynurenine pathway, as well as vitamin and cofactor metabolites (pyridoxate, nicotinamide, trigonelline). Plasma studies frequently reported lipid remodeling and bile acid perturbations, whereas urine studies highlighted polyamine metabolism (e.g., N1,N12-diacetylspermine) and fatty acid β-oxidation markers. Common limitations included inadequate adjustment for confounders and, in prediction models, small sample sizes and limited external validation. Metabolomics reveals reproducible but heterogeneous immunometabolic changes during TB therapy. Key pathways include tryptophan–kynurenine metabolism, vitamin and cofactor metabolism, lipid remodeling, and urine polyamine pathways. Standardization and prospective multicenter validation are needed for clinical translation.
1. Introduction
Tuberculosis (TB) remains one of the leading causes of death from infectious disease worldwide, with an estimated 10.7 million new cases and 1.23 million deaths reported in 2024 [1,2]. Although effective treatment regimens exist, timely and accurate monitoring of treatment response remains a major clinical and public health challenge, particularly in settings with limited laboratory infrastructure [1,3,4,5,6,7]. Reliable treatment monitoring is essential for confirming cure, detecting non-response outcomes, and identifying individuals at risk of relapse or treatment failure.
Current tools for monitoring TB treatment response rely primarily on sputum smear microscopy and mycobacterial culture. However, smear microscopy lacks sensitivity and does not reliably reflect bacterial clearance, while culture is time consuming, resource-intensive, and unavailable in all routine care settings [1,3,8,9]. These limitations are particularly evident in individuals who cannot expectorate sputum, in those with extrapulmonary TB, and in children and adolescents, for whom microbiological confirmation and treatment monitoring are especially challenging. As a result, there is strong interest in host-based biomarkers that can provide earlier and more reliable indicators of treatment response across diverse patient populations.
In this context, metabolomics offers a promising approach for biomarker discovery by enabling comprehensive profiling of small molecules that reflect host immune activation, inflammation, tissue remodeling, and metabolic recovery during therapy [10,11,12,13,14,15]. Because TB is characterized by complex host–pathogen interactions, metabolomic signatures may capture both systemic immunometabolic perturbations and treatment-associated normalization across multiple biological pathways. Several studies have reported candidate metabolite or multimetabolite signatures associated with treatment response indicators, including early microbiological response (e.g., culture conversion) as well as final treatment outcomes such as treatment success, failure or relapse, using diverse biospecimens (e.g., plasma or urine) and analytical platforms (e.g., liquid chromatography–mass spectrometry (LC-MS), gas chromatography–mass spectrometry (GC-MS), nuclear magnetic resonance (NMR), and capillary electrophoresis–mass spectrometry (CE–MS) [16,17,18,19,20,21,22,23,24,25,26,27,28,29,30].
Despite these promising findings, the available evidence base remains heterogeneous. Studies differ substantially in biospecimen type, metabolomic workflows, sampling schedules, metabolite identification confidence levels, statistical modeling strategies, and definitions of treatment response. In addition, key clinical factors such as HIV infection and diabetes mellitus, both of which influence metabolic pathways implicated in TB, are inconsistently represented across cohorts, complicating comparisons across studies. This variability complicates comparison across studies and currently constrains the translation of metabolomic biomarkers into clinically actionable monitoring tools [31].
To address these gaps, we conducted a comprehensive literature review to synthesize metabolomic biomarkers associated with TB treatment response. This study follows PRISMA reporting guidance. While previous reviews summarized metabolomic alterations in active TB, only a few specifically examined metabolomic changes linked to treatment dynamics and clinical outcomes during therapy. In this review, we focused on human studies using targeted or untargeted metabolomic approaches to investigate both longitudinal metabolic changes during treatment and metabolites measured at treatment initiation that may predict subsequent outcomes such as treatment failure or relapse. By integrating evidence across studies, we aimed to identify recurrent metabolites and biological pathways associated with treatment response and to highlight promising candidates for future validation and translation to clinical practice. Compared with previous reviews, this study provides a structured synthesis across treatment stages, biospecimens, and outcome categories, enabling identification of recurrent pathway-level signals relevant to clinical translation.
2. Materials and Methods
2.1. Literature Search Strategy and Study Selection
This study was conducted as a comprehensive literature review, using structured search and study selection procedures informed by Preferred Reporting Items for Systematic Reviews and Meta-Analyses (PRISMA) reporting guidelines [32]. The review protocol was prospectively registered in the International Prospective Register of Systematic Reviews (PROSPERO) under registration number CRD420251266516. The objective was to synthesize evidence on metabolomic biomarkers associated with TB treatment response by examining both longitudinal changes across treatment stages (e.g., baseline, intensive phase, and end of treatment) and metabolite signatures associated with treatment outcomes such as treatment failure or relapse.
2.2. Eligibility Criteria (PECOS Framework)
2.2.1. Population
We included studies involving human participants of any age with microbiologically or clinically diagnosed TB (pulmonary or extrapulmonary), including drug-susceptible and drug-resistant TB. Studies enrolling HIV-positive and/or HIV-negative participants were eligible. Animal and in vitro studies were excluded.
2.2.2. Exposure/Intervention
We included studies using targeted or untargeted metabolomics, including NMR, LC–MS, GC–MS, and CE–MS platforms. Lipidomics studies were included when metabolite-level biomarkers were reported.
2.2.3. Comparators
Eligible comparisons included treatment responders versus non-responders; culture converters versus non-converters; and treatment success versus treatment failure or relapse. We also included longitudinal within-person comparisons during therapy (e.g., baseline vs. intensive phase and/or baseline vs. end of treatment). Studies focusing solely on TB diagnosis (TB vs. non-TB controls) without treatment monitoring or treatment-outcome prediction were not included in the treatment-phase synthesis; when such studies reported signatures explicitly linked to treatment response or outcome prediction, they were retained for descriptive analysis.
2.2.4. Outcomes
The primary outcome was TB treatment response, defined by the original studies using microbiological, clinical, or composite endpoints (e.g., culture conversion, treatment success, treatment failure, relapse).
2.2.5. Study Design
We included randomized and non-randomized study designs evaluating metabolomic biomarkers in relation to TB treatment response. Eligible designs included prospective or retrospective cohort studies, nested case–control studies within defined cohorts, randomized controlled trial (RCT) sub-studies, and cross-sectional analyses reporting treatment-stage case–control analyses were included when derived from well-defined clinical cohorts or longitudinal studies of TB treatment. Reviews, editorials, letters, case reports or case series, and conference abstracts without full-text publication were excluded.
2.3. Information Sources and Search Strategy
A systematic literature search was conducted in PubMed, Scopus, and EMBASE from inception to 26 November 2025. The search strategy combined controlled vocabulary and free-text terms related to tuberculosis, metabolomics, biomarkers, and treatment response. The search was limited to English-language publications.
To maximize sensitivity, search terms included variations of “tuberculosis”, “Mycobacterium tuberculosis”, “metabolomics”, “metabonomics”, “lipidomics”, “biomarker”, “treatment”, “therapy”, “response”, “monitoring”, “outcome”, “failure”, and “cure”. The full search strategy is provided in Supplementary Table S1. Reference lists of included studies and relevant reviews were also screened to identify additional eligible publications.
2.4. Study Selection
All records retrieved from database searches were exported to reference management software Mendeley Desktop (Version 1.19.8) and deduplicated prior to screening. Two reviewers independently screened titles and abstracts to identify potentially eligible studies. Full-text articles were then retrieved and assessed independently by the same reviewers against the predefined eligibility criteria (PECOS framework). Disagreements at any stage were resolved through discussion and consensus; when consensus could not be reached, a third reviewer was consulted. Inter-reviewer agreement was assessed qualitatively based on consistency in study inclusion decisions.
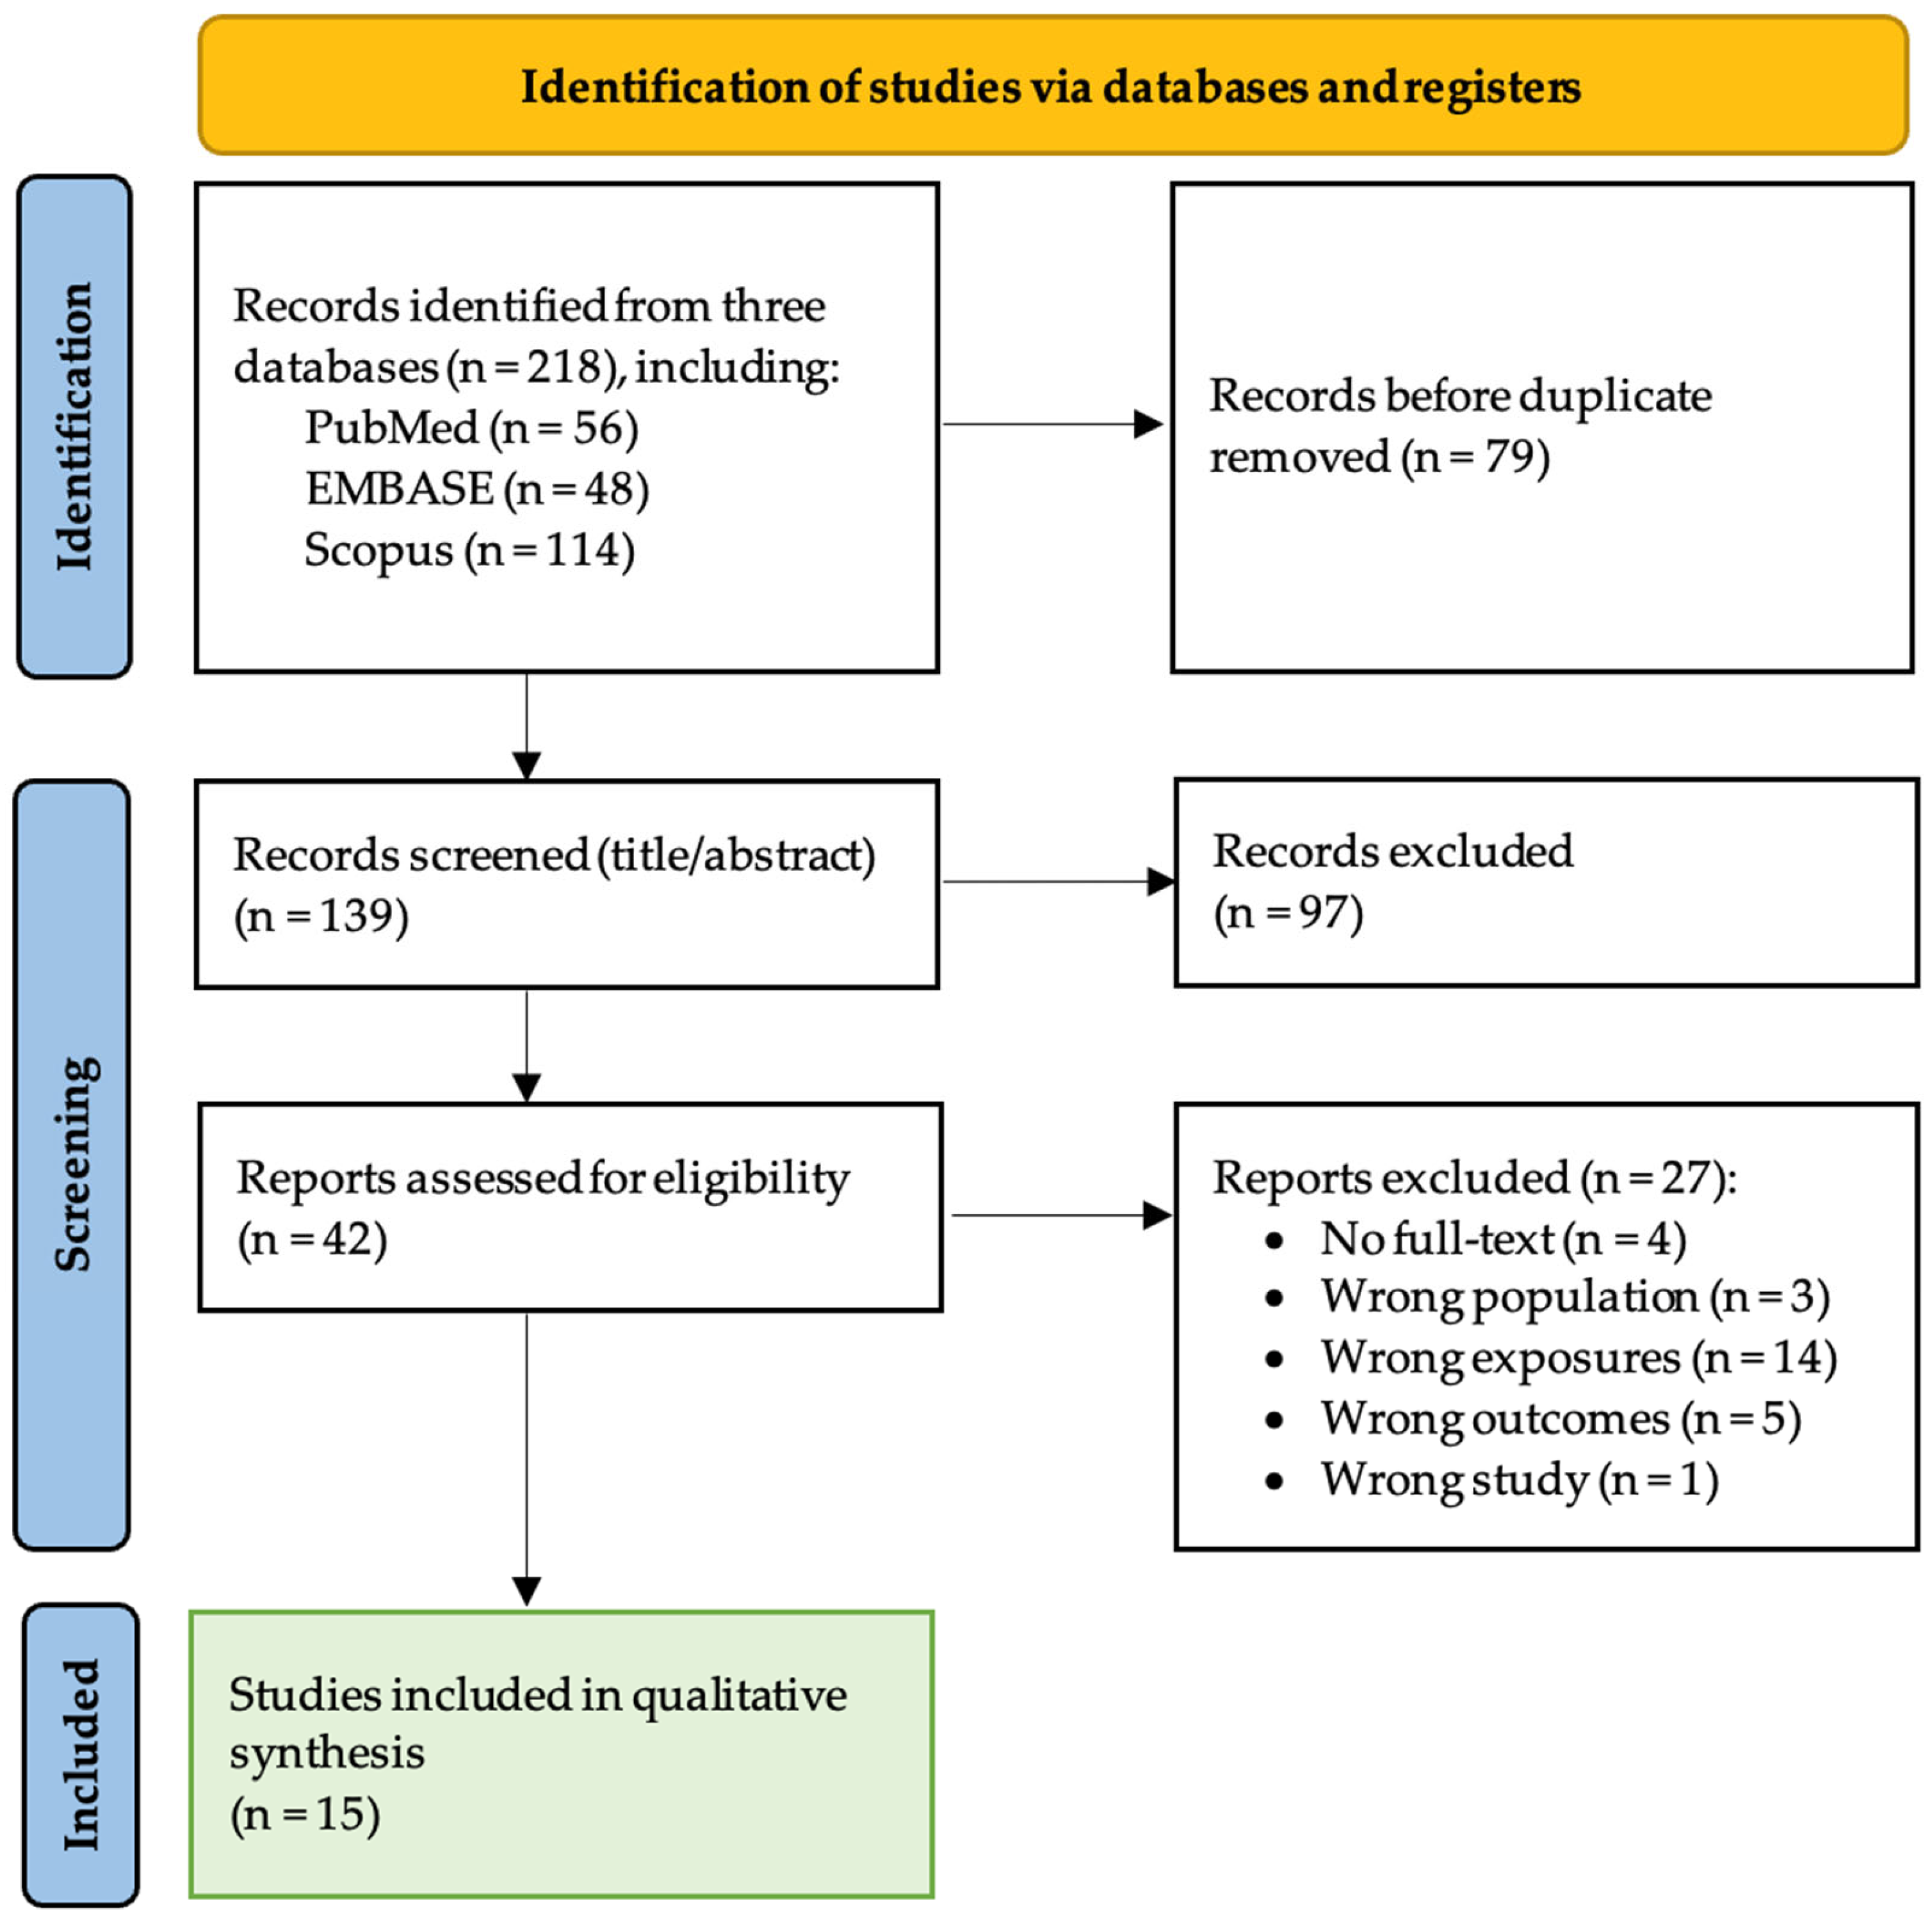
Reasons for full-text exclusion were documented. The study selection process is summarized using a PRISMA flow diagram (Figure 1).
2.5. Data Extraction
Data were extracted independently by two reviewers using a standardized extraction form, which was pilot-tested on a subset of studies to ensure consistency and clarity. Extracted variables included: author and year; country/setting; study design; participant characteristics (e.g., age group, HIV status, and comorbidities when reported); sample size; type of TB and diagnostic criteria; biological specimen (e.g., urine or plasma); metabolomics platform and analytical approach (targeted or untargeted); sampling time points during treatment; definition of treatment response and outcomes; statistical methods; and key reported metabolites or metabolite panels associated with treatment response. Where available, directionality of metabolite change (increase or decrease) was recorded for each comparison category.
Any discrepancies in extracted data were resolved by discussion and consensus between reviewers. When required, corresponding authors were contacted for clarification.
2.6. Risk of Bias Assessment
Risk of bias was assessed independently by two reviewers. Studies that developed, validated, or externally evaluated multivariable prediction models (including machine learning classifiers) were evaluated using the Prediction Model Risk Of Bias Assessment Tool (PROBAST). Observational studies reporting metabolite–outcome associations or longitudinal metabolite changes without a formal prediction model were evaluated using the Quality In Prognostic Studies (QUIPS) tool.
Studies were categorized as prognostic association studies or prediction model studies based on whether multivariable predictive models were developed and internally or externally validated. Disagreements were resolved by discussion and consensus.
For PROBAST, risk of bias was assessed across four domains (participants, predictors, outcome, and analysis), and applicability was assessed across three domains (participants, predictors, and outcome). For QUIPS, risk of bias was assessed across study participation, prognostic factor measurement, outcome measurement, confounding, and statistical analysis/reporting. Overall risk-of-bias ratings were derived using a conservative approach: studies were classified as high risk if any domain was rated as high risk; otherwise, studies were rated as unclear/moderate if any domain was unclear or moderate, and as low risk if all domains were rated low risk. This conservative approach is consistent with recommended practices for minimizing bias in systematic reviews of prognostic and prediction studies [27,28].
The use of these tools follows established guidance for prediction and prognostic studies [27,28].
2.7. Data Synthesis and Analysis
Due to substantial heterogeneity in study design, sampling time points, analytical platforms, metabolite identification, and statistical reporting, a quantitative meta-analysis was not performed. Instead, findings were synthesized narratively and summarized using a structured comparison framework. A pathway-level synthesis approach was used to integrate biologically related metabolites and improve interpretability across heterogeneous studies. A recurrence-based approach was used to identify consistent signals across studies, acknowledging the limitations of vote-counting methods, including lack of effect-size weighting and potential bias.
Comparisons were classified into four predefined groups: (Group 1) baseline vs. end of treatment; (Group 2) baseline vs. intensive phase; (Group 3) intensive phase vs. end of treatment; and (Group 4) treatment failure vs. cure.
Where reported, directionality of metabolite change (increase or decrease) was summarized within each comparison group. Metabolites were considered recurring when reported in at least two studies within the same comparison category, as a pragmatic threshold to identify consistent signals across heterogeneous datasets. However, this recurrence-based approach has limitations, including lack of effect-size weighting and potential bias toward frequently studied metabolites. Recurrence was defined within the same comparison category and biofluid. Results were further stratified by biological specimens (urine vs. plasma) and metabolomics approach (targeted vs. untargeted) when data permitted.
3. Results
3.1. Study Selection
The database search identified 218 records. After removal of duplicates, 139 records were screened at the title and abstract stage, of which 97 were excluded. A total of 42 full-text reports were retrieved and assessed for eligibility; 27 were excluded, most commonly because the studies did not evaluate metabolomic biomarkers in relation to TB treatment response. In total, 15 studies met the inclusion criteria and were included in the qualitative synthesis (Figure 1). These studies were conducted across nine countries and included a range of study designs, including prospective and retrospective cohort studies, nested case–control analyses, and prediction model studies.
Figure 1.
PRISMA flow diagram of study selection.
3.2. Study Characteristics
Characteristics, biospecimens, and analytical platforms of the included studies are summarized in Table 1. Overall, the evidence base comprised heterogeneous study designs, including longitudinal cohort studies, nested case–control analyses, and prediction model studies. Studies were conducted across multiple geographic settings, including South Africa, Uganda, Ethiopia, Haiti, China, Thailand, India, Brazil, and Korea. Populations included adults and children, and several studies evaluated cohorts with key comorbidities such as HIV infection or diabetes mellitus.
Table 1.
Characteristics, biospecimens and metabolomic platforms used in included studies.
3.3. Biospecimens and Metabolomic Platforms
Across the 15 included studies, metabolomic profiling was performed using both plasma and urine biospecimens. The majority of studies employed LC–MS-based workflows, while fewer used GC–MS or GC×GC–MS or UPLC platforms (Table 1). Both untargeted and targeted metabolomic approaches were represented, including targeted lipidomics and targeted quantification of immune-related metabolites such as markers within the tryptophan–kynurenine pathway.
3.4. Treatment Response Comparison Group
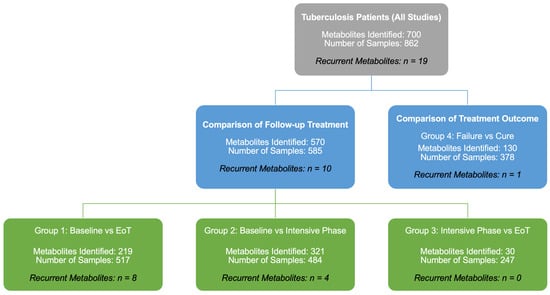
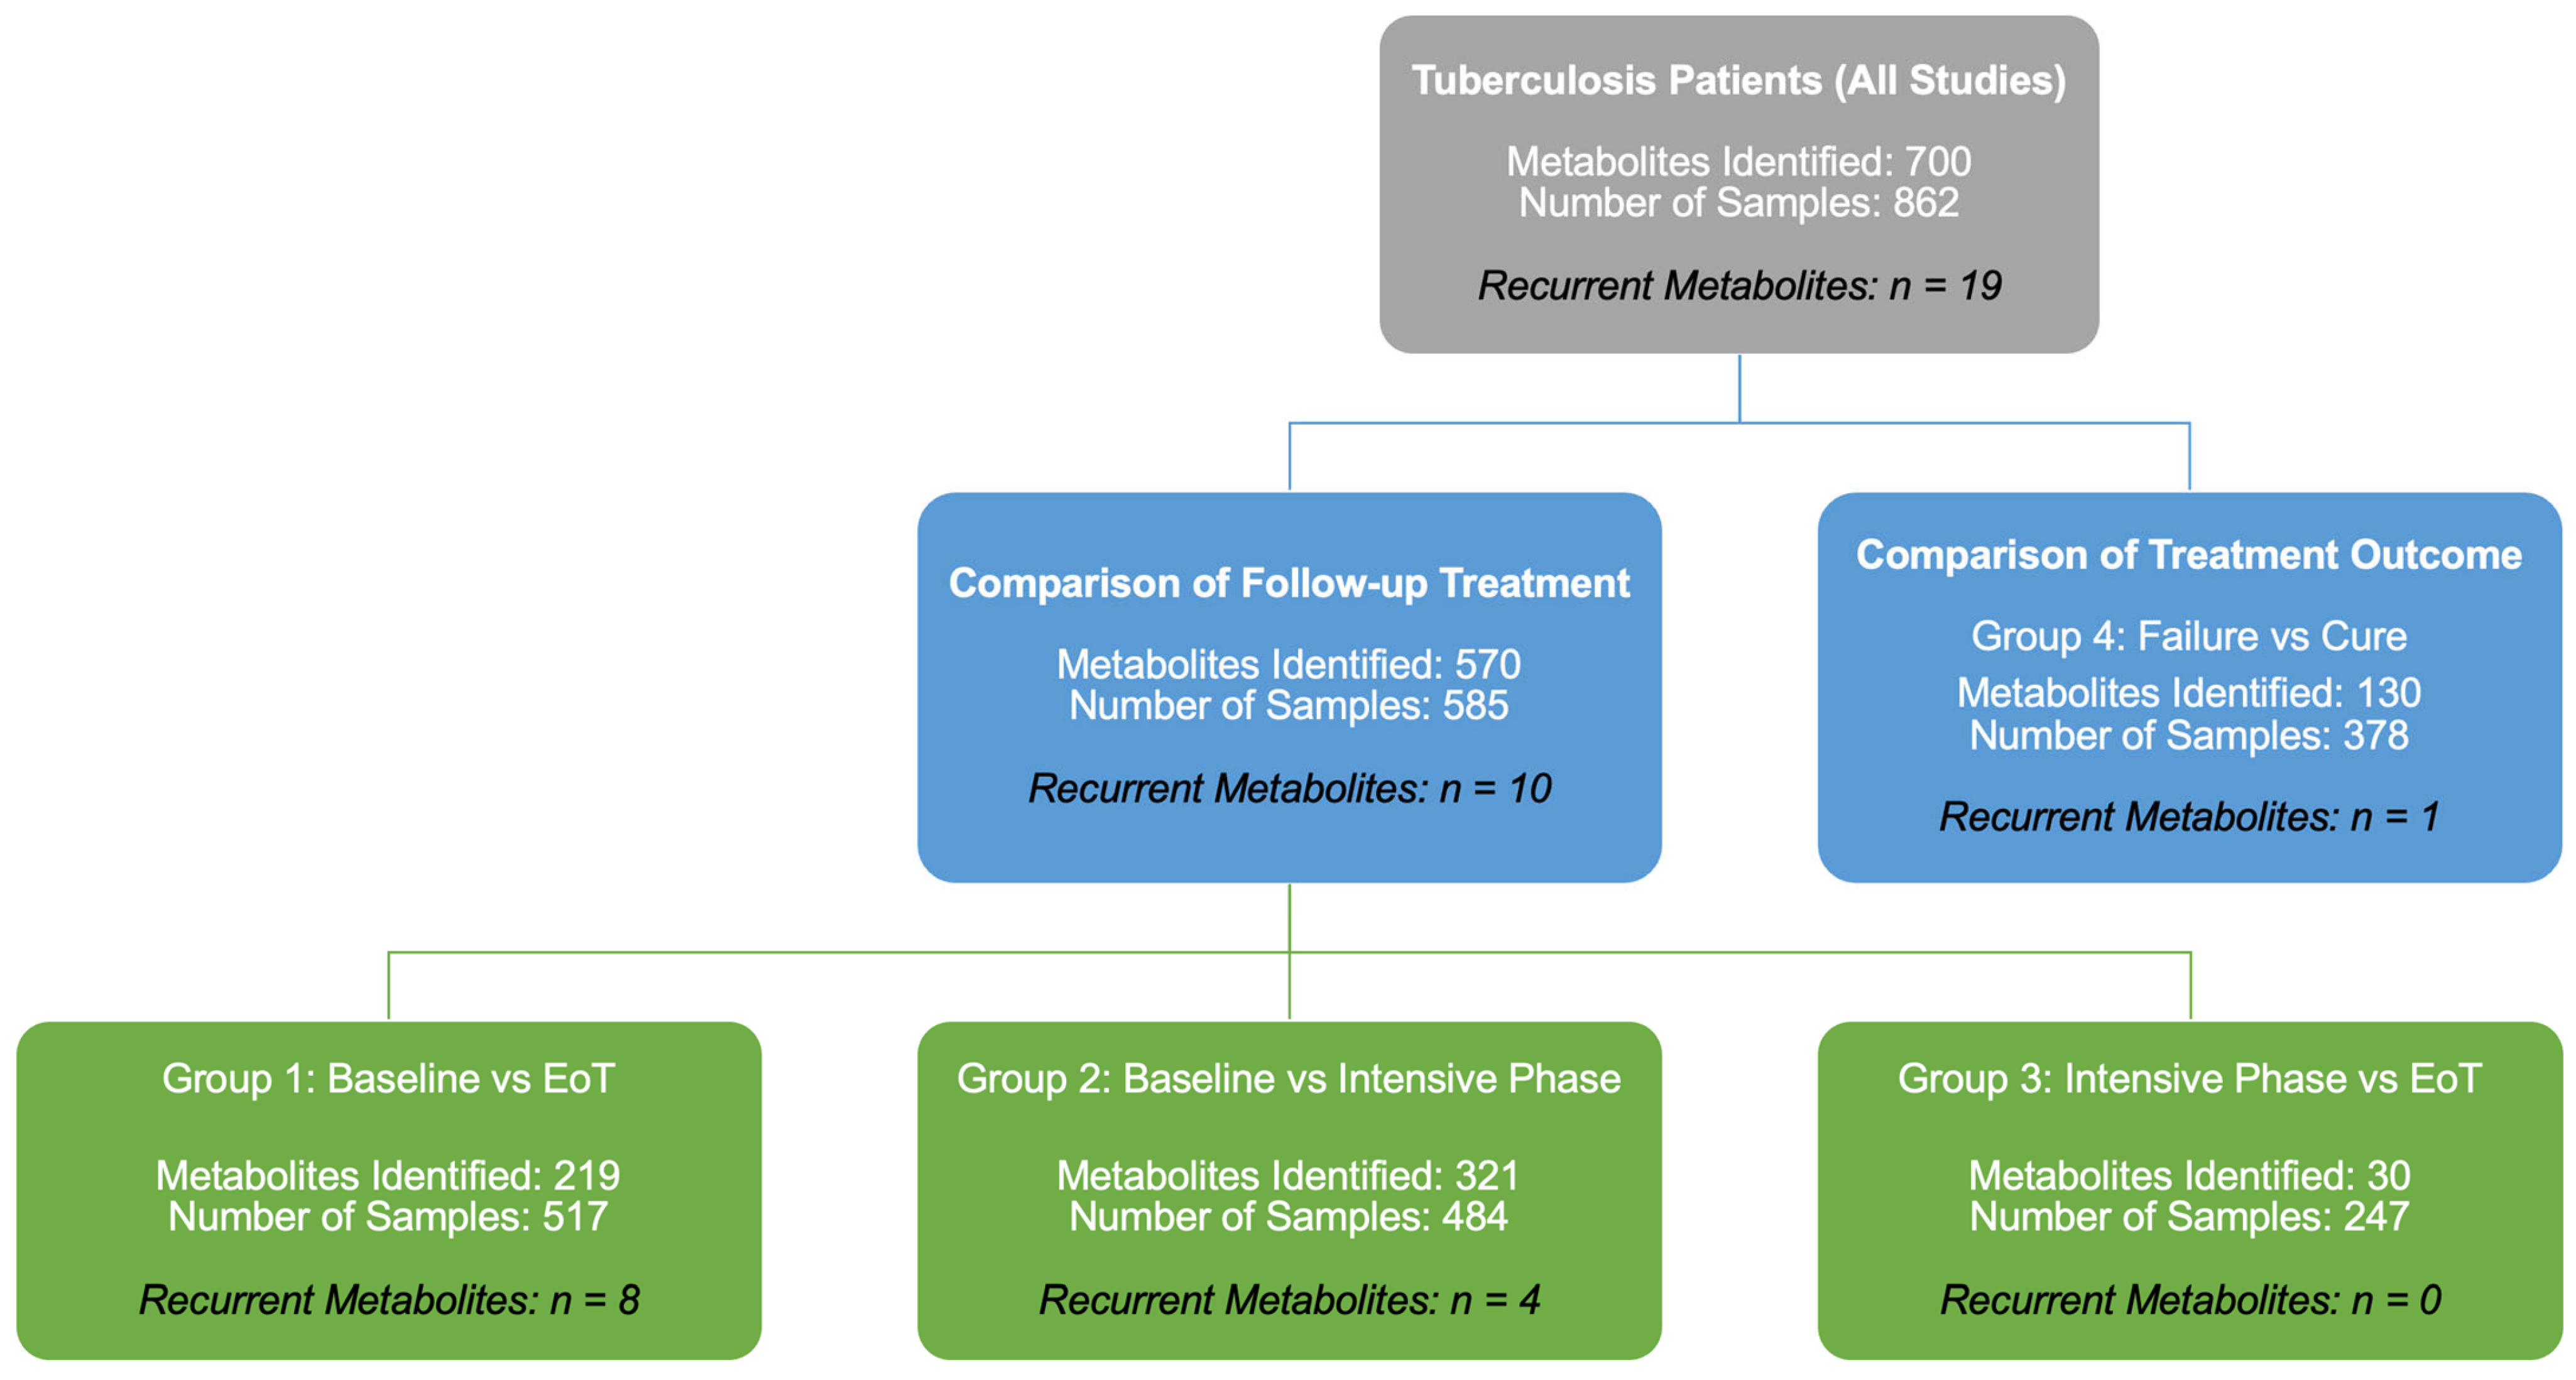
To facilitate synthesis across heterogeneous study designs and sampling schedules, included studies were categorized into four clinically relevant comparison groups (Figure 2): (1) baseline versus end of treatment (EoT), (2) baseline versus intensive phase, (3) intensive phase versus EoT, and (4) treatment failure versus cure outcome. This grouping enabled structured comparison of longitudinal treatment-associated metabolic changes as well as baseline metabolic signatures associated with unfavorable treatment outcomes.
Figure 2.
Study synthesis workflow and comparison-group framework used for narrative integration.
The included studies were organized into four comparison groups based on treatment stage and outcome definitions: (Group 1) baseline vs. end of treatment (EoT), (Group 2) baseline vs. intensive phase, (Group 3) intensive phase vs. EoT, and (Group 4) treatment failure/relapse vs. cure. Metabolite-level findings were synthesized using a structured narrative approach with recurrence-based vote counting across studies within each comparison group. Quantitative effect-size meta-analysis was not performed due to heterogeneity in study designs, biospecimens, analytical platforms, sampling schedules, and reporting formats.
3.5. Summary of Metabolites by Comparison Group
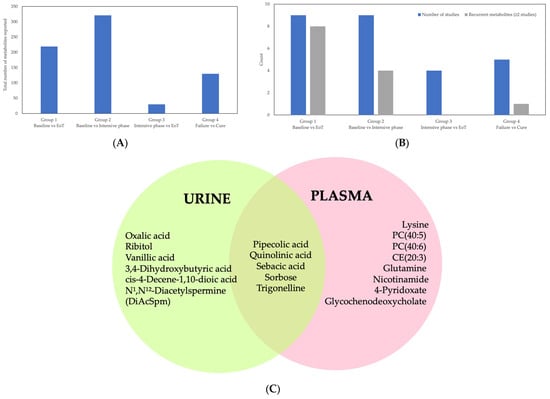
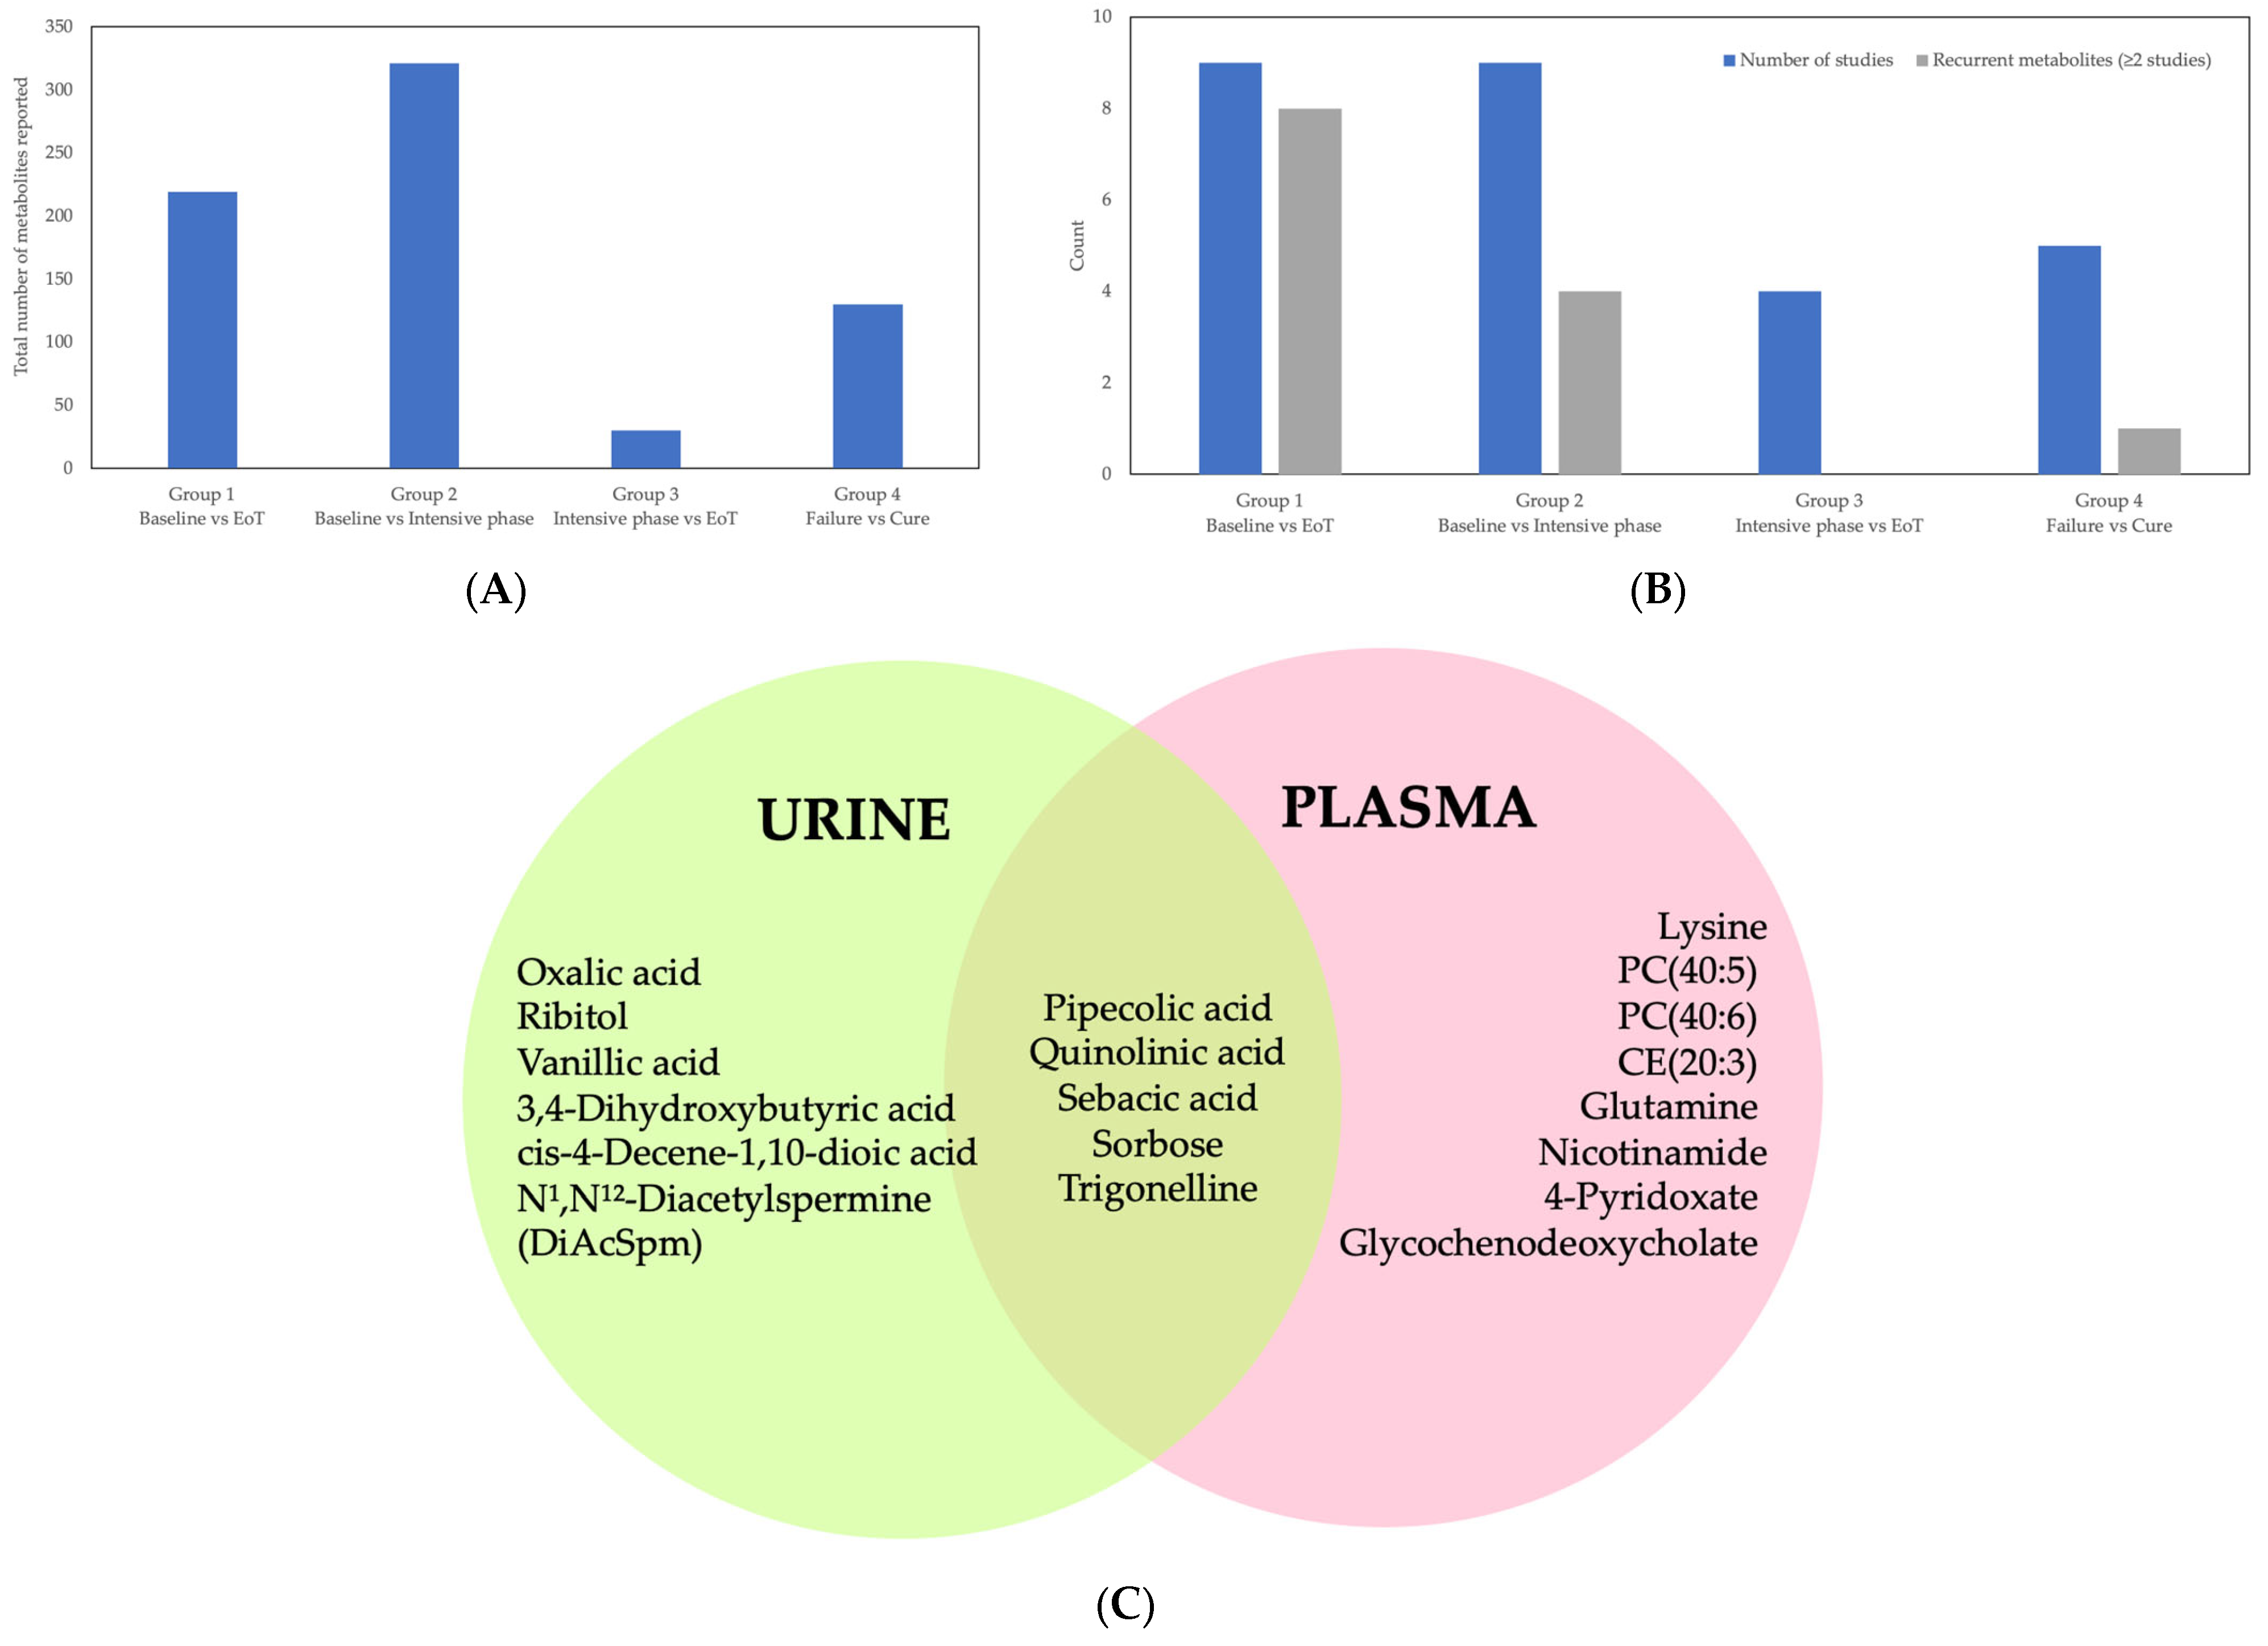
A total of 700 metabolites were reported across all comparison groups (Table 2). Metabolite counts are not directly comparable across studies due to differences in analytical coverage, metabolite identification workflows, statistical thresholds, and reporting practices. Metabolite totals are not additive across groups because individual studies may contribute to multiple comparison categories and the same metabolite may be reported in more than one group. The distribution of studies and metabolites by comparison group is summarized in Figure 3A,B, and recurrent metabolites within each subgroup are summarized in Table 2.
Table 2.
Summary of recurrent metabolites by treatment-response comparison group and biospecimen.
Figure 3.
Summary of study distribution and recurrent metabolites across comparison groups and sample types. (A) Total number of metabolites reported across studies within each comparison group: Group 1 (baseline vs. end of treatment [EoT]), Group 2 (baseline vs. intensive phase), Group 3 (intensive phase vs. EoT), and Group 4 (treatment failure vs. cure); (B) Number of included studies contributing to each comparison group and the number of recurrent metabolites (defined as metabolites reported in ≥2 independent studies) within that group; (C) Venn diagram showing the overlap of recurrent metabolites (≥2 studies) identified in urine and plasma, highlighting biofluid-specific signatures and limited cross-matrix overlap.
Group 1 (baseline vs. EoT) included nine studies reporting 219 metabolites, comprising 157 plasma metabolites across six studies and 62 urine metabolites across three studies (Table 2). Eight metabolites were recurrent across ≥2 studies in this group, including 4-pyridoxate, glutamine, glycochenodeoxycholate, lysine, N1,N12-Diacetylspermine (DiAcSpm), nicotinamide, quinolinic acid, and trigonelline. Only N1,N12-Diacetylspermine (DiAcSpm) was identified across urine studies in this group.
Group 2 (baseline vs. intensive phase) included nine studies reporting 321 metabolites, comprising 138 plasma metabolites across five studies and 183 urine metabolites across four studies (Table 2). Four recurrent metabolites were identified in this group, including 4-pyridoxate, glycochenodeoxycholate, nicotinamide, and trigonelline.
Group 3 (intensive phase vs. EoT) included four studies reporting 18 plasma metabolites and 12 urine metabolites, with no recurrent metabolites identified across studies (Table 2).
Group 4 (treatment failure vs. cure) included five studies reporting 130 metabolites, comprising 62 plasma metabolites from one study and 68 urine metabolites from four studies (Table 2). One recurrent urine metabolite, cis-4-decene-1,10-dioic acid, was reported in ≥2 studies, while no recurrent plasma metabolites were identified.
Across comparison groups, overlap between plasma and urine metabolite findings was limited, indicating that metabolomic treatment-response signatures were strongly biofluid-dependent (Figure 3C).
3.6. Risk of Bias Assessment
Risk of bias assessments are summarized in Table 3. Prediction model studies (including machine learning classifiers) were assessed using PROBAST, while prognostic association studies were assessed using QUIPS. Overall, seven studies were classified as prediction model studies and eight studies as prognostic association studies.
Table 3.
Risk of bias assessment of included studies. Prediction model studies (including machine learning classifiers) were evaluated using PROBAST. Prognostic factor/association studies were evaluated using QUIPS. (A) Prediction model studies (PROBAST). (B) Prognostic factor/association studies (QUIPS).
Among the seven prediction model studies assessed using PROBAST, six were judged to have a high risk of bias, while one study was judged low risk of bias (Table 3A). The most frequent PROBAST concerns were within the analysis domain, driven by small sample sizes relative to model complexity, high overfitting risk, incomplete reporting of model development steps, and limited internal or external validation.
Among the eight prognostic association studies assessed using QUIPS, three were judged low risk of bias, three moderate risk, and two high risk (Table 3B). The most common QUIPS concerns were related to confounding control (particularly incomplete adjustment for HIV status, diabetes mellitus, and drug resistance), and analysis/reporting, including incomplete reporting of missing data handling and variability in outcome definitions and sampling schedules across cohorts.
Given these methodological limitations, particularly heterogeneity in analytical workflows and the high risk of bias in most prediction model studies, we therefore focused the synthesis on recurrent pathway-level signals that were consistently observed across independent cohorts and study designs.
3.7. Metabolic Pathway Synthesis
Across comparison groups, recurrent metabolites converged on four principal pathway domains: (i) amino acid metabolism, particularly the tryptophan–kynurenine axis; (ii) vitamin and cofactor metabolism; (iii) lipid remodeling and bile acid metabolism; and (iv) polyamine and β-oxidation–related pathways.
In longitudinal treatment comparisons (Groups 1–3), the most consistent signals involved treatment-associated modulation of the tryptophan–kynurenine pathway and vitamin/cofactor metabolites, reflecting shifts in systemic immune activation and redox balance during therapy. Plasma-based analyses repeatedly highlighted the kynurenine/tryptophan ratio, quinolinic acid, pyridoxate, and nicotinamide as representative markers of metabolic recovery.
In contrast, baseline comparisons linked to unfavorable outcomes (Group 4) more frequently implicated lipidomic perturbations, including altered ceramides, sphingomyelins, and cholesteryl esters, suggesting that host lipid remodeling and inflammatory lipid mediators may contribute to risk stratification.
Urine-based studies highlighted polyamine metabolism (notably N1,N12-diacetylspermine) and dicarboxylic acids associated with β-oxidation, supporting the concept that urinary metabolites reflect downstream excretory and microbiome-associated metabolic processes distinct from plasma immune–metabolic signatures.
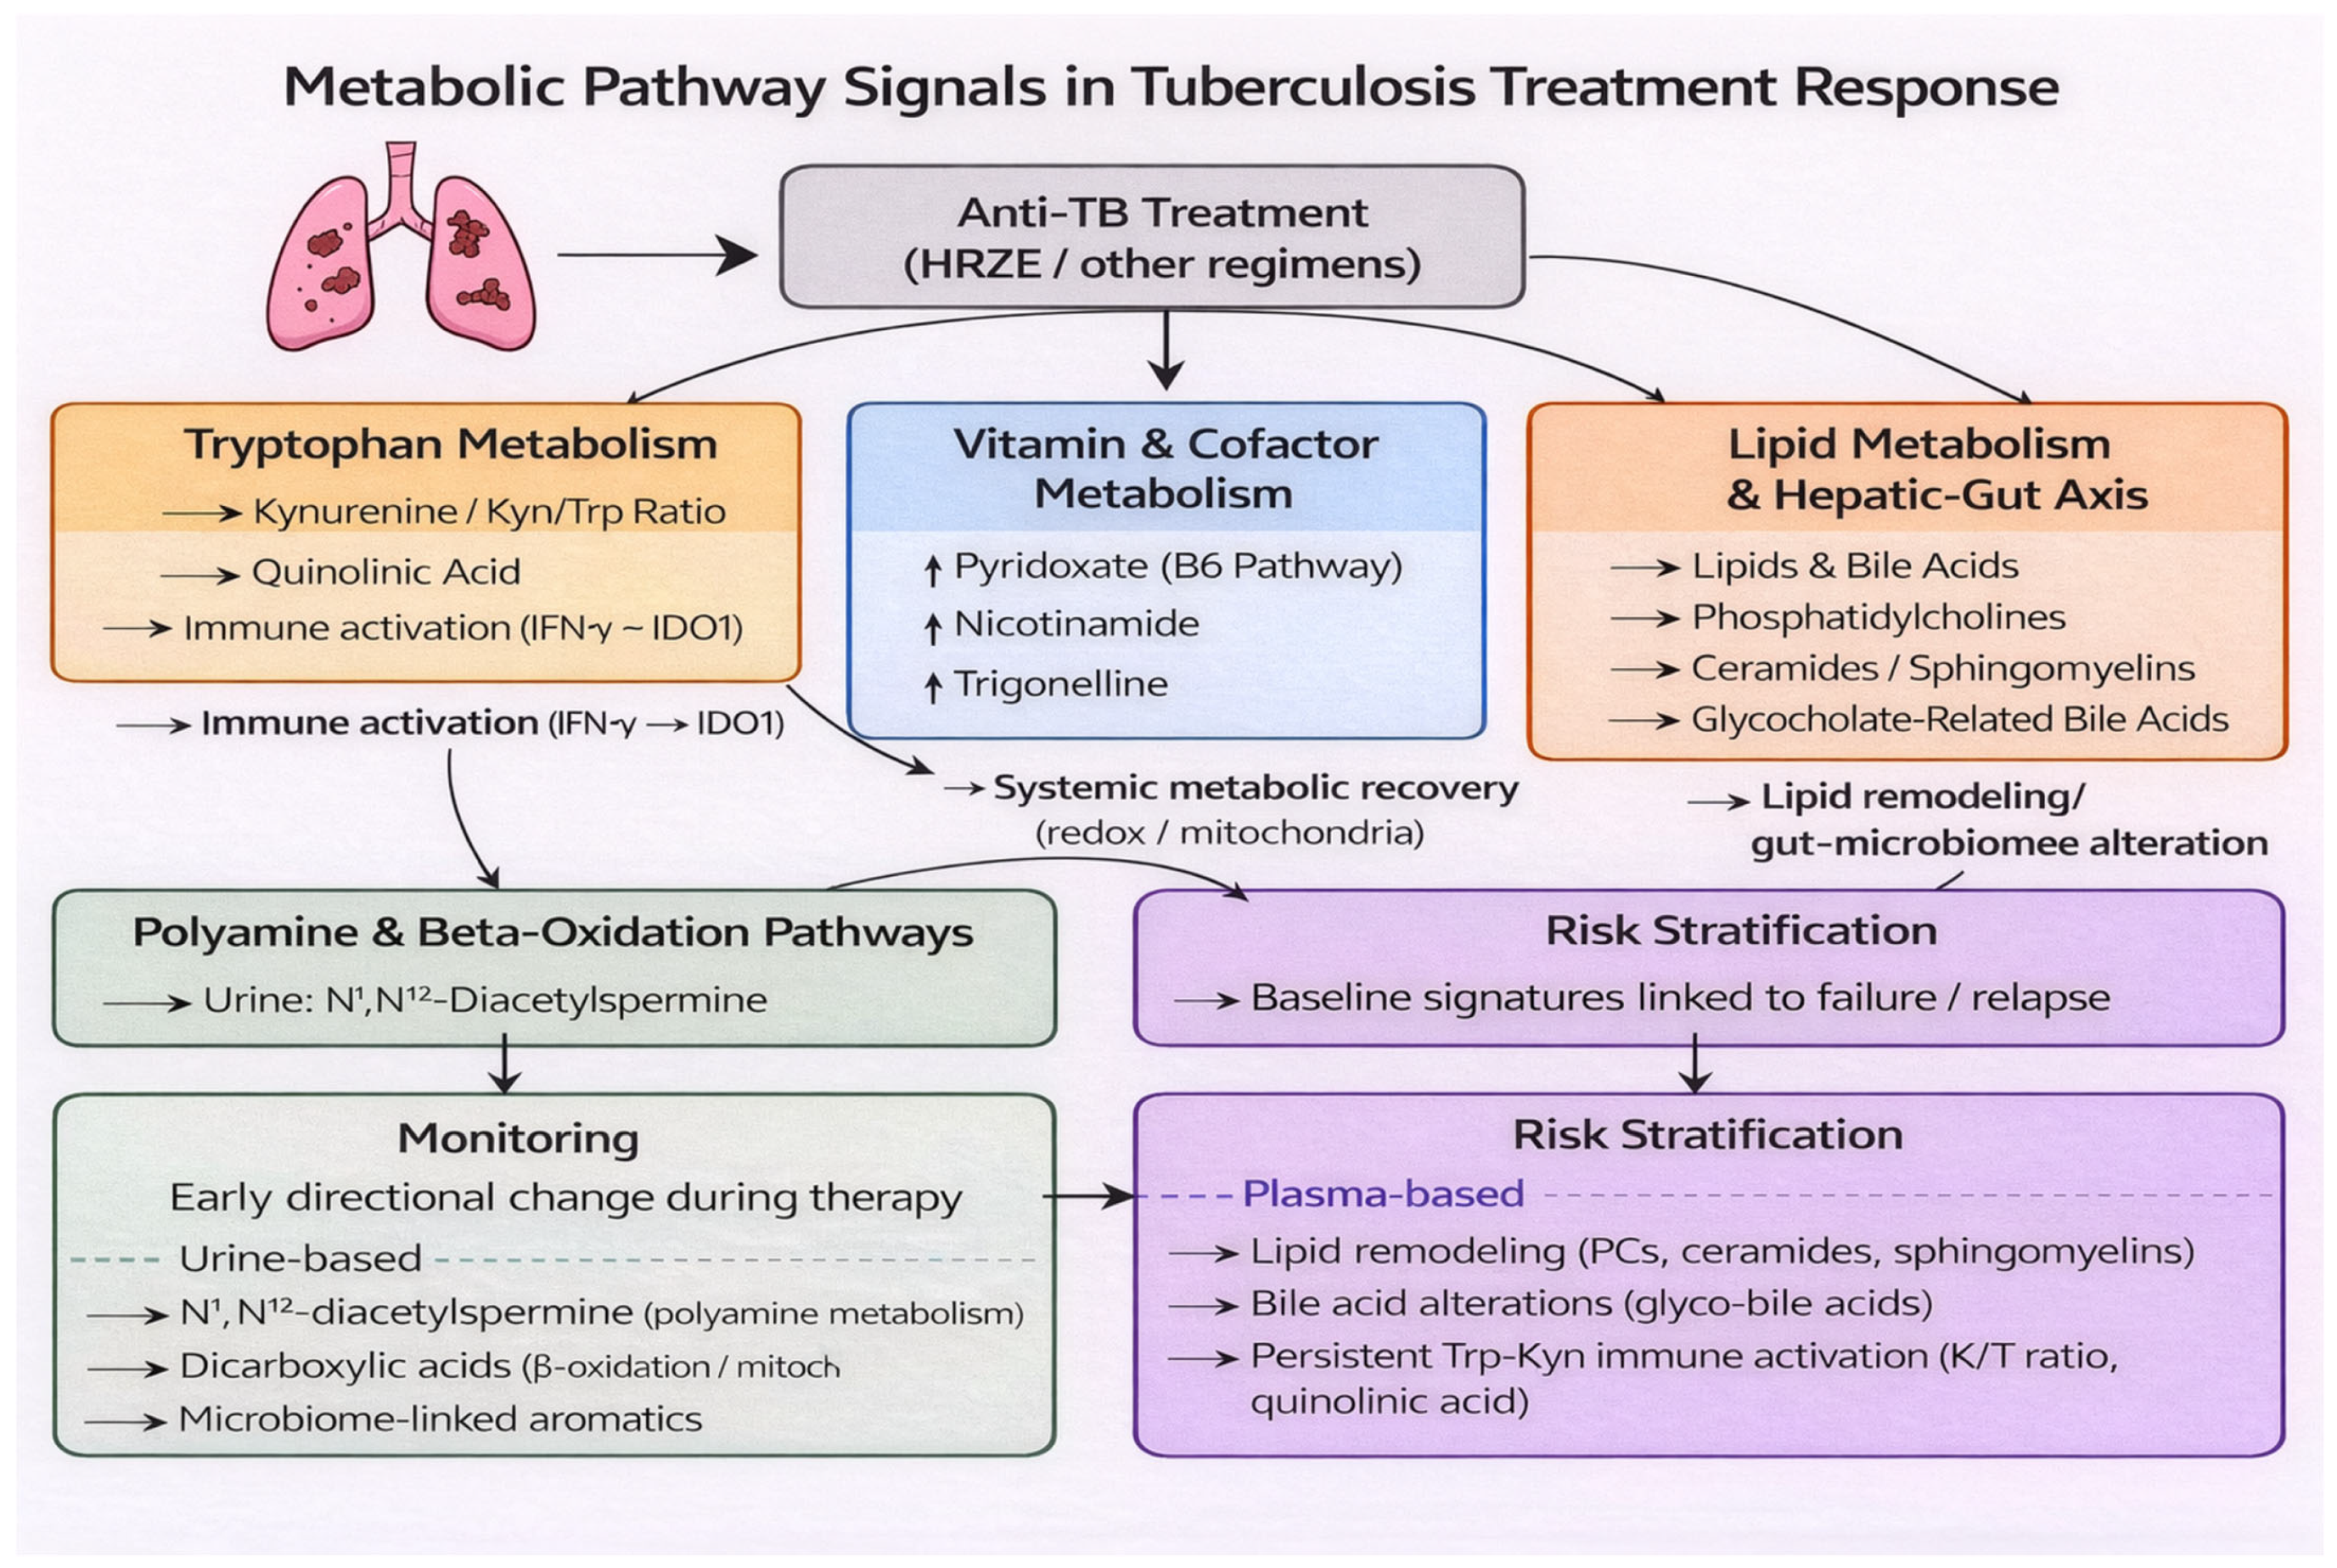
Pathway-level findings extracted from individual studies are summarized in Table 4, and an integrated schematic distinguishing monitoring-related versus risk-stratification–related metabolic signals is presented in Figure 4.
Table 4.
Key metabolites reported across studies, organized by biospecimen and comparison group. This table summarizes representative metabolites reported in at least one study within each subgroup.
Figure 4.
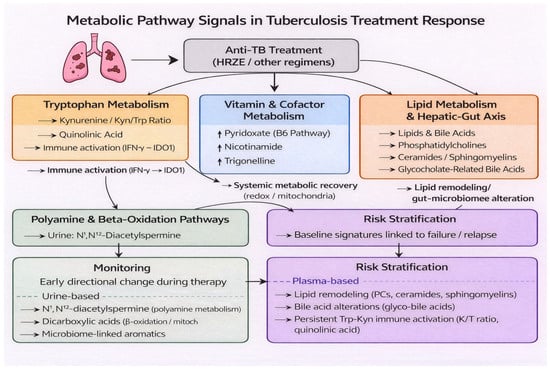
Metabolic pathway signals in tuberculosis treatment response. Schematic overview of recurrent metabolic pathways and representative metabolites associated with tuberculosis (TB) treatment response, synthesized from the 15 included studies and pathway-level findings (Table 2 and Table 4). Anti-TB therapy (HRZE or other regimens) is associated with coordinated immunometabolic changes across multiple biological domains. The most consistently reported pathway was tryptophan catabolism through the kynurenine axis, reflecting immune activation (IFN-γ–IDO1). Vitamin and cofactor metabolites (e.g., pyridoxate, nicotinamide, trigonelline) suggest systemic metabolic recovery during therapy. Lipid remodeling and bile acid perturbations reflect host lipid regulation and potential hepatic–gut axis influences. Urine-based studies additionally highlighted polyamine metabolism (e.g., N1,N12-diacetylspermine) and β-oxidation and excreted end-products, including dicarboxylic acids and microbiome-linked aromatics. The lower panels illustrate two potential translational applications: (i) longitudinal monitoring based on early directional changes during treatment and (ii) baseline risk stratification using metabolite signatures linked to failure/relapse. Solid arrows indicate direct or directional relationships between biological processes, while dashed lines represent indirect or inferred associations across pathways. Arrows indicate conceptual relationships rather than quantitative effect sizes.
4. Discussion
This review synthesizes evidence from 15 human studies evaluating metabolomic biomarkers for monitoring tuberculosis (TB) treatment response, encompassing longitudinal plasma- and urine-based analyses, lipidomic investigations, adult and pediatric populations, and outcome-focused prognostic and prediction model studies [16,17,18,19,20,21,22,23,24,25,26,27,28,29,30]. Across studies, anti-TB therapy was consistently associated with metabolic perturbations; however, the specific metabolites reported varied substantially depending on the biospecimen, analytical platform, sampling schedule, and reporting practices. By organizing findings according to treatment-stage and outcome comparisons (Figure 2) and prioritizing cross-study recurrence rather than single-study signals, this review identifies a limited set of metabolites and pathways that show convergent evidence of change during therapy, while also highlighting key methodological limitations that currently constrain direct clinical translation [11,12,33,34].
Across comparison groups, the most consistent treatment-response signal involved amino acid metabolism, particularly the tryptophan–kynurenine pathway. Multiple plasma-based studies reported dynamic changes in the kynurenine/tryptophan (K/T) ratio and downstream metabolites, such as quinolinic acid, across treatment time points [16,17,21,22,23,24,27,28]. In general, elevated K/T ratios and quinolinic acid levels were observed at baseline in active TB and declined during successful therapy, with several studies reporting treatment-associated reductions consistent with resolution of systemic immune activation. Conversely, persistent elevation of these markers was associated with unfavorable outcomes in treatment-outcome comparisons (Group 4; Table 2) and in prediction-oriented analyses [17,22,23,27]. These findings are biologically plausible, as interferon-γ-driven activation of indoleamine 2,3-dioxygenase promotes increased tryptophan catabolism during chronic infection and sustained immune activation [35,36,37,38]. The consistent observation of this pathway across studies conducted in different TB patient populations, including adult and pediatric cohorts, and populations with major comorbidities such as HIV infection and diabetes mellitus, suggests that the tryptophan–kynurenine axis reflects a recurrent host immunometabolism response during TB treatment rather than a cohort-specific phenomenon [18,19,22,25]. Nevertheless, because this pathway is not TB-specific and may be influenced by other inflammatory conditions, its most appropriate clinical role is likely within a multimetabolite panel rather than as a stand-alone biomarker [10,37,39,40].
It is important to distinguish between recurrent signals supported across multiple independent cohorts and exploratory findings derived from smaller or higher-risk studies. The tryptophan–kynurenine pathway represents the most robust and consistently replicated signal, whereas several lipidomic and urinary metabolites remain exploratory and require further validation.
In addition to amino acid metabolism, vitamin- and cofactor-related metabolites emerged as recurrent features of treatment response. Pyridoxate (a vitamin B6 catabolite), nicotinamide, and trigonelline were repeatedly reported in longitudinal comparisons, particularly between baseline and intensive-phase or end-of-treatment time points (Table 2) [16,21,22,23,24]. Across studies, these metabolites generally showed directional changes consistent with metabolic recovery during therapy, although the magnitude and timing of change varied across cohorts and analytical platforms. These metabolites plausibly reflect recovery of host nutritional status, redox balance, and mitochondrial function, which are disrupted during active TB and may progressively normalize with effective therapy [5,11,12,33]. Although the direction and timing of change were not fully consistent across studies, repeated detection of these metabolites across independent cohorts supports their potential relevance as markers of systemic metabolic recovery during treatment.
Lipid and bile acid metabolism constituted another prominent theme, particularly in plasma-based studies and analyses focused on treatment outcomes. Lipidomic profiling identified treatment-associated remodeling of phosphatidylcholines and sphingolipids, while baseline lipid signatures, including altered ceramide and sphingomyelin profiles, were associated with subsequent treatment failure in some cohorts [17,23,24,27]. Recurrent alterations in bile acids such as glycochenodeoxycholate and glycocholate were also reported [21,23], potentially reflecting interactions among host metabolism, antimicrobial therapy, hepatic function, and gut–liver axis biology [41,42]. However, interpretation of lipid and bile acid markers is subject to important confounding factors. These metabolites are highly sensitive to dietary intake, liver function, and antibiotic exposure, all of which can substantially influence circulating and excreted metabolite levels independent of TB disease activity or treatment response. In addition, variability in hepatic function, whether related to underlying disease, drug-induced hepatotoxicity, or nutritional status, may further affect bile acid metabolism and lipid profiles. Therefore, lipid and bile acid markers are sensitive to diet, liver disease, and antibiotic exposure, and may therefore be most informative when interpreted in combination with other metabolic and clinical indicators [43,44,45,46,47].
Urine-based metabolomic studies highlighted additional pathways relevant to treatment monitoring, particularly polyamine metabolism and fatty acid β-oxidation. Urinary N1,N12-diacetylspermine was one of the few metabolites consistently associated with early treatment response and changes in bacterial burden across multiple studies (Table 2) [16,20,21]. In most reports, levels of this metabolite declined during therapy, consistent with reduced inflammatory and proliferative metabolic activity as treatment progresses. Other urinary markers, including dicarboxylic acids and aromatic compounds, were linked to unfavorable outcomes and were hypothesized to reflect impaired mitochondrial β-oxidation or host-microbial metabolic interactions [25,30]. The limited overlap between urine and plasma metabolites observed in Figure 3C underscores that treatment-response signatures are strongly biofluid-dependent. Plasma appears to better capture systemic immune-metabolic changes and lipid remodeling, whereas urine reflects excreted metabolic end-products and polyamine-related immune-metabolic signals [12,48,49,50]. These findings emphasize the importance of defining the intended clinical use case, systemic monitoring versus non-invasive screening, when developing metabolomic biomarkers for TB treatment response.
From a translational perspective, the findings summarized in Figure 3 and Figure 4 and Table 2 and Table 3 suggest two potential applications of metabolomic biomarkers in TB. First, longitudinal markers that demonstrate early and reproducible directional change during therapy may support adjunctive monitoring of treatment response, particularly in settings where microbiological assessments are delayed, limited, or unavailable [16,20,21,23,24]. Second, baseline metabolic signatures associated with later treatment failure raise the possibility of pre-treatment risk stratification to guide intensified monitoring or tailored interventions [17,23,24,27]. However, reported performance metrics varied widely across studies, external validation was uncommon, and several prediction models were developed in relatively small cohorts. In addition, calibration performance was rarely assessed, and formal evaluation of clinical utility (e.g., decision-curve analysis) was generally lacking. These limitations indicate that most proposed biomarker panels remain investigational and are not yet suitable for clinical implementation [10,11,12,50].
Based on recurrence and biological plausibility, the most promising candidates for translational validation include the kynurenine/tryptophan ratio, quinolinic acid, pyridoxate, nicotinamide, and N1,N12-diacetylspermine, which collectively capture immune activation, metabolic recovery, and host response dynamics.
For metabolomics-based biomarkers to become clinically actionable in TB treatment monitoring, the most realistic near-term approach is likely a targeted quantitative assay rather than untargeted discovery workflows. In practice, this would most plausibly take the form of a targeted LC–MS/MS panel measuring a small number of recurrent metabolites (e.g., 3–6 markers), selected to represent complementary biological domains such as immune activation (Trp–Kyn markers), metabolic recovery (pyridoxate, nicotinamide), and host lipid remodeling (selected lipid or bile acid features) [11,37,40,42,43,45,47]. At present, such panels should be considered exploratory and hypothesis-generating, pending rigorous external validation, calibration assessment, and demonstration of clinical utility in prospective studies. Such panels are technically feasible, potentially cost-effective, and compatible with standardized calibration procedures, quality control frameworks, and inter-laboratory reproducibility.
Plasma-based assays may be better suited for capturing systemic immune–metabolic shifts and lipid remodeling, whereas urine-based assays offer advantages in non-invasive sampling and feasibility for longitudinal monitoring in resource-limited settings. However, given the limited overlap between urine and plasma metabolites (Figure 3C), plasma and urine panels should be developed for distinct clinical applications rather than assumed to be interchangeable. Urine-based candidates such as N1,N12-diacetylspermine remain particularly attractive for early treatment monitoring, but require additional validation across diverse cohorts and standardized normalization strategies [16,20,21].
Across both matrices, translation will require (i) standardized biospecimen collection and processing protocols, (ii) clear reporting of metabolite identification confidence (e.g., MSI levels), (iii) harmonized clinical endpoints and sampling schedules aligned with treatment milestones, (iv) prospective multicenter external validation using pre-specified panels rather than post hoc feature selection, and (v) standardized inclusion and exclusion criteria that account for populations vulnerable to metabolic variability, including individuals with HIV infection, diabetes mellitus, or pediatric TB [5,11,12,31,48]. Without these steps, reported biomarkers are likely to remain context-specific and vulnerable to poor reproducibility across settings.
Several sources of heterogeneity complicate interpretation of the existing evidence. Differences in metabolite identification confidence (e.g., Metabolomics Standards Initiative (MSI) levels) further contribute to heterogeneity across studies. Included studies differ substantially in analytical platforms, metabolite identification confidence, preprocessing pipelines, statistical methods, sampling schedules, and definitions of treatment response [5,11,12,31]. Many studies excluded or incompletely accounted for key comorbidities such as HIV infection or diabetes mellitus, despite their known influence on metabolic pathways repeatedly implicated in this review [19,22]. Risk-of-bias assessment (Table 3) identified common concerns related to participant selection, confounding control, and analytical transparency, particularly in prediction model studies [51,52]. In addition, several studies used nested case–control designs within larger cohorts, which may introduce spectrum or selection bias and potentially inflate biomarker performance estimates compared with fully prospective cohort analyses. These limitations underscore the need for standardized metabolomic workflows, harmonized outcome definitions, and rigorous validation strategies.
Importantly, heterogeneity across studies arises from multiple sources, including biospecimen type (plasma vs. urine), analytical platform (LC–MS, GC–MS, NMR), study populations (age, HIV status, metabolic comorbidities), and endpoint definitions. These factors directly influence metabolite detectability, biological interpretation, and comparability across studies, and should be carefully considered in future validation efforts.
This review has several strengths, including comprehensive synthesis of longitudinal and outcome-focused metabolomic studies, structured subgroup analyses aligned to treatment stages and biospecimens (Figure 2 and Figure 3), and pathway-level integration of recurrent findings (Figure 4; Table 4). Limitations include the inability to perform quantitative effect-size meta-analysis due to heterogeneity, reliance on recurrence-based synthesis rather than pooled estimates, and the potential for publication bias. Accordingly, the metabolites and pathways highlighted here should be interpreted as candidate signals rather than definitive clinical biomarkers [5,11,12,31].
In summary, metabolomic profiling captures reproducible immunometabolic perturbations during TB therapy, with convergent evidence implicating the tryptophan–kynurenine axis, vitamin/cofactor metabolism, lipid remodeling, and urine polyamine-related pathways in treatment response. While these findings support the biological plausibility of metabolomics-based monitoring, substantial methodological heterogeneity and limited validation currently preclude routine clinical implementation. Prospective, multicenter studies using standardized protocols, harmonized outcome definitions, and rigorous validation frameworks will be essential to translate these promising metabolic signatures into clinically actionable tools for monitoring TB treatment response [5,11,12,31].
5. Conclusions
This review synthesizes current evidence on metabolomic biomarkers associated with TB treatment response. Across 15 human studies, reproducible but heterogeneous metabolic perturbations were observed during therapy, with convergent evidence implicating the tryptophan–kynurenine pathway, vitamin/cofactor metabolism, lipid remodeling, and urine polyamine-related pathways. While metabolomic profiling captures biologically meaningful immunometabolic changes during TB therapy, current evidence remains heterogeneous and insufficiently validated for routine clinical implementation.
These limitations reflect substantial heterogeneity in biospecimens, analytical platforms, sampling schedules, and outcome definitions, together with limited external validation. Future studies should prioritize standardized metabolomic workflows, harmonized definitions of treatment response, and prospective multicenter validation across key populations, including individuals with HIV infection and metabolic comorbidities. Such efforts will be essential to translate promising metabolomic signatures into clinically actionable tools for monitoring TB treatment response.
Supplementary Materials
The following supporting information can be downloaded at: https://www.mdpi.com/article/10.3390/diagnostics16091278/s1, Table S1. Full search strategy used for database searches.
Author Contributions
T.K.B.-N., C.Q.N., H.T.M.D., T.K.T., N.T.T.H. and H.M.N. contributed to study collection, screening, data extraction, and data synthesis, and participated in manuscript preparation. H.T.T.N., T.K.B.-N., C.Q.N. and V.L.-Q. performed the data analysis and drafted the manuscript. A.K. contributed to critical revision of the manuscript. H.T.T.N. and L.N.N. contributed to the initial conception and study design, supervised the research, and coordinated the overall project. All authors contributed to refining the study design, discussed interpretation of the results, and contributed intellectual input to the manuscript. All authors have read and agreed to the published version of the manuscript.
Funding
This research received no external funding.
Institutional Review Board Statement
Not applicable.
Informed Consent Statement
Not applicable.
Data Availability Statement
No new datasets were generated or analyzed during this study. All data analyzed in this review are derived from previously published studies cited in the manuscript.
Conflicts of Interest
Author V. L-Q. was employed by the company Novodan ApS. The remaining authors declare that the research was conducted in the absence of any commercial or financial relationships that could be construed as a potential conflict of interest.
Abbreviations
The following abbreviations are used in this manuscript:
| TB | Tuberculosis |
| LC | Liquid chromatography |
| LC-MS | Liquid chromatography–mass spectrometry |
| MS | Mass spectrometry |
| MS/MS | Tandem mass spectrometry |
| GC | Gas chromatography |
| GC-MS | Gas chromatography–mass spectrometry |
| GC×GC–MS | Two-dimensional gas chromatography time-of-flight |
| CE | Capillary electrophoresis |
| CE–MS | Capillary electrophoresis–mass spectrometry |
| NMR | Nuclear magnetic resonance |
| PRISMA | Preferred Reporting Items for Systematic Reviews and Meta-Analyses |
| PROSPERO | International Prospective Register of Systematic Reviews |
| RCT | Randomized controlled trial |
| GenAI | Generative artificial intelligence |
| PROBAST | Prediction Model Risk Of Bias Assessment Tool |
| QUIPS | Quality In Prognostic Studies |
| ELISA | Enzyme-linked immunosorbent assay |
| EoT | End of treatment |
| ML | Machine learning |
| MRM | Multiple Reaction Monitoring |
| TOF | Time of flight |
| GC×GC–TOFMS | Two-dimensional gas chromatography time-of-flight mass spectrometry |
| UPLC | Ultra performance liquid chromatography |
| K/T ratio | Kynurenine/tryptophan ratio |
| Trp–Kyn | tryptophan–kynurenine |
References
- WHO; Global Programme on Tuberculosis and Lung Health (GTB). Global Tuberculosis Report 2025; WHO: Geneva, Switzerland, 2025. [Google Scholar]
- Goletti, D.; Meintjes, G.; Andrade, B.B.; Zumla, A.; Shan Lee, S. Insights from the 2024 WHO Global Tuberculosis Report—More Comprehensive Action, Innovation, and Investments Required for Achieving WHO End TB Goals. Int. J. Infect. Dis. 2025, 150, 107325. [Google Scholar] [CrossRef] [Scilit]
- Pai, M.; Behr, M.A.; Dowdy, D.; Dheda, K.; Divangahi, M.; Boehme, C.C.; Ginsberg, A.; Swaminathan, S.; Spigelman, M.; Getahun, H.; et al. Tuberculosis. Nat. Rev. Dis. Prim. 2016, 2, 16076. [Google Scholar] [CrossRef] [Scilit] [PubMed]
- MacLean, E.L.H.; Zimmer, A.J.; den Boon, S.; Gupta-Wright, A.; Cirillo, D.M.; Cobelens, F.; Gillespie, S.H.; Nahid, P.; Phillips, P.P.; Ruhwald, M.; et al. Tuberculosis Treatment Monitoring Tests during Routine Practice: Study Design Guidance. Clin. Microbiol. Infect. 2024, 30, 481–488. [Google Scholar] [CrossRef] [Scilit] [PubMed]
- Zimmer, A.J.; Lainati, F.; Vasquez, N.A.; Chedid, C.; McGrath, S.; Benedetti, A.; MacLean, E.; Ruhwald, M.; Denkinger, C.M.; Kohli, M. Biomarkers That Correlate with Active Pulmonary Tuberculosis Treatment Response: A Systematic Review and Meta-Analysis. J. Clin. Microbiol. 2022, 60, e01859-21. [Google Scholar] [CrossRef] [Scilit] [PubMed]
- WHO 2022 Update; WHO: Geneva, Switzerland, 2022.
- Companion Handbook; WHO: Geneva, Switzerland, 2014.
- Wallis, R.S.; Wang, C.; Doherty, T.M.; Onyebujoh, P.; Vahedi, M.; Laang, H.; Olesen, O.; Parida, S.; Zumla, A. Biomarkers for Tuberculosis Disease Activity, Cure, and Relapse. Lancet Infect. Dis. 2010, 10, 68–69. [Google Scholar] [CrossRef] [Scilit]
- Babu, S. Biomarkers for Treatment Monitoring in Tuberculosis: A New Hope. eBioMedicine 2017, 26, 13–14. [Google Scholar] [CrossRef] [Scilit]
- Tounta, V.; Liu, Y.; Cheyne, A.; Larrouy-Maumus, G. Metabolomics in Infectious Diseases and Drug Discovery. Mol. Omi. 2021, 17, 376–393. [Google Scholar] [CrossRef] [Scilit]
- Yu, Y.; Jiang, X.X.; Li, J.C. Biomarker Discovery for Tuberculosis Using Metabolomics. Front. Mol. Biosci. 2023, 10, 1099654. [Google Scholar] [CrossRef] [Scilit]
- Dalamaga, M. Clinical Metabolomics: Useful Insights, Perspectives and Challenges. Metab. Open 2024, 22, 100290. [Google Scholar] [CrossRef] [Scilit]
- Abuawad, A.; Romero, M.; Jarquin, S.M.; Ghaemmaghami, A.M.; Kim, D.-H. Metabolomic Profiling of Host–Pathogen Interactions: Differential Effects of Gram-Positive and Gram-Negative Bacterial Secretomes on THP-1 Macrophage Metabolism. RSC Adv. 2025, 15, 40607–40618. [Google Scholar] [CrossRef] [Scilit]
- Ahmadi, S.; Sedaghat, F.R.; Memar, M.Y.; Yekani, M. Metabolomics in the Diagnosis of Bacterial Infections. Clin. Chim. Acta 2025, 565, 120020. [Google Scholar] [CrossRef] [Scilit] [PubMed]
- Ogger, P.P.; Murray, P.J. Dissecting Inflammation in the Immunemetabolomic Era. Cell. Mol. Life Sci. 2025, 82, 182. [Google Scholar] [CrossRef] [Scilit]
- Mahapatra, S.; Hess, A.M.; Johnson, J.L.; Eisenach, K.D.; DeGroote, M.A.; Gitta, P.; Joloba, M.L.; Kaplan, G.; Walzl, G.; Boom, W.H.; et al. A Metabolic Biosignature of Early Response to Anti-Tuberculosis Treatment. BMC Infect. Dis. 2014, 14, 53. [Google Scholar] [CrossRef] [Scilit]
- Collins, J.M.; Bobosha, K.; Narayanan, N.; Gandhi, N.R.; Day, C.L.; Rengarajan, J.; Kempker, R.R.; Lau, M.S.Y.; Nellis, M.; Tukvadze, N.; et al. A Plasma Metabolic Signature to Diagnose Pulmonary Tuberculosis and Monitor Treatment Response. J. Infect. Dis. 2025, 232, 578–587. [Google Scholar] [CrossRef] [Scilit]
- Tornheim, J.A.; Paradkar, M.; Zhao, H.; Kulkarni, V.; Pradhan, N.; Kinikar, A.; Kagal, A.; Gupte, N.; Mave, V.; Gupta, A.; et al. The Kynurenine/Tryptophan Ratio Is a Sensitive Biomarker for the Diagnosis of Pediatric Tuberculosis Among Indian Children. Front. Immunol. 2022, 12, 774043. [Google Scholar] [CrossRef] [Scilit]
- Gatechompol, S.; Lutter, R.; Vaz, F.M.; Ubolyam, S.; Avihingsanon, A.; Kerr, S.J.; van Leth, F.; Cobelens, F. The Plasma Kynurenine-to-Tryptophan Ratio as a Biomarker of Tuberculosis Disease in People Living with HIV on Antiretroviral Therapy: An Exploratory Nested Case–Control Study. BMC Infect. Dis. 2024, 24, 372. [Google Scholar] [CrossRef] [Scilit]
- Combrink, M.; Du Preez, I.; Ronacher, K.; Walzl, G.; Loots, D.T. Time-Dependent Changes in Urinary Metabolome before and after Intensive Phase Tuberculosis Therapy: A Pharmacometabolomics Study. OMICS J. Integr. Biol. 2019, 23, 560–572. [Google Scholar] [CrossRef] [Scilit]
- Xia, Q.; Lee, M.H.; Walsh, K.F.; McAulay, K.; Bean, J.M.; Fitzgerald, D.W.; Dupnik, K.M.; Johnson, W.D.; Pape, J.W.; Rhee, K.Y.; et al. Urinary Biomarkers of Mycobacterial Load and Treatment Response in Pulmonary Tuberculosis. JCI Insight 2020, 5, e136301. [Google Scholar] [CrossRef] [Scilit]
- Yang, M.; Wang, W.; Zhang, P.; Chen, X.; Liu, G.; Lu, H.; He, M.; Deng, G. Variations in Quinolinic Acid Levels in Tuberculosis Patients with Diabetes Comorbidity: A Pilot Prospective Cohort Study. Infect. Drug Resist. 2024, 17, 2975–2985. [Google Scholar] [CrossRef] [Scilit] [PubMed]
- Anh, N.K.; Phat, N.K.; Yen, N.T.H.; Jayanti, R.P.; Thu, V.T.A.; Park, Y.J.; Cho, Y.S.; Shin, J.G.; Kim, D.H.; Oh, J.Y.; et al. Comprehensive Lipid Profiles Investigation Reveals Host Metabolic and Immune Alterations during Anti-Tuberculosis Treatment: Implications for Therapeutic Monitoring. Biomed. Pharmacother. 2023, 158, 114187. [Google Scholar] [CrossRef] [Scilit] [PubMed]
- Anh, N.K.; Yen, N.T.H.; Tien, N.T.N.; Phat, N.K.; Park, Y.J.; Kim, H.S.; Vu, D.H.; Oh, J.Y.; Kim, D.H.; Long, N.P. Metabolic Phenotyping and Global Functional Analysis Facilitate Metabolic Signature Discovery for Tuberculosis Treatment Monitoring. Biochim. Biophys. Acta-Mol. Basis Dis. 2024, 1870, 167064. [Google Scholar] [CrossRef] [Scilit]
- Arriaga, M.B.; Karim, F.; Queiroz, A.T.L.; Araújo-Pereira, M.; Barreto-Duarte, B.; Sales, C.; Moosa, M.Y.S.; Mazibuko, M.; Milne, G.L.; Maruri, F.; et al. Effect of Dysglycemia on Urinary Lipid Mediator Profiles in Persons with Pulmonary Tuberculosis. Front. Immunol. 2022, 13, 919802. [Google Scholar] [CrossRef] [Scilit] [PubMed]
- Fitzgerald, B.L.; Islam, M.N.; Graham, B.; Mahapatra, S.; Webb, K.; Boom, W.H.; Malherbe, S.T.; Joloba, M.L.; Johnson, J.L.; Winter, J.; et al. Elucidation of a Human Urine Metabolite as a Seryl-Leucine Glycopeptide and as a Biomarker of Effective Anti-Tuberculosis Therapy. ACS Infect. Dis. 2019, 5, 353–364. [Google Scholar] [CrossRef] [Scilit] [PubMed]
- Shivakoti, R.; Newman, J.W.; Hanna, L.E.; Queiroz, A.T.L.; Borkowski, K.; Gupte, A.N.; Paradkar, M.; Satyamurthi, P.; Kulkarni, V.; Selva, M.; et al. Host Lipidome and Tuberculosis Treatment Failure. Eur. Respir. J. 2022, 59, 2004532. [Google Scholar] [CrossRef] [Scilit]
- Dutta, N.K.; Tornheim, J.A.; Fukutani, K.F.; Paradkar, M.; Tiburcio, R.T.; Kinikar, A.; Valvi, C.; Kulkarni, V.; Pradhan, N.; Shivakumar, S.V.B.Y.; et al. Integration of Metabolomics and Transcriptomics Reveals Novel Biomarkers in the Blood for Tuberculosis Diagnosis in Children. Sci. Rep. 2020, 10, 19527. [Google Scholar] [CrossRef] [Scilit] [PubMed]
- Luies, L.; Van Reenen, M.; Ronacher, K.; Walzl, G.; Loots, D.T. Predicting Tuberculosis Treatment Outcome Using Metabolomics. Biomark. Med. 2017, 11, 1057–1067. [Google Scholar] [CrossRef] [Scilit]
- Luies, L.; Mienie, J.; Motshwane, C.; Ronacher, K.; Walzl, G.; Loots, D.T. Urinary Metabolite Markers Characterizing Tuberculosis Treatment Failure. Metabolomics 2017, 13, 124. [Google Scholar] [CrossRef] [Scilit]
- Kirwan, J.A. Translating Metabolomics into Clinical Practice. Nat. Rev. Bioeng. 2023, 1, 228–229. [Google Scholar] [CrossRef] [Scilit]
- Page, M.J.; McKenzie, J.E.; Bossuyt, P.M.; Boutron, I.; Hoffmann, T.C.; Mulrow, C.D.; Shamseer, L.; Tetzlaff, J.M.; Akl, E.A.; Brennan, S.E.; et al. The PRISMA 2020 Statement: An Updated Guideline for Reporting Systematic Reviews. BMJ 2021, 372, n71. [Google Scholar] [CrossRef] [Scilit]
- Scalbert, A.; Brennan, L.; Fiehn, O.; Hankemeier, T.; Kristal, B.S.; van Ommen, B.; Pujos-Guillot, E.; Verheij, E.; Wishart, D.; Wopereis, S. Mass-Spectrometry-Based Metabolomics: Limitations and Recommendations for Future Progress with Particular Focus on Nutrition Research. Metabolomics 2009, 5, 435–458. [Google Scholar] [CrossRef] [Scilit]
- Long, N.P.; Heo, D.Y.; Park, S.; Yen, N.T.H.; Cho, Y.S.; Shin, J.G.; Oh, J.Y.; Kim, D.H. Molecular Perturbations in Pulmonary Tuberculosis Patients Identified by Pathway-Level Analysis of Plasma Metabolic Features. PLoS ONE 2022, 17, e0262545. [Google Scholar] [CrossRef] [Scilit]
- Mellor, A. Indoleamine 2,3 Dioxygenase and Regulation of T Cell Immunity. Biochem. Biophys. Res. Commun. 2005, 338, 20–24. [Google Scholar] [CrossRef] [Scilit] [PubMed]
- Suzuki, Y.; Miwa, S.; Akamatsu, T.; Suzuki, M.; Fujie, M.; Nakamura, Y.; Inui, N.; Hayakawa, H.; Chida, K.; Suda, T. Indoleamine 2,3-Dioxygenase in the Pathogenesis of Tuberculous Pleurisy. Int. J. Tuberc. Lung Dis. 2013, 17, 1501–1506. [Google Scholar] [CrossRef] [Scilit] [PubMed]
- Badawy, A.A.B. Kynurenine Pathway of Tryptophan Metabolism: Regulatory and Functional Aspects. Int. J. Tryptophan Res. 2017, 10, 1178646917691938. [Google Scholar] [CrossRef] [Scilit]
- Adu-Gyamfi, C.G.; Savulescu, D.; George, J.A.; Suchard, M.S. Indoleamine 2, 3-Dioxygenase-Mediated Tryptophan Catabolism: A Leading Star or Supporting Act in the Tuberculosis and HIV Pas-de-Deux? Front. Cell. Infect. Microbiol. 2019, 9, 372. [Google Scholar] [CrossRef] [Scilit]
- Cervenka, I.; Agudelo, L.Z.; Ruas, J.L. Kynurenines: Tryptophan’s Metabolites in Exercise, Inflammation, and Mental Health. Science 2017, 357, eaaf9794. [Google Scholar] [CrossRef] [Scilit]
- Seo, S.K.; Kwon, B. Immune Regulation through Tryptophan Metabolism. Exp. Mol. Med. 2023, 55, 1371–1379. [Google Scholar] [CrossRef] [Scilit] [PubMed]
- Russell, D.G.; Cardona, P.-J.; Kim, M.-J.; Allain, S.; Altare, F. Foamy Macrophages and the Progression of the Human Tuberculosis Granuloma. Nat. Immunol. 2009, 10, 943–948. [Google Scholar] [CrossRef] [Scilit]
- Lovewell, R.R.; Sassetti, C.M.; VanderVen, B.C. Chewing the Fat: Lipid Metabolism and Homeostasis during M. tuberculosis Infection. Curr. Opin. Microbiol. 2016, 29, 30–36. [Google Scholar] [CrossRef] [Scilit]
- Fleishman, J.S.; Kumar, S. Bile Acid Metabolism and Signaling in Health and Disease: Molecular Mechanisms and Therapeutic Targets. Signal Transduct. Target. Ther. 2024, 9, 97. [Google Scholar] [CrossRef] [Scilit]
- Tamber, S.S.; Bansal, P.; Sharma, S.; Singh, R.B.; Sharma, R. Biomarkers of Liver Diseases. Mol. Biol. Rep. 2023, 50, 7815–7823. [Google Scholar] [CrossRef] [Scilit]
- Qi, L.; Chen, Y. Circulating Bile Acids as Biomarkers for Disease Diagnosis and Prevention. J. Clin. Endocrinol. Metab. 2023, 108, 251–270. [Google Scholar] [CrossRef] [Scilit] [PubMed]
- Zou, P.; Wang, L. Dietary Pattern and Hepatic Lipid Metabolism. Liver Res. 2023, 7, 275–284. [Google Scholar] [CrossRef] [Scilit]
- Kang, S.; Jeong, D.Y.; Seo, J.; Daily, J.W.; Park, S. Microbiota-Mediated Bile Acid Metabolism as a Mechanistic Framework for Precision Nutrition in Gastrointestinal and Metabolic Diseases. Cells 2025, 15, 23. [Google Scholar] [CrossRef] [Scilit] [PubMed]
- González-Domínguez, R.; González-Domínguez, Á.; Sayago, A.; Fernández-Recamales, Á. Recommendations and Best Practices for Standardizing the Pre-Analytical Processing of Blood and Urine Samples in Metabolomics. Metabolites 2020, 10, 229. [Google Scholar] [CrossRef] [Scilit] [PubMed]
- Ali, A.M.; Monaghan, C.; Muggeridge, D.J.; Easton, C.; Watson, D.G. LC/MS-Based Discrimination between Plasma and Urine Metabolomic Changes Following Exposure to Ultraviolet Radiation by Using Data Modelling. Metabolomics 2023, 19, 13. [Google Scholar] [CrossRef] [Scilit]
- Qiu, S.; Cai, Y.; Yao, H.; Lin, C.; Xie, Y.; Tang, S.; Zhang, A. Small Molecule Metabolites: Discovery of Biomarkers and Therapeutic Targets. Signal Transduct. Target. Ther. 2023, 8, 132. [Google Scholar] [CrossRef] [Scilit]
- Moons, K.G.M.; Wolff, R.F.; Riley, R.D.; Whiting, P.F.; Westwood, M.; Collins, G.S.; Reitsma, J.B.; Kleijnen, J.; Mallett, S.; Group, P. PROBAST: A Tool to Assess the Risk of Bias and Applicability of Prediction Model Studies. Ann. Intern. Med. 2019, 170, 51–58. [Google Scholar] [CrossRef] [Scilit]
- Hayden, J.A.; van der Windt, D.A.; Cartwright, J.L.; Côté, P.; Bombardier, C. Assessing Bias in Studies of Prognostic Factors. Ann. Intern. Med. 2013, 158, 280–286. [Google Scholar] [CrossRef] [Scilit]

Disclaimer/Publisher’s Note: The statements, opinions and data contained in all publications are solely those of the individual author(s) and contributor(s) and not of MDPI and/or the editor(s). MDPI and/or the editor(s) disclaim responsibility for any injury to people or property resulting from any ideas, methods, instructions or products referred to in the content. |
© 2026 by the authors. Licensee MDPI, Basel, Switzerland. This article is an open access article distributed under the terms and conditions of the Creative Commons Attribution (CC BY) license.