


Abstract
Background/Objectives: Treatment of recurrent glioblastoma is usually chosen from the molecular profile of the first resection, because few patients undergo a second operation. We asked whether the expression change from the primary to the recurrent tumour is shared and reproducible across independent cohorts measured on different platforms. Methods: Two public patient-matched cohorts were reanalysed: bulk RNA sequencing of 14 pairs (GSE339484) and the 784-gene NanoString PanCancer IO 360 panel of 17 pairs (GSE254874). Expression values were never pooled: each patient’s recurrent-minus-primary difference was computed within its own cohort, and only those differences, or models trained within one cohort, crossed between cohorts, across the 699 genes measured in both. Results: Of 67 genes that changed significantly in the panel cohort (q < 0.05), 64 (95.5%) changed in the same direction in the RNA-seq cohort (patient-level sign-flip permutation p = 0.006; binomial p = 6.8 × 10⁻¹⁶). Median changes correlated across all 699 genes (ρ = 0.563; patient-pair resampling interval 0.16–0.57). A classifier trained in one cohort separated already measured primary from recurrent samples in the other (area under the curve 0.95 and 0.81); discrimination survived locking the preprocessing, thresholded classification did not. Myeloid and interferon programmes rose and proliferation and matrix programmes fell, agreeing in direction between cohorts, but no programme reached significance in both under a null-preserving gene correlation, and stemness was not testable in the panel cohort. The magnitude of change showed no detectable association with the interval between operations (ρ = −0.06, p = 0.81, n = 17), whereas an exploratory projection onto the recurrence-associated direction decreased with it (ρ = −0.56, p = 0.019). VEGFA, the largest single change in the panel cohort, did not replicate. Conclusions: The direction of the primary-to-recurrence shift reproduces across cohorts and platforms; its magnitude in an individual patient, and cohort-specific changes such as that of VEGFA, do not. These analyses establish cross-platform reproducibility of an average, cohort-level change, rather than prediction of an individual patient’s recurrent profile.
1. Introduction
Glioblastoma recurs after resection, radiotherapy and temozolomide in nearly every patient; in the trial that established this regimen, the median survival was 14.6 months [1]. Treatment at recurrence is not standardised, and is selected on prior therapy, age, performance status and MGMT promoter methylation [2]. Only a minority of patients undergo a second operation: 12% of newly diagnosed patients in an Austrian population cohort [3] and 18.7% in a Dutch multicentre series [4]. Molecular data at recurrence are, therefore, predominantly derived from the initial tumour [5]. Trial eligibility at recurrence is commonly assessed on primary tissue because second surgery is not routine [6], and about 80% of the samples behind one recurrent-disease trial were primary tumours [7]. The European Association of Neuro-Oncology, nonetheless, prefers the most recent tissue for molecular testing, because alterations may change over time [8], and MGMT promoter status changed between primary and relapse in 24% of patients in a pooled analysis [9]. Whether the recurrent tumour can be anticipated from the primary is, therefore, a practical question for every patient who is not re-operated.
At the DNA level, the answer has been that recurrence is largely patient-specific. Recurrence-specific driver alterations are rare [10], relapses acquire no stereotyped mutations [11], and clonal evolution under therapy is highly branched [12]. At the level of expression and microenvironment, patient-matched studies have multiplied, but disagree. The dominant transcriptional subtype was retained in 55% of cases in one series [13] and switched in 49% of IDH-wild-type tumours in another [14]. In 322 test and 245 validation RNA-seq samples, an extracellular-matrix gene set increased at recurrence, together with tumour-associated macrophages, while tumour purity fell [15]; a proteogenomic study of 123 pairs, instead, described a proliferative state at diagnosis replaced by neuronal and synaptogenic programmes at recurrence [16]. Single-nucleus profiling of 59 patients found no consistent malignant-state trajectory across the cohort [17], and in 107 pairs a subset of genes rose from primary to recurrence in two-thirds of patients and fell in the remaining third [18]. For myeloid cells, monocyte-derived macrophages outnumbered microglia-derived macrophages after recurrence [19], whereas mass cytometry of 13 initial and three recurrent tumours found glioma-associated microglia and macrophages to constitute 59.05% and 27.87% of immune cells, respectively [20].
Two features of this literature leave a specific question open. First, where longitudinal findings have been validated, the validation used the same measurement technology as the discovery set [15,18]; whether a within-patient change survives a change of platform which removes shared technical artefacts, has not been tested in the studies reviewed here. Second, the original reports of the two cohorts analysed below each described differences between primary and recurrent tumours within their own patients: a neuroinflammatory pathway was enhanced in recurrent grade IV tumours [21], in data first generated in [22], neuron-related functions increased [23], and lower levels of VEGFA, CDH11, LOXL2, NOTCH1, HEY1 and SOX2 were found at recurrence [24]. Neither asked whether its changes appear in another cohort. A single small cohort cannot settle this alone. With 14 pairs, the smallest p-value an exact two-sided signed-rank test can return is 2/214 = 1.22 × 10⁻⁴; whether any gene then survives Benjamini–Hochberg adjustment depends on how many of the tested genes attain that value, so it is a property of the observed p-value distribution, rather than a fixed consequence of the sample size. In the transcriptome-wide analysis reported below, 22 of 23,084 genes attained that minimum, 57 would have been required for adjusted significance at q < 0.05, and the smallest observed adjusted p-value was 0.123. No gene was therefore discovered at the transcriptome-wide level in this cohort, and gene lists obtained from cohorts of this size are expected to differ.
We therefore reanalysed two public patient-matched cohorts from different countries and platforms under one rule: expression values were never combined across cohorts, each patient’s recurrent-minus-primary difference was computed within its own dataset, and only those differences were compared. The gene set was fixed before testing as the targeted panel genes measured in both cohorts. We asked whether genes that change in one cohort change in the same direction in the other, whether a classifier or an average change learned in one cohort recognises the recurrent specimen of patients in the other, which programmes carry the shared change, and whether the change scales with the interval between operations.
2. Materials and Methods
2.1. Cohorts
Two Gene Expression Omnibus (GEO) series of patient-matched primary and recurrent tumours were used (Table 1; Table S1). Cohort A, GSE339484 (Taipei Medical University, Taiwan), comprises bulk RNA-seq (Illumina NovaSeq 6000 (Illumina, San Diego, CA, USA), GPL24676) of 14 patients with tissue from the first and the second resection [22]. Cohort B, GSE254874 (University of Basel, Switzerland), comprises the NanoString nCounter PanCancer IO 360 panel (NanoString Technologies, Seattle, WA, USA; GPL32130) for 17 patients with primary and recurrent IDH-wild-type glioblastoma [24]. GSE254875 is the SuperSeries of GSE254874 and contains the same patients; it was not used as a further cohort. Participant overlap between the cohorts was excluded from the GEO sample records and the original reports: cohort-A specimens were collected in Taiwan under Chang Gung Memorial Hospital ethics approval and deposited by Taipei Medical University, with no collection period reported [22], whereas all cohort-B patients underwent both operations at University Hospital Basel, Switzerland, between 2010 and 2020 [24]; the two series share no submitters, and their patient identifiers follow unrelated schemes (Patient01–Patient14 versus numeric identifiers 38–623).
Table 1.
Characteristics of the two cohorts.
Cohort definitions differ from the original reports in four respects, each stated here. (i) All 14 deposited pairs of cohort A were analysed: the per sample annotations list 10 grade 4 IDH1-wild-type pairs, one grade 3 IDH1-wild-type pair and three IDH1-mutant pairs (one grade 3, two grade 4), whereas the series summary describes 11 glioblastoma and three IDH-mutant grade 3 pairs; because the two annotations disagree, the series was analysed as deposited, rather than reclassified, the IDH-mutant pairs, which are not glioblastoma under the 2021 WHO classification [25], are treated as a limitation, and the analysis was repeated without them. (ii) All 17 pairs in the deposited IO 360 matrix of cohort B were used, whereas the original report analysed 15 patients [24]. The original describes collecting tissue from 17 patients, normalising the IO 360 and Neuroinflammation panels independently, aggregating them, and retaining the samples that passed that joint normalisation, which left 30 samples from 15 patients. The two patients dropped at that step are not identified in the report and carry no exclusion flag in the GEO records, so only one of them can be recovered from the primary sources: the original gives a relapse interval range of 148–921 days, which excludes the single 1260-day pair present in the deposited records (patient 380). The second cannot be identified, and is not guessed here. Because the quality criterion applied by the original operates on the two panels jointly, it does not transfer to an analysis that uses the IO 360 matrix alone; in that matrix, no sample is an outlier on per sample median, interquartile range or correlation with the cohort median profile (no robust |z| above 3 among the 34 samples, and patient 380 ranks in the middle of the distribution; Table S7). To show that the choice does not drive the result, the principal concordance and discrimination analyses were repeated in all 16 possible 15-pair subsets that exclude patient 380, together with one further pair (Section 3.4; Table S8). (iii) Relapse intervals were taken from the GEO sample records (148–1260 days), whereas the original report gives 148–921 days [24]; this difference is, itself, informative, since the 1260-day pair is the one patient that can be shown not to have entered the original 15-patient analysis. (iv) In cohort B, all patients received chemoradiotherapy before the second operation and bevacizumab was given only after it [24]; treatment between operations is not recorded for cohort A, and its primary specimens are described as treatment-naïve [21].
2.2. Expression Data
For cohort A, the deposited gene-level table was used (58,220 Ensembl genes, 28 samples). The GEO processing field describes the file as raw counts, but 42.8% of the values are non-integer, and the column sums range from 1.94 × 10⁷ to 2.73 × 10⁷, rather than being held at a constant total, so the values are neither raw counts nor counts per million or transcripts per million. The identifier column is headed “tracking_id”, the identifier field of the Cufflinks and Cuffnorm family of outputs; taken together with the non-integer values and the non-constant column totals, the deposited values are most consistent with gene-level, library-size-normalised estimated fragment counts. This is an inference from the structure of the file, rather than a statement by the depositors, and the unit is therefore reported as a normalised gene-level abundance of unspecified scale. Because the values are not integer counts and no constant library total is imposed, a count-based model was not applicable; the values were transformed as log2(x + 1) and genes with a value above 1 in at least half of the 28 samples were retained (23,084 genes), and the principal replication result was confirmed under alternative normalisations (Section 3.4). Ensembl identifiers were mapped to gene symbols with mygene.info [26] (queried 15 September 2026; 20,373 of 23,084 mapped), and values of identifiers sharing a symbol were averaged. For cohort B, the deposited processed matrix (784 genes; log2 counts per million after cyclic loess normalisation by the submitters) was used without further transformation. A repeated mapping on 14 October 2026 changed three symbols, none among the panel genes, and left every result unchanged. Sample structure was examined within each cohort by principal component analysis of gene-centred values and by sample–sample Spearman correlation.
2.3. Within-Patient Differences
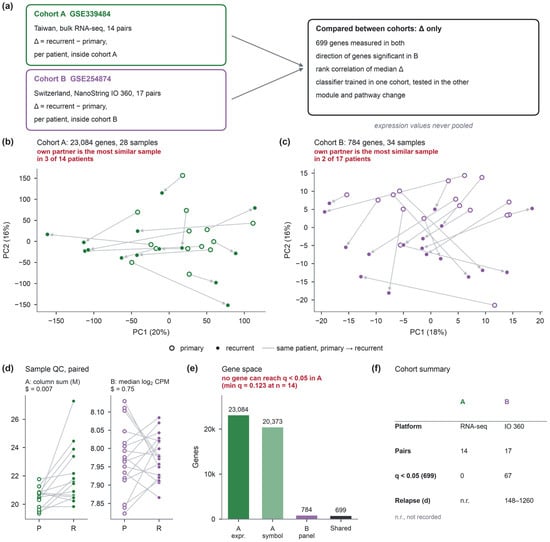
For each patient with exactly one primary and one recurrent sample, the recurrent—primary difference was computed for every gene within the patient’s own cohort (Figure 1a). No expression value was compared or combined across cohorts. All comparisons between cohorts use only these differences, statistics derived from them, or models fitted within one cohort and applied to the other cohort after standardisation within that cohort.
Figure 1.
Design and cohorts. (a) Two independent patient-matched cohorts on different platforms; the recurrent—primary difference is computed for each patient inside his or her own cohort, and only differences, or models fitted within one cohort, are compared between cohorts. (b,c) Principal component analysis within cohort A (23,084 genes) and cohort B (784 genes); open circles, primary; filled circles, recurrent; arrows join the two samples of each patient. (d) Column sum of deposited values in cohort A and median log2 counts per million in cohort B, primary versus recurrent; paired Wilcoxon signed-rank p. (e) Gene space of the two cohorts. (f) Cohort summary.
2.4. Gene-Level Tests and Replication
The analysis was restricted to the 699 panel genes measured in both cohorts. In each cohort, a two-sided Wilcoxon signed-rank test was applied to the within-patient differences of each gene, and p-values were adjusted by the Benjamini–Hochberg procedure across the 699 genes. Replication was assessed as (i) the proportion of genes significant in cohort B (q < 0.05) whose median difference in cohort A had the same sign, tested against 0.5 with an exact binomial test; (ii) the same proportion among the 30 genes with the smallest q in cohort B; (iii) the Spearman correlation of median differences across all 699 genes; and (iv) concordance-at-the-top curves, the shared fraction of the top k genes ranked by signed −log10 p in each cohort. Cohort B was used as the reference because it is the cohort in which genes reach q < 0.05 in these data: across the 699 shared genes, the smallest observed adjusted p-value is 0.019 in cohort B and 0.085 in cohort A, so cohort B yields 67 significant genes and cohort A none (Section 3.2). This is an observed property of the two datasets, and not a limit imposed by the sample size.
Because the binomial test treats genes as independent, two permutation nulls were added (10,000 permutations each): flipping the sign of each cohort-A patient’s whole difference vector at random, which preserves the correlation between genes, and shuffling gene labels. The uncertainty of the replication statistics is expressed primarily by resampling patient pairs with replacement in both cohorts (10,000 resamples), reported as 95% percentile intervals. Two versions are given because they condition on different things: one holds the cohort-B gene selection fixed at the genes selected in the full cohort, and one repeats that selection inside every resample so that the selection step enters the uncertainty. The patient-level sign-flip permutation test is reported alongside this, as the test of the null hypothesis. A Fisher z 95% confidence interval is also given for comparison only; it treats the 699 genes as independent, which co-regulated genes are not, and is therefore not used as the principal interval.
2.5. Classifier
To ask whether the recurrent state learned in one cohort is recognised in the other, an elastic-net logistic regression (scikit-learn 1.9.1; l1 ratio 0.5, C = 1, fixed in advance without tuning) was trained to separate primary from recurrent samples on the 699 shared genes. Each gene was standardised within the cohort in which the model is applied, using that cohort’s samples only and no labels, so that no expression value crossed platforms. This is a transductive evaluation: although no label of the target cohort is used, the distribution of the target cohort enters the preprocessing. The main analysis is therefore described as target-cohort-standardised discrimination between already measured primary and recurrent specimens, and not as the application of a fixed pipeline to an isolated new specimen. Three further settings are reported alongside this, and differ only in the samples allowed to contribute to the standardisation parameters: a fully locked pipeline that carries the training cohort’s parameters over unchanged; a leave-pair-out variant that estimates the target-cohort parameters without the evaluated pair; and a locked pipeline applied to within-sample ranks of the 699 genes, which requires no cohort-level estimate at all. Every preprocessing quantity and the samples used to estimate it are listed in Table S5. Performance within a cohort was estimated by leave-one-pair-out cross-validation, with standardisation refitted in each training fold. Cross-cohort performance was estimated by training on all samples of one cohort and testing on the other, in both directions. Discrimination is reported as the area under the receiver operating characteristic curve (AUC) and as paired accuracy, the fraction of patients whose recurrent sample received the higher score; significance was obtained by swapping labels within test pairs 2000 times; the statistic tested in this way is the AUC, and the corresponding test of paired accuracy is reported separately. Uncertainty in both statistics is given as a 95% percentile interval from 2000 patient-pair bootstrap resamples of the test cohort. A variant in which each patient’s two samples were centred on their own mean, which uses the pairing but not the labels, is reported alongside this.
2.6. Exploratory Cross-Cohort Analysis of Individual Change
The mean within-patient difference vector over the 699 genes was computed in one cohort and correlated (Spearman) with each individual patient’s difference vector in the other cohort, in both directions. Whether the per patient correlations exceeded zero was tested with a one-sided Wilcoxon signed-rank test, and a null distribution of the median correlation was generated by permuting the gene labels of the training vector 2000 times.
2.7. Modules and Pathways
Three modules were defined before testing, from canonical markers (Table S2): myeloid/macrophage (CSF1R, SIRPA, MS4A6A, IRF8, DAB2, CMKLR1, AIF1, ITGAM, CD163, MRC1, TYROBP, FCGR3A, C1QA, C1QB), stemness (SOX2, NOTCH1, OLIG2, NES, POU3F2, DLL3, ASCL1) and mesenchymal/extracellular matrix (VCAN, LOXL2, CDH11, FN1, COL1A1, SERPINE1, TGFB1, CD44). For each patient, the module change was the mean within-patient difference of the member genes measured in that cohort; modules with fewer than three measured genes were not tested. Module changes were tested with a two-sided Wilcoxon signed-rank test; figures show the median with the interquartile range across patients. Sensitivity to module definition was examined by leaving out one gene at a time, and by an extended gene list. Preranked gene-set enrichment analysis [27] was run on the MSigDB Hallmark collection v2024.1 [28], ranking genes by signed −log10 p: genome-wide in cohort A (minimum set size 15) and on the panel in cohort B (minimum set size 10), with 2000 gene-set permutations and Benjamini–Hochberg adjustment. Gene-set permutation does not preserve the correlation between genes, so a second null was added in which the primary and recurrent labels of each patient were swapped at random, the per gene statistics and the whole ranking were regenerated, and the pathway statistic was recomputed (1000 swaps). Because whole patients are flipped, the correlation structure among genes is preserved. A third analysis restricted both cohorts to the same universe of the 699 genes measured in both, with a minimum set size of 10 on both sides. Coverage, defined as the fraction of a set’s genes that are measured, and the leading-edge genes are reported for every set (Table S13).
2.8. Sensitivity Analyses and Relapse Interval
The replication statistics were recomputed in the following way: (i) after excluding the three IDH-mutant pairs of cohort A, and after additionally excluding the grade 3 IDH-wild-type pair; (ii) under alternative normalisations, applied as follows. Upper-quartile scaling was computed on the deposited values before any logarithm, as log2(x/q + 1) rescaled by the mean upper quartile, with the upper quartile taken over genes with a non-zero row sum; the gene filter of the main pipeline was then applied unchanged, so that the gene set was identical across normalisations. Quantile normalisation was applied after the log2(x + 1) transformation and after filtering, mapping each sample’s ranks to the mean of the sorted values across the 28 samples. In cohort B, per sample median centring subtracted each sample’s own median from the deposited log2 counts per million before within-patient differences were taken, and genes were re-tested, which gave 66, rather than 67, significant genes; and (iii) leaving out one pair at a time in either cohort. Two quantities were defined before testing, and analysed separately in cohort B. The first is the projection of a patient’s 699-gene difference vector onto a recurrence-associated direction, taken as the mean within-patient difference vector of the other cohort so that the direction is not estimated from the data being scored; a variant using the direction estimated within cohort B, and a sign-weighted mean over the genes significant in cohort B, are reported as sensitivity analyses. The second is the magnitude of the difference vector, the Euclidean norm over the 699 genes, which uses no direction; norms and mean absolute differences restricted to the significant genes are reported alongside. The mean difference over the significant genes used previously is retained for comparison only; because those genes comprise 37 increases and 30 decreases, that score retains a median of 13% of the within-patient movement (range 3–37%) and cannot measure the size of the shift. Each score was correlated with the relapse interval by Spearman correlation, with 95% percentile intervals from 10,000 patient bootstrap resamples, leave-one-patient-out influence, and Benjamini–Hochberg adjustment across the two prespecified quantities.
2.9. Software
Analyses were run in Python 3.11.10 with NumPy 2.4.6, pandas 2.3.3, SciPy 1.17.1, statsmodels 0.15.0, scikit-learn 1.9.1 and Matplotlib 3.11.2. The original pipeline was re-executed on 14 October 2026 from the deposited files and reproduced every intermediate table, byte for byte. Generative artificial intelligence was used in the preparation of this work: Claude (Anthropic), Claude Code version 2.1.322, was used for analysis scripting, figure generation, literature searching and drafting of the text. It was not used to generate, alter or select data, and every number reported here was read from a file produced by the analysis code and checked by the authors against the source files. The authors have reviewed and edited the output and take full responsibility for the content.
3. Results
3.1. Two Cohorts on Two Platforms
Cohort A contributed 14 pairs with 23,084 expressed genes and cohort B 17 pairs with 784 panel genes; 699 genes were measured in both (Figure 1e,f). Within each cohort, the first two principal components explained 20% and 16% (cohort A) and 18% and 16% (cohort B) of the variance, and the recurrent sample did not sit beside its own primary: a patient’s two samples were each other’s most similar sample in three of 14 patients in cohort A and two of 17 in cohort B (Figure 1b,c). Per sample distributions showed no outlying sample (Figure S1). In cohort A, the column sum of the deposited values was higher in recurrent than primary samples (paired p = 0.007, higher in 11 of 14 patients; Figure 1d). Summaries that respond differently to a technical and to a compositional cause were compared (Table S10). The number of genes with a non-zero value did not differ (p = 1.00), nor did the median of the non-zero values (p = 0.36) or a median-of-ratios size factor (p = 0.63), so the difference does not carry the signature of a global difference in library size or detection depth. Removing the 50 most abundant genes removed the difference (p = 0.22), and the share of the total held by the 100 most abundant genes was higher at recurrence (p = 0.035, higher in 11 of 14 patients), which points to a shift in composition towards the most abundant transcripts. The difference did not propagate into the filtered log2 matrix that was analysed (p = 0.22), and the within-patient change in column sum was not associated with the mean within-patient difference over the 699 analysed genes (Spearman rho = −0.42, p = 0.14). These observations are more consistent with a compositional than with a technical origin, but the generating procedure for the deposited values has not been confirmed with the depositors, and a technical contribution cannot be excluded; the observed difference alone does not establish a normalisation error. Principal components were examined against this sum and against grade, IDH status and relapse interval (Figure S2).
3.2. Change Within Each Cohort
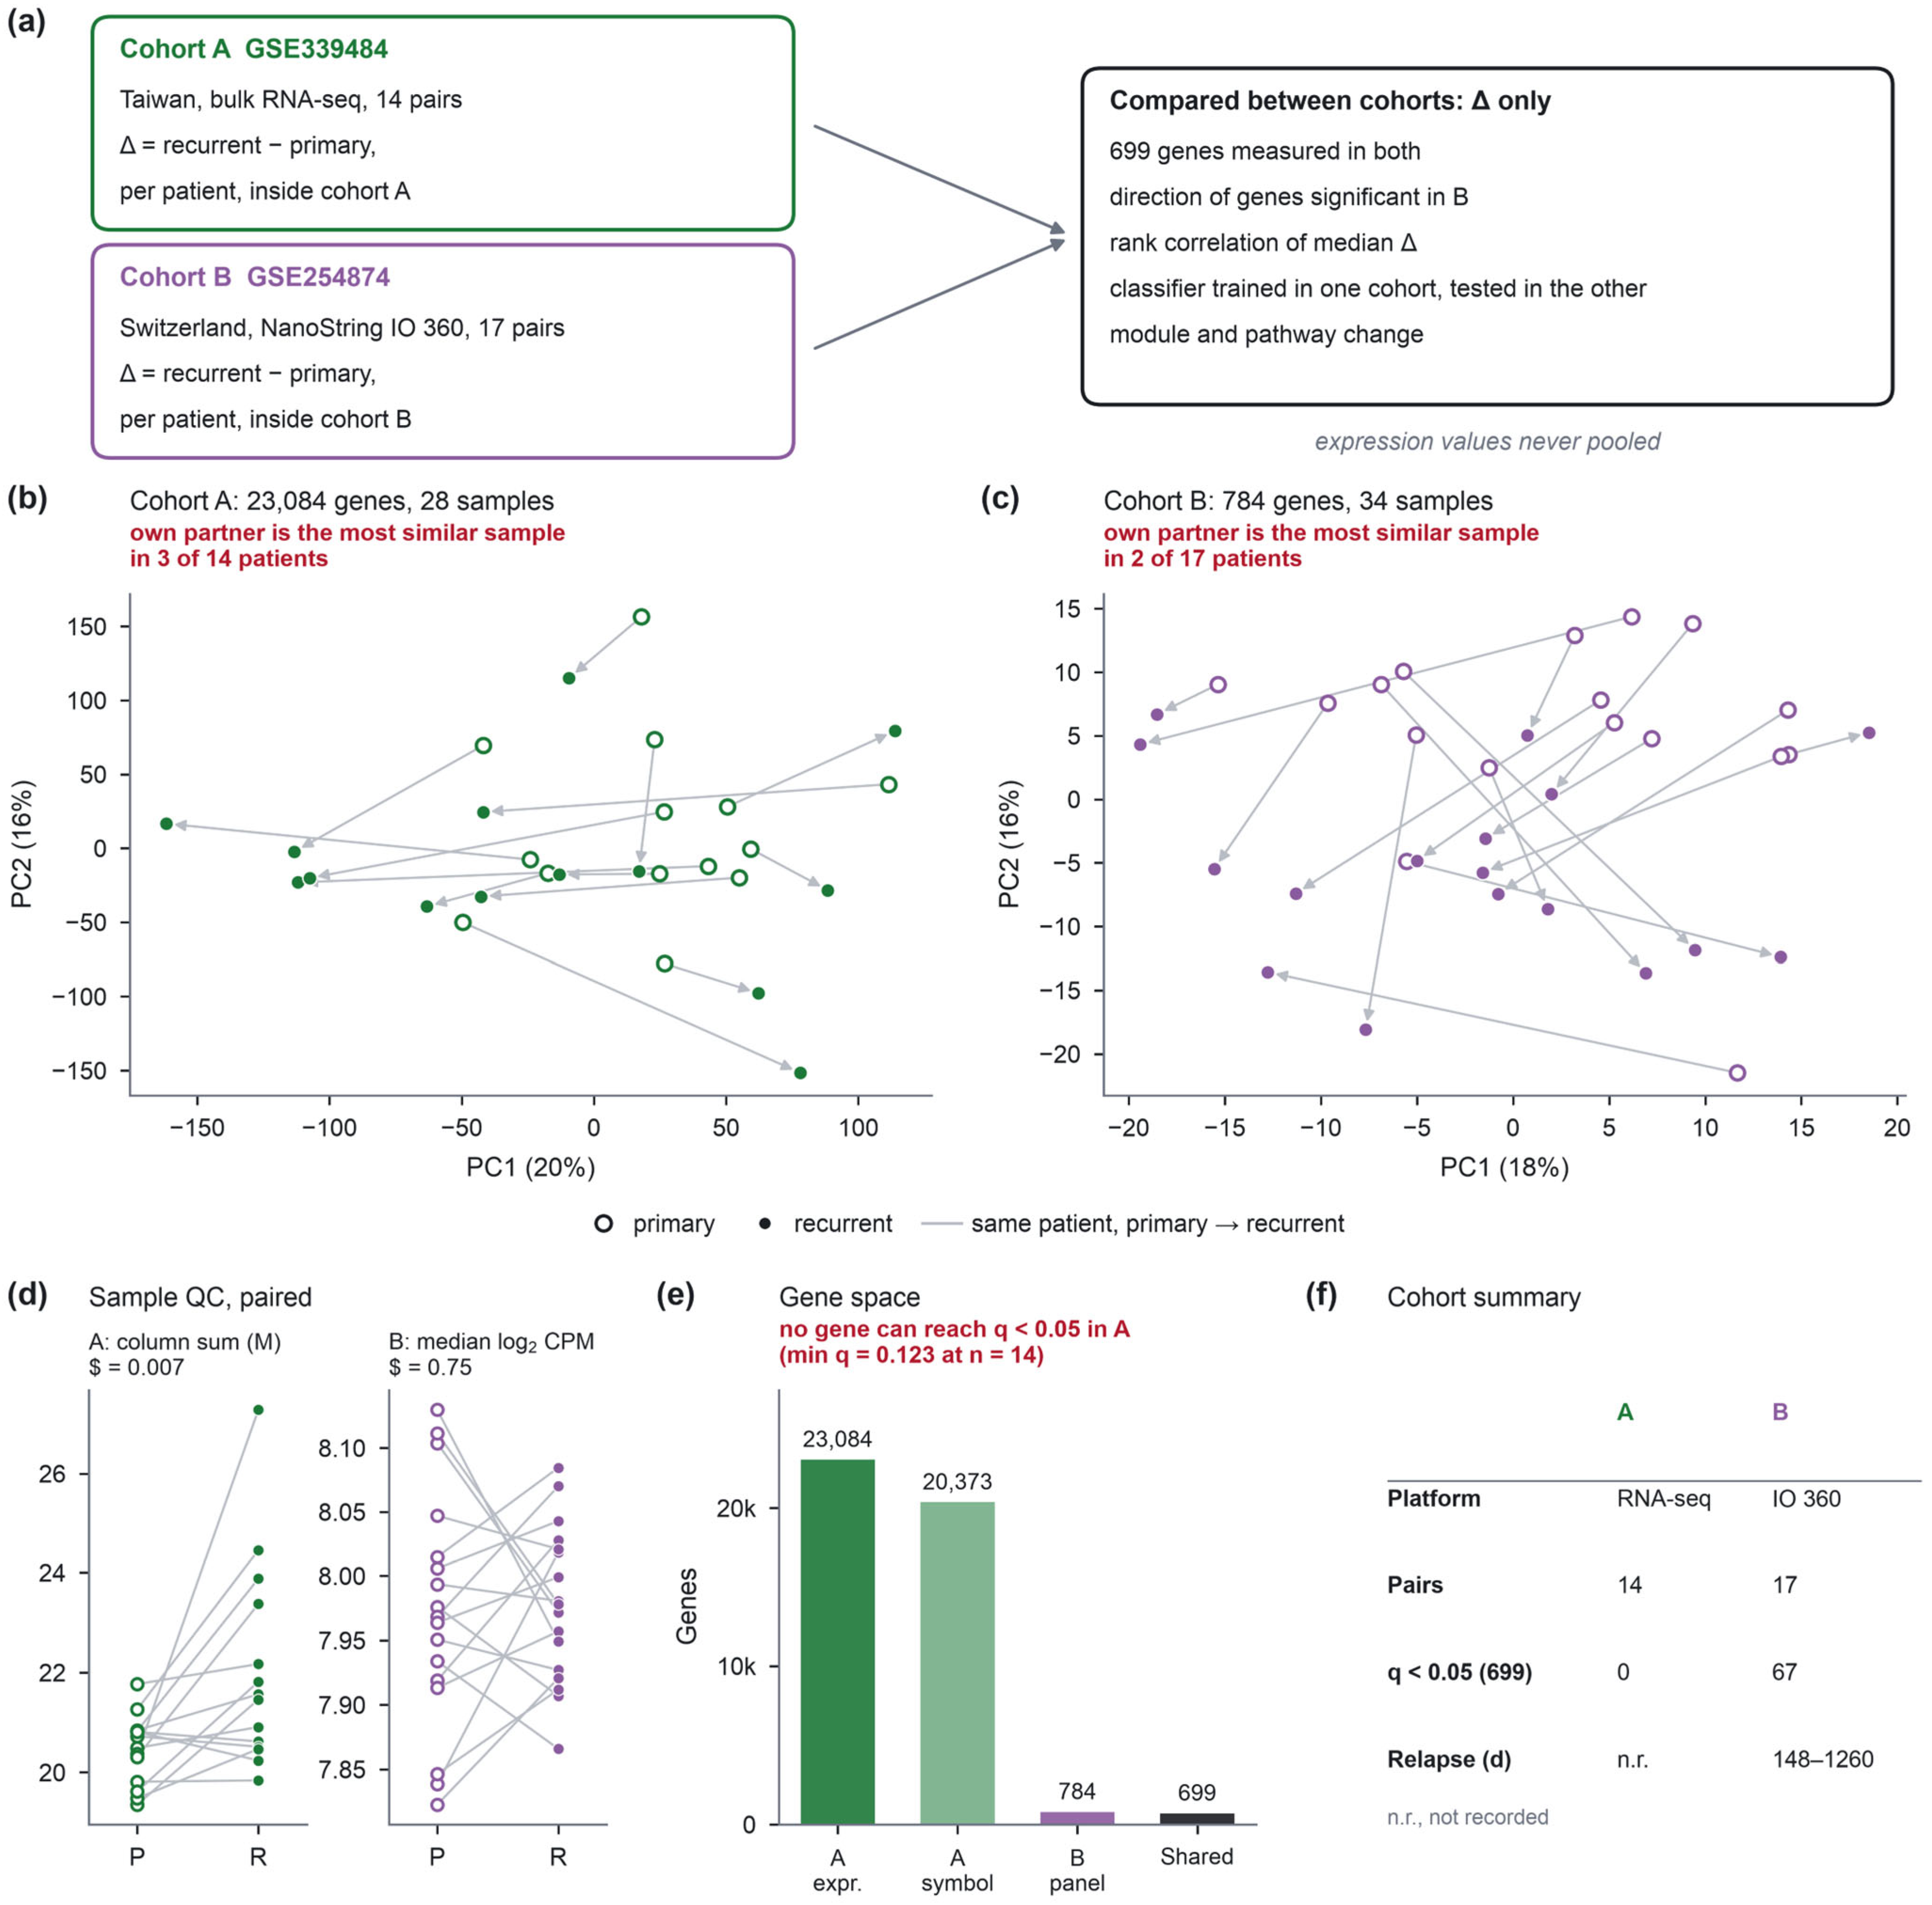
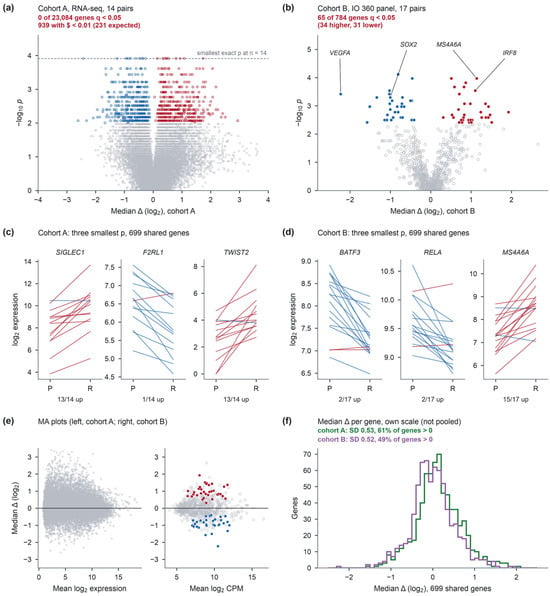
In cohort A, no gene reached q < 0.05 across the transcriptome: 22 genes attained the smallest p-value the test can return with 14 pairs (1.22 × 10⁻⁴), where 57 ties at that value would have been required for adjusted significance, and the smallest observed adjusted p-value was 0.123. Signal was, nonetheless, present in the ranked distribution, with 939 genes at p < 0.01, where 231 were expected (Figure 2a). In cohort B, 65 of the 784 panel genes reached q < 0.05 with adjustment across the panel (smallest observed adjusted p-value 0.021; Figure 2b). Adjusting instead across the 699 genes measured in both cohorts—the family used for the replication analysis—gave 67 significant genes (37 higher and 30 lower at recurrence; smallest observed adjusted p-value 0.019; Table S3). The two counts come from different testing families, and are not in conflict: 61 of the 65 are among the 699 shared genes, the remaining four are panel genes not measured in cohort A, and six further genes reach q < 0.05 only under the smaller family; no gene significant in the 784-gene family loses significance in the 699-gene family. Across the same 699 genes in cohort A, the smallest observed adjusted p-value was 0.085. The genes with the smallest p moved in the same direction in nearly every patient (Figure 2c,d). Median changes were distributed similarly in the two cohorts on their own scales (standard deviation 0.53 and 0.52; Figure 2e,f).
Figure 2.
Change between primary and recurrent tumours within each cohort. (a) Cohort A, all 23,084 expressed genes; no gene reaches q < 0.05; genes with p < 0.01 are outlined in red (higher at recurrence) or blue (lower); the dashed line marks the smallest p an exact signed-rank test can return with 14 pairs, which 22 genes attain; adjusted significance would have required 57 genes at that value. (b) Cohort B, 784 panel genes; filled, q < 0.05; open, q ≥ 0.05. (c,d) The three genes with the smallest p among the 699 shared genes in each cohort; each line is one patient, red if higher at recurrence. (e) Mean expression against median within-patient difference in each cohort. (f) Distribution of median differences of the 699 shared genes in each cohort, on its own scale.
3.3. The Change Replicates Across Cohorts and Platforms
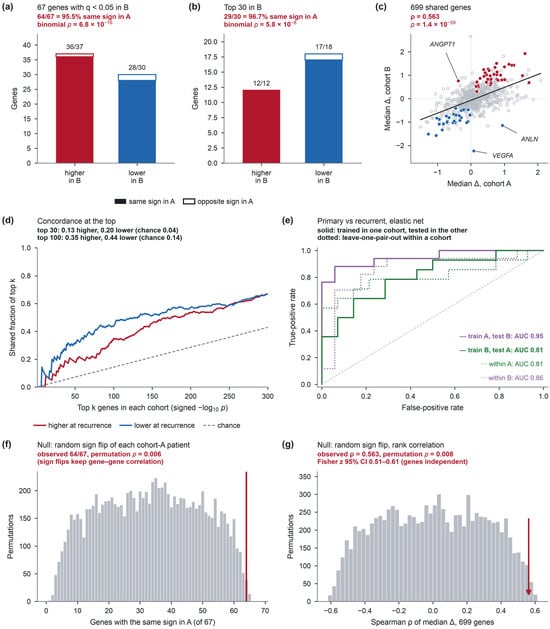
Of the 67 genes significant in cohort B, 64 changed in the same direction in cohort A (95.5%; binomial p = 6.8 × 10⁻¹⁶): 36 of 37 increases and 28 of 30 decreases (Figure 3a; Figure S3). Among the 30 genes with the smallest q in cohort B, 29 agreed (p = 5.8 × 10⁻⁸; Figure 3b). Across all 699 genes, median within-patient differences correlated with ρ = 0.563 (p = 1.4 × 10−59; Figure 3c), and the top-ranked genes overlapped beyond chance (top 30: 13% of increases and 20% of decreases shared, against 4% expected; top 100: 35% and 44%, against 14%; Figure 3d). Under the permutation that flips each cohort-A patient’s sign and keeps the correlation between genes, 64 or more agreements arose in 0.6% of permutations (p = 0.006) (Figure 3f), and a correlation of 0.563 or more in 0.8% (p = 0.008; Figure 3g); Resampling patient pairs in both cohorts gave a median correlation of 0.42 with a 95% percentile interval of 0.16–0.57 when the cohort-B gene selection was held fixed, and 0.42 with 0.15–0.57 when the selection was repeated within each resample; the correlation exceeded zero in 99.8% of resamples and exceeded 0.3 in 84%. Directional agreement had a median of 0.91 (0.72–0.97) with the selection fixed and 0.81 (0.60–0.93) with it repeated, exceeding one half in more than 99% of resamples, in both versions. The resampling distribution lies below the observed value because a resample of n patients contains, on average, about two-thirds as many distinct patients, which makes each within-patient median noisier; this shift is reported, rather than corrected. For comparison, a Fisher z 95% interval, which treats the 699 genes as independent, is 0.51–0.61, about four times narrower. The three discordant genes were VEGFA (cohort A +0.085, q = 0.91; cohort B −2.230, q = 0.022), ANGPT1 (−0.379; +0.757, q = 0.040) and ANLN (+0.940; −1.143, q = 0.040). VEGFA was the largest single change in cohort B. The angiogenesis set, as a whole, agreed no less often than the remaining genes (7 of 10 versus 476 of 689; Fisher p = 1).
Figure 3.
Reproducibility across cohorts and platforms. (a) Genes significant in cohort B (q < 0.05) by direction; filled, same sign in cohort A; open, opposite sign. (b) The 30 genes with the smallest q in cohort B. (c) Median within-patient difference in cohort A against cohort B for 699 genes with least-squares line; filled, significant in cohort B; open grey, not significant. (d) Concordance-at-the-top curves; dashed line, overlap expected by chance. (e) Receiver operating characteristic curves of the elastic-net classifier: solid, trained in one cohort and tested in the other; dotted, leave-one-pair-out within a cohort. (f) Number of the 67 genes with the same sign in cohort A when each cohort-A patient’s whole difference vector is sign-flipped at random (10,000 permutations); red line, observed. (g) Spearman correlation of median differences over 699 genes under the same permutation; arrow, observed value; the Fisher z interval in the panel treats genes as independent.
3.4. Robustness
Excluding the three IDH-mutant pairs left 63 of 67 genes concordant (binomial p = 1.1 × 10⁻¹⁴) and raised the correlation to ρ = 0.587; restricting cohort A to the 10 grade 4 IDH-wild-type pairs gave 62 of 67 and ρ = 0.596 (Figure S4). The myeloid module in cohort A, not significant with all pairs, reached p = 0.032 without the IDH-mutant pairs. Agreement was 64 of 67 under upper-quartile scaling and 65 of 67 under quantile normalisation of cohort A, and 63 of 66 under median centring of cohort B (Figure S5). Gene-label permutation gave p < 0.001 for both agreement and correlation (Figure S6). Leaving out one cohort-A pair kept agreement between 62 and 65 of 67; leaving out one cohort-B pair changed the number of genes reaching q < 0.05 in that cohort from 19 to 95, while the 699-gene correlation stayed between 0.536 and 0.583 (Figure S7; all statistics in Table S4). Resampling pairs with replacement gave a median correlation of 0.42 and a median agreement of 0.91, with 95% percentile intervals of 0.16–0.57 and 0.72–0.97 (Figure S8). Part of this shift reflects the duplication of patients inherent in resampling, which makes each within-patient median noisier, but the distribution is the patient-level sampling distribution of the statistics and is reported as such, rather than as a diagnostic. Repeating the cohort-B gene selection within each resample changed the number of selected genes from 5 to 346 and lowered the median agreement to 0.81 (0.60–0.93), while leaving the 699-gene correlation unchanged, at 0.42 (0.15–0.57), which locates the instability in the selected gene set, rather than in the overall pattern.
3.5. Models Trained in One Cohort Recognise Recurrence in the Other
The elastic-net classifier trained in cohort A separated primary from recurrent samples in cohort B with AUC = 0.95 (95% CI 0.86–1.00; paired accuracy 16 of 17, 95% CI 0.82–1.00; label-swap p < 0.001 for the AUC and p < 0.001 for paired accuracy), and the classifier trained in cohort B separated them in cohort A with AUC = 0.81 (0.68–0.92; 12 of 14, 0.64–1.00; label-swap p = 0.001 for the AUC and p = 0.008 for paired accuracy) (Figure 3e). Discrimination did not depend on the target cohort’s distribution entering the preprocessing: a fully locked pipeline gave AUC 0.89 and 0.83, and estimating the target-cohort scale without the evaluated pair gave 0.95 and 0.78. Calibration did depend on it. Under the locked pipeline in the cohort-A-to-cohort-B direction every sample received a score above 0.5, so accuracy at that threshold fell to 0.50 with specificity 0.00, while the AUC remained at 0.89. Discrimination between two already measured specimens, therefore, transfers across platforms, whereas thresholded classification of an isolated specimen does not. A locked pipeline applied to within-sample ranks, which requires no cohort-level estimate, retained both (AUC 0.92, accuracy at 0.5 of 0.91 in the cohort-A-to-cohort-B direction; AUC 0.81 and 0.71 in the other direction). Leave-one-pair-out cross-validation within each cohort gave AUC = 0.81 in cohort A and 0.86 in cohort B; centring each patient’s samples on their own mean gave cross-cohort AUCs of 0.98 and 0.93 (Figure S7). The mean change learned in cohort A correlated positively with the individual change in 15 of 17 patients in cohort B (median ρ = +0.239, range −0.225 to +0.492; p = 2.5 × 10⁻⁴), and the mean change learned in cohort B in 12 of 14 patients in cohort A (median ρ = +0.281, range −0.345 to +0.576; p = 0.0020); gene-label permutation of the training vector gave null medians within ±0.025 (p < 0.001 in both directions).
3.6. Which Programmes Carry the Shared Change?
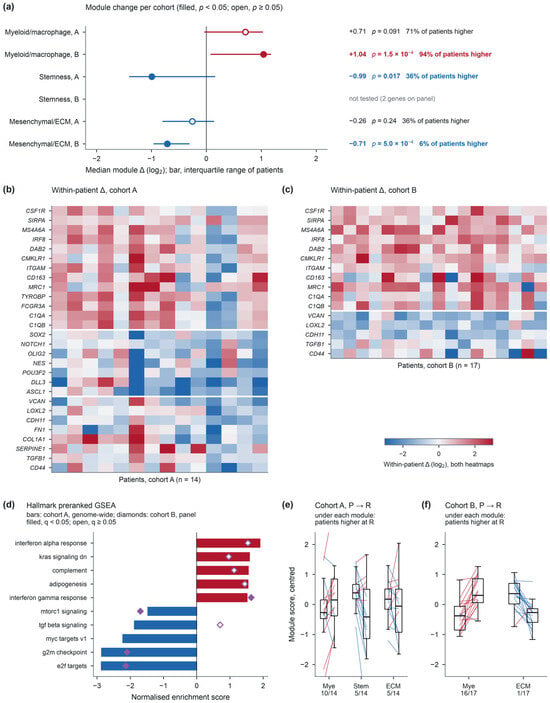
Genes higher at recurrence in cohort B were dominated by myeloid and macrophage markers (CSF1R, CD68, MS4A6A, MS4A4A, IRF8, SIRPA, CMKLR1, DAB2, FCGR1A, SIGLEC1, CTSS, LYZ), and genes lower at recurrence by stemness and Notch targets (SOX2, NOTCH1, HES1, HEY1, MYC), extracellular-matrix genes (VCAN, LOXL2, CDH11, MMP9) and proliferation genes (BIRC5, EZH2, RRM2, ANLN, TFRC). At module level (Table 2; Figure 4a–c,e,f), the myeloid module rose in both cohorts (cohort A median +0.71, higher in 71% of patients, p = 0.091; cohort B +1.04, 94%, p = 0.0002). The stemness module fell in cohort A (−0.99, p = 0.017); only two of its genes are on the panel. The mesenchymal/extracellular-matrix module fell in cohort B (−0.71, higher in 6% of patients, p = 0.0005) and, non-significantly, in cohort A (−0.26, p = 0.24). In preranked enrichment with gene-set permutations, 17 of the 50 Hallmark sets reached q < 0.05 genome-wide in cohort A: E2F targets, G2M checkpoint, MYC targets and mTORC1 signalling fell, and interferon-alpha and -gamma responses, complement and oxidative phosphorylation rose (Figure 4d). Of the 34 sets testable on the panel, normalised enrichment scores correlated between cohorts with rho = 0.70, and E2F targets, G2M checkpoint, mTORC1 signalling and the interferon-gamma response reached q < 0.05 in both with the same sign (Figure S9). Two checks qualify these results. Under the patient-based null, which preserves the correlation between genes, no set reached q < 0.05 in either cohort: the smallest unadjusted p-values were 0.008 in cohort A and 0.015 in cohort B, no set was below 0.05 in both, and for the four sets above the unadjusted p-values were 0.15–0.59 in cohort A and 0.52–0.65 in cohort B, with the normalised enrichment score of E2F targets falling from −2.86 to −1.33. With 14 and 17 patients, this null is conservative, but it was able to detect a signal, since 1000 swaps allow p-values as small as about 0.001. When both cohorts were restricted to the same 699-gene universe, the between-cohort correlation of enrichment scores was 0.80 and three, rather than, four sets reached q < 0.05 in both, with the same sign: E2F targets, G2M checkpoint and the interferon-alpha response, with mTORC1 signalling no longer among them. Coverage of the Hallmark sets by the panel is limited and uneven (median 0.17, range 0.05–0.55, against 0.96 genome-wide in cohort A), so enrichment scores from the two cohorts are not computed over comparable gene content for every set (Table S13). Outside the shared panel, 903 of 22,384 cohort-A genes reached p < 0.01, against 224 expected (Figure S9). Leaving out any single gene kept the cohort-B myeloid and mesenchymal modules and the cohort-A stemness module significant (Figure S10).
Table 2.
Module changes between primary and recurrent tumours.
Figure 4.
Modules and pathways. (a) Median module change with the interquartile range across patients; filled, p < 0.05; open, p ≥ 0.05; values written beside each estimate. (b,c) Within-patient differences of module genes in each patient of cohort A and cohort B; white lines separate the myeloid, stemness and mesenchymal/extracellular-matrix modules. Cells have the same size in both heatmaps, so the cohort-B block is shorter because fewer module genes are on the panel; one colour scale serves both. (d) Hallmark sets with the smallest q in cohort A (bars; filled, q < 0.05) with the cohort-B score for the same set (diamonds; filled, q < 0.05; absent when fewer than 10 genes are on the panel). (e,f) Module scores of primary (P) and recurrent (R) samples, centred within module; each line is one patient; the number under each module gives the patients higher at recurrence.
3.7. The Change and the Interval Between Operations
In cohort B, the interval between operations ranged from 148 to 1260 days (median 314). The two prespecified quantities behaved differently. The projection onto the recurrence-associated direction estimated in cohort A decreased with the interval (Spearman rho = −0.56, 95% CI −0.81 to −0.08, p = 0.019, adjusted p = 0.037 across the two prespecified quantities, n = 17), and the same was found when the direction was estimated within cohort B (rho = −0.56, p = 0.021) or replaced by the sign-weighted mean of the significant genes (rho = −0.53, p = 0.029); the three projections agree closely with one another (rho = 0.89 between the two directions). Leaving out any single patient left the projection correlation between −0.66 and −0.47. The magnitude of the difference vector showed no detectable association (Euclidean norm over 699 genes, rho = −0.06, p = 0.81; over the 67 significant genes, rho = −0.20, p = 0.44; mean absolute difference, rho = −0.37, p = 0.15). The mean difference over the significant genes, used in the submitted analysis, gave rho = 0.06 (p = 0.83); that score cancels opposing changes, and is reported only for comparison. Across all seven definitions examined, the adjusted p-value of the projection is 0.067. These analyses were defined after the first round of review, and rest on 17 patients in a single cohort, so they are exploratory. Both prespecified quantities are plotted against the interval in Figure S11.
4. Discussion
Two cohorts that share neither patients, country nor measurement technology agree on the direction of 64 of 67 genes that change significantly between the first and the second resection, and a classifier trained in either cohort recognises the recurrent specimen in the other, among specimens that have both been measured. Because no expression value was compared across cohorts, this agreement cannot arise from a shared normalisation or a shared batch; it requires the same biology to move the same genes in independent patients.
The size of that evidence should be stated in two ways. The binomial p of 6.8 × 10⁻¹⁶ treats the 67 genes as independent, which co-regulated genes are not. The permutation that flips whole patients keeps their correlation and gives p = 0.006 for the same agreement; this is the more conservative figure, and it rests on 14 patients. The rank correlation over 699 genes and the cross-cohort classifier are separate lines of evidence that point the same way; the per patient analysis of Section 2.6 is exploratory, and is reported as such.
The programmes that replicate are consistent with part of the earlier single-cohort literature, and resolve some of its disagreements. The rise of myeloid and macrophage genes agrees with the increase in tumour-associated macrophages in paired RNA-seq [15] and with the predominance of monocyte-derived macrophages after recurrence [19]; the opposite finding from mass cytometry rested on three recurrent tumours, and was not paired [20]. The fall of extracellular-matrix genes agrees with lower EMT and matrix markers at recurrence in 17 pairs [29], with higher matrix-remodelling gene expression in primary than recurrent tumours in 18 patients [30], and with the original report of cohort B [24], and disagrees with the pericyte-expressed matrix gene set that increased at recurrence in a large RNA-seq series [15]; panel genes such as VCAN, LOXL2 and CDH11 need not belong to that set. The fall of proliferation genes, and of E2F and G2M programmes in both cohorts, agrees with the replacement of a proliferative state at recurrence [16] and with lower MKI67 in paired GLASS transcriptomes [31]. For stemness, SOX2 RNA decreased modestly in the same GLASS pairs [31], whereas recurrences within six months of surgery carried more SOX2-positive cells [32]; recurrence intervals here were mostly longer.
Bulk differences of this kind cannot separate a change in cell composition from a change in expression per cell. Tumour purity falls at recurrence [15] and the malignant fraction is lower [17], so part of the myeloid and interferon rise and of the proliferation fall may reflect fewer malignant cells in the second specimen. This does not weaken the replication, since composition is, itself, part of what the recurrent specimen is, but it limits the interpretation to the tissue, rather than the tumour cell.
The non-replicating genes are informative, in a narrower sense. VEGFA fell by more than two log2 units in cohort B, and did not change in cohort A. In 29 paired tumours, VEGFA was unchanged at recurrence by RT-qPCR (p = 0.534) [33], and VEGF-A staining did not change after radiotherapy and temozolomide in 15 pairs without bevacizumab [34]. Bevacizumab cannot explain the cohort-B decrease, because in that cohort it was given only after the second operation [24], and the angiogenesis set, as a whole, replicated as often as other genes. A large single-cohort effect that the literature does not consistently reproduce is what a replication design is meant to identify. The instability of the cohort-B gene list itself, which ranged from 19 to 95 genes when one pair was left out, makes the same point from the other side: the list depends on individual patients, whereas the direction of change does not.
The relationship with the relapse interval depends on what is measured. The magnitude of the difference vector showed no detectable association in these 17 patients, which can exclude only a strong dependence at this sample size. The projection onto the recurrence-associated direction decreased as the interval lengthened. This contrasts with GLASS, where transcriptomic and genomic differences between pairs increased with time, to relapse in 87 IDH-wild-type pairs [35], and it does not support the suggestion that the direction of change is set early while its magnitude accumulates; that suggestion is therefore withdrawn. The projection analysis was defined after the first round of review, rests on a single cohort of 17 patients, and does not survive adjustment across all seven score definitions examined (adjusted p = 0.067), so it is presented as an exploratory observation that a larger series with recorded intervals would be needed to test. Likewise, a patient-specific direction for a subset of genes [18] and the absence of a common malignant-state trajectory [17] are compatible with a shared average: per patient correlations here were modest (median ρ about 0.24–0.28) and negative in four of 31 patients.
The study has limitations. Both cohorts are small, and, in these data, individual genes reach false discovery control only in cohort B; in cohort A, the smallest observed adjusted p-value was 0.123 transcriptome-wide and 0.085 across the 699 shared genes. Cohort A includes three IDH-mutant pairs that are not glioblastoma under the 2021 WHO classification [25], and its treatment between operations is not recorded; excluding those pairs did not change the conclusions. Cohort A’s recurrent samples had higher column sums. The difference is carried by a small number of highly abundant genes, is absent from robust size summaries and from the filtered matrix that was analysed, and agreement was unchanged under alternative normalisations; it is, therefore, most consistent with a compositional feature of the second specimen, although the deposited values’ generating procedure is not documented, and a technical contribution cannot be ruled out. The IO 360 panel was designed to read the immune microenvironment, so the replicated programmes are those the panel can see; it cannot show that immune genes change most. The classifier was fitted with fixed hyparameters on few samples, and its cross-cohort AUC is an estimate from 17 and 14 patients. No outcome data were analysed, and no clinical use is claimed. The work is a reanalysis of public data, and no new samples were generated.
5. Conclusions
The direction of the expression shift from the first to the second glioblastoma resection reproduces across independent cohorts measured on different platforms, and a model trained in one cohort recognises the recurrent specimen among the already measured specimens of the other. Myeloid and interferon programmes rise while proliferation and extracellular-matrix programmes fall, with the directions agreeing between the two cohorts; these programme-level findings are agreement in direction, rather than independently established pathway replication, and the stemness programme was not tested in the panel cohort. The magnitude of the shift in an individual patient, and cohort-specific changes such as that of VEGFA, do not reproduce. These results establish the cross-platform reproducibility of an average, cohort-level recurrence-associated change; they do not establish that the recurrent expression profile of an individual patient can be predicted from that patient’s primary tumour, and no clinical use is claimed.
Supplementary Materials
The following supporting information can be downloaded at: https://www.mdpi.com/article/10.3390/diagnostics16233907/s1, Figure S1: Sample quality control; Figure S2: Covariates and sample structure; Figure S3: Within-patient change in the 67 genes significant in cohort B; Figure S4: Exclusion of IDH-mutant pairs; Figure S5: Normalisation alternatives; Figure S6: Permutation nulls; Figure S7: Leave-one-pair-out classifiers, pair influence and preprocessing settings; Figure S8: Patient-pair resampling and the three intervals for the same correlation; Figure S9: Cohort-A signal outside the shared panel and Hallmark agreement under two nulls; Figure S10: Module definition sensitivity; Figure S11: Change scores and the interval between operations in cohort B; Table S1: Pair metadata; Table S2: Module gene lists; Table S3: Gene-level results for the 699 genes measured in both cohorts; Table S4: Replication and sensitivity statistics; Table S5: Preprocessing quantities and the samples used to estimate each of them; Table S6: Classifier settings with area under the curve, pair accuracy, resampling intervals, label-swap p values and thresholded accuracy; Table S7: Quality metrics and robust z scores for the 34 cohort-B specimens; Table S8: The sixteen 15-pair subsets of cohort B; Table S9: Cohort-A and cohort-B subset cross-tabulation; Table S10: Column-sum summary statistics for cohort A; Table S11: The seven change-score definitions and their association with the relapse interval; Table S12: Per patient change scores and relapse intervals; Table S13: Hallmark results under both nulls with coverage and leading-edge genes; Table S14: Hallmark results in the 699-gene shared universe.
Author Contributions
Conceptualization, S.K. and L.-S.K.; methodology, S.K.; software, S.K.; validation, S.K. and L.-S.K.; formal analysis, S.K.; investigation, S.K.; data curation, S.K.; writing—original draft preparation, S.K.; writing—review and editing, S.K. and L.-S.K.; visualization, S.K.; supervision, L.-S.K.; project administration, L.-S.K. All authors have read and agreed to the published version of the manuscript.
Funding
This research received no external funding.
Institutional Review Board Statement
Not applicable. This study analysed only publicly available, de-identified transcriptomic data distributed through the Gene Expression Omnibus and generated no new human or animal data.
Informed Consent Statement
Not applicable.
Data Availability Statement
The data reanalysed here are publicly available from the Gene Expression Omnibus under accessions GSE339484 and GSE254874. No new data were generated. All analysis code used to produce the results, tables and figures reported here is openly available at https://github.com/leeseungkwon804/gbm-recurrence-replication (accessed on 16 November 2026; MIT licence); the processed outputs underlying each table and figure are included in the Supplementary Materials.
Acknowledgments
During the preparation of this manuscript, the authors used Claude (Anthropic), Claude Code version 2.1.322, for analysis scripting, figure generation, literature searching and drafting of the text. The authors have reviewed and edited the output and take full responsibility for the content of this publication.
Conflicts of Interest
The authors declare no conflicts of interest.
References
- Stupp, R.; Mason, W.P.; van den Bent, M.J.; Weller, M.; Fisher, B.; Taphoorn, M.J.; Belanger, K.; Brandes, A.A.; Marosi, C.; Bogdahn, U.; et al. Radiotherapy plus concomitant and adjuvant temozolomide for glioblastoma. N. Engl. J. Med. 2005, 352, 987–996. [Google Scholar] [CrossRef] [Scilit]
- Weller, M.; van den Bent, M.; Preusser, M.; Le Rhun, E.; Tonn, J.C.; Minniti, G.; Bendszus, M.; Balana, C.; Chinot, O.; Dirven, L.; et al. EANO guidelines on the diagnosis and treatment of diffuse gliomas of adulthood. Nat. Rev. Clin. Oncol. 2021, 18, 170–186, Correction in Nat. Rev. Clin. Oncol. 2022, 19, 357–358. https://doi.org/10.1038/s41571-022-00623-3. [Google Scholar] [CrossRef] [Scilit]
- Hainfellner, A.; Borkovec, M.; Seebrecht, L.; Neuhauser, M.; Roetzer-Pejrimovsky, T.; Greutter, L.; Surböck, B.; Hager-Seifert, A.; Hof, D.G.-V.; Urbanic-Purkart, T.; et al. Glioblastoma in the real-world setting: Patterns of care and outcome in the Austrian population. J. Neuro-Oncol. 2024, 170, 407–418. [Google Scholar] [CrossRef] [Scilit]
- van Linde, M.E.; Brahm, C.G.; de Witt Hamer, P.C.; Reijneveld, J.C.; Bruynzeel, A.M.E.; Vandertop, W.P.; van de Ven, P.M.; Wagemakers, M.; van der Weide, H.L.; Enting, R.H.; et al. Treatment outcome of patients with recurrent glioblastoma multiforme: A retrospective multicenter analysis. J. Neuro-Oncol. 2017, 135, 183–192. [Google Scholar] [CrossRef] [Scilit]
- van den Bent, M.J.; Gao, Y.; Kerkhof, M.; Kros, J.M.; Gorlia, T.; van Zwieten, K.; Prince, J.; Van Duinen, S.; Sillevis Smitt, P.A.; Taphoorn, M.; et al. Changes in the EGFR amplification and EGFRvIII expression between paired primary and recurrent glioblastomas. Neuro-Oncology 2015, 17, 935–941. [Google Scholar] [CrossRef] [Scilit]
- Draaisma, K.; Chatzipli, A.; Taphoorn, M.; Kerkhof, M.; Weyerbrock, A.; Sanson, M.; Hoeben, A.; Lukacova, S.; Lombardi, G.; Leenstra, S.; et al. Molecular evolution of IDH wild-type glioblastomas treated with standard of care affects survival and design of precision medicine trials: A report from the EORTC 1542 study. J. Clin. Oncol. 2020, 38, 81–99. [Google Scholar] [CrossRef] [Scilit]
- Hoogstrate, Y.; Vallentgoed, W.; Kros, J.M.; de Heer, I.; de Wit, M.; Eoli, M.; Sepulveda, J.M.; Walenkamp, A.M.E.; Frenel, J.-S.; Franceschi, E.; et al. EGFR mutations are associated with response to depatux-m in combination with temozolomide and result in a receptor that is hypersensitive to ligand. Neuro-Oncol. Adv. 2020, 2, vdz051. [Google Scholar] [CrossRef] [Scilit]
- Capper, D.; Reifenberger, G.; French, P.J.; Schweizer, L.; Weller, M.; Touat, M.; Niclou, S.P.; Euskirchen, P.; Haberler, C.; Hegi, M.E.; et al. EANO guideline on rational molecular testing of gliomas, glioneuronal, and neuronal tumors in adults for targeted therapy selection. Neuro-Oncology 2023, 25, 813–826. [Google Scholar] [CrossRef] [Scilit]
- Feldheim, J.; Kessler, A.F.; Monoranu, C.M.; Ernestus, R.I.; Löhr, M.; Hagemann, C. Changes of O6-methylguanine DNA methyltransferase (MGMT) promoter methylation in glioblastoma relapse—A meta-analysis type literature review. Cancers 2019, 11, 1837. [Google Scholar] [CrossRef] [Scilit]
- Barthel, F.P.; Johnson, K.C.; Varn, F.S.; Moskalik, A.D.; Tanner, G.; Kocakavuk, E.; Anderson, K.J.; Abiola, O.; Aldape, K.; Alfaro, K.D.; et al. Longitudinal molecular trajectories of diffuse glioma in adults. Nature 2019, 576, 112–120. [Google Scholar] [CrossRef] [Scilit]
- Körber, V.; Yang, J.; Barah, P.; Wu, Y.; Stichel, D.; Gu, Z.; Fletcher, M.N.C.; Jones, D.; Hentschel, B.; Lamszus, K.; et al. Evolutionary trajectories of IDHWT glioblastomas reveal a common path of early tumorigenesis instigated years ahead of initial diagnosis. Cancer Cell 2019, 35, 692–704.e12. [Google Scholar] [CrossRef] [Scilit]
- Wang, J.; Cazzato, E.; Ladewig, E.; Frattini, V.; Rosenbloom, D.I.; Zairis, S.; Abate, F.; Liu, Z.; Elliott, O.; Shin, Y.-J.; et al. Clonal evolution of glioblastoma under therapy. Nat. Genet. 2016, 48, 768–776. [Google Scholar] [CrossRef] [Scilit]
- Wang, Q.; Hu, B.; Hu, X.; Kim, H.; Squatrito, M.; Scarpace, L.; Decarvalho, A.C.; Lyu, S.; Li, P.; Li, Y.; et al. Tumor evolution of glioma-intrinsic gene expression subtypes associates with immunological changes in the microenvironment. Cancer Cell 2017, 32, 42–56.e6, Erratum in Cancer Cell 2018, 33, 152. https://doi.org/10.1016/j.ccell.2017.12.012. [Google Scholar] [CrossRef] [Scilit]
- Varn, F.S.; Johnson, K.C.; Martinek, J.; Huse, J.T.; Nasrallah, M.P.; Wesseling, P.; Cooper, L.A.; Malta, T.M.; Wade, T.E.; Sabedot, T.S.; et al. Glioma progression is shaped by genetic evolution and microenvironment interactions. Cell 2022, 185, 2184–2199.e16. [Google Scholar] [CrossRef] [Scilit]
- Hoogstrate, Y.; Draaisma, K.; Ghisai, S.A.; van Hijfte, L.; Barin, N.; de Heer, I.; Coppieters, W.; Bosch, T.P.v.D.; Bolleboom, A.; Gao, Z.; et al. Transcriptome analysis reveals tumor microenvironment changes in glioblastoma. Cancer Cell 2023, 41, 678–692.e7. [Google Scholar] [CrossRef] [Scilit]
- Kim, K.H.; Migliozzi, S.; Koo, H.; Hong, J.H.; Park, S.M.; Kim, S.; Kwon, H.J.; Ha, S.; Garofano, L.; Oh, Y.T.; et al. Integrated proteogenomic characterization of glioblastoma evolution. Cancer Cell 2024, 42, 358–377.e8. [Google Scholar] [CrossRef] [Scilit]
- Spitzer, A.; Johnson, K.C.; Nomura, M.; Garofano, L.; Nehar-Belaid, D.; Darnell, N.G.; Greenwald, A.C.; Bussema, L.; Oh, Y.T.; Varn, F.S.; et al. Deciphering the longitudinal trajectories of glioblastoma ecosystems by integrative single-cell genomics. Nat. Genet. 2025, 57, 1168–1178. [Google Scholar] [CrossRef] [Scilit]
- Tanner, G.; Barrow, R.; Ajaib, S.; Al-Jabri, M.; Ahmed, N.; Pollock, S.; Finetti, M.; Rippaus, N.; Bruns, A.F.; Syed, K.; et al. IDHwt glioblastomas can be stratified by their transcriptional response to standard treatment, with implications for targeted therapy. Genome Biol. 2024, 25, 45. [Google Scholar] [CrossRef] [Scilit]
- Pombo Antunes, A.R.; Scheyltjens, I.; Lodi, F.; Messiaen, J.; Antoranz, A.; Duerinck, J.; Kancheva, D.; Martens, L.; De Vlaminck, K.; Van Hove, H.; et al. Single-cell profiling of myeloid cells in glioblastoma across species and disease stage reveals macrophage competition and specialization. Nat. Neurosci. 2021, 24, 595–610. [Google Scholar] [CrossRef] [Scilit]
- Fu, W.; Wang, W.; Li, H.; Jiao, Y.; Huo, R.; Yan, Z.; Wang, J.; Wang, S.; Wang, J.; Chen, D.; et al. Single-cell atlas reveals complexity of the immunosuppressive microenvironment of initial and recurrent glioblastoma. Front. Immunol. 2020, 11, 835. [Google Scholar] [CrossRef] [Scilit]
- Liu, C.-C.; Yang, W.-B.; Chien, C.-H.; Wu, C.-L.; Chuang, J.-Y.; Chen, P.-Y.; Chu, J.-M.; Cheng, S.M.; Qiu, L.-Y.; Chang, Y.-C.; et al. CXCR7 activation evokes the anti-PD-L1 antibody against glioblastoma by remodeling CXCL12-mediated immunity. Cell Death Dis. 2024, 15, 434. [Google Scholar] [CrossRef] [Scilit]
- Chien, C.-H.; Yang, W.-B.; Chuang, J.-Y.; Lee, J.-S.; Liao, W.-A.; Huang, C.-Y.; Chen, P.-Y.; Wu, A.-C.; Yang, S.-T.; Lai, C.-C.; et al. SH3GLB1-related autophagy mediates mitochondrial metabolism to acquire resistance against temozolomide in glioblastoma. J. Exp. Clin. Cancer Res. 2022, 41, 220, Correction in J. Exp. Clin. Cancer Res. 2025, 44, 179. https://doi.org/10.1186/s13046-025-03445-0. [Google Scholar] [CrossRef] [Scilit]
- Shen, C.J.; Chen, H.C.; Lin, C.L.; Thakur, A.; Onuku, R.; Chen, I.C.; Li, H.; Chang, K.; Chuang, J.; Yang, W.; et al. Contribution of prostaglandin E2-induced neuronal excitation to drug resistance in glioblastoma countered by a novel blood-brain barrier crossing celecoxib derivative. Adv. Sci. 2025, 12, e06336. [Google Scholar] [CrossRef] [Scilit]
- Shekarian, T.; Ritz, M.F.; Hogan, S.; Martins, T.A.; Schmassmann, P.; Gerber, A.; Roux, J.; Kaymak, D.; Durano, C.; Burger, B.; et al. Multidimensional analysis of matched primary and recurrent glioblastoma identifies contributors to tumor recurrence influencing time to relapse. J. Neuropathol. Exp. Neurol. 2025, 84, 45–58. [Google Scholar] [CrossRef] [Scilit]
- Louis, D.N.; Perry, A.; Wesseling, P.; Brat, D.J.; Cree, I.A.; Figarella-Branger, D.; Hawkins, C.; Ng, H.K.; Pfister, S.M.; Reifenberger, G.; et al. The 2021 WHO Classification of Tumors of the Central Nervous System: A summary. Neuro-Oncology 2021, 23, 1231–1251. [Google Scholar] [CrossRef] [Scilit]
- Xin, J.; Mark, A.; Afrasiabi, C.; Tsueng, G.; Juchler, M.; Gopal, N.; Stupp, G.S.; Putman, T.E.; Ainscough, B.J.; Griffith, O.L.; et al. High-performance web services for querying gene and variant annotation. Genome Biol. 2016, 17, 91. [Google Scholar] [CrossRef] [Scilit]
- Subramanian, A.; Tamayo, P.; Mootha, V.K.; Mukherjee, S.; Ebert, B.L.; Gillette, M.A.; Paulovich, A.; Pomeroy, S.L.; Golub, T.R.; Lander, E.S.; et al. Gene set enrichment analysis: A knowledge-based approach for interpreting genome-wide expression profiles. Proc. Natl. Acad. Sci. USA 2005, 102, 15545–15550. [Google Scholar] [CrossRef] [Scilit]
- Liberzon, A.; Birger, C.; Thorvaldsdóttir, H.; Ghandi, M.; Mesirov, J.P.; Tamayo, P. The Molecular Signatures Database (MSigDB) hallmark gene set collection. Cell Syst. 2015, 1, 417–425. [Google Scholar] [CrossRef] [Scilit]
- Kubelt, C.; Hattermann, K.; Sebens, S.; Mehdorn, H.M.; Held-Feindt, J. Epithelial-to-mesenchymal transition in paired human primary and recurrent glioblastomas. Int. J. Oncol. 2015, 46, 2515–2525. [Google Scholar] [CrossRef] [Scilit]
- Petterson, S.A.; Sørensen, M.D.; Kristensen, B.W. Expression profiling of primary and recurrent glioblastomas reveals a reduced level of pentraxin 3 in recurrent glioblastomas. J. Neuropathol. Exp. Neurol. 2020, 79, 975–985. [Google Scholar] [CrossRef] [Scilit]
- Al Shboul, S.; Alrjoub, M.; Al Karsaneh, O.A.; Surakhy, M.; Alhesa, A.; El-Sadoni, M.; Al-Sheyab, M.; Alsoud, A.; Friehat, K.; Khasawneh, A.I.; et al. Integrated biomarker mapping reveals differential expression of senescence profiles in IDH-wild-type glioblastoma recurrent versus primary tumors. Virchows Arch. 2026. [Google Scholar] [CrossRef] [Scilit]
- Knudsen, A.M.; Halle, B.; Cédile, O.; Burton, M.; Baun, C.; Thisgaard, H.; Anand, A.; Hubert, C.; Thomassen, M.; Michaelsen, S.R.; et al. Surgical resection of glioblastomas induces pleiotrophin-mediated self-renewal of glioblastoma stem cells in recurrent tumors. Neuro-Oncology 2022, 24, 1074–1087. [Google Scholar] [CrossRef] [Scilit]
- Tabouret, E.; Tchoghandjian, A.; Denicolai, E.; Delfino, C.; Metellus, P.; Graillon, T.; Boucard, C.; Nanni, I.; Padovani, L.; Ouafik, L.; et al. Recurrence of glioblastoma after radio-chemotherapy is associated with an angiogenic switch to the CXCL12-CXCR4 pathway. Oncotarget 2015, 6, 11664–11675. [Google Scholar] [CrossRef] [Scilit]
- Tamura, R.; Tanaka, T.; Morimoto, Y.; Kuranari, Y.; Yamamoto, Y.; Takei, J.; Murayama, Y.; Yoshida, K.; Sasaki, H. Alterations of the tumor microenvironment in glioblastoma following radiation and temozolomide with or without bevacizumab. Ann. Transl. Med. 2020, 8, 297. [Google Scholar] [CrossRef] [Scilit]
- Ho, W.M.; Chen, C.Y.; Chiang, T.W.; Chuang, T.J. A longer time to relapse is associated with a larger increase in differences between paired primary and recurrent IDH wild-type glioblastomas at both the transcriptomic and genomic levels. Acta Neuropathol. Commun. 2024, 12, 77, Correction in Acta Neuropathol. Commun. 2024, 12, 119. https://doi.org/10.1186/s40478-024-01829-5. [Google Scholar] [CrossRef] [Scilit]

Disclaimer/Publisher’s Note: The statements, opinions and data contained in all publications are solely those of the individual author(s) and contributor(s) and not of MDPI and/or the editor(s). MDPI and/or the editor(s) disclaim responsibility for any injury to people or property resulting from any ideas, methods, instructions or products referred to in the content. |
© 2026 by the authors. Licensee MDPI, Basel, Switzerland. This article is an open access article distributed under the terms and conditions of the Creative Commons Attribution (CC BY) license.