


Abstract
Background/Objectives: After tooth removal the crest may close before the socket has mineralised, leaving a covered socket residuum (CSR). Third molars are usually removed in young patients, often prophylactically. We examined bone removed at the surgical revision of former third molar sites with a radiologically diagnosed CSR. Methods: Retrospective single-centre study of a selected surgical series. The specimens consisted mainly of the bone lid covering the residuum, whose inner side is formed by the former socket walls, and, where labelled separately, of tissue from its depth. For every section the routine pathology report was coded for a leading finding, and cell nuclei were classified by whole-slide AI analysis without knowledge of the report. Clustering of sections within patients was accounted for with linear mixed models and a patient-level bootstrap. Results: Eighty-three sections from 28 patients (median age 54 years) were analysed. Fifty-one (61.4%; 95% CI 44.3–77.1) carried a distinguishing finding, 53.0% without haematopoietically active marrow, most often marrow fibrosis (14.5%), granulocytic inflammation or osteomyelitis (13.3%) and lymphoplasmacytic infiltrate (10.8%). Twenty-one of 28 patients had at least one such section, and 13 of 24 patients with more than one section showed different findings in different sections. Accounting for clustering, the software-estimated lymphocyte, neutrophil, plasma cell and fibroblast fractions differed between categories (Holm-adjusted p = 0.001–0.023), ordered from cell-poor, fibroblast-dominated sections to lymphocyte-rich inflammation. Conclusions: In this selected series of surgically revised CSR, more than half of the sections, mostly from the bone lid and the former socket wall, carried a distinguishing histopathological finding, and the findings varied within the same patient. The AI-derived cell fractions are exploratory software estimates and require validation in this tissue. Whether the handling of the socket at extraction influences these findings is a hypothesis for prospective controlled studies.
1. Introduction
The healing of an extraction socket is usually described as an orderly sequence in which the coagulum is organised, woven bone is formed and remodelled, and after some months the former socket is filled with bone continuous with its surroundings [1,2,3,4,5]. Three-dimensional analyses of human sockets from our group have qualified this account. In upper premolar sockets left to heal without intervention, the walls collapse inward and a non-mineralised space persists within the outline of the former socket [6]. In former third molar sockets the same configuration was found six months after extraction, and it was not prevented by filling the socket with platelet-rich fibrin [7]. We have termed this configuration, a non-mineralised area confined to the former socket beneath a closed crestal cortex, the covered socket residuum (CSR) [8,9].
Our working explanation draws on the way open wounds close. Myofibroblasts pull the edges of a wound together [10]. In the socket this pull acts on the walls, which move inward, and it brings the crest together first, because the crestal edges lie closest to each other. Once the crest has closed, the centre is sealed off before it has mineralised. If this is correct, the tissue that lined the socket at extraction is not necessarily replaced but may be enclosed, and the inner surface of a CSR may be the former socket wall itself, carrying whatever condition it had when the crest closed over it.
We have recently examined the first part of this chain directly [11]. In 41 sockets of 23 patients, biopsied at the extraction of teeth that were non-vital or tender to percussion, the socket wall was already histopathologically altered in 38 (92.7%), with marrow fibrosis and chronic inflammation in the bone and florid inflammation in the soft tissue of the socket. The periapical lesion was visible on preoperative cone-beam computed tomography (CBCT), whereas the lateral wall showed no distinct change on the image. Those teeth had a clinical indication for extraction of their own, many of them were root-filled, and their alteration could therefore be attributed to the condition that had led to the extraction.
Third molars are different. They are commonly removed in late adolescence or early adulthood, often prophylactically, in teeth without caries, root canal treatment or apical disease. If former third molar sites are found altered at revision, the alteration is less easily explained by the tooth and raises the question of how the socket was treated and how the wound healed. Two mechanisms are plausible. Tissue may have been left behind, in particular the dental follicle of an impacted or partially erupted tooth, which can show inflammatory and cystic changes even when the radiograph appears normal [12]. Or the wound may have been contaminated during or after the operation. Third molar removal is often regarded as a minor procedure, but it involves bone removal in a bacteria-rich field close to the pharynx, regularly causes bacteraemia [13] and has well-described complications, among them delayed infection, abscess formation and fracture of the mandible [14,15,16].
Tissue from non-healed former extraction sites has been described before, most prominently under the terms neuralgia-inducing cavitational osteonecrosis (NICO) [17] and fatty degenerative osteonecrosis of the jaw (FDOJ) [18,19,20]. Both are histological terms. They describe tissue under the microscope, do not define the site in the jaw from which it is taken and have no radiological counterpart. Both assign a single pathogenesis to such sites, and both have been debated [21,22,23,24]. Few studies have examined a cohort defined by anatomical site rather than by symptom, and none, to our knowledge, has combined the routine histopathological report with a quantitative method that is independent of it.
The present study therefore examined bone removed from former third molar sites with a radiologically diagnosed CSR and asked three questions. How often and in what form is the tissue histopathologically altered? Is the finding uniform within one patient? And does an AI-based cell quantification, performed without knowledge of the report, reproduce the categories of the report?
2. Materials and Methods
2.1. Study Design and Ethical Approval
This was a retrospective observational study at a single university department of oral and maxillofacial surgery. All specimens had been obtained and submitted in routine care and were analysed retrospectively. The specimens were received by the pathology department between November 2024 and June 2026. The study was approved by the Ethics Committee of the Medical Faculty of Goethe University Frankfurt (approval number 2026-3043 of 7 July 2026, amendment 2026-3043_1 of 7 August 2026). Reporting follows the STROBE recommendations for observational studies [25], and the AI component is reported with reference to the CLAIM checklist [26].
2.2. Patients and Indication for Surgery
Patients presented on their own initiative and requested assessment and treatment of former extraction sites. Not all of them had local complaints. Some reported discomfort in the region. Others reported non-specific general complaints, such as fatigue or reduced well-being, and hoped that their condition would improve after treatment, and some had no complaints at all. After clinical examination and CBCT, a CSR was diagnosed, the patients were informed about the finding, the uncertain relation to any general complaint and the alternatives, and the sites were revised surgically at the patient’s request. The present analysis makes no statement about the effect of the operation on any complaint. No comparison group was included, because bone cannot be removed from a healed site without a residuum for the purpose of a study. These patients form a selected clinical population. They are not a sample of former third molar sites in general, and the frequency of findings reported here applies to surgically revised CSR only.
Eligible were patients in whom bone was removed from at least one former third molar site (FDI 18, 28, 38 or 48) and in whom both the original pathology report and a digitised, AI-quantified haematoxylin and eosin (HE) section of the same block were available. No selection by symptom or by reported histological diagnosis was applied. Of 32 patients in the departmental series of surgical revisions of a radiologically diagnosed CSR with pathology reports, two had no specimen from a former third molar site and two had no digitised HE section of a third molar block, which left 28 patients (Figure S4). The time since extraction of the third molars, the indication for their removal, their eruption status, the course of the original operation, antibiotic use and postoperative complications were not documented in the records available to us and could not be retrieved.
2.3. Surgical Procedure
Revision was performed under local or general anaesthesia. The former socket was exposed through a mucoperiosteal flap, the covering mineralised layer was opened, and the content of the residuum was removed together with the surrounding bone until bleeding bone was reached. At every revision the mineralised layer covering the residuum, referred to here as the bone lid, was removed and submitted. The content of the residuum itself is rarely solid; it is mostly an amorphous soft tissue that can hardly be grasped and does not hold together as a defined specimen, so by convention the bone lid was submitted. Specimens designated by region only, for example bone biopsy region 38, are therefore bone lid. Additional material, such as tissue from the depth of the residuum, was labelled as such and submitted separately, so that several specimens could come from the same former socket. The bone lid has two sides. Its crestal side is the outer cortex of the ridge, and its inner side, facing the residuum, consists of the former socket walls that have moved together during healing. Of the 83 sections analysed, 76 represent bone lid and 7, from six patients, tissue labelled as content of the residuum or as taken from its depth.
2.4. Radiographic Assessment
CBCT had been acquired before surgery, partly at the University Hospital Frankfurt and partly by external practices, from which the scans were sent to the department before the operation. Devices and acquisition parameters therefore varied. A CSR was defined as a non-mineralised area confined to the outline of a former socket and covered by a continuous mineralised crestal layer (Figure 1) [8,9]. Each CBCT was assessed independently by two oral and maxillofacial surgeons with long-standing experience in the assessment of former extraction sites (S.G., J.Ś.-W.) on the standard multiplanar views. Surgical revision was considered only for sites rated as CSR by both readers, and the two readers agreed on every operated site. A formal agreement statistic was not calculated, because only sites rated as CSR by both readers were operated and the series therefore contains no discordant or negative ratings. Both readers assessed the scans before surgery and thus without knowledge of the histology. The radiological diagnosis was verified at surgery. A bone lid can only be lifted off when a non-mineralised space lies beneath it, otherwise a solid block of bone would have to be resected, and at every revision the mineralised layer was lifted off a non-mineralised space confined to the outline of the former socket. Revision was restricted to former socket sites, and non-mineralised marrow spaces elsewhere in the jaw, which may be physiological, were not regarded as CSR. After diagnosis, the pseudonymised datasets were processed by Visiogenics GmbH (Frankfurt am Main, Germany) in accordance with data protection regulations, using a proprietary volumetric rendering with pseudo-colour mapping of mineralisation density. The rendering illustrated the finding for surgeon and patient but was not a diagnostic criterion. It was available for 71 of the 83 sections, and its measurements were not analysed here, because the measurement method has not yet been validated against manual CBCT measurements; this validation is planned in a separate cohort.
Figure 1.
Radiological definition of a covered socket residuum (CSR) at a former upper third molar site. (a) Conventional cross-sectional CBCT view. The former socket is occupied by an area of reduced mineralisation, and the crestal contour appears continuous. (b) Volumetric rendering of the same dataset with pseudo-colour density mapping. Mineralised and non-mineralised volumes within the former socket are discriminated, and the mineralised crestal layer covering the residuum appears as a closed roof.
2.5. Histopathological Processing and Reporting
All specimens were processed and reported in routine diagnostic care at the Dr. Senckenberg Institute of Pathology, Neuropathology and Human Genetics, University Hospital Frankfurt am Main, Germany, without knowledge of this analysis and without a study-specific protocol. Bone-containing specimens, partially accompanied by soft tissue, were fixed in 4% buffered formalin. Following assessment of tissue hardness, specimens requiring decalcification were selectively decalcified using either ethylenediaminetetraacetic acid (EDTA) or trichloroacetic acid (TCA), according to standard institutional protocols. After routine tissue processing, specimens were embedded in paraffin, sectioned and stained with haematoxylin and eosin (HE) in every case. Periodic acid–Schiff (PAS) staining, step sections and additional histochemical stains were performed where indicated by the reporting pathologist. Histopathological findings were documented using a standardised electronic reporting template with predefined response categories for tissue components, bone vitality, remodelling, haemorrhage, inflammatory cell types (graded as absent, few or numerous), granulomas, bacterial and fungal colonisation and evidence of neoplasia. Eighty-two of the 83 analysed sections were stained with HE; one block is additionally represented by a section with another histochemical stain requested by the reporting pathologist (Section 2.8).
2.6. Coding of the Report and Leading Finding
The microscopic description and the diagnosis of every block were screened for nine predefined features. In order of specificity these were foreign material or giant cell reaction, osteomyelitis, avital bone or osteonecrosis, florid granulocytic inflammation, lymphoplasmacytic infiltrate, epithelium or ulceration, marrow fibrosis, haematopoietically active marrow, and fatty marrow or lipomatous change. Negated statements, such as “no florid inflammation” or “without foreign material”, were not counted. Each section was assigned a single leading finding, defined as the most specific feature present in the order listed. The order reflects how specific a feature is for a process of its own. Exogenous or destructive findings (foreign material, osteomyelitis, avital bone) were ranked above inflammatory infiltrates, and infiltrates above changes in the marrow stroma (fibrosis, haematopoiesis) that may accompany several processes. A section with marrow fibrosis and a lymphoplasmacytic infiltrate was therefore coded as lymphoplasmacytic infiltrate, and one with avital bone and a foreign body reaction as foreign material-associated reaction. The leading finding is thus a coding convention for the comparison with the cell quantification and not a complete description of the section, in which several features may coexist.
Two changes to this scheme were made on the advice of the reporting pathologist (R.W.) and before any statistical testing. First, florid granulocytic inflammation and histologically confirmed osteomyelitis were combined into one category, granulocytic inflammation or osteomyelitis, because the two cannot be reliably separated on the material available when the granulocytic infiltrate lies in the marrow spaces. Second, fatty marrow was withdrawn as a leading finding, because fatty marrow is the physiological state of adult jaw marrow. It was mentioned in 57 of the 77 reports for which the full text was available (74.0%), across every category. Sections in which the report named vital bone or fatty marrow and no further feature formed a reference group, termed no distinguishing finding reported. The reference group is not an entity and is not equivalent to histologically normal tissue, because the absence of a reported feature does not exclude a feature outside the plane of section. It is the comparison base against which the named findings are read.
For the final dataset the coding was repeated on pseudonymised copies of the reports, with one additional rule. Pathology reports often describe several blocks of one case together, and a feature was assigned to a section only where the report attributed it to that block, either in the block-specific description or in a diagnosis naming the block. A finding described jointly for several blocks without such attribution was not transferred to every block of the case. Compared with the first coding this changed the leading finding of nine sections, mostly from a named finding to the reference group, and the reference group then comprised 32 sections. Coding was based on the report text alone and blind to the cell quantification, so that the subsequent comparison of cell composition would not be circular. R.W., who had issued most of the reports, then read the coding of every section against the original reports, and the dataset was used for the analysis only after her approval. A second, independent coding with an agreement statistic was not performed.
2.7. Whole-Slide Imaging and AI-Based Cell Quantification
HE-stained sections were digitised with a Pannoramic SCAN digital slide scanner (3DHISTECH, Budapest, Hungary) at a resolution of 0.243 µm per pixel (40× magnification). The whole-slide images were analysed with the image analysis software MIKAIA (version 2.4.3; Fraunhofer Institute for Integrated Circuits IIS, Erlangen, Germany) [27,28]. In a first step, the Tissue Detection App delineated the tissue on the slide, using the Foreground Extraction from Structure Information (FESI) algorithm [29]. All detected tissue was then analysed with the H&E Cell AI App, which segments and classifies cell nuclei with a HoVerNet multi-task convolutional neural network [30] trained by the manufacturer on a proprietary multicentric dataset of approximately 35,000 labelled cells, with approximately 15,000 further cells for testing. The application distinguishes eleven classes, namely fibroblasts, lymphocytes, plasma cells, macrophages, neutrophil granulocytes, eosinophil granulocytes, epithelial cells, dysplastic cells, endothelial cells, nerve cells and a residual class. It has no class for adipocytes or osteocytes. For every section the software reported the number of nuclei per class, the analysed area and the cell density. Counts are expressed as proportions of all classified nuclei. All slides were analysed with the same software version within two consecutive days, and the counts exported by the software were used as exported, without manual correction of individual nuclei. The software classified the nuclei automatically and without access to the report text. The export contained aggregated counts per class for each section; per-nucleus confidence scores or other quality-control indicators were not part of the export and were not used. The H&E Cell AI App is designed for HE-stained tissue and has not been validated for other histochemical stains. The composition of the manufacturer’s training data was not available to us, and we do not know to what extent decalcified jaw bone and marrow were represented. The classifier was not validated against manual annotation in this tissue, and its output is therefore reported as exploratory, software-derived measurements and not as validated cell counts. After export, R.W. and S.G. reviewed the results for plausibility at the level of cell classes and categories before the original submission. This review led to the separate treatment of haematopoietically active marrow, which is reported alongside the primary analysis; individual classifications were neither reviewed nor corrected. R.W. was not blinded to the reports, most of which she had issued.
2.8. Linkage of the Two Data Sources
Quantified sections and report blocks were linked through accession number and block number, and every block number corresponds to a separately submitted specimen. Two sections required manual assignment because the slide labels departed from the block convention. One block (region 38) is represented by two quantified sections, a step section stained with HE and a section with an additional histochemical stain. Both were analysed with the same pipeline, although the classifier is designed for HE staining and the second section is therefore not technically comparable with the others; results without this section are reported as a sensitivity analysis. The analysis set therefore comprises 83 sections from 82 blocks, and no section of an eligible third molar block was excluded. Of the 93 sections quantified in the series, the remaining 10 came from other regions of the included patients (n = 7), from a patient outside the revision series (n = 2) or could not be assigned to a report (n = 1) (Figure S4).
2.9. Statistical Analysis
Continuous variables are reported as median and interquartile range (IQR), and proportions with 95% confidence intervals (CI) by the Wilson method and, to account for clustering, by a patient-level cluster bootstrap (2000 resamples). The section was the unit of description and the patient the unit of resampling. Because sections within a patient are not independent, cell composition was compared between categories represented by at least three sections with linear mixed models with a random intercept for the patient, fitted by maximum likelihood and compared with the null model by a likelihood ratio test [31]. The outcomes were the centred log-ratio (CLR) transformed fractions of five cell classes (fibroblasts, lymphocytes, plasma cells, macrophages and neutrophil granulocytes), computed over all eleven classes [32,33,34]. For every section a pseudocount of 0.5 was added to the raw count of each of the eleven classes before the fractions were formed and CLR-transformed, which also handled the zero counts that occurred for plasma cells in 5, macrophages in 3 and neutrophils in 1 section [35]; the same transformed values were used in the primary and in all sensitivity analyses. Each model contained the leading finding as the only fixed effect and a random intercept for the patient; no random slopes were fitted. p values were adjusted across the five cell classes with the Holm procedure [36]. Post hoc, each category was compared with the reference group within the mixed model, reported as the difference in CLR with 95% CI and Holm-adjusted across the six comparisons of each class. For comparability with the original analysis, the Kruskal–Wallis test at the section level is also reported, with ε2 as effect size. The inflammatory-associated fraction was defined as the sum of lymphocytes, plasma cells, macrophages and neutrophil and eosinophil granulocytes. Because it shares its denominator with the fibroblast fraction, the two were compared as a log-ratio of inflammatory-associated cells to fibroblasts, and their correlation is reported descriptively with a patient-level bootstrap CI. The share of variance attributable to the patient was estimated for each cell class as a one-way random-effects intraclass correlation coefficient from the 24 patients with more than one section, ICC(1) = (MSB − MSW)/[MSB + ( − 1) MSW], where MSB and MSW are the between-patient and within-patient mean squares of the cell fraction (percentage of classified nuclei) and = N/k is the mean number of sections per patient [37,38]. The 95% CI was obtained by resampling patients with replacement 2000 times, recomputing ICC(1) in each sample and taking the 2.5% and 97.5% quantiles of the resampled values. Whether the reported category can be recovered from cell composition alone was examined, as a test of the limits of the quantification and not as a diagnostic model, with multinomial logistic regression and a random forest (500 trees, default settings) on CLR-transformed counts [39]. Validation was leave-one-patient-out. The pseudocount transformation involves no estimated parameters and no hyperparameters were tuned, so no step depended on the held-out patient. The baseline was the majority class of the training folds, which was the reference group in every fold, and both accuracy and balanced accuracy are reported. Sensitivity analyses were performed without haematopoietically active marrow, without the second section of the double-sectioned block, without the reference group and with restriction to sections with at least 2000 and at least 5000 classified nuclei. The precision of a cell proportion as a function of the number of classified nuclei was expressed as the half-width of its binomial 95% CI. Former maxillary and mandibular sites were compared with generalised estimating equations with a logistic link, sections clustered within patients, an exchangeable working correlation and robust (sandwich) standard errors. With 28 clusters these standard errors may be somewhat optimistic, and no small-sample correction was applied, so this comparison is exploratory. Analyses were performed in Python (version 3.13; Python Software Foundation, Wilmington, DE, USA) with SciPy (version 1.18), statsmodels (version 0.15) and scikit-learn (version 1.9). All comparisons are exploratory, and p < 0.05 was considered significant.
2.10. Use of Generative Artificial Intelligence
A large language model (Claude Opus model family, Anthropic, San Francisco, CA, USA) was used to assist in coding the wording of the pathology reports according to the predefined criteria described above, in the statistical scripting, including the additional analyses of the revision, in preparing the figures, and in drafting and language editing of the manuscript. The model did not make diagnoses. It organised the wording of reports written by pathologists, and its output was checked in full by R.W. as described in Section 2.6. Coding rules, borderline assignments, analyses and the final text were decided by the authors.
3. Results
3.1. Cohort and Specimens
Eighty-three sections from 82 blocks in 28 patients were analysed, comprising 3,387,350 classified cells (Table 1). Eighteen patients were women and 10 men, and the median age at surgery was 54 years (IQR 46–69, range 24–82). Most sections came from the mandible (56 of 83), with the distribution by region given in Table 1. Patients contributed a median of three sections (IQR 2–4, range 1–6). Seventy-six sections, from all 28 patients, represented bone lid, and seven, from six patients, tissue labelled as content of the residuum or as taken from its depth.
Table 1.
Cohort and specimens. Values are n or median (IQR).
3.2. Leading Findings
Fifty-one of the 83 sections (61.4%; 95% CI 50.7–71.2 by the Wilson method, 44.3–77.1 accounting for clustering by patient) carried a distinguishing histopathological finding, distributed over six categories (Table 2, Figure 2, Figure 3 and Figure 4). Marrow fibrosis was the most frequent (12 sections; 14.5%), followed by granulocytic inflammation or osteomyelitis (11; 13.3%), lymphoplasmacytic infiltrate (9; 10.8%), avital bone or osteonecrosis (7; 8.4%), haematopoietically active marrow (7; 8.4%) and foreign material-associated reaction (5; 6.0%). Epithelium was not the leading finding of any section. The reference group comprised 32 sections (38.6%) from 15 patients. Haematopoietically active marrow can also be a normal finding in the adult jaw. Without this category, 44 of 83 sections (53.0%; 95% CI 42.4–63.4, clustered 34.7–70.2) remained altered. At the patient level, 21 of 28 patients (75.0%; 95% CI 56.6–87.3) had at least one section with a distinguishing finding, and 18 (64.3%; 45.8–79.3) without counting haematopoietically active marrow.
Table 2.
Leading finding per section (n = 83) and number of patients in whom it occurred. Each section is counted once, under its highest-ranking finding; coexisting findings are not shown.
Figure 2.
Three former third molar sites of comparable radiological appearance with different histopathology. Patients A and B, former upper third molar sites (18); patient C, former lower third molar site (48). For each site the conventional CBCT view (a,c,e) and the three-dimensional visualisation (b,d,f) are shown with the measured extent and the histopathological diagnosis. All three lesions are non-mineralised areas confined to the former socket beneath a continuous mineralised crestal layer. In the mandibular site the canal is marked in yellow.
Figure 3.
Representative haematoxylin and eosin (HE)-stained sections of the leading findings (former third molar sites). (a) Marrow fibrosis; (b) avital bone; (c) lymphoplasmacytic infiltrate; (d) granulocytic inflammation or osteomyelitis; (e) foreign material with giant cell reaction; (f) fatty marrow without a distinguishing finding (reference group). Scale bars 200 µm.
Figure 4.
Leading finding per section (n = 83, 28 patients). The reference group (grey, no distinguishing finding reported) comprises sections in which the report named no distinguishing feature.
The inflammatory categories, granulocytic inflammation or osteomyelitis and lymphoplasmacytic infiltrate, together accounted for 24.1% of sections, and the structural categories, marrow fibrosis, avital bone and foreign material-associated reaction, for 28.9%. Osteomyelitis was named explicitly in four sections from three patients. The granulocytic category was clustered, with two patients contributing seven of its 11 sections.
Bone lid sections carried a distinguishing finding in 48 of 76 (63.2%) and sections from the depth of the residuum in three of seven (Table S4). Former maxillary sites were altered more often than mandibular sites (21 of 27, 77.8%, against 30 of 56, 53.6%; odds ratio 2.24, 95% CI 1.19–4.23, p = 0.013, generalised estimating equations). This difference arose mainly because the reference group was more frequent in the mandible (26 of 56 against 6 of 27), and foreign material-associated reaction occurred only at mandibular sites (Table S4). Given the small numbers, the clustering within patients and the selection of the series, this comparison is exploratory and does not indicate a biological or causal difference between the jaws.
3.3. Fatty Marrow as Background
Fatty marrow was mentioned in 57 of 77 reports with available text (74.0%), in sections with florid inflammation as well as in those without a distinguishing finding. In seven sections (8.4%) the marrow was not fatty but haematopoietically active, in several instances described with a left shift and increased granulopoiesis.
3.4. Different Findings Within the Same Patient
Twenty-four patients contributed more than one section. In 13 of them (54.2%) the sections carried different categories, in 10 distinct combinations (Table 3, Figure 5 and Figure S1). Heterogeneity was more frequent when more sections were examined. Two of eight patients with two sections, six of eight with three, three of four with four and two of three with six showed more than one category, and one patient with six sections showed four different categories. In four patients only one section was examined.
Table 3.
Number of sections examined per patient against the number of distinct categories found (reference group counted as one category). Values are numbers of patients.
Figure 5.
Leading finding per section, by patient. One row per patient, one box per section; the label in the box denotes the leading finding and the number below it the FDI region. Patients in bold carried more than one category. A dash denotes the reference group; Fib, marrow fibrosis; Gra, granulocytic inflammation or osteomyelitis; Avi, avital bone or osteonecrosis; Hae, haematopoietically active marrow; Lym, lymphoplasmacytic infiltrate; For, foreign material-associated reaction.
3.5. Cell Composition by Category
The software-derived cell fractions separated the categories (Table 4, Figure 6). The median fibroblast fraction ranged from 24.2% in haematopoietically active marrow and 31.5% in granulocytic inflammation or osteomyelitis to 67.9% in the reference group and 70.2% in avital bone. The lymphocyte fraction ran in the opposite direction, from 47.1% and 49.5% to 14.1% and 12.8%. With the patient as a random effect, the CLR-transformed fractions differed between categories for lymphocytes (Holm-adjusted p = 0.0012), neutrophil granulocytes (p = 0.011), plasma cells (p = 0.021) and fibroblasts (p = 0.023), but not for macrophages (p = 0.12) (Table S1). The section-level Kruskal–Wallis tests gave the same pattern with large effect sizes (lymphocytes H = 26.0, ε2 = 0.32, adjusted p = 0.0011; neutrophils H = 23.3, ε2 = 0.29, p = 0.0028; fibroblasts H = 20.6, ε2 = 0.25, p = 0.0065; plasma cells H = 16.7, ε2 = 0.20, p = 0.021; macrophages H = 10.5, ε2 = 0.13, p = 0.10).
Table 4.
Cell composition by leading finding. Median percentage of all classified nuclei, ordered by fibroblast fraction. Software-derived, exploratory estimates, not validated cell counts.
Figure 6.
Cell composition by leading finding from the AI quantification, with fibroblasts, lymphocytes and neutrophil granulocytes in the top row and plasma cells and macrophages in the bottom row. Boxes show the IQR, heavy lines the median, whiskers 1.5 × IQR and dots individual sections. Panels share their rows but not their scales. Above each panel, p values from the section-level Kruskal–Wallis test and from the linear mixed model with the patient as random effect, both Holm-adjusted across the five cell classes; on the right, post hoc comparisons against the reference group from the mixed model. Full results in Table S1. All values are software-derived, exploratory estimates, not validated cell counts.
Against the reference group, and accounting for clustering, the lymphocyte fraction was raised in haematopoietically active marrow (CLR difference 0.82, 95% CI 0.30 to 1.34, adjusted p = 0.011) and granulocytic inflammation or osteomyelitis (0.61, 0.17 to 1.05, p = 0.034), but not significantly in lymphoplasmacytic infiltrate (0.42, −0.04 to 0.89, p = 0.23), marrow fibrosis, avital bone or foreign material-associated reaction. Neutrophils were raised in granulocytic inflammation or osteomyelitis (0.87, 0.29 to 1.46, p = 0.022) and haematopoietically active marrow (0.84, 0.23 to 1.44, p = 0.033), and plasma cells in haematopoietically active marrow (1.54, 0.66 to 2.42, p = 0.0037). Fibroblasts were lowered in haematopoietically active marrow (−1.05, −1.64 to −0.46, p = 0.0028), whereas their decrease in granulocytic inflammation or osteomyelitis did not remain significant after adjustment (−0.75, −1.33 to −0.18, p = 0.051). Macrophages were lower in avital bone (−0.91, −1.54 to −0.27, p = 0.033). The quantification thus reproduced the inflammatory axis of the report but not its structural axis.
Excluding the second section of the double-sectioned block (n = 82) left the results unchanged (Table S2). When the reference group was removed and the six named categories were compared only with one another (n = 51), lymphocytes (adjusted p = 0.0019), plasma cells (p = 0.024) and neutrophils (p = 0.024) still differed, whereas fibroblasts (p = 0.12) and macrophages (p = 0.12) did not, so the differences among the named findings do not depend on the reference group alone. Without haematopoietically active marrow (n = 76), only the lymphocyte fraction still differed between categories (p = 0.013; neutrophils p = 0.086, fibroblasts and plasma cells p = 0.24), together with the log-ratio of inflammatory-associated cells to fibroblasts (p = 0.010) (Table S2). Part of the separation of the categories thus rests on the haematopoietic category.
The number of classified nuclei per section differed strongly between categories (H = 36.4, p < 0.0001). Avital bone was the most cell-poor category, with a median of 201 nuclei per section (IQR 126–883), followed by the reference group with 8117 (3386–12,936), whereas granulocytic inflammation or osteomyelitis and haematopoietically active marrow reached medians of 51,238 and 57,431. Across all sections the number of nuclei rose with the inflammatory-associated fraction (Spearman ρ = 0.71, 95% CI 0.53–0.81, patient-level bootstrap). The precision of a proportion depends on this number. For a fraction of 60%, the half-width of the binomial 95% CI is 6.8 percentage points at 201 nuclei, 2.1 at 2000 and 0.9 at the overall median of 11,980, and for a fraction of 2%, as typical for neutrophils, it is 1.9, 0.6 and 0.25 points (Table S3). Fifteen sections had fewer than 2000 and five fewer than 500 nuclei. Because cell content is part of the finding, a minimum nucleus count does not only remove technically poor sections but selects by category. With a threshold of 2000 nuclei (n = 68), the differences in the individual cell classes were borderline after adjustment (p = 0.052 each for fibroblasts, lymphocytes, plasma cells and neutrophils), and the log-ratio of inflammatory-associated cells to fibroblasts still differed (p = 0.0027). A threshold of 5000 nuclei (n = 62) excluded all seven sections with avital bone; the individual classes then no longer differed (p ≥ 0.18), whereas the log-ratio did (p = 0.022) (Table S2, Figure S3). Findings for the cell-poor categories should therefore be read with caution.
3.6. The Inflammatory Compartment
The inflammatory-associated fraction ranged from 3.2% to 83.7% of classified cells. Its log-ratio to the fibroblast fraction differed between categories (mixed model p = 0.0002; Kruskal–Wallis on the fraction H = 25.5, ε2 = 0.31, p = 0.0003) and was raised against the reference group in haematopoietically active marrow (difference 1.80, 95% CI 0.91 to 2.69, adjusted p = 0.0005) and granulocytic inflammation or osteomyelitis (1.33, 0.54 to 2.12, p = 0.0046) (Figure 7). Plotted against each other, the fibroblast and inflammatory-associated fractions were strongly inverse (r = −0.979, 95% CI −0.988 to −0.966; slope in a mixed model −0.94, 95% CI −0.98 to −0.89). This relation is largely arithmetic. The two compartments share one denominator and together accounted for a median of 93.6% of classified nuclei (IQR 88.4–95.4), so that a section with more inflammatory-associated cells necessarily has a lower fibroblast fraction. The correlation therefore describes the composition of the sections and is not evidence that inflammatory cells replace or suppress fibroblasts. Across all sections, fibroblasts accounted for a median of 59.2% (IQR 33.8–72.7) and lymphocytes for 25.4% (13.0–41.8) of classified cells (Figure S2). Every other class had a median below 4%.
Figure 7.
Inflammatory-associated cells against fibroblasts. (a) One marker per section; dashed line, least-squares fit. The strong inverse relation is largely a consequence of the shared denominator (Section 3.6). (b) Inflammatory-associated fraction by leading finding, with Kruskal–Wallis and mixed-model p values; boxes show the IQR and heavy lines the median. The inflammatory-associated fraction is the sum of lymphocytes, plasma cells, macrophages and neutrophil and eosinophil granulocytes. Software-derived, exploratory estimates.
Neutrophil granulocytes, as a share of all classified cells, were highest in haematopoietically active marrow (5.50%) and granulocytic inflammation or osteomyelitis (3.54%) (Figure 8). As a share of the inflammatory-associated fraction, however, they did not differ between categories (H = 6.8, p = 0.34). The median was 5.4% (IQR 3.8–8.3) overall and 6.9% (4.5–9.0) in the category containing every confirmed osteomyelitis. In no section did neutrophils exceed 7.4% of classified cells or 16.1% of the inflammatory-associated fraction. The infiltrate was dominated by lymphocytes throughout.
Figure 8.
Neutrophil granulocytes. (a) As a share of all classified cells, which differs between categories. (b) As a share of the inflammatory-associated cells only, which does not. Boxes show the IQR, heavy lines the median and dots individual sections.
3.7. Site and Patient
For every cell class most of the variance lay between sections rather than between patients, but the estimates are imprecise. Among the 24 patients with more than one section the ICC(1) was 0.124 (95% CI −0.10 to 0.32) for fibroblasts, 0.099 (−0.15 to 0.32) for lymphocytes, 0.370 (−0.06 to 0.66) for plasma cells and 0.273 (0.04 to 0.46) for neutrophils, and for macrophages the between-patient component was not distinguishable from zero (−0.17, −0.35 to 0.14). With 24 patients these intervals are wide and compatible with a moderate patient effect. The report behaved in the same way. Of the 24 patients with more than one section only 11 received the same category at every site.
3.8. Category and Cell Composition
Models trained on cell composition and validated leave-one-patient-out did not exceed the majority-class baseline in accuracy (0.337 for multinomial logistic regression and 0.337 to 0.349 for the random forest, depending on the random seed, against 0.386 for always predicting the reference group). Balanced accuracy, which is not inflated by the large reference group, was 0.213 and 0.168 against 0.143 for the baseline, so the models recovered the smaller categories only slightly better than chance. Other zero handling (pseudocount one or multiplicative replacement) gave accuracies between 0.313 and 0.349. The categories differ on average but overlap too much for a single section to be assigned to its reported category from the quantification alone. The models were included to show this limit and not as a diagnostic tool.
4. Discussion
4.1. Principal Findings
In this selected series of surgically revised CSR, three of five sections, mostly from the bone lid and the former socket wall, carried a distinguishing histopathological finding, and three of four patients had at least one such section. The findings were not uniform. Six categories occurred, from marrow fibrosis and avital bone to granulocytic inflammation and osteomyelitis, and in more than half of the patients with more than one section different findings were present in the same jaw. Even without haematopoietically active marrow, which may be physiological, more than half of the sections were altered. An exploratory, software-based quantification that had no access to the report separated the inflammatory findings from the reference group, also when clustering within patients was taken into account, and showed a lymphocyte-dominated infiltrate. These frequencies describe operated residua and cannot be transferred to former third molar sites in general, and without a control group they do not show that the findings are specific to CSR.
4.2. Relation to the Socket Wall at Extraction
In our companion study, the socket wall was already altered at the moment of extraction in 38 of 41 sockets of teeth that had to be removed for a clinical indication, three quarters of them teeth other than third molars [11]. For those teeth a source of the alteration is evident, such as caries, periodontal disease, apical periodontitis or a root canal treatment that had led to the extraction. The present cohort extends the observation to the former sites of teeth that are, as a rule, removed early in life and often without any disease of their own. Taken together, the two studies describe both ends of the chain proposed in the Introduction. One is an altered socket wall at the extraction of teeth that had to be removed, the other is altered tissue within covered residua years after the extraction of teeth that are usually not diseased. The finding is also not confined to third molars. First observations suggest that residua at the former sites of other teeth show the same kinds of alteration, among them avital bone, osteonecrosis and osteomyelitis; this is being examined in an ongoing study.
The time since extraction was not recorded, and the age of the patients does not allow it to be inferred, so the duration of the changes is unknown. The tissue found was predominantly chronic in character, with marrow fibrosis, avital bone and a lymphocyte-dominated infiltrate in which neutrophils never exceeded a small share even where osteomyelitis had been diagnosed. This is compatible with a long-standing process rather than an acute infection, but the data do not show how long the changes had been present or whether they arose at extraction or later.
4.3. Where Does the Alteration Come from?
If the third molar itself was healthy, the alteration must have arisen during or after its removal. Three mechanisms may be considered as hypotheses, and they are not mutually exclusive. They are derived from surgically revised residua in a selected population and do not describe the frequency or natural history of alterations at former third molar sites in general. First, tissue may have been left in the socket. A follicle that is not removed completely, with the inflammatory or cystic changes it frequently carries [12], is enclosed when the crest closes. Epithelium was described in one case of this series, although it could not be attributed to a single section. Second, the socket wall may not have been prepared. Granulation tissue and an altered lamina dura are not removed by extraction of the tooth alone, and debris or foreign material may remain. Five sections in this series showed a foreign material-associated reaction, in one of them acellular debris compatible with drilling dust. Third, the wound may have been contaminated. Infection and abscess formation after third molar surgery are more frequent after long or difficult operations [14,16]. Our data cannot distinguish between these mechanisms, because the condition of the tooth, the indication for its removal and the course of the original operation were not documented, and the alteration may also have arisen during healing or later.
4.4. Heterogeneity and the Unit of Diagnosis
Cell composition varied more between sections than between patients, and different findings coexisted in the same jaw. A single biopsy therefore characterises the tissue sampled and not the patient. Where several sites are revised, each should be submitted and reported separately, and studies of these sites should state whether the unit of analysis is the specimen, the site or the patient, because they diverge.
The same observation bears on terminology. Concepts that assign one pathogenesis to all non-healed former extraction sites [17,19] do not describe this material well, because the material was not one thing. Fatty marrow, which gives FDOJ its name, was mentioned in three quarters of the reports, in inflamed sites and in those without a distinguishing finding alike. It is the normal state of adult jaw marrow and on its own does not discriminate. In 7 of 83 sections the marrow was haematopoietically active instead. We therefore use CSR only as a radiological description of a configuration at a former socket, shown on three-dimensional imaging, and report its content separately as a histopathological finding. Until the histology is available, the site should be described radiologically and not by a histological name.
4.5. A Gradient of Inflammatory Activity
The most consistent quantitative finding was that the categories were ordered along one axis of cell composition. Avital bone, the reference group and foreign material reaction lay at the fibroblast-rich, cell-poor end, marrow fibrosis in an intermediate position, and lymphoplasmacytic infiltrate, granulocytic inflammation or osteomyelitis and haematopoietically active marrow at the end rich in inflammatory-associated cells, with lymphocytes, plasma cells and neutrophils rising in the same order. The verbal diagnosis of the pathologist thus corresponded to a measurable difference in cell composition, and this held when the clustering of sections within patients was accounted for. The axis is cross-sectional and descriptive. It does not show that the categories follow one another in time, and the inverse relation of fibroblasts and inflammatory-associated cells is to a large part a consequence of their shared denominator (Section 3.6). The cell content followed the same order, so the number of cells in a section is part of the finding and not only a measure of its technical quality.
Two categories need comment. Haematopoietically active marrow lay at the inflammatory end and had the highest share of neutrophils. This is to be expected, since blood-forming marrow is rich in granulocytes and their precursors as well as in lymphocytes, and the classifier counts all of them as inflammatory cells. Here the gradient reflects haematopoiesis rather than inflammation. Avital bone, in turn, had a higher fibroblast fraction than marrow fibrosis (70.2% against 60.2%), although fibrosis is defined by an increase in fibroblasts. The few nuclei left in avital bone, in fibrous tissue of the marrow spaces or at the bone surface, are probably assigned to the fibroblast class, which thereby collects spindle-shaped nuclei of different origin. The fibroblast fraction is therefore no measure of fibrosis, and in cell-poor bone part of the classification is likely to be wrong. Before this class is read on its own, it needs to be checked against the slides. We therefore refer to the sum of lymphocytes, plasma cells, macrophages and granulocytes as the inflammatory-associated fraction. The classifier does not distinguish granulocytic precursors from mature neutrophils, and in haematopoietically active marrow this fraction contains physiological marrow cells.
4.6. What the AI Quantification Adds and Where It Stops
The quantification was performed on the same sections as the report but without knowledge of it, so the agreement on the inflammatory gradient is not the product of a shared reader. The gradient persisted when the reference group was removed, so it is not only a contrast between inflamed tissue and the reference group. At the same time, the categories overlapped widely, and the quantification could not assign a single section to its category. The structural findings, fibrosis, avital bone and foreign material reaction, are defined by architecture and by the state of the bone, which a nucleus classifier does not capture, and the classifier has no adipocyte class. The two methods are therefore complementary. The report names the finding, and the quantification gives an exploratory, software-derived estimate of the content of inflammatory-associated cells that, once validated, could be compared between sites, centres and future trials.
That the measured inflammatory burden followed the verbal diagnosis so closely suggests that such a tool could one day assist the pathologist, for instance by quantifying the infiltrate in a standardised way. Work on prostate cancer supports this. There, algorithms graded biopsies about as well as expert uropathologists, and their agreement with individual pathologists lay within the range found between the pathologists themselves [40,41]. When pathologists graded with the help of the algorithm, their agreement with an expert reference improved [42]. Comparable data for jaw bone and marrow do not exist. Nucleus classifiers perform differently across tissues and laboratories [43], classifiers for marrow have so far been developed mainly on aspirate smears [44], and diagnostic deep learning requires validation in the target tissue [45]. The misclassification described in Section 4.5 shows that the classes must first be validated against manual annotation by pathologists in decalcified jaw bone and marrow, and until then the present counts are exploratory, software-derived measurements.
4.7. Third Molar Removal Is Not a Minor Procedure
Removal of a third molar is one of the most frequent operations in young people and is often treated as a routine intervention. Its anatomy argues otherwise. The lower third molar lies at the transition from the body to the ramus of the mandible, separated by a thin lingual plate from the submandibular and pterygomandibular spaces, which communicate with the parapharyngeal and retropharyngeal spaces. These fascial spaces of the neck are continuous with one another and, through the retropharyngeal and danger spaces, with the mediastinum. The upper third molar lies at the maxillary tuberosity, next to the pterygoid plexus and the infratemporal fossa. An infection arising here is not confined to the socket, because odontogenic infections can spread into the deep fascial spaces, with airway obstruction, mediastinitis and cavernous sinus thrombosis as their most serious consequences [46], and deep neck infection has been reported after third molar removal [47]. Delayed infections after lower third molar extraction occurred in 7.2% of patients in one recent series, mainly when the tooth was deeply impacted [15]. Bone removal weakens the mandible, and iatrogenic fractures, most of them in the weeks after surgery, are a recognised although rare consequence [48].
The present data add a late finding to this list, but they do not show when or how it arose. The following considerations are therefore hypotheses generated by this series and not recommendations based on it.
First, as in any procedure in bone, aseptic technique, careful handling of the soft tissue and avoidance of contamination of the open socket are general surgical principles [49]. Second, whether complete removal of the follicle and debridement of the socket wall influence the later state of the site has not been studied and could be examined prospectively. Third, antibiotic prophylaxis is not supported for routine extractions [50], and the present data give no reason to depart from this.
Fourth, a clean socket may still close over its centre. In former third molar sockets a CSR developed in our randomised split-mouth study irrespective of whether platelet-rich fibrin was placed [7], and the same was observed in premolar and first molar sockets [51]. Ridge preservation with bone substitutes limits the dimensional change after extraction [5,52], but whether filling the socket prevents a residuum is unknown. This question requires prospective controlled trials with a three-dimensional radiological endpoint and histology.
4.8. Outlook
If the content of former sockets is heterogeneous, these sites may also differ in their risk when a systemic insult is added, such as an antiresorptive drug [53,54]. Osteonecrosis of the jaw arises preferentially at extraction sites, and radiographic features of the socket have been associated with its development [55,56]. A site harbouring avital bone or osteomyelitis may not be equivalent to one without a distinguishing finding. The present data contain no exposure or outcome information and do not test this hypothesis, but they provide a vocabulary of findings and a quantitative method with which such a study could be designed. A prospective study with standardised sampling of lid and content, a second, blinded histological reading, validated CBCT measurements and documentation of the original extraction is planned. Whether the tissue found in CSR is related to the general complaints with which some patients presented cannot be answered from this material and would require prospective assessment with validated instruments.
4.9. Limitations
Every site was revised because a CSR had been diagnosed radiologically and the patient requested treatment (Section 2.2). The findings therefore describe former third molar sites with a radiologically diagnosed residuum in a selected, partly symptomatic population and cannot be transferred to former third molar sites in general. There was no control group of normally healed sockets, because bone cannot be removed from such a site for a study, so the findings cannot be shown to be specific to CSR. Comparable changes have been reported in bone from ordinary edentulous ridges [57]. The study is retrospective, comes from a single centre and is modest in size. The smallest category is represented by five sections from three patients, and all statistical comparisons are exploratory. The time since extraction, the indication, the condition and eruption status of the tooth, the course of the original operation, antibiotic use and postoperative complications were unknown, so no mechanism can be inferred. The radiological diagnosis rested on two readers whose agreement could not be quantified, and both readers are connected to the company that prepared the visualisations (see Conflicts of Interest); the diagnosis was, however, verified at surgery.
The diagnoses are those of routine reports, issued largely by one pathologist, and were coded without a second independent coding, so interobserver agreement was not assessed. Coding inherits the vocabulary of the reports, and a single leading finding simplifies sections in which several features coexist. The distribution of categories therefore depends on the predefined hierarchy, and the leading finding does not represent the complete histopathological profile of a section. The reference group is defined by the absence of a reported feature and is not equivalent to normal tissue; in some of its blocks only a small fragment of bone was sectioned, so a lesion missed by the embedding plane cannot be excluded. Most specimens were bone lid, so the findings describe the lid and its inner surface, the former socket wall, and not the whole content of the residuum. The AI classifier was trained by the manufacturer on data whose composition is not known to us and was not validated against manual annotation of jaw bone and marrow. Its counts are exploratory, software-derived estimates; per-nucleus confidence scores were not available, and one section with a stain other than HE is not technically comparable with the others. The fibroblast class probably includes other spindle-shaped nuclei, above all in avital bone (Section 4.5), the inflammatory-associated fraction includes physiological marrow cells, and the classifier has no adipocyte class, so the extent of fatty change was not measured. The reviewing pathologist was not blinded to the reports. In cell-poor sections, above all avital bone, the proportions rest on few nuclei and are imprecise (Table S3).
The soft content of the residuum was examined in only seven sections, so whether it carries further inflammatory or systemically relevant markers remains for future studies. No microbiological examination was performed, so the term infection is not used for the cohort as a whole. No clinical outcome was analysed, and the study makes no statement about the effect of the operation on any complaint.
5. Conclusions
In this selected series of surgically revised covered socket residua at former third molar sites, three of five sections, mostly from the bone lid and the former socket wall, carried a distinguishing histopathological finding, and more than half did so even without haematopoietically active marrow. Marrow fibrosis and granulocytic or lymphoplasmacytic inflammation were the main findings, and the findings varied within the same patient. Exploratory, software-derived cell fractions, obtained independently of the report, separated the inflammatory categories also when clustering within patients was accounted for, but they require validation in this tissue. Whether the handling of the socket at extraction, such as removal of the follicle, debridement of the socket wall or filling of the socket, influences these findings is a hypothesis that should be examined in prospective controlled studies.
Supplementary Materials
The following supporting information can be downloaded at: https://www.mdpi.com/article/10.3390/diagnostics16223894/s1, Figure S1: Number of sections examined per patient against the number of distinct categories found; Figure S2: Fibroblast against lymphocyte fraction, one marker per section, faceted by leading finding; Figure S3: Sensitivity analyses; Figure S4: Selection of patients and sections; Table S1: Comparison of cell composition between categories; Table S2: Sensitivity analyses; Table S3: Precision of a cell proportion by the number of classified nuclei; Table S4: Leading finding by specimen type and by jaw.
Author Contributions
Conceptualization, S.G., J.Ś.-W., A.W., R.N. and R.W.; methodology, S.G., J.Ś.-W., R.N., P.J.W. and R.W.; investigation, S.G., J.M.K., R.N. and R.W.; data curation, J.M.K. and R.N.; formal analysis, J.M.K. and R.N.; validation, P.J.W. and R.W.; visualisation, J.Ś.-W.; resources, R.S., P.J.W. and R.W.; writing—original draft preparation, S.G. and J.Ś.-W.; writing—review and editing, S.G., J.Ś.-W., J.M.K., A.W., R.N., R.S., P.J.W. and R.W.; supervision, S.G., A.W., R.N., R.S. and P.J.W.; project administration, S.G.; funding acquisition, S.G. All authors have read and agreed to the published version of the manuscript.
Funding
This study was supported by the Academy for Biological Innovations in Surgery (ABIS) e.V., grant number AB-FFM-2026-2, which also covered the part of the article processing charge not funded by the Open Access Publication Fund of Goethe University Frankfurt. Visiogenics GmbH supported the study in kind by providing the three-dimensional visualisations free of charge and by funding the doctoral position of J.M.K., who collected and curated the data.
Institutional Review Board Statement
The study was conducted in accordance with the Declaration of Helsinki and approved by the Ethics Committee of the Medical Faculty of Goethe University Frankfurt (approval number 2026-3043, 7 July 2026; amendment 2026-3043_1, 7 August 2026).
Informed Consent Statement
Individual patient consent was not obtained. The Ethics Committee approved the study as a retrospective analysis of pseudonymised routine clinical documents and histological specimens (approval number 2026-3043, amendment 2026-3043_1).
Data Availability Statement
The de-identified section-level dataset and the whole-slide images are available from the corresponding author on reasonable request. The data are not publicly available because they contain information that could compromise patient privacy.
Acknowledgments
This work is part of the doctoral thesis of J.M.K. The authors thank the team of Visiogenics GmbH for the preparation of the three-dimensional visualisations, for support in data handling and for supporting the doctoral project of J.M.K. During the preparation of this manuscript, the authors used Claude (Anthropic) for the purposes described in Section 2.10. The authors have reviewed and edited the output and take full responsibility for the content of this publication.
Conflicts of Interest
S.G. is chairman of ABIS e.V., a shareholder of Visiogenics GmbH, a spin-off company of Goethe University Frankfurt, and an inventor on a pending patent application related to the three-dimensional visualisation of CBCT data used in this study. J.Ś.-W. is vice-chair of ABIS e.V. and managing director of Visiogenics GmbH. Both assessed the CBCT scans (Section 2.4). J.M.K. was funded by Visiogenics GmbH during the study. ABIS e.V. had no role in the design of the study, in the collection, analysis or interpretation of the data, in the writing of the manuscript or in the decision to publish the results. Visiogenics GmbH prepared the three-dimensional visualisations after the radiological diagnosis had been made, supported data handling and funded the position of J.M.K. The company had no access to the histological specimens or slides and no influence on the histopathological reports, the coding, the AI cell quantification, the statistical analysis or the interpretation, and it had no role in the design of the study, the writing of the manuscript or the decision to publish the results. The other authors declare no conflicts of interest.
Abbreviations
The following abbreviations are used in this manuscript:
| AI | artificial intelligence |
| CBCT | cone-beam computed tomography |
| CI | confidence interval |
| CLR | centred log-ratio |
| CSR | covered socket residuum |
| EDTA | ethylenediaminetetraacetic acid |
| FDI | Fédération Dentaire Internationale |
| FDOJ | fatty degenerative osteonecrosis of the jaw |
| FESI | Foreground Extraction from Structure Information |
| GEE | generalised estimating equations |
| HE | haematoxylin and eosin |
| ICC | intraclass correlation coefficient |
| IQR | interquartile range |
| NICO | neuralgia-inducing cavitational osteonecrosis |
| PAS | periodic acid–Schiff |
| TCA | trichloroacetic acid |
References
- Amler, M.H. The time sequence of tissue regeneration in human extraction wounds. Oral Surg. Oral Med. Oral Pathol. 1969, 27, 309–318. [Google Scholar] [CrossRef] [Scilit]
- Cardaropoli, G.; Araújo, M.; Lindhe, J. Dynamics of bone tissue formation in tooth extraction sites. An experimental study in dogs. J. Clin. Periodontol. 2003, 30, 809–818. [Google Scholar] [CrossRef] [Scilit]
- Araujo, M.G.; Lindhe, J. Dimensional ridge alterations following tooth extraction. An experimental study in the dog. J. Clin. Periodontol. 2005, 32, 212–218. [Google Scholar] [CrossRef] [Scilit]
- Trombelli, L.; Farina, R.; Marzola, A.; Bozzi, L.; Liljenberg, B.; Lindhe, J. Modeling and remodeling of human extraction sockets. J. Clin. Periodontol. 2008, 35, 630–639. [Google Scholar] [CrossRef] [Scilit]
- Couso-Queiruga, E.; Stuhr, S.; Tattan, M.; Chambrone, L.; Avila-Ortiz, G. Post-extraction dimensional changes: A systematic review and meta-analysis. J. Clin. Periodontol. 2021, 48, 126–144. [Google Scholar] [CrossRef] [Scilit]
- Ghanaati, S.; Śmieszek-Wilczewska, J.; Al-Maawi, S.; Heselich, A.; Sader, R. After extraction, upper premolars undergo programmed socket collapse with development of cavitations rather than complete socket healing: A radiological study. Bioengineering 2025, 12, 128. [Google Scholar] [CrossRef] [Scilit]
- Ghanaati, S.; Kamolov, A.; Bouquot, J.; Sader, R.; Heselich, A.; Al-Maawi, S. Covered socket residuum (CSR) in former third molar sockets despite platelet-rich fibrin: A prospective randomized controlled split-mouth clinical study. Bioengineering 2025, 12, 1242. [Google Scholar] [CrossRef] [Scilit]
- Ghanaati, S.; Heselich, A.; Lechner, J.; Sader, R.; Bouquot, J.E.; Al-Maawi, S. Jawbone cavitations: Current understanding and conceptual introduction of covered socket residuum (CSR). Bioengineering 2026, 13, 106. [Google Scholar] [CrossRef] [Scilit]
- Heselich, A.; Neff, P.; Śmieszek-Wilczewska, J.; Sader, R.; Ghanaati, S. Introduction of a semi-quantitative image-based analysis tool for CBCT-based evaluation of bone regeneration in tooth extraction sockets. Bioengineering 2025, 12, 301. [Google Scholar] [CrossRef] [Scilit]
- Tomasek, J.J.; Gabbiani, G.; Hinz, B.; Chaponnier, C.; Brown, R.A. Myofibroblasts and mechano-regulation of connective tissue remodelling. Nat. Rev. Mol. Cell Biol. 2002, 3, 349–363. [Google Scholar] [CrossRef] [Scilit]
- Ghanaati, S.; Śmieszek-Wilczewska, J.; Winter, A.; Kimmerle, A.; Sader, R.; Najafi, R.; Wild, P.J.; Winkelmann, R. The alveolar socket wall is already altered at the time of tooth extraction: A retrospective clinical, radiological and histopathological study. J. Clin. Med. 2026; in press. [CrossRef] [Scilit]
- Baykul, T.; Saglam, A.A.; Aydin, U.; Başak, K. Incidence of cystic changes in radiographically normal impacted lower third molar follicles. Oral Surg. Oral Med. Oral Pathol. Oral Radiol. Endod. 2005, 99, 542–545. [Google Scholar] [CrossRef] [Scilit]
- Lockhart, P.B.; Brennan, M.T.; Sasser, H.C.; Fox, P.C.; Paster, B.J.; Bahrani-Mougeot, F.K. Bacteremia associated with toothbrushing and dental extraction. Circulation 2008, 117, 3118–3125. [Google Scholar] [CrossRef] [Scilit]
- Bouloux, G.F.; Steed, M.B.; Perciaccante, V.J. Complications of third molar surgery. Oral Maxillofac. Surg. Clin. N. Am. 2007, 19, 117–128. [Google Scholar] [CrossRef] [Scilit]
- Monaco, G.; Gatto, M.R.A.; Pelliccioni, G.A. Incidence of delayed infections after lower third molar extraction. Int. J. Environ. Res. Public Health 2022, 19, 4028. [Google Scholar] [CrossRef] [Scilit]
- Miclotte, I.; Agbaje, J.O.; Spaey, Y.; Legrand, P.; Politis, C. Incidence and treatment of complications in patients who had third molars or other teeth extracted. Br. J. Oral Maxillofac. Surg. 2018, 56, 388–393. [Google Scholar] [CrossRef] [Scilit]
- Bouquot, J.E.; Roberts, A.M.; Person, P.; Christian, J. Neuralgia-inducing cavitational osteonecrosis (NICO). Osteomyelitis in 224 jawbone samples from patients with facial neuralgia. Oral Surg. Oral Med. Oral Pathol. 1992, 73, 307–319. [Google Scholar] [CrossRef] [Scilit]
- Lechner, J.; von Baehr, V. RANTES and fibroblast growth factor 2 in jawbone cavitations: Triggers for systemic disease? Int. J. Gen. Med. 2013, 6, 277–290. [Google Scholar] [CrossRef] [Scilit]
- Lechner, J.; Schuett, S.; von Baehr, V. Aseptic-avascular osteonecrosis: Local “silent inflammation” in the jawbone and RANTES/CCL5 overexpression. Clin. Cosmet. Investig. Dent. 2017, 9, 99–109. [Google Scholar] [CrossRef] [Scilit]
- Lechner, J.; Schmidt, M.; von Baehr, V.; Schick, F. Undetected jawbone marrow defects as inflammatory and degenerative signaling pathways: Chemokine RANTES/CCL5 as a possible link between the jawbone and systemic interactions? J. Inflamm. Res. 2021, 14, 1603–1612. [Google Scholar] [CrossRef] [Scilit]
- Sekundo, C.; Wiltfang, J.; Schliephake, H.; Al-Nawas, B.; Rückschloß, T.; Moratin, J.; Hoffmann, J.; Ristow, O. Neuralgia-inducing cavitational osteonecrosis-a systematic review. Oral Dis. 2022, 28, 1448–1467. [Google Scholar] [CrossRef] [Scilit]
- Keith, D.A. Neuralgia inducing cavitational osteonecrosis of the jaw: Scientific controversy or pseudoscience? J. Pain Res. 2025, 18, 4275–4284. [Google Scholar] [CrossRef] [Scilit]
- Biancardi, M.R.; Cardoso, A.C.C.; Almeida, G.d.P.; Quirino, M.S.S.; Sarmento, V.A.; Rubira, C.M.F.; Rubira-Bullen, I.R.F. Neuralgia-inducing cavitational osteonecrosis (NICO): A scoping review of a controversial concept in orofacial pain. Arch. Oral Biol. 2026, 186, 106539. [Google Scholar] [CrossRef] [Scilit]
- Dominiak, M.; Niemczyk, W.; Pituraj, A.; Świenc, W.; Matys, J. Fatty degenerative osteonecrosis of the jaw: Bridging molecular insights and clinical practice. A scoping review. Int. J. Mol. Sci. 2025, 26, 1853. [Google Scholar] [CrossRef] [Scilit]
- von Elm, E.; Altman, D.G.; Egger, M.; Pocock, S.J.; Gøtzsche, P.C.; Vandenbroucke, J.P. The Strengthening the Reporting of Observational Studies in Epidemiology (STROBE) statement: Guidelines for reporting observational studies. Lancet 2007, 370, 1453–1457. [Google Scholar] [CrossRef] [Scilit]
- Tejani, A.S.; Klontzas, M.E.; Gatti, A.A.; Mongan, J.T.; Moy, L.; Park, S.H.; Kahn, C.E. Checklist for Artificial Intelligence in Medical Imaging (CLAIM): 2024 update. Radiol. Artif. Intell. 2024, 6, e240300. [Google Scholar] [CrossRef] [Scilit]
- Bruns, V.; Kuritcyn, P.; Benz, M. RRID:SCR_025081, MIKAIA® Studio, version 2.4.3 [Computer Software]; Fraunhofer Institute for Integrated Circuits IIS: Erlangen, Germany, 2025. Available online: https://www.mikaia.ai (accessed on 11 October 2026).
- Kuritcyn, P.; Kletzander, R.; Eisenberg, S.; Wittenberg, T.; Bruns, V.; Evert, K.; Keil, F.; Ziegler, P.K.; Bankov, K.; Wild, P.; et al. Towards interactive AI-authoring with prototypical few-shot classifiers in histopathology. J. Pathol. Inf. 2024, 15, 100388. [Google Scholar] [CrossRef] [Scilit]
- Bug, D.; Feuerhake, F.; Merhof, D. Foreground extraction for histopathological whole slide imaging. In Bildverarbeitung für Die Medizin 2015; Handels, H., Deserno, T.M., Meinzer, H.-P., Tolxdorff, T., Eds.; Springer: Berlin/Heidelberg, Germany, 2015. [Google Scholar] [CrossRef] [Scilit]
- Graham, S.; Vu, Q.D.; Raza, S.E.A.; Azam, A.; Tsang, Y.W.; Kwak, J.T.; Rajpoot, N. Hover-Net: Simultaneous segmentation and classification of nuclei in multi-tissue histology images. Med. Image Anal. 2019, 58, 101563. [Google Scholar] [CrossRef] [Scilit]
- Yu, Z.; Guindani, M.; Grieco, S.F.; Chen, L.; Holmes, T.C.; Xu, X. Beyond t test and ANOVA: Applications of mixed-effects models for more rigorous statistical analysis in neuroscience research. Neuron 2022, 110, 21–35. [Google Scholar] [CrossRef] [Scilit]
- Aitchison, J. The statistical analysis of compositional data. J. R Stat. Soc. Ser. B Stat. Methodol. 1982, 44, 139–160. [Google Scholar] [CrossRef] [Scilit]
- Gloor, G.B.; Macklaim, J.M.; Pawlowsky-Glahn, V.; Egozcue, J.J. Microbiome datasets are compositional: And this is not optional. Front. Microbiol. 2017, 8, 2224. [Google Scholar] [CrossRef] [Scilit]
- Greenacre, M. Compositional data analysis. Annu Rev. Stat. Appl. 2021, 8, 271–299. [Google Scholar] [CrossRef] [Scilit]
- Lubbe, S.; Filzmoser, P.; Templ, M. Comparison of zero replacement strategies for compositional data with large numbers of zeros. Chemom. Intell. Lab Syst. 2021, 210, 104248. [Google Scholar] [CrossRef] [Scilit]
- Holm, S. A simple sequentially rejective multiple test procedure. Scand. J. Stat. 1979, 6, 65–70. [Google Scholar]
- Shrout, P.E.; Fleiss, J.L. Intraclass correlations: Uses in assessing rater reliability. Psychol. Bull. 1979, 86, 420–428. [Google Scholar] [CrossRef]
- Koo, T.K.; Li, M.Y. A guideline of selecting and reporting intraclass correlation coefficients for reliability research. J. Chiropr. Med. 2016, 15, 155–163, Erratum in J. Chiropr. Med. 2017, 16, 346. https://doi.org/10.1016/j.jcm.2017.10.001. [Google Scholar] [CrossRef] [Scilit]
- Collins, G.S.; Moons, K.G.M.; Dhiman, P.; Riley, R.D.; Beam, A.L.; Van Calster, B.; Ghassemi, M.; Liu, X.; Reitsma, J.B.; van Smeden, M.; et al. TRIPOD+AI statement: Updated guidance for reporting clinical prediction models that use regression or machine learning methods. BMJ 2024, 385, e078378, Correction in BMJ 2024, 385, q902. [Google Scholar] [CrossRef] [Scilit]
- Ström, P.; Kartasalo, K.; Olsson, H.; Solorzano, L.; Delahunt, B.; Berney, D.M.; Bostwick, D.G.; Evans, A.J.; Grignon, D.J.; Humphrey, P.A.; et al. Artificial intelligence for diagnosis and grading of prostate cancer in biopsies: A population-based, diagnostic study. Lancet Oncol. 2020, 21, 222–232, Correction in Lancet Oncol. 2020, 21, e70. https://doi.org/10.1016/S1470-2045(20)30032-2. [Google Scholar] [CrossRef] [Scilit]
- Bulten, W.; Kartasalo, K.; Chen, P.-H.C.; Ström, P.; Pinckaers, H.; Nagpal, K.; Cai, Y.; Steiner, D.F.; van Boven, H.; Vink, R.; et al. Artificial intelligence for diagnosis and Gleason grading of prostate cancer: The PANDA challenge. Nat. Med. 2022, 28, 154–163. [Google Scholar] [CrossRef] [Scilit]
- Bulten, W.; Balkenhol, M.; Belinga, J.-J.A.; Brilhante, A.; Çakır, A.; Egevad, L.; Eklund, M.; Farré, X.; Geronatsiou, K.; Molinié, V.; et al. Artificial intelligence assistance significantly improves Gleason grading of prostate biopsies by pathologists. Mod. Pathol. 2021, 34, 660–671. [Google Scholar] [CrossRef] [Scilit]
- Graham, S.; Vu, Q.D.; Jahanifar, M.; Weigert, M.; Schmidt, U.; Zhang, W.; Zhang, J.; Yang, S.; Xiang, J.; Wang, X.; et al. CoNIC Challenge: Pushing the frontiers of nuclear detection, segmentation, classification and counting. Med. Image Anal. 2024, 92, 103047. [Google Scholar] [CrossRef] [Scilit]
- Tayebi, R.M.; Mu, Y.; Dehkharghanian, T.; Ross, C.; Sur, M.; Foley, R.; Tizhoosh, H.R.; Campbell, C.J.V. Automated bone marrow cytology using deep learning to generate a histogram of cell types. Commun. Med. 2022, 2, 45. [Google Scholar] [CrossRef] [Scilit]
- Kleppe, A.; Skrede, O.J.; De Raedt, S.; Liestøl, K.; Kerr, D.J.; Danielsen, H.E. Designing deep learning studies in cancer diagnostics. Nat. Rev. Cancer 2021, 21, 199–211. [Google Scholar] [CrossRef] [Scilit]
- Ogle, O.E. Odontogenic infections. Dent. Clin. N. Am. 2017, 61, 235–252. [Google Scholar] [CrossRef] [Scilit]
- Ferreira da Silva Junior, A.F.; de Magalhaes Rocha, G.S.; da Silva Neves de Araujo, C.F.; Franco, A.; Silva, R.F. Deep neck infection after third molar extraction: A case report. J. Dent. Res. Dent. Clin. Dent. Prospect. 2017, 11, 166–169. [Google Scholar] [CrossRef] [Scilit]
- Joshi, A.; Goel, M.; Thorat, A. Identifying the risk factors causing iatrogenic mandibular fractures associated with exodontia: A systemic meta-analysis of 200 cases from 1953 to 2015. Oral Maxillofac. Surg. 2016, 20, 391–396. [Google Scholar] [CrossRef] [Scilit]
- Allegranzi, B.; Bischoff, P.; de Jonge, S.; Kubilay, N.Z.; Zayed, B.; Gomes, S.M.; Abbas, M.; Atema, J.J.; Gans, S.; van Rijen, M.; et al. New WHO recommendations on preoperative measures for surgical site infection prevention: An evidence-based global perspective. Lancet Infect. Dis. 2016, 16, e276–e287. [Google Scholar] [CrossRef] [Scilit]
- Lodi, G.; Azzi, L.; Varoni, E.M.; Pentenero, M.; Del Fabbro, M.; Carrassi, A.; Sardella, A.; Manfredi, M. Antibiotics to prevent complications following tooth extractions. Cochrane Database Syst. Rev. 2021, 2, CD003811. [Google Scholar] [CrossRef] [Scilit]
- Al-Maawi, S.; Śmieszek-Wilczewska, J.; Neff, P.; Heselich, A.; Morawiec, T.; Wachol, K.; Ghanaati, S. Platelet-rich fibrin does not prevent a covered socket residuum in premolar and first molar extraction sockets: A three-dimensional CBCT analysis of a prospective randomized controlled trial. Preprints 2026, 2026110759. [Google Scholar] [CrossRef] [Scilit]
- Atieh, M.A.; Alsabeeha, N.H.; Payne, A.G.; Ali, S.; Faggion, C.M., Jr.; Esposito, M. Interventions for replacing missing teeth: Alveolar ridge preservation techniques for dental implant site development. Cochrane Database Syst. Rev. 2021, 4, CD010176. [Google Scholar] [CrossRef] [Scilit]
- Ruggiero, S.L.; Dodson, T.B.; Aghaloo, T.; Carlson, E.R.; Ward, B.B.; Kademani, D. American Association of Oral and Maxillofacial Surgeons’ position paper on medication-related osteonecrosis of the jaws. 2022 update. J. Oral Maxillofac. Surg. 2022, 80, 920–943. [Google Scholar] [CrossRef] [Scilit]
- Yarom, N.; Shapiro, C.L.; Peterson, D.E.; Van Poznak, C.H.; Bohlke, K.; Ruggiero, S.L.; Migliorati, C.A.; Khan, A.; Morrison, A.; Anderson, H.; et al. Medication-related osteonecrosis of the jaw: MASCC/ISOO/ASCO clinical practice guideline. J. Clin. Oncol. 2019, 37, 2270–2290. [Google Scholar] [CrossRef] [Scilit]
- Gaêta-Araujo, H.; Ferreira Leite, A.; de Faria Vasconcelos, K.; Coropciuc, R.; Politis, C.; Jacobs, R.; Oliveira-Santos, C. Why do some extraction sites develop medication-related osteonecrosis of the jaw and others do not? A within-patient study assessing radiographic predictors. Int. J. Oral Implantol. 2021, 14, 87–98. [Google Scholar]
- Moreno-Rabié, C.; Lapauw, L.; Gaêta-Araujo, H.; Ferreira-Leite, A.; Coucke, W.; Wyngaert, T.V.D.; Jacobs, R. Radiographic predictors for MRONJ in oncologic patients undergoing tooth extraction. Sci. Rep. 2022, 12, 11280. [Google Scholar] [CrossRef] [Scilit]
- Kassolis, J.D.; Scheper, M.A.; Jham, B.C.; Reynolds, M.A. Histopathologic findings in bone from edentulous alveolar ridges: A role in osteonecrosis of the jaws? Bone 2010, 47, 127–130. [Google Scholar] [CrossRef] [Scilit]
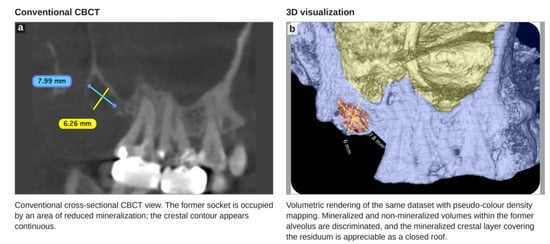
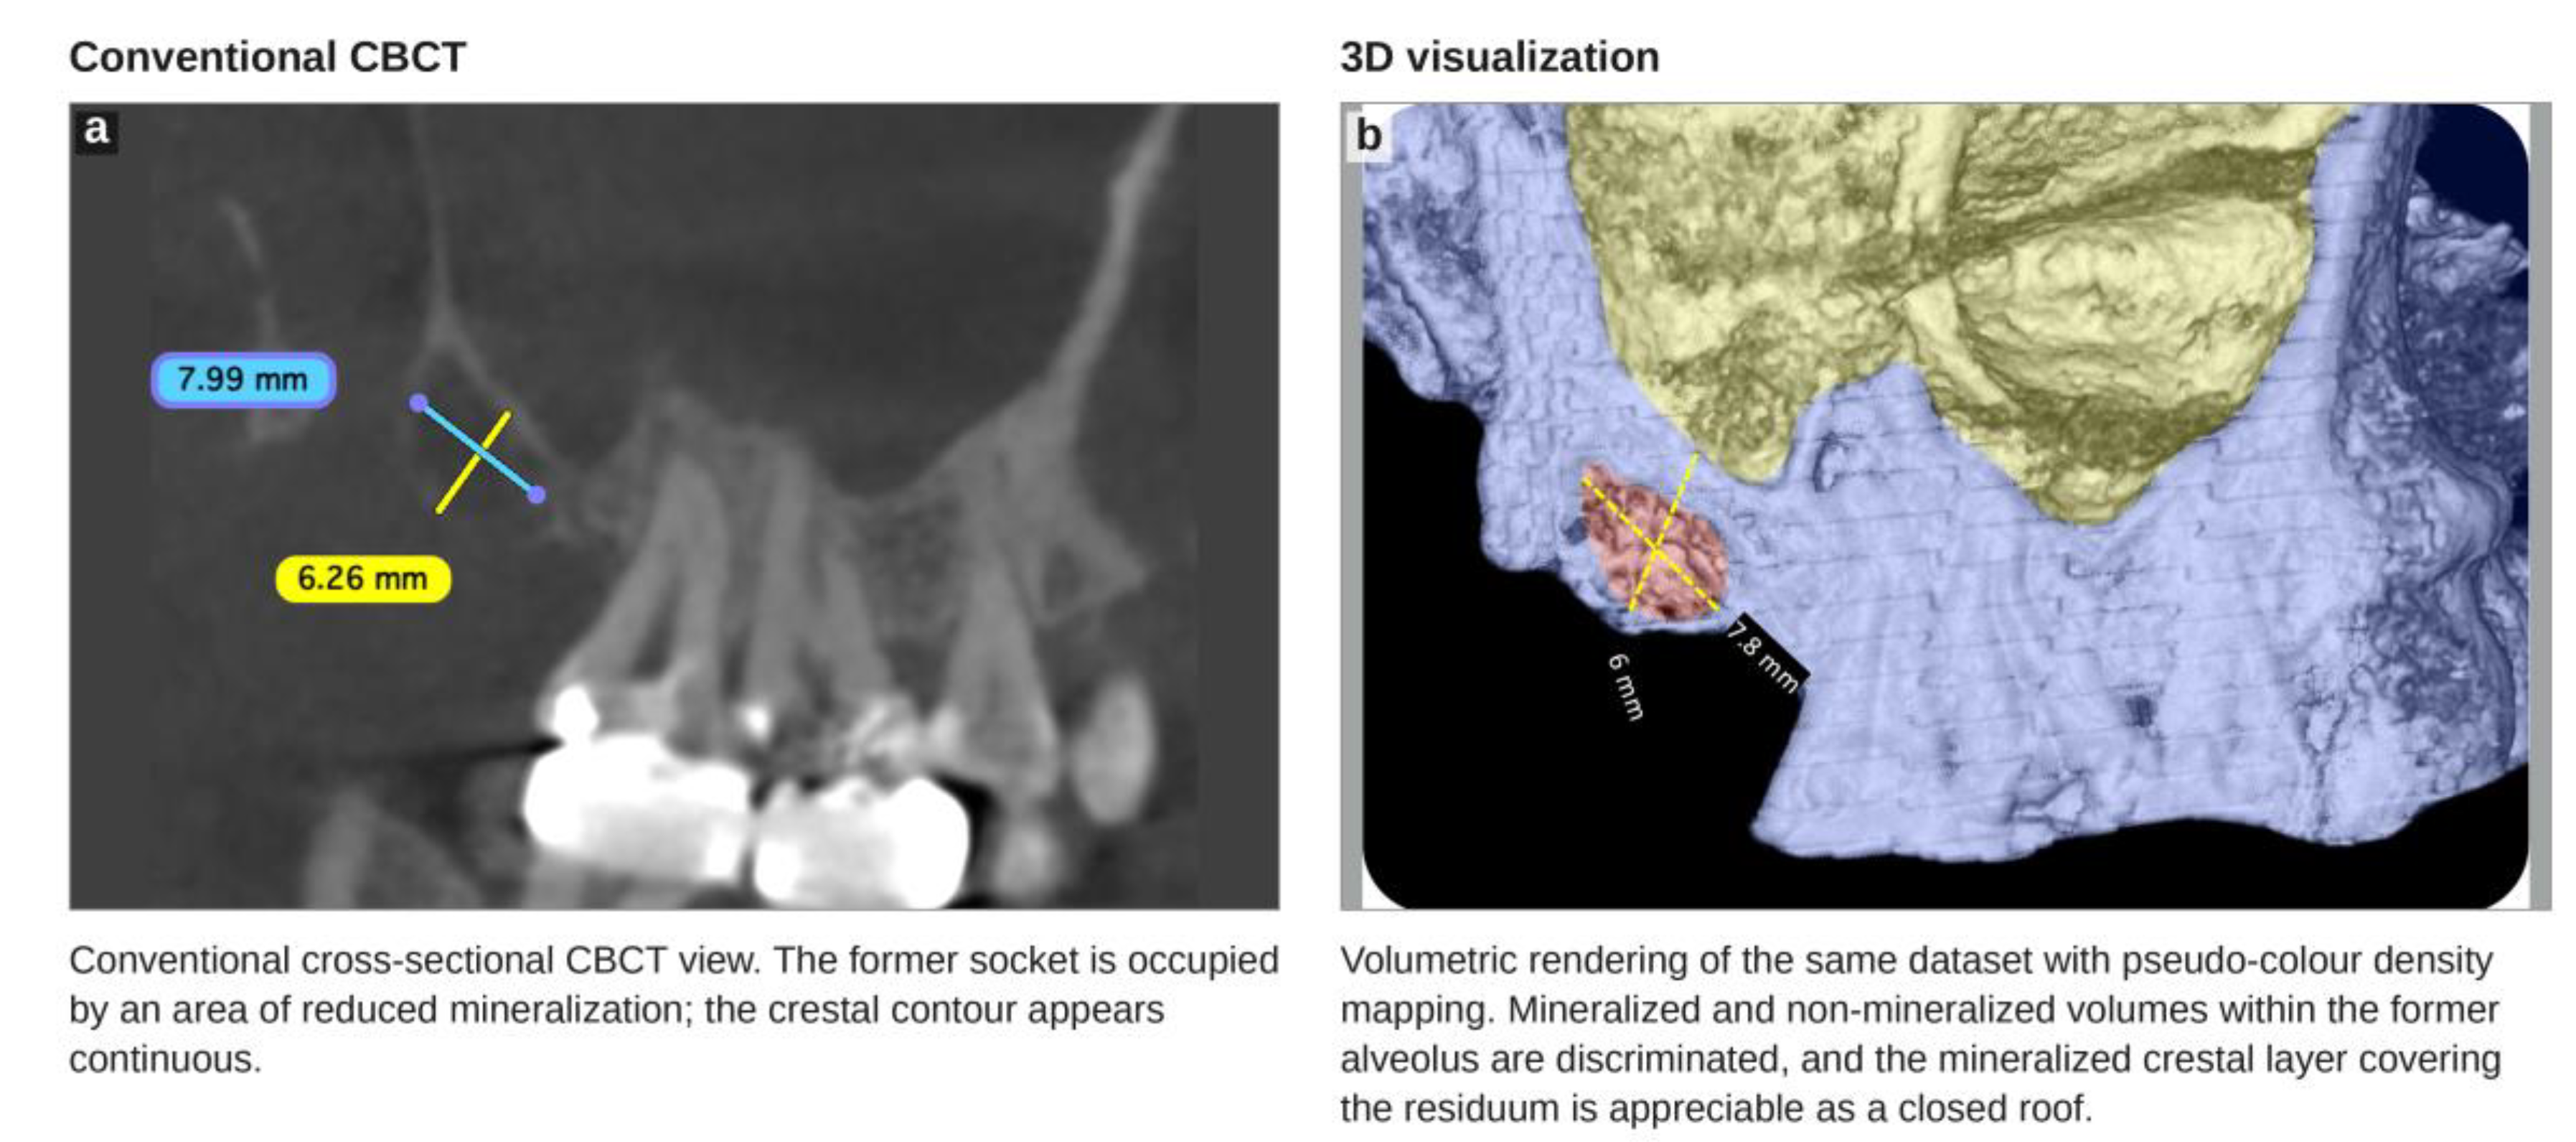
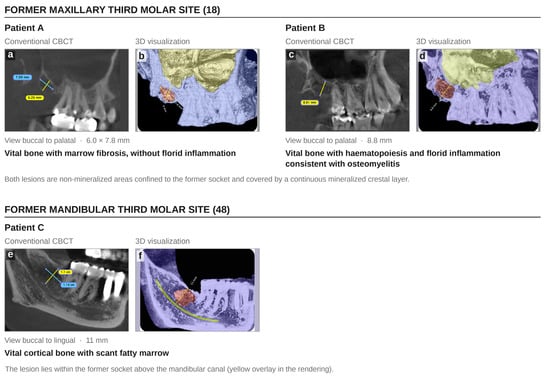
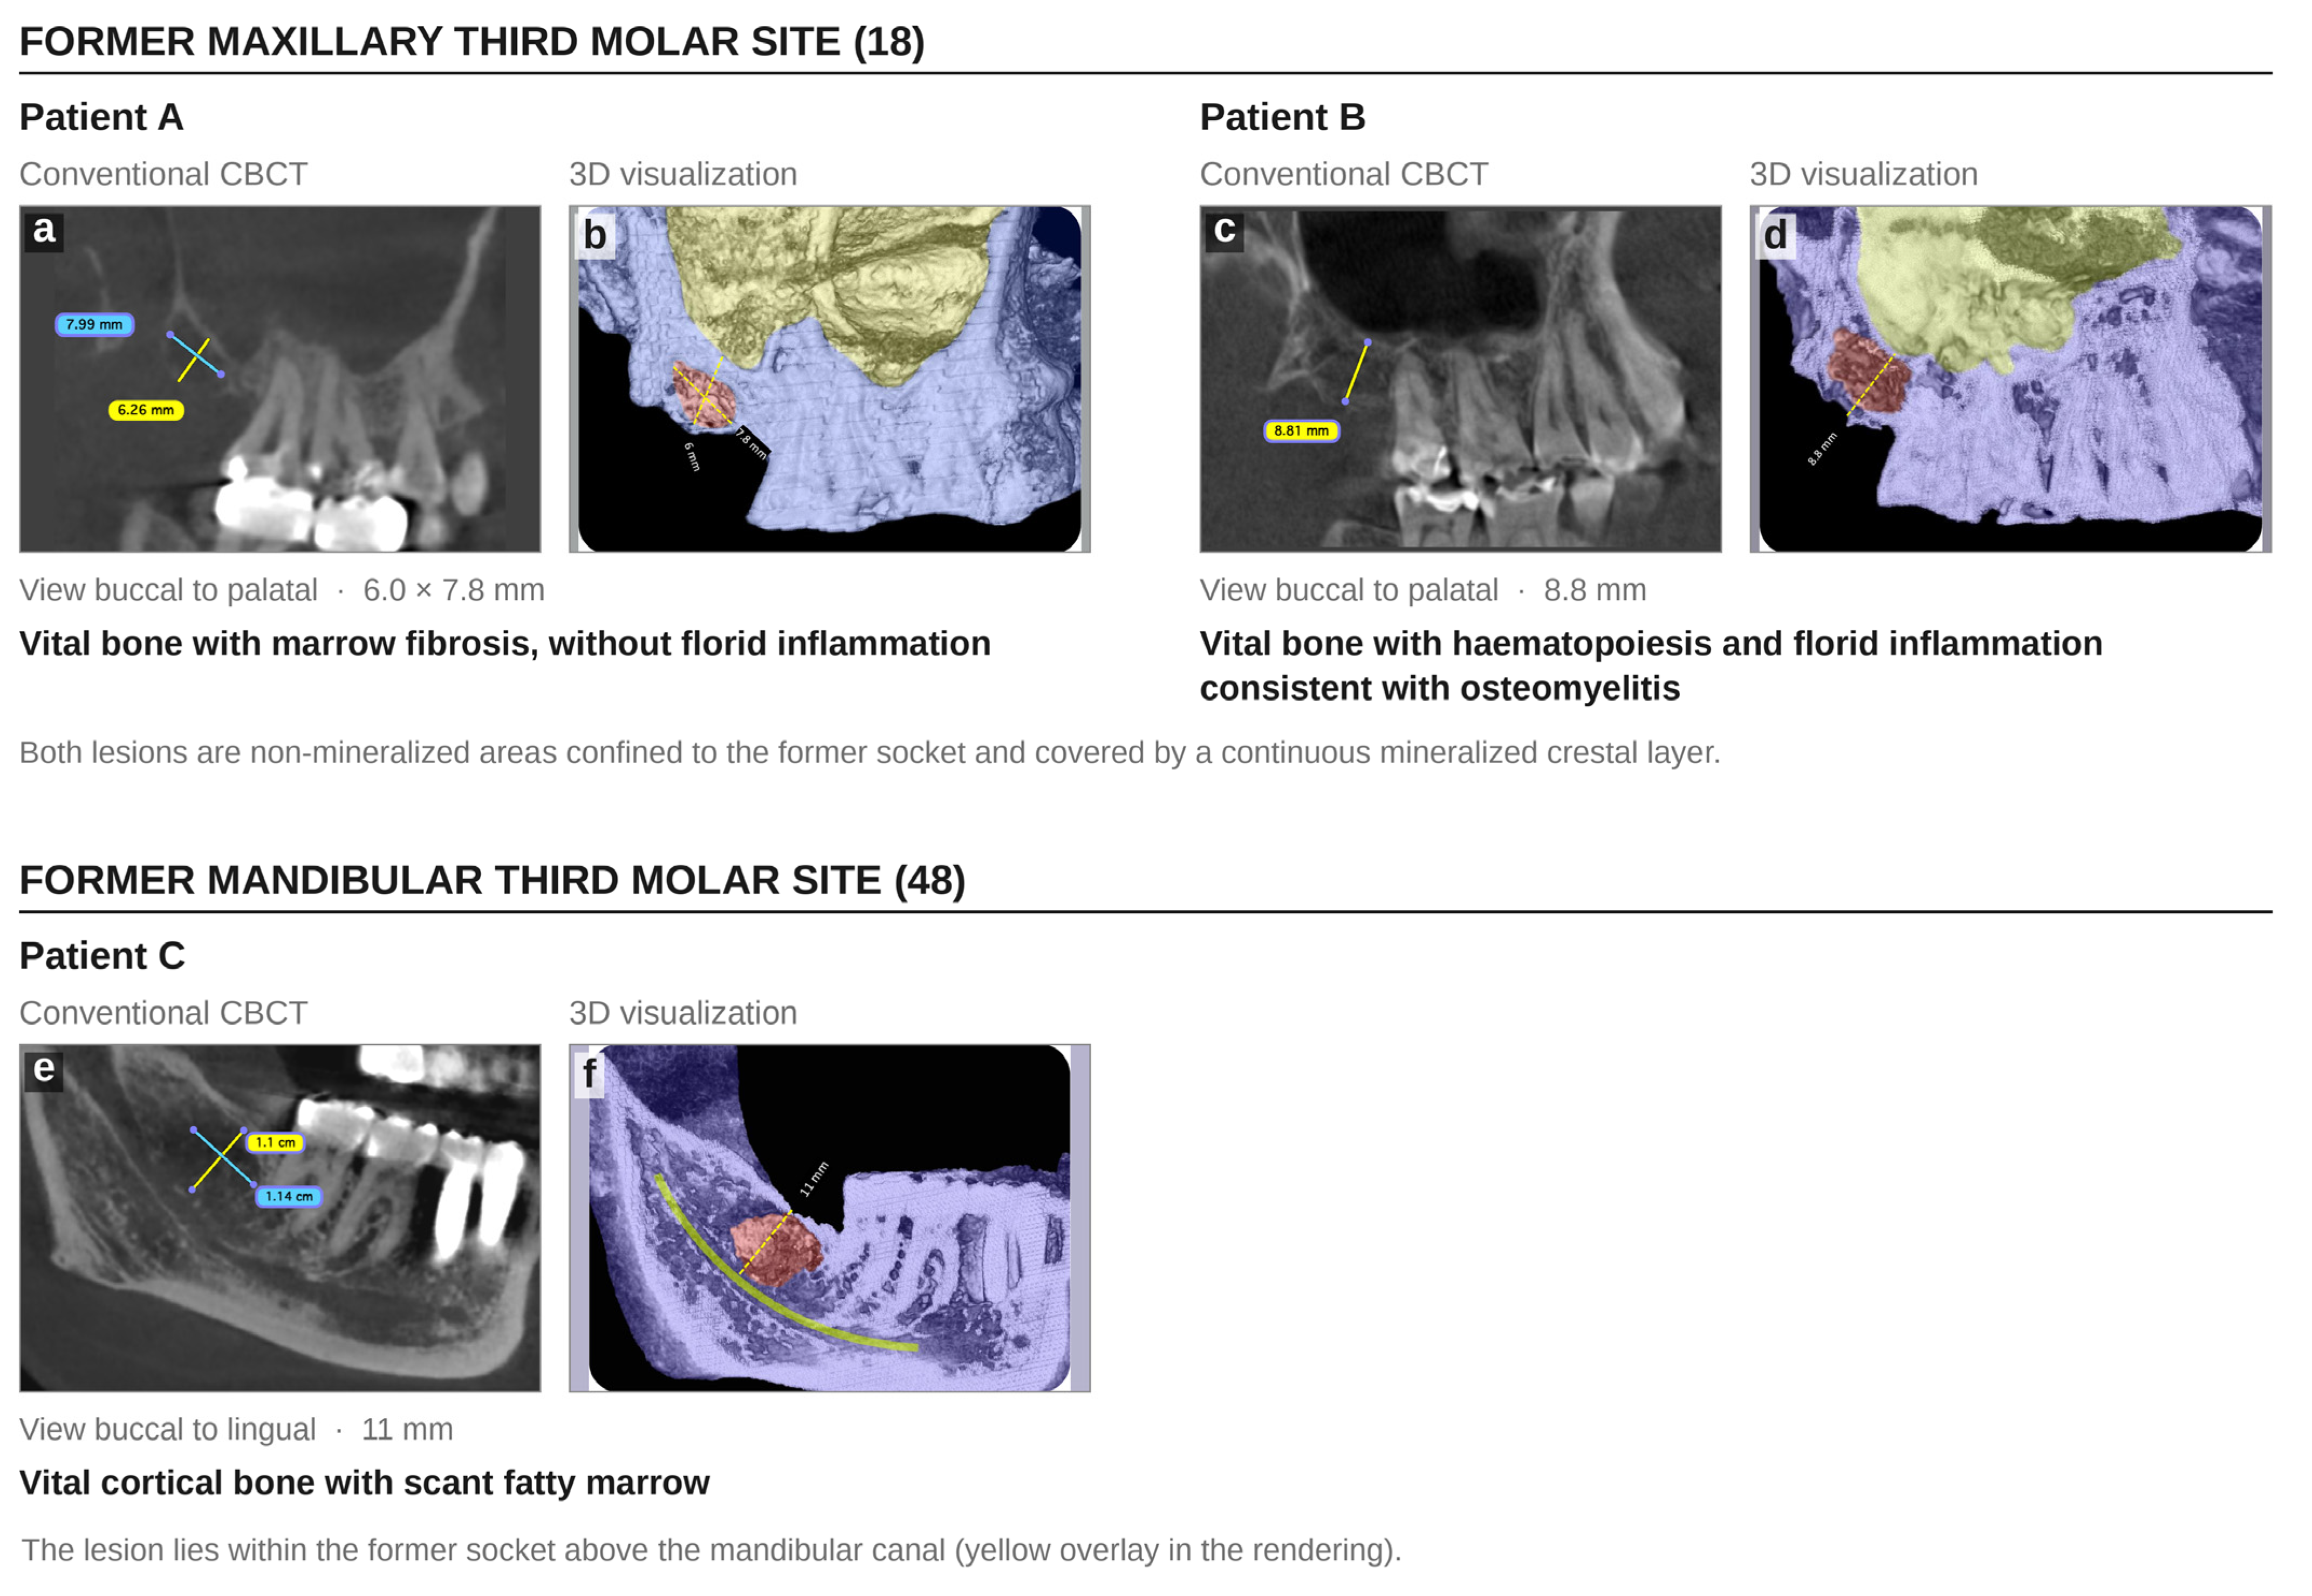
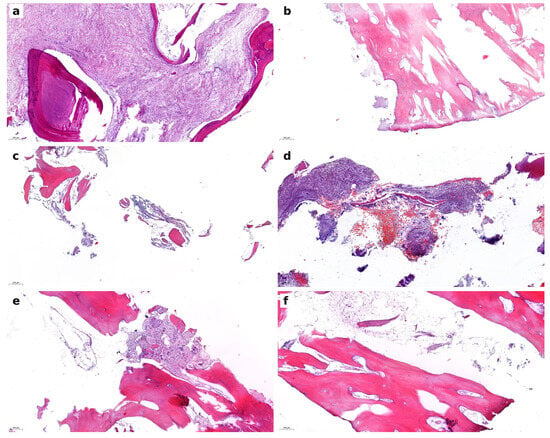
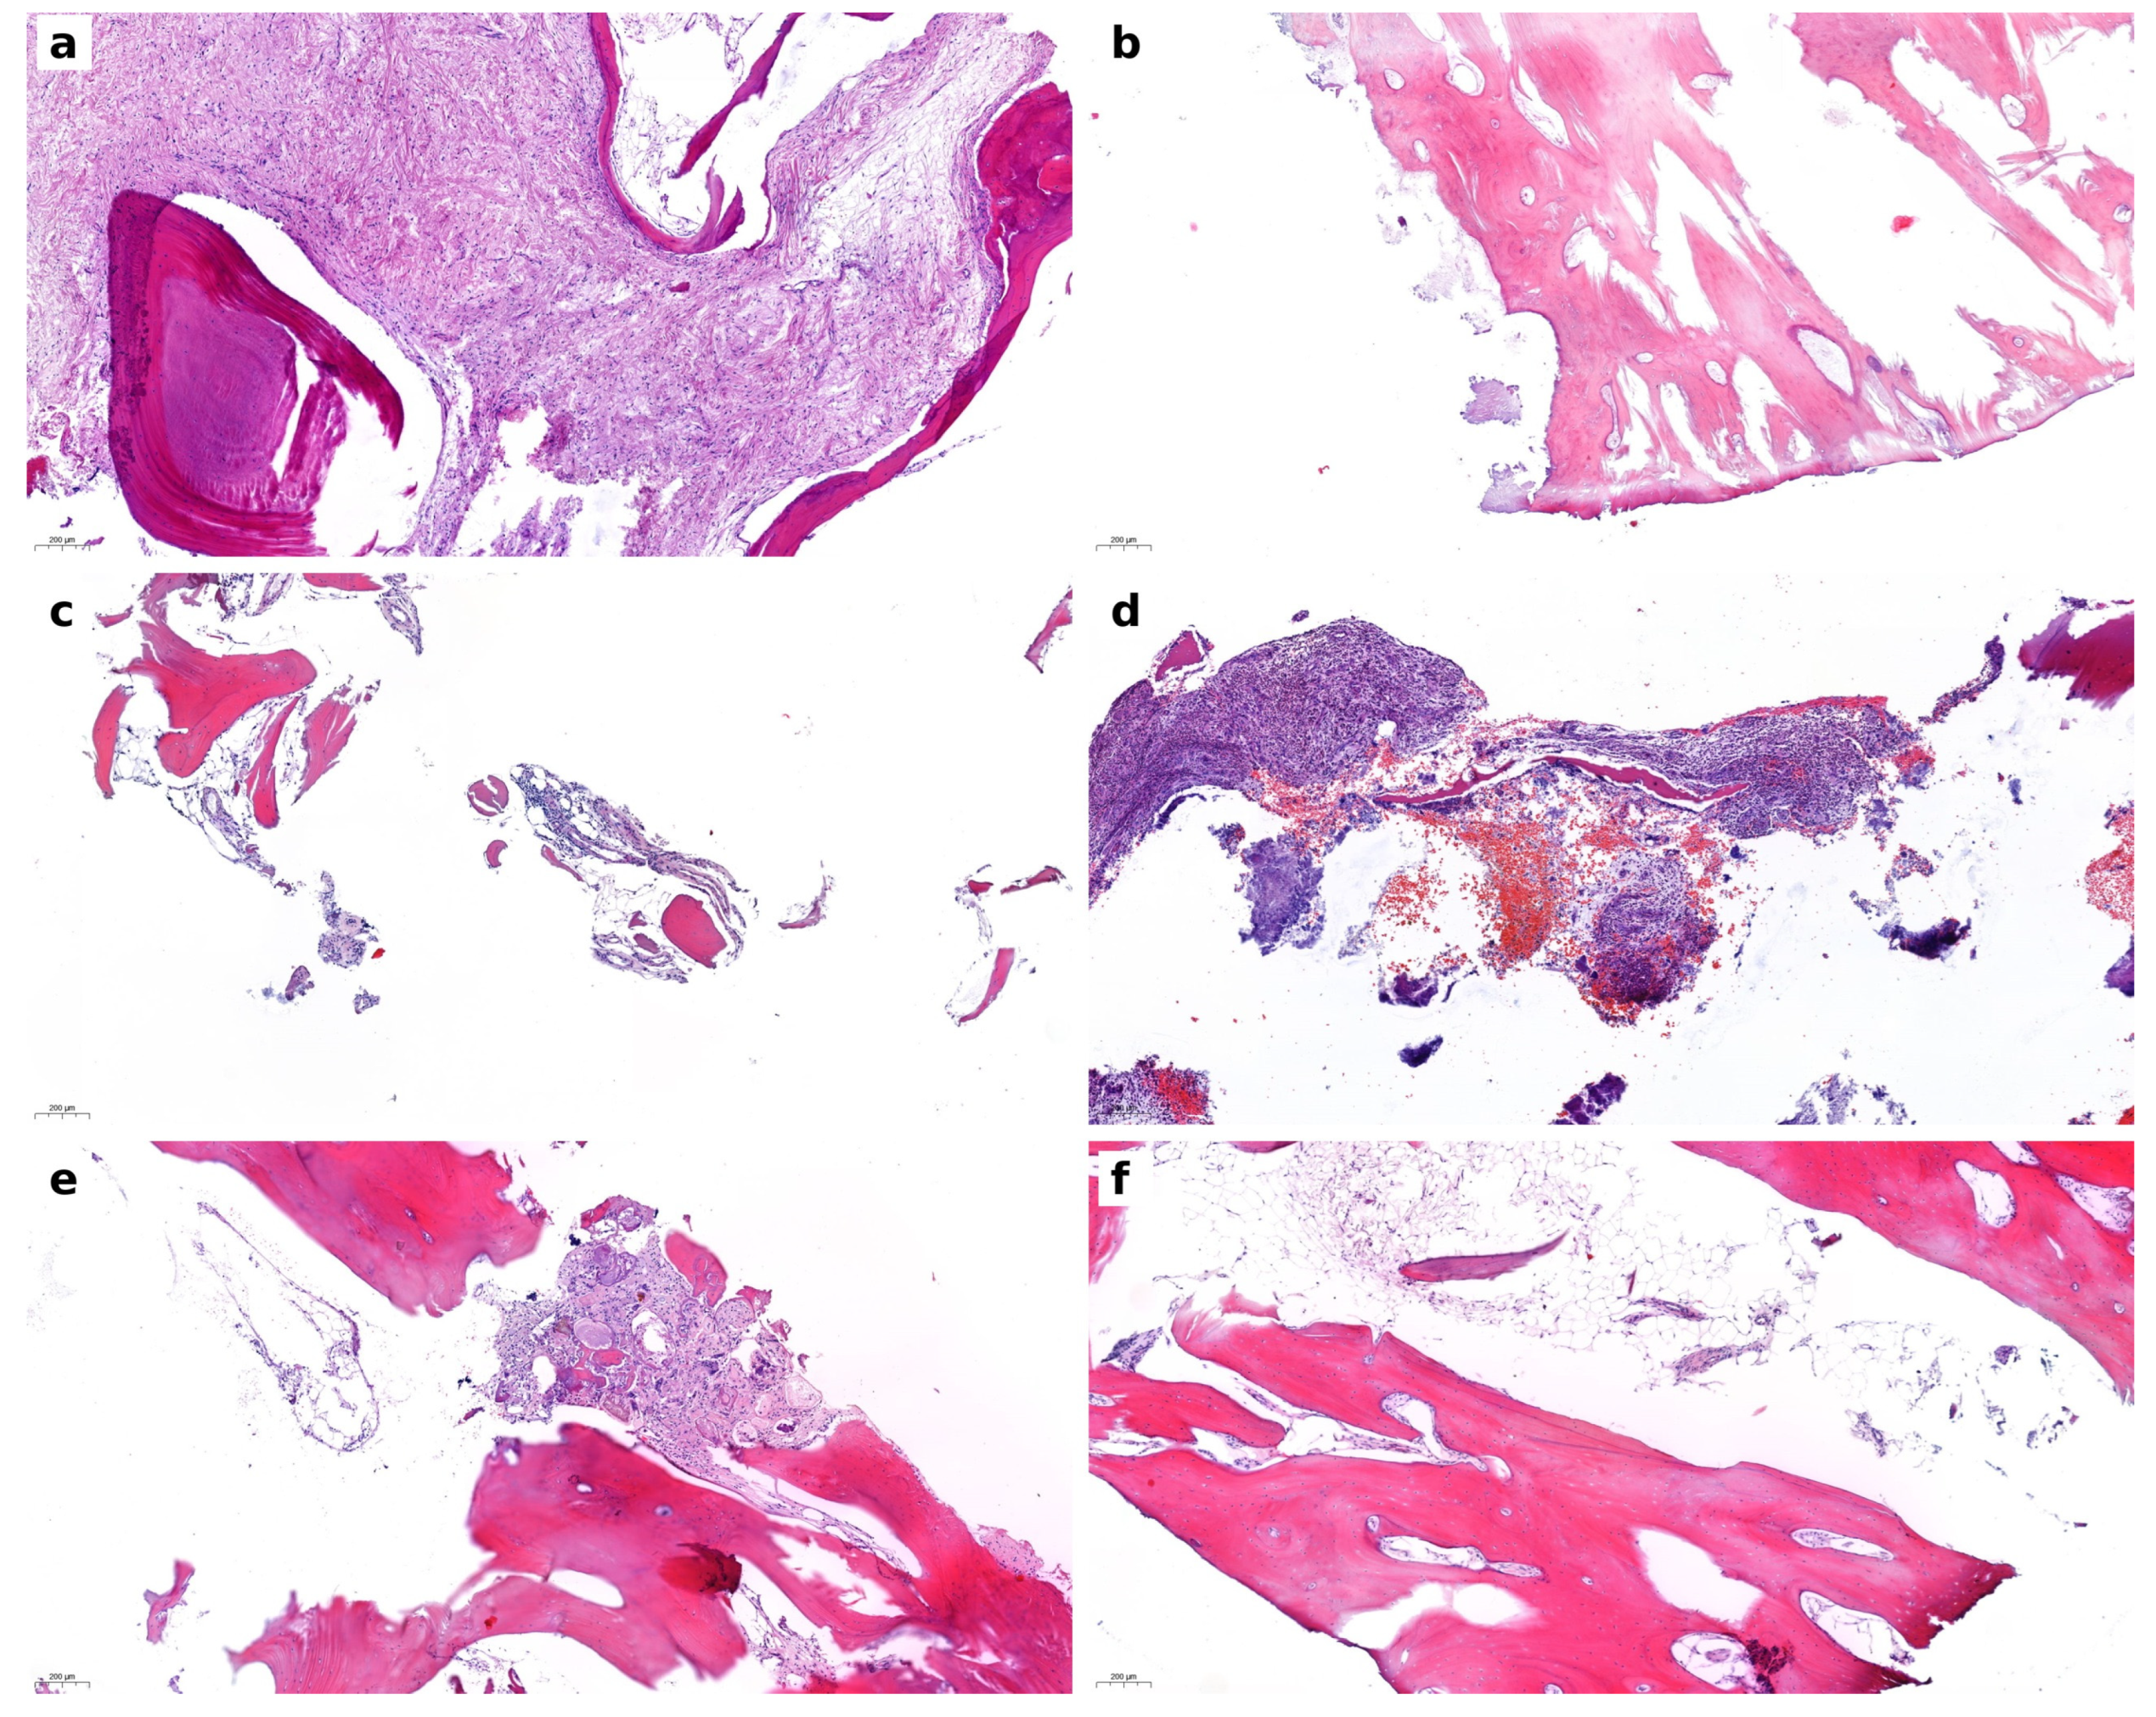
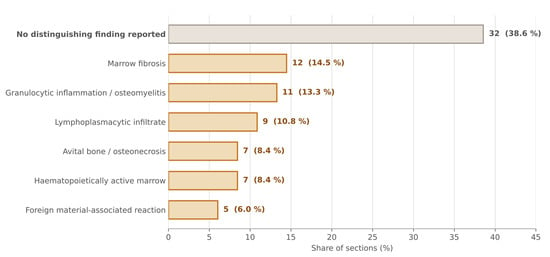
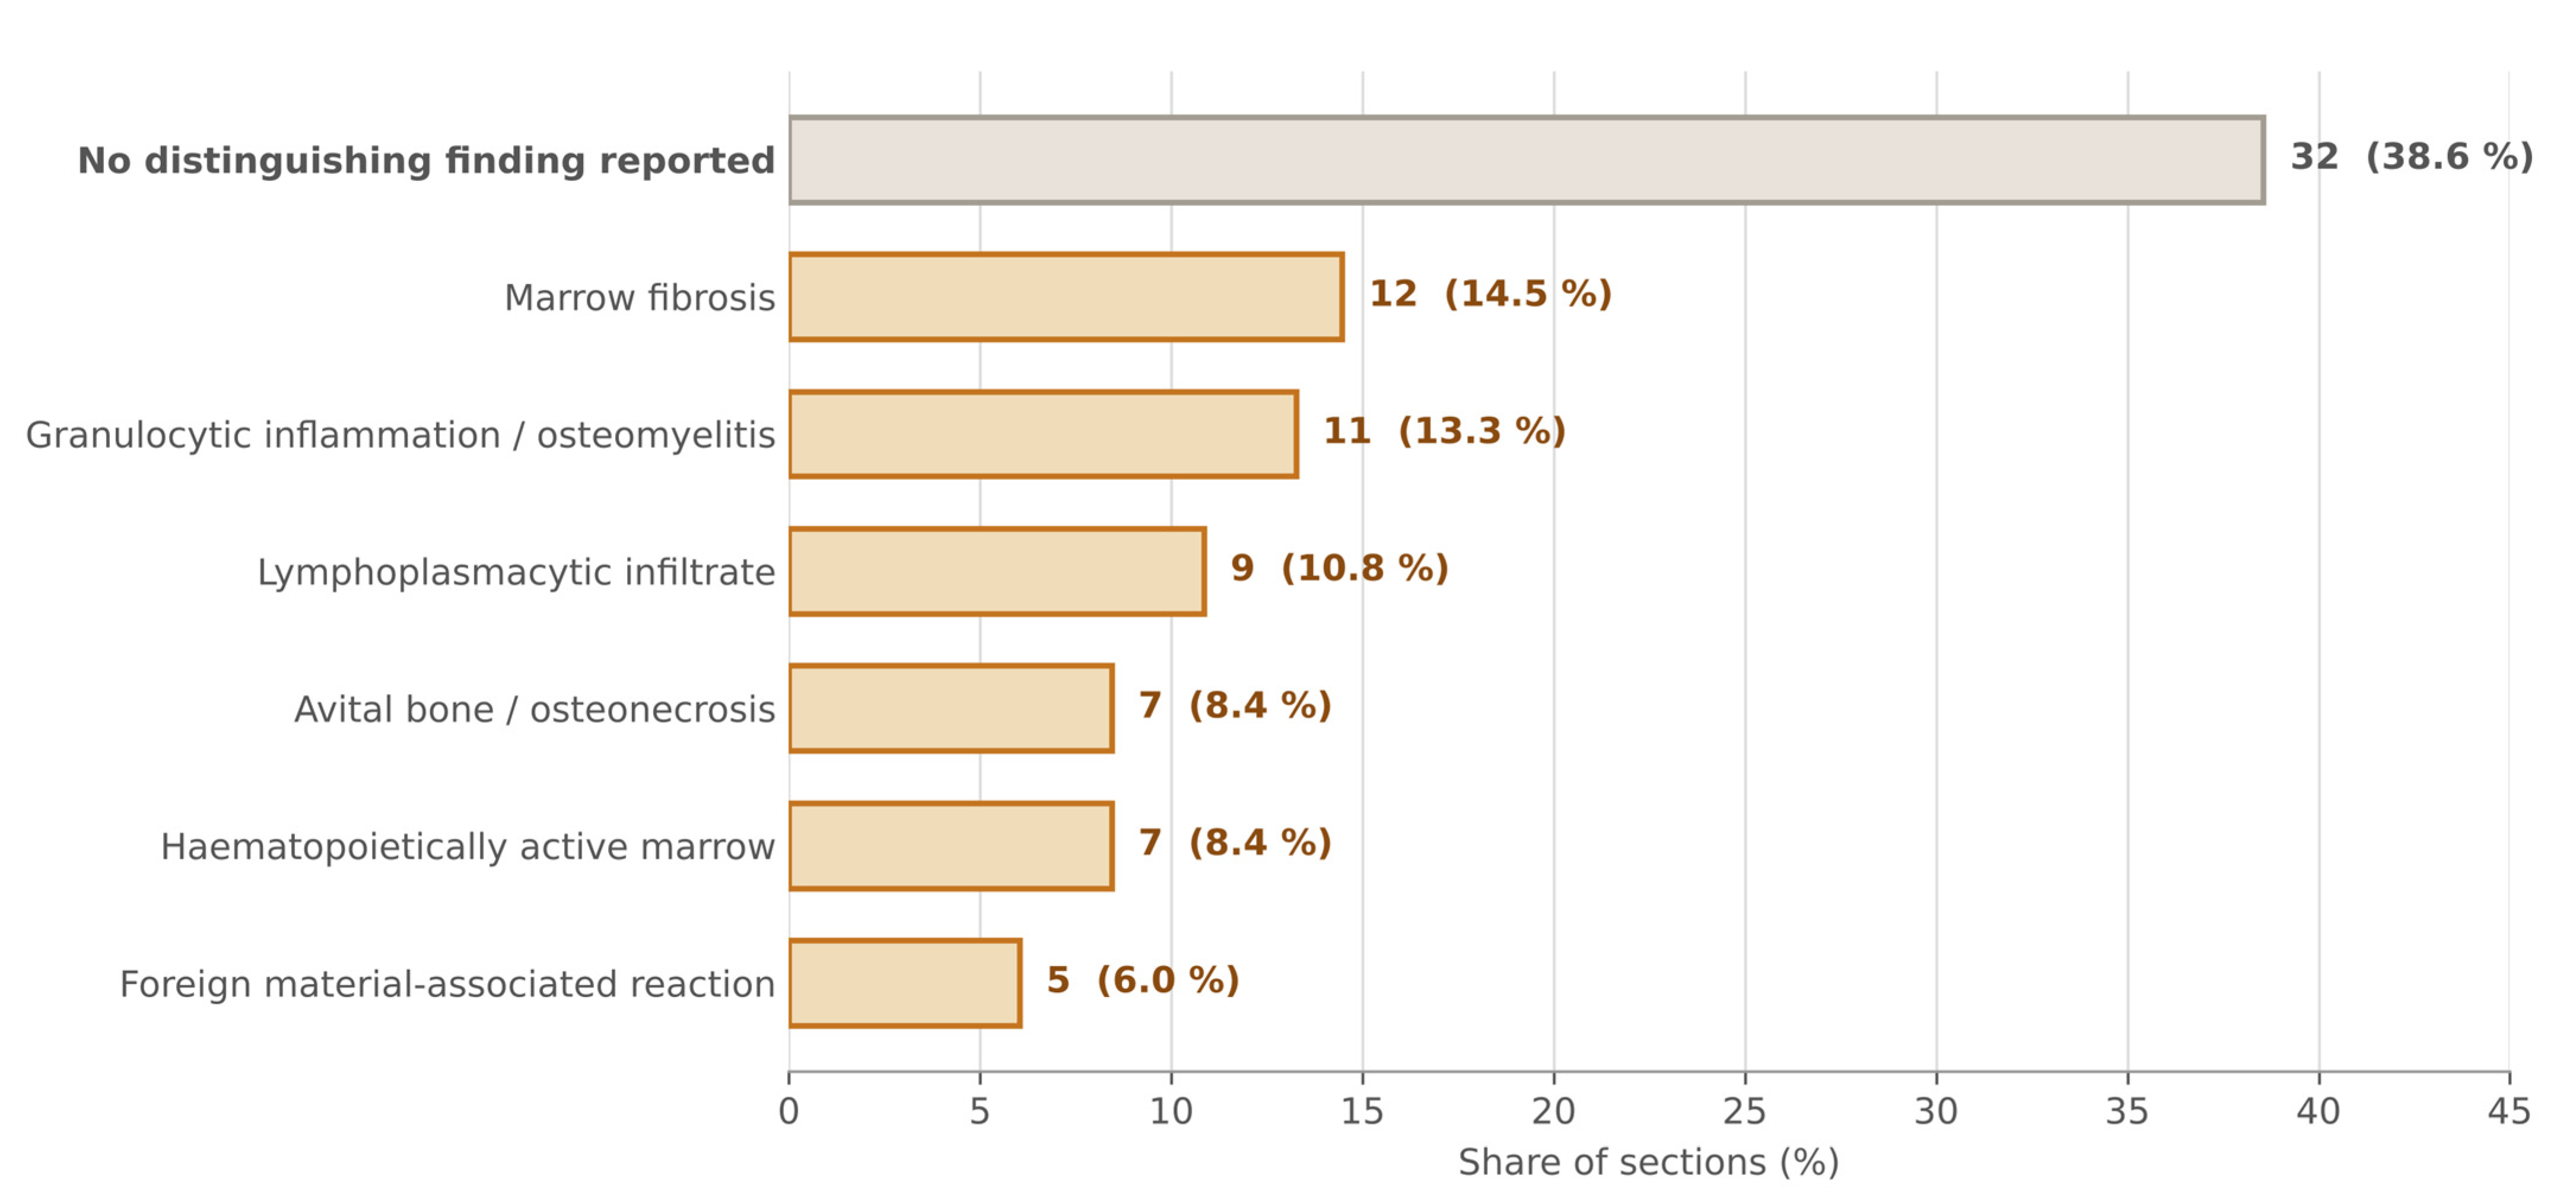
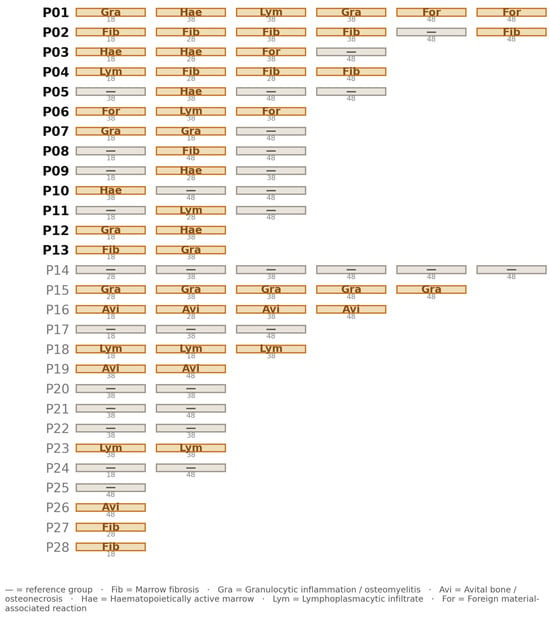
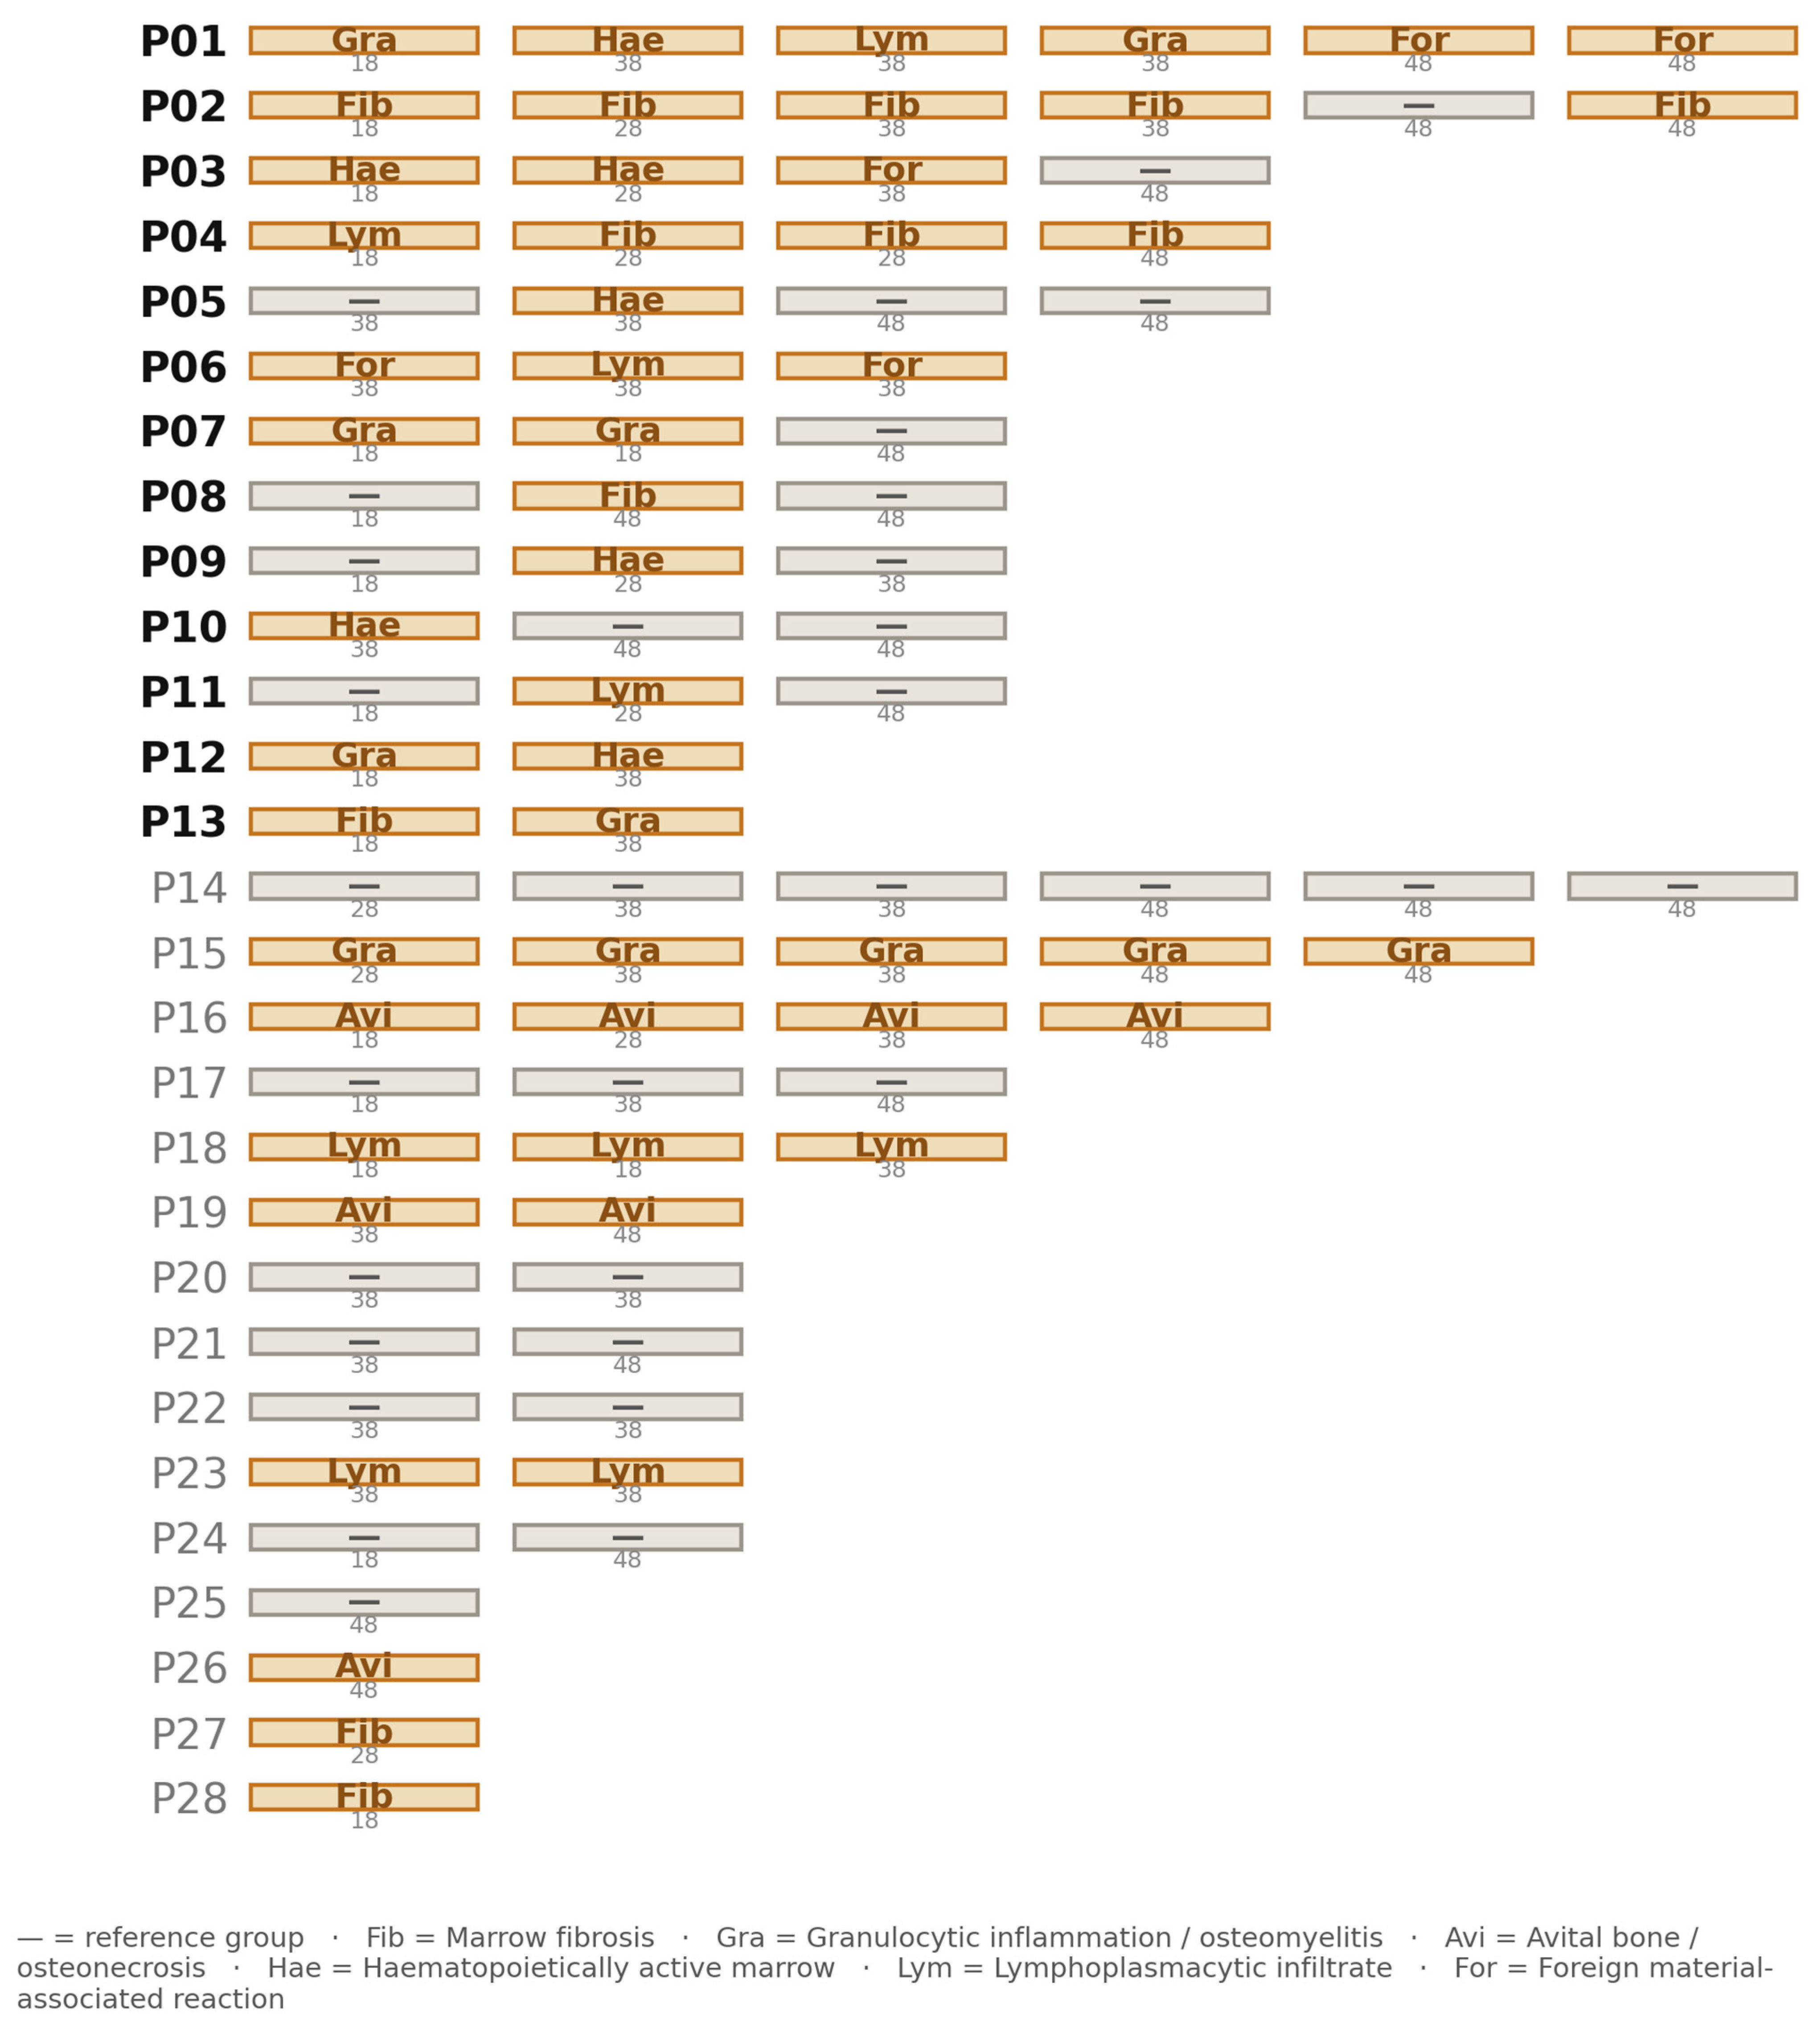
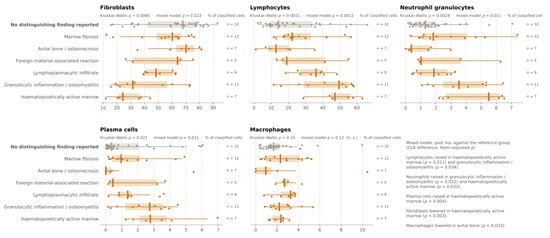
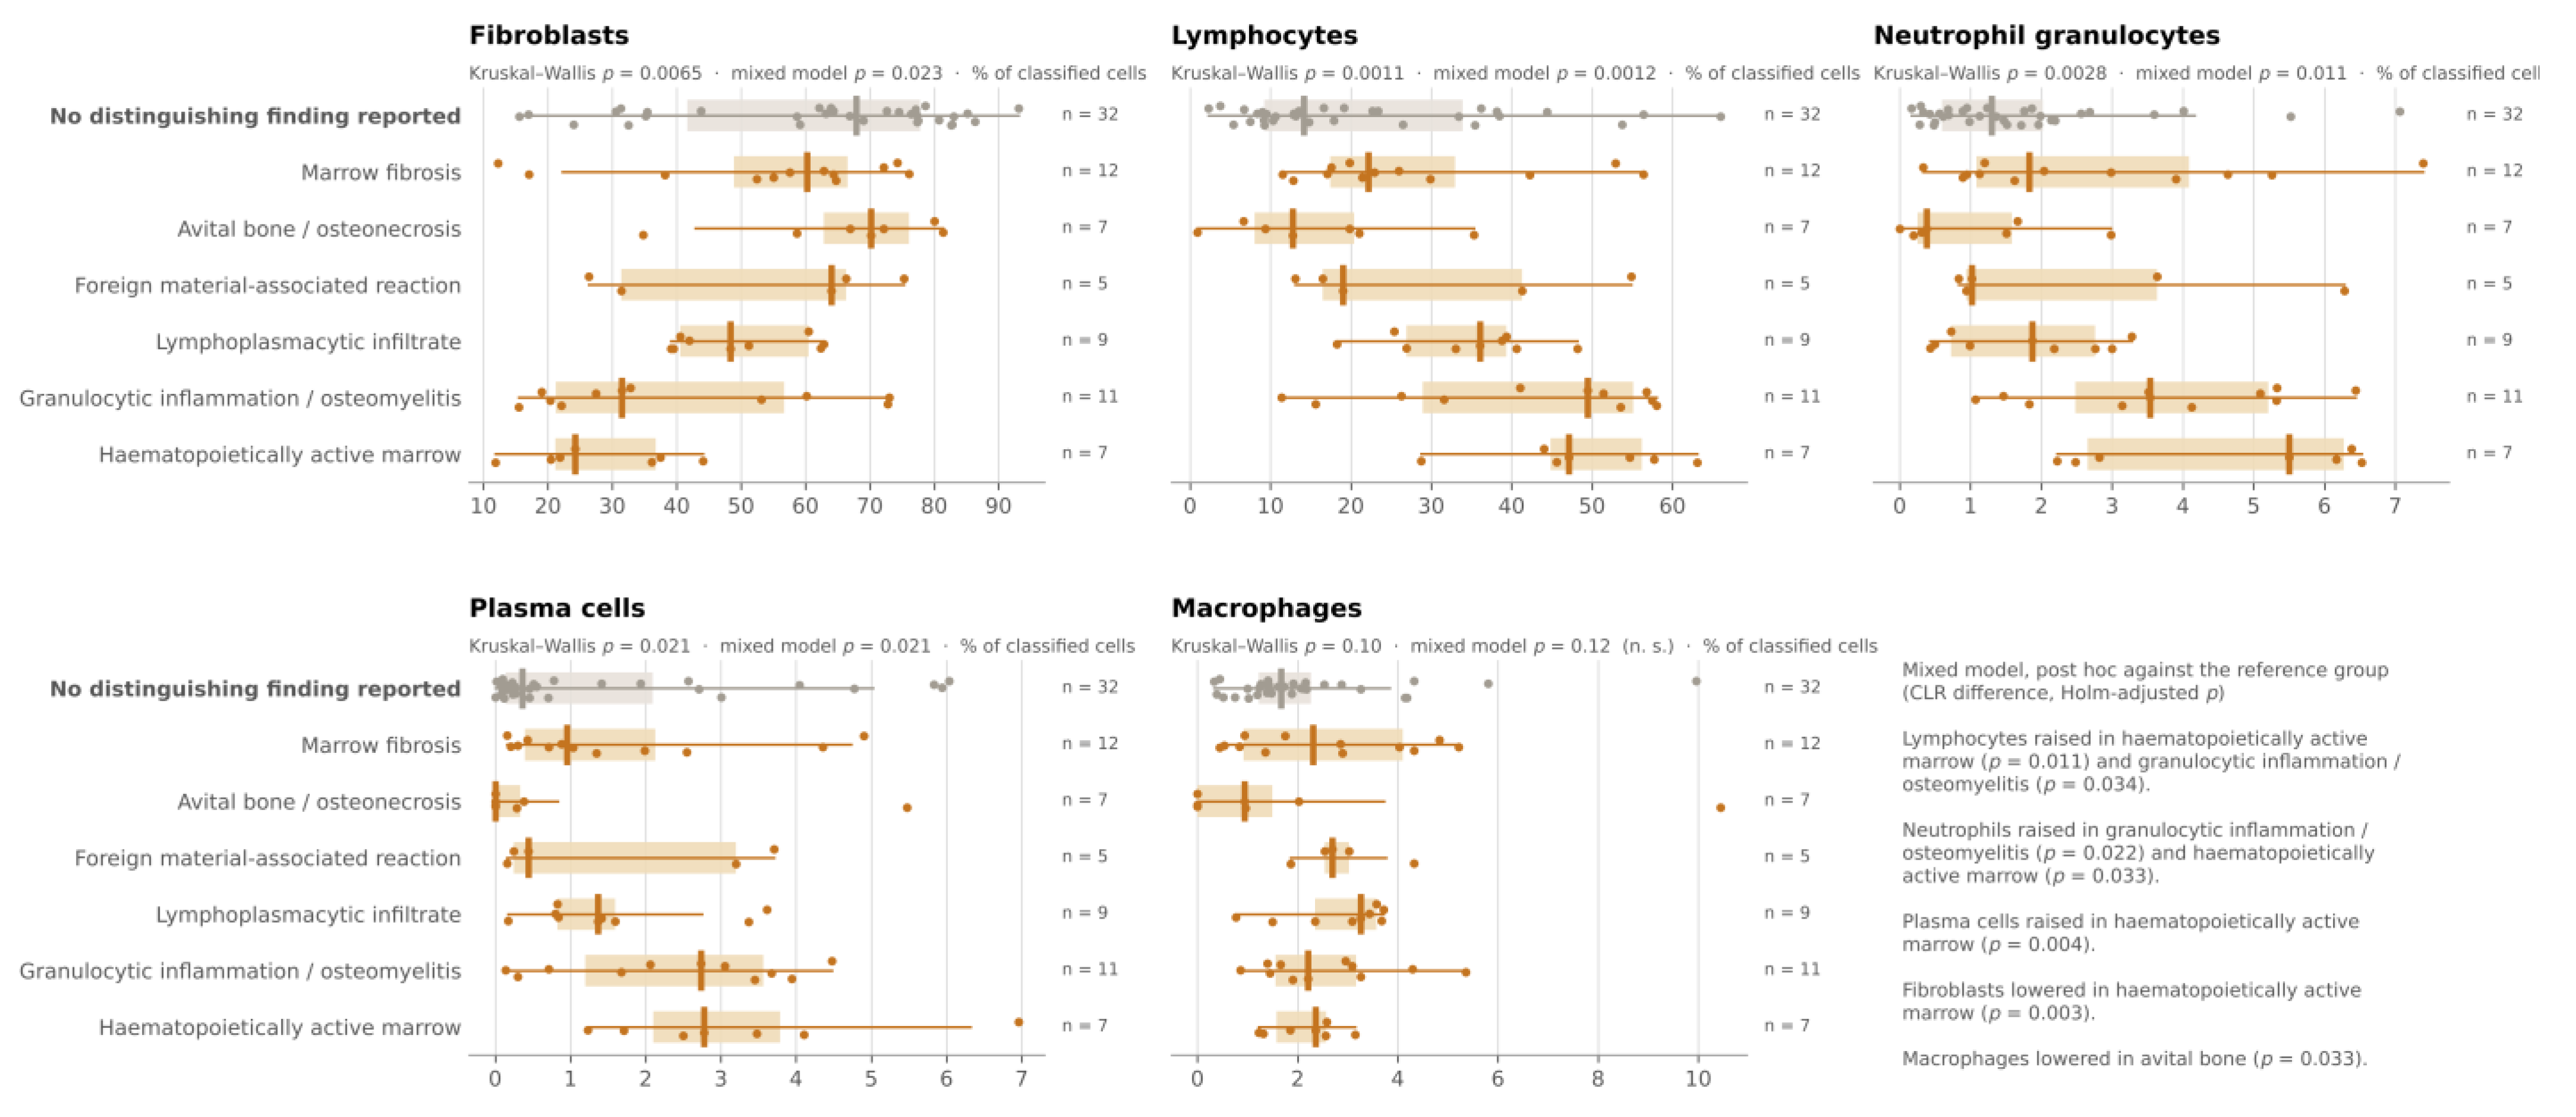
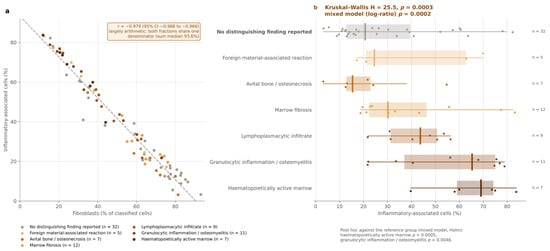
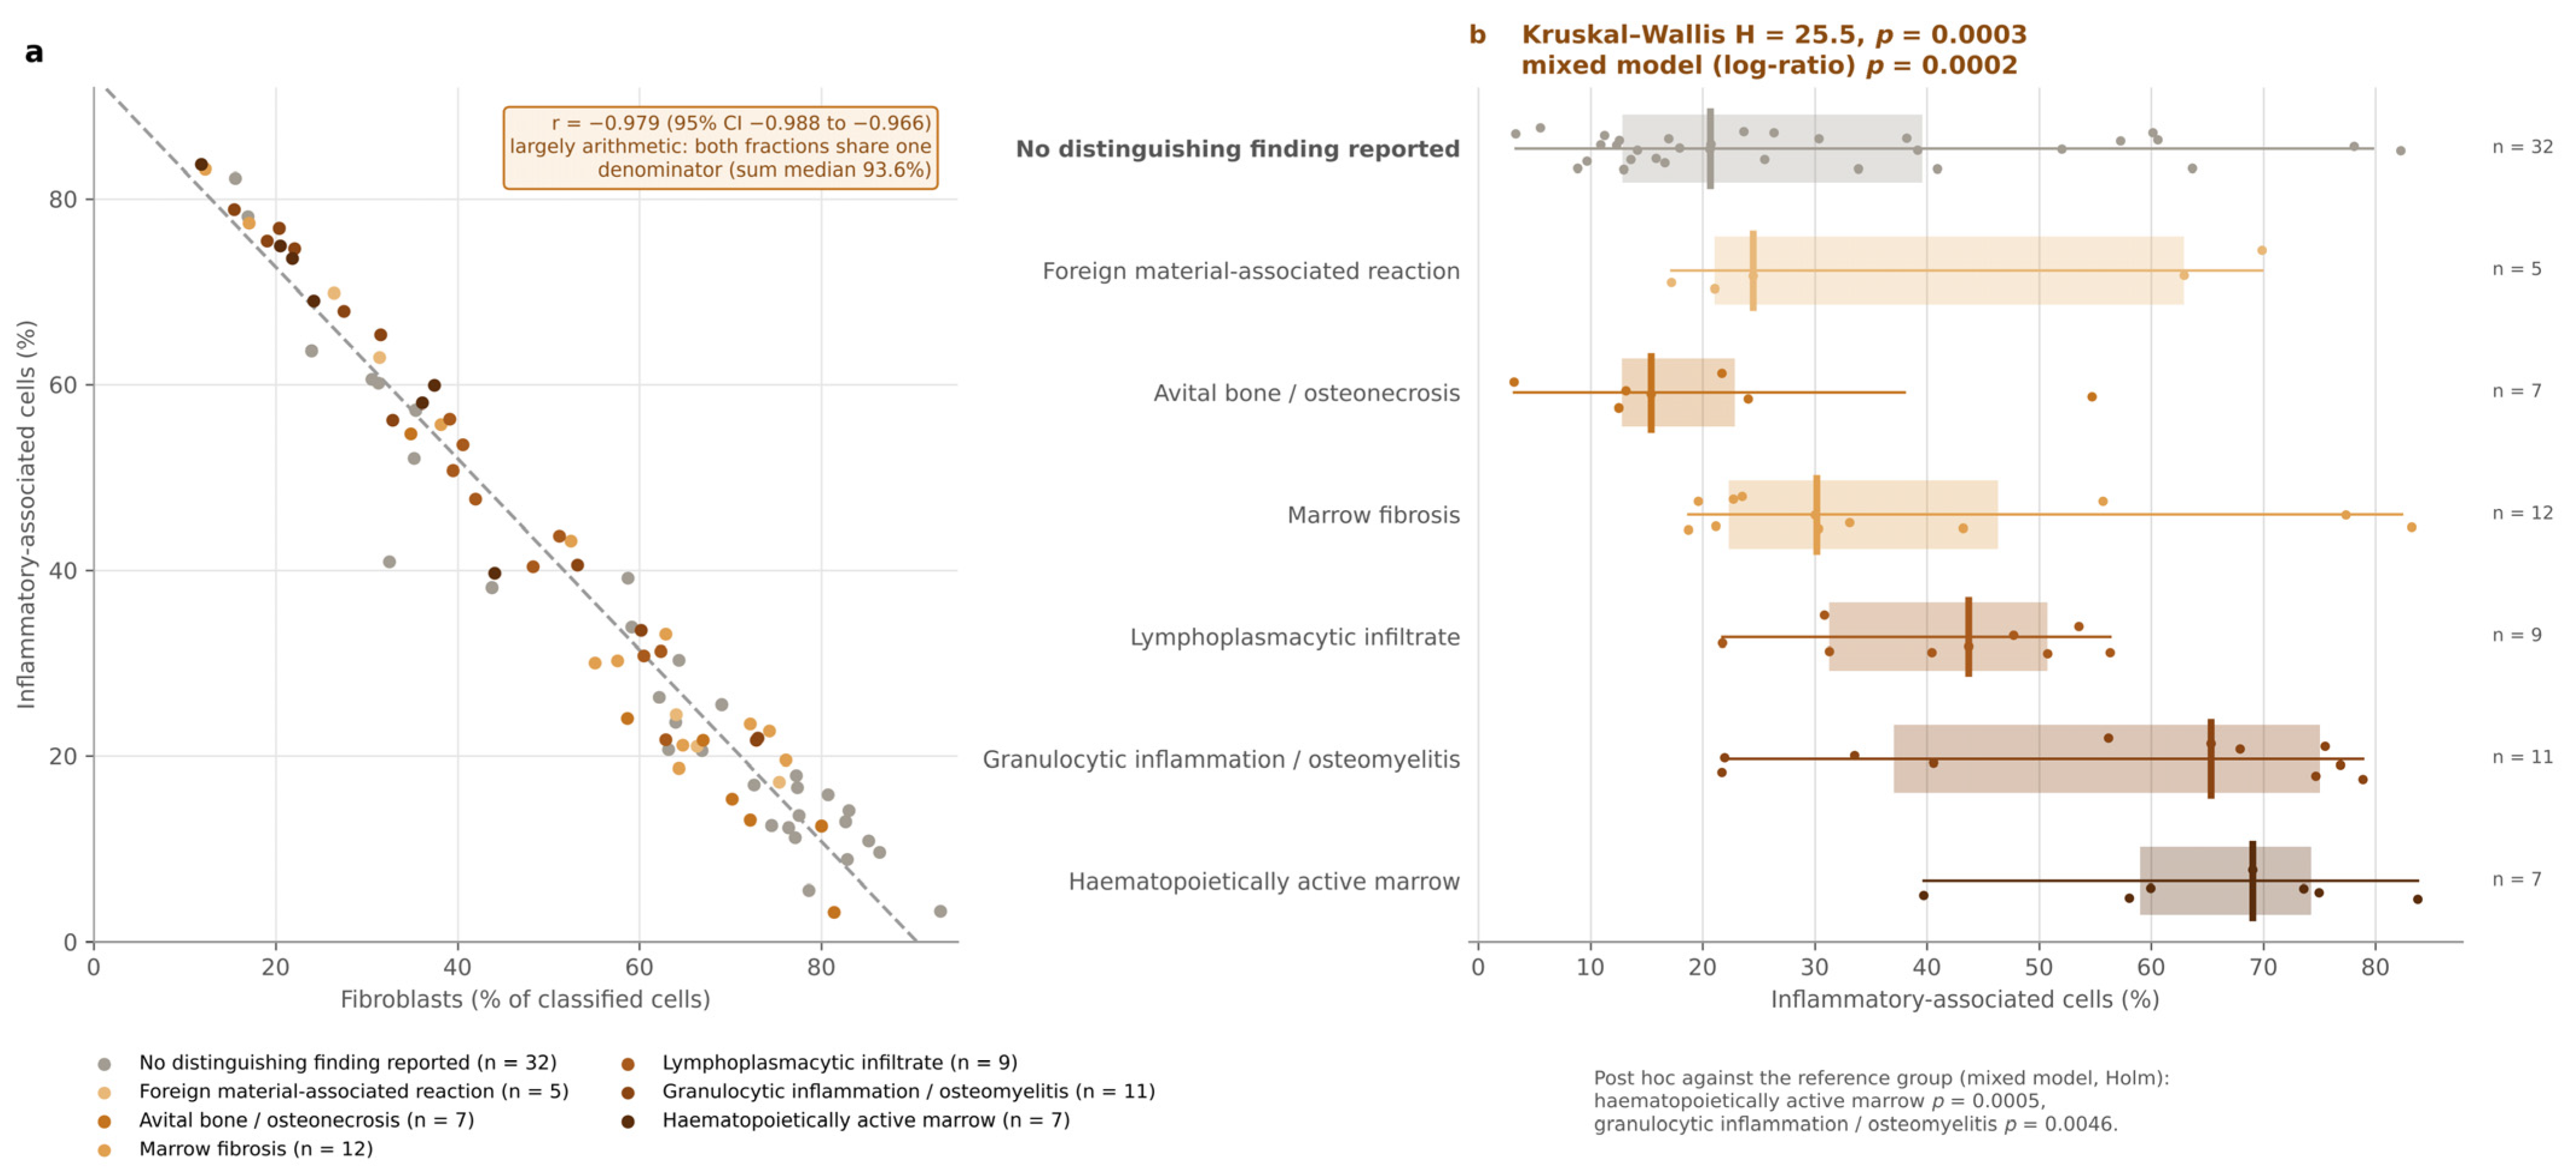
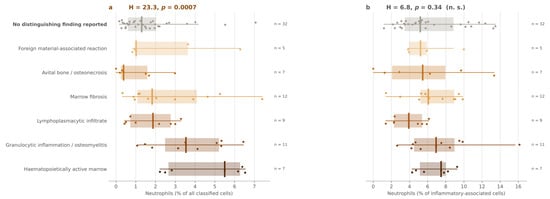
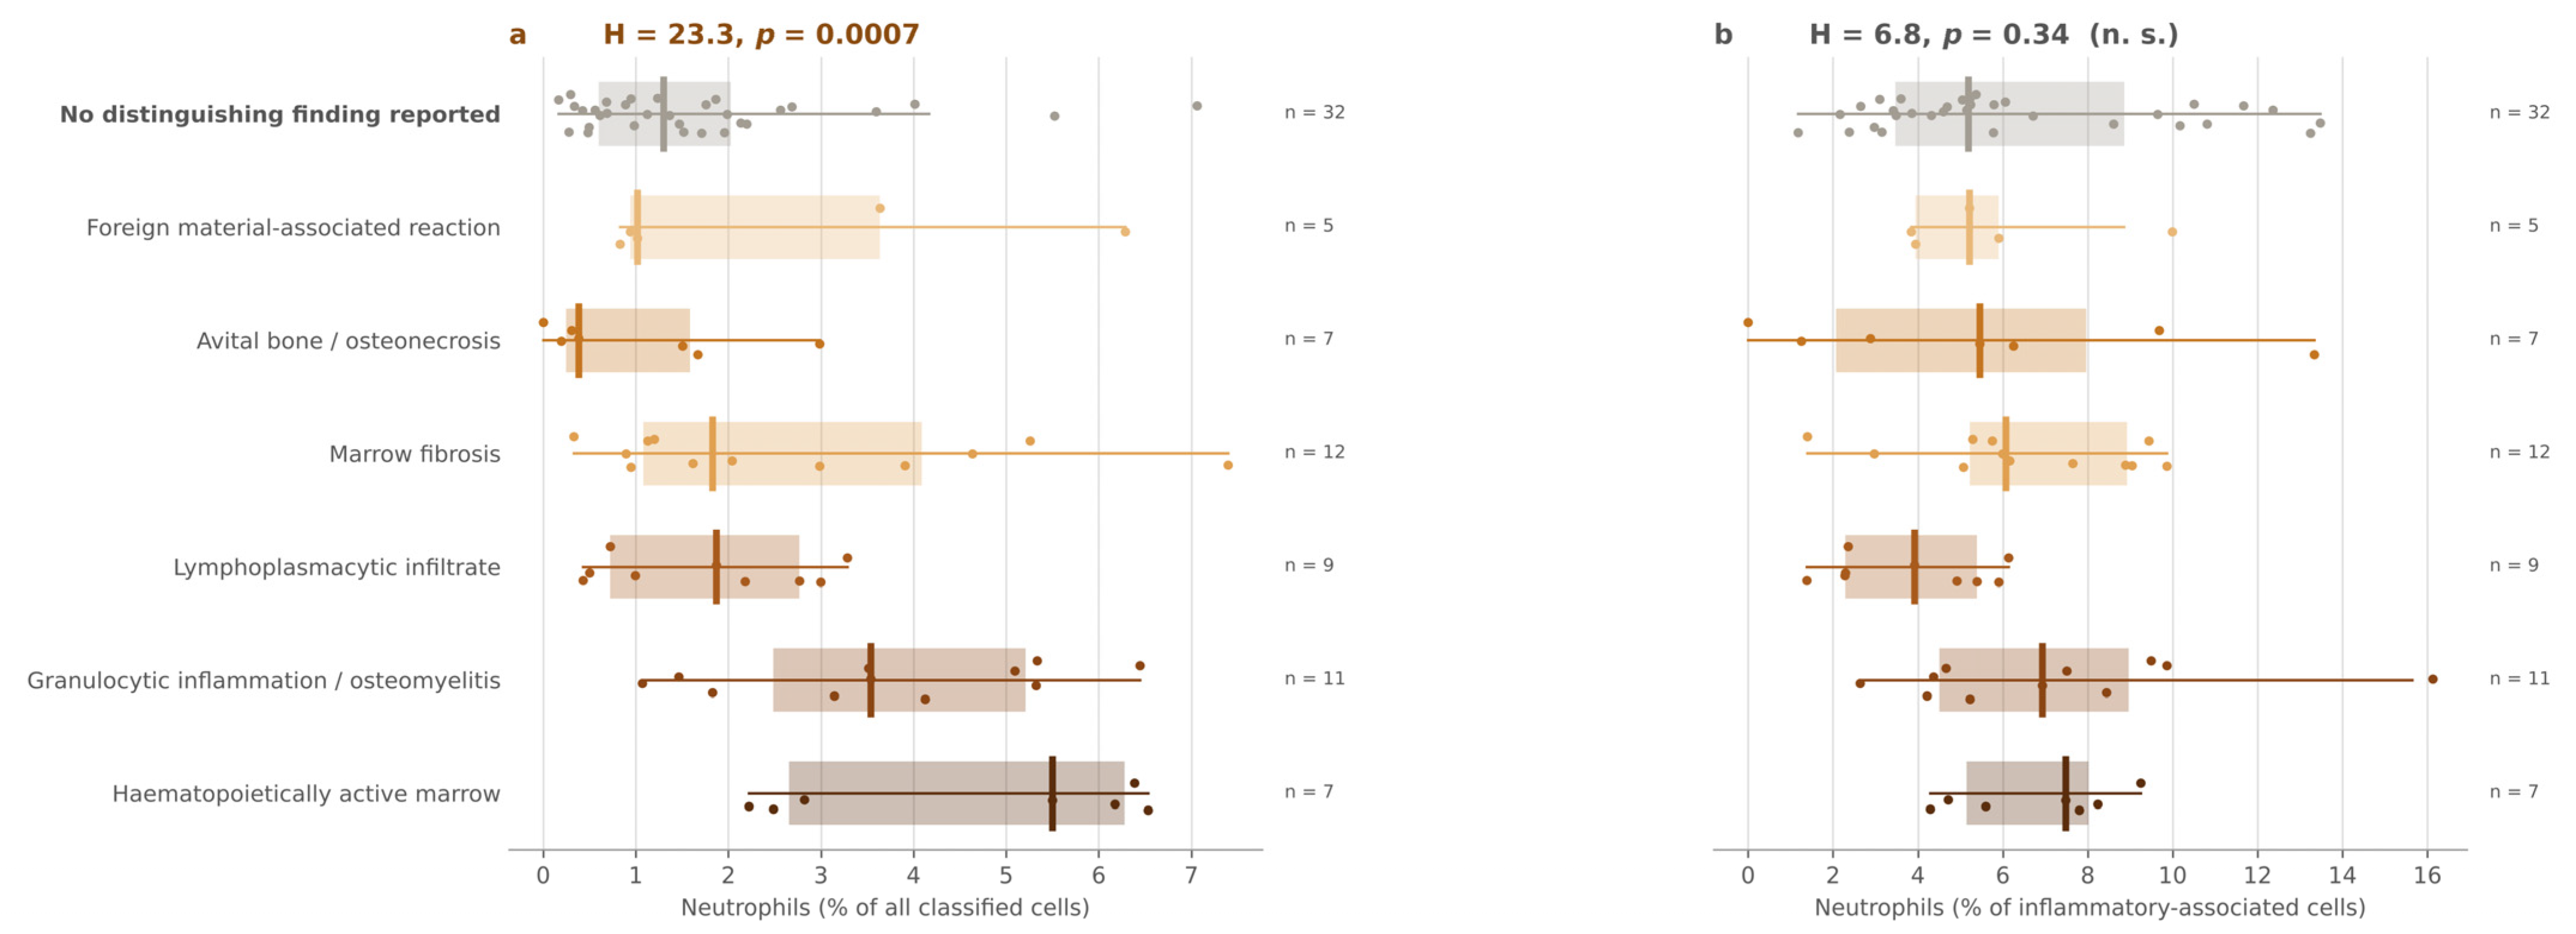

Disclaimer/Publisher’s Note: The statements, opinions and data contained in all publications are solely those of the individual author(s) and contributor(s) and not of MDPI and/or the editor(s). MDPI and/or the editor(s) disclaim responsibility for any injury to people or property resulting from any ideas, methods, instructions or products referred to in the content. |
© 2026 by the authors. Licensee MDPI, Basel, Switzerland. This article is an open access article distributed under the terms and conditions of the Creative Commons Attribution (CC BY) license.