


Abstract
Background/Objectives: Systemic lupus erythematosus-associated interstitial lung disease (SLE-ILD) is linked to increased disease burden and adverse outcomes, underscoring the need for its reliable detection. This study explored the use of quantitative computed tomography (CT) to assess pulmonary involvement in SLE-ILD and developed an interpretable machine learning model to identify the disease. Methods: This retrospective analysis included 312 patients with SLE: 135 with ILD and 177 without. It compared quantitative CT parameters, including lung volume (LV), mean lung density (MLD), and the percentage of intrapulmonary vascular volume (PIVV), between the groups. Patients from 2017 to 2022 (n = 219) formed the training set, whereas those from 2023 to 2025 (n = 93) formed the temporal test set. Following feature selection using the least absolute shrinkage and selection operator (LASSO) in the entire training set, eight machine learning models were developed, with hyperparameters optimized using a separate 10-fold cross-validation procedure. Model discrimination, calibration, and clinical utility were assessed through receiver operating characteristic (ROC) and precision–recall curves, calibration curves, and decision curve analysis. The final model’s feature contributions to predictions were analyzed using SHapley Additive exPlanations. Results: Compared with the non-ILD group, the ILD group generally showed higher MLD, lower LV, and lower PIVV. LASSO identified nine variables. After considering the performance of all models in both the training and temporal test sets, logistic regression (LR) was selected as the final model. In the temporal test set, the LR model achieved an area under the ROC curve (AUC) of 0.926 [95% confidence interval (CI), 0.875–0.977] and an average precision of 0.92 (95% CI, 0.86–0.97). Its accuracy, sensitivity, specificity, precision, and F1 score were 0.871, 0.825, 0.906, 0.868, and 0.846, respectively. This model was implemented as a web-based diagnostic calculator. Conclusions: Quantitative CT enables objective quantification of pulmonary abnormalities in patients with SLE-ILD. An interpretable LR model integrating clinical and quantitative CT features may support the objective identification of SLE-ILD, although its performance requires further validation in independent cohorts.
1. Introduction
Systemic lupus erythematosus (SLE) is a multisystem autoimmune disease, with pulmonary involvement constituting an important component of its clinical manifestations [1]. The development of interstitial lung disease (ILD) in patients with SLE can increase disease burden and lead to adverse outcomes [2]. Therefore, early and accurate detection of SLE-associated ILD (SLE-ILD) is crucial for proper assessment and guiding clinical management and treatment decisions.
High-resolution computed tomography (HRCT) is essential for diagnosing and characterizing ILD [3]. However, conventional visual assessment shows intra- and interobserver variability and may miss subtle imaging abnormalities, potentially reducing diagnostic accuracy [4]. The clinical and imaging manifestations of SLE-ILD are heterogeneous; when imaging findings are subtle or atypical, diagnostic classification can be challenging [5] and often requires a multidisciplinary approach [6,7]. Objective imaging methods that quantify pulmonary abnormalities and support ILD detection in patients with SLE are clinically valuable. Quantitative computed tomography (CT) may help address this need by providing quantitative characterization of pulmonary abnormalities, potentially improving disease assessment, risk stratification, and longitudinal monitoring [8,9]. This technique has also been applied to diagnose and assess various other pulmonary diseases [10,11].
Machine learning (ML) can analyze high-dimensional and multimodal data with complex nonlinear relationships, and help identify associations that may be difficult to detect using conventional statistical approaches. This has increased the use of ML in clinical research and practice, including for disease classification, diagnostic support, and decision-making [12,13]. However, some ML models produce predictions that are not readily interpretable, limiting their clinical acceptability. Compared with high-dimensional imaging features that are difficult to interpret directly, quantitative CT parameters provide clearer, more defined measurements for assessment. Integrating these measurements with model interpretability analysis can clarify how specific features influence model predictions, enhancing model interpretability [14]. Quantitative CT has been combined with ML to diagnose and evaluate chronic obstructive pulmonary disease and ILD associated with polymyositis/dermatomyositis [15,16]. However, differences in disease mechanisms and patient characteristics limit the direct extrapolation of these findings to SLE-ILD. Xu et al. [17] developed a prediction model for identifying ILD among women of reproductive age with SLE using clinical and laboratory variables, without incorporating pulmonary quantitative CT parameters. Niu et al. [18] developed a nomogram based on routine clinical indicators to predict the concurrent presence of ILD and pulmonary arterial hypertension (PAH) in patients with SLE; however, its prediction outcome was not ILD alone. Therefore, research combining quantitative CT and machine learning as an auxiliary approach for identifying SLE-ILD remains limited.
This study aimed to characterize pulmonary abnormalities in patients with SLE using quantitative CT and to evaluate the utility of lung volume (LV), mean lung density (MLD), and percentage of intrapulmonary vascular volume (PIVV) for identifying SLE-ILD. Additionally, clinical variables were integrated with quantitative CT metrics to develop and evaluate an ML model for detecting SLE-ILD. An interpretability analysis was performed to determine how key features influence model predictions, with the overall goal of supporting objective, imaging-based diagnosis of SLE-ILD.
2. Materials and Methods
2.1. Patient Selection and Study Design
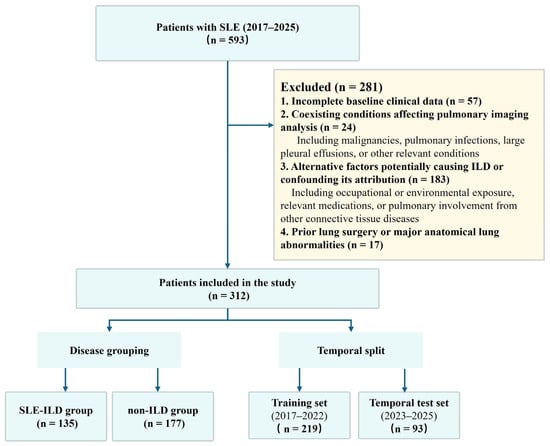
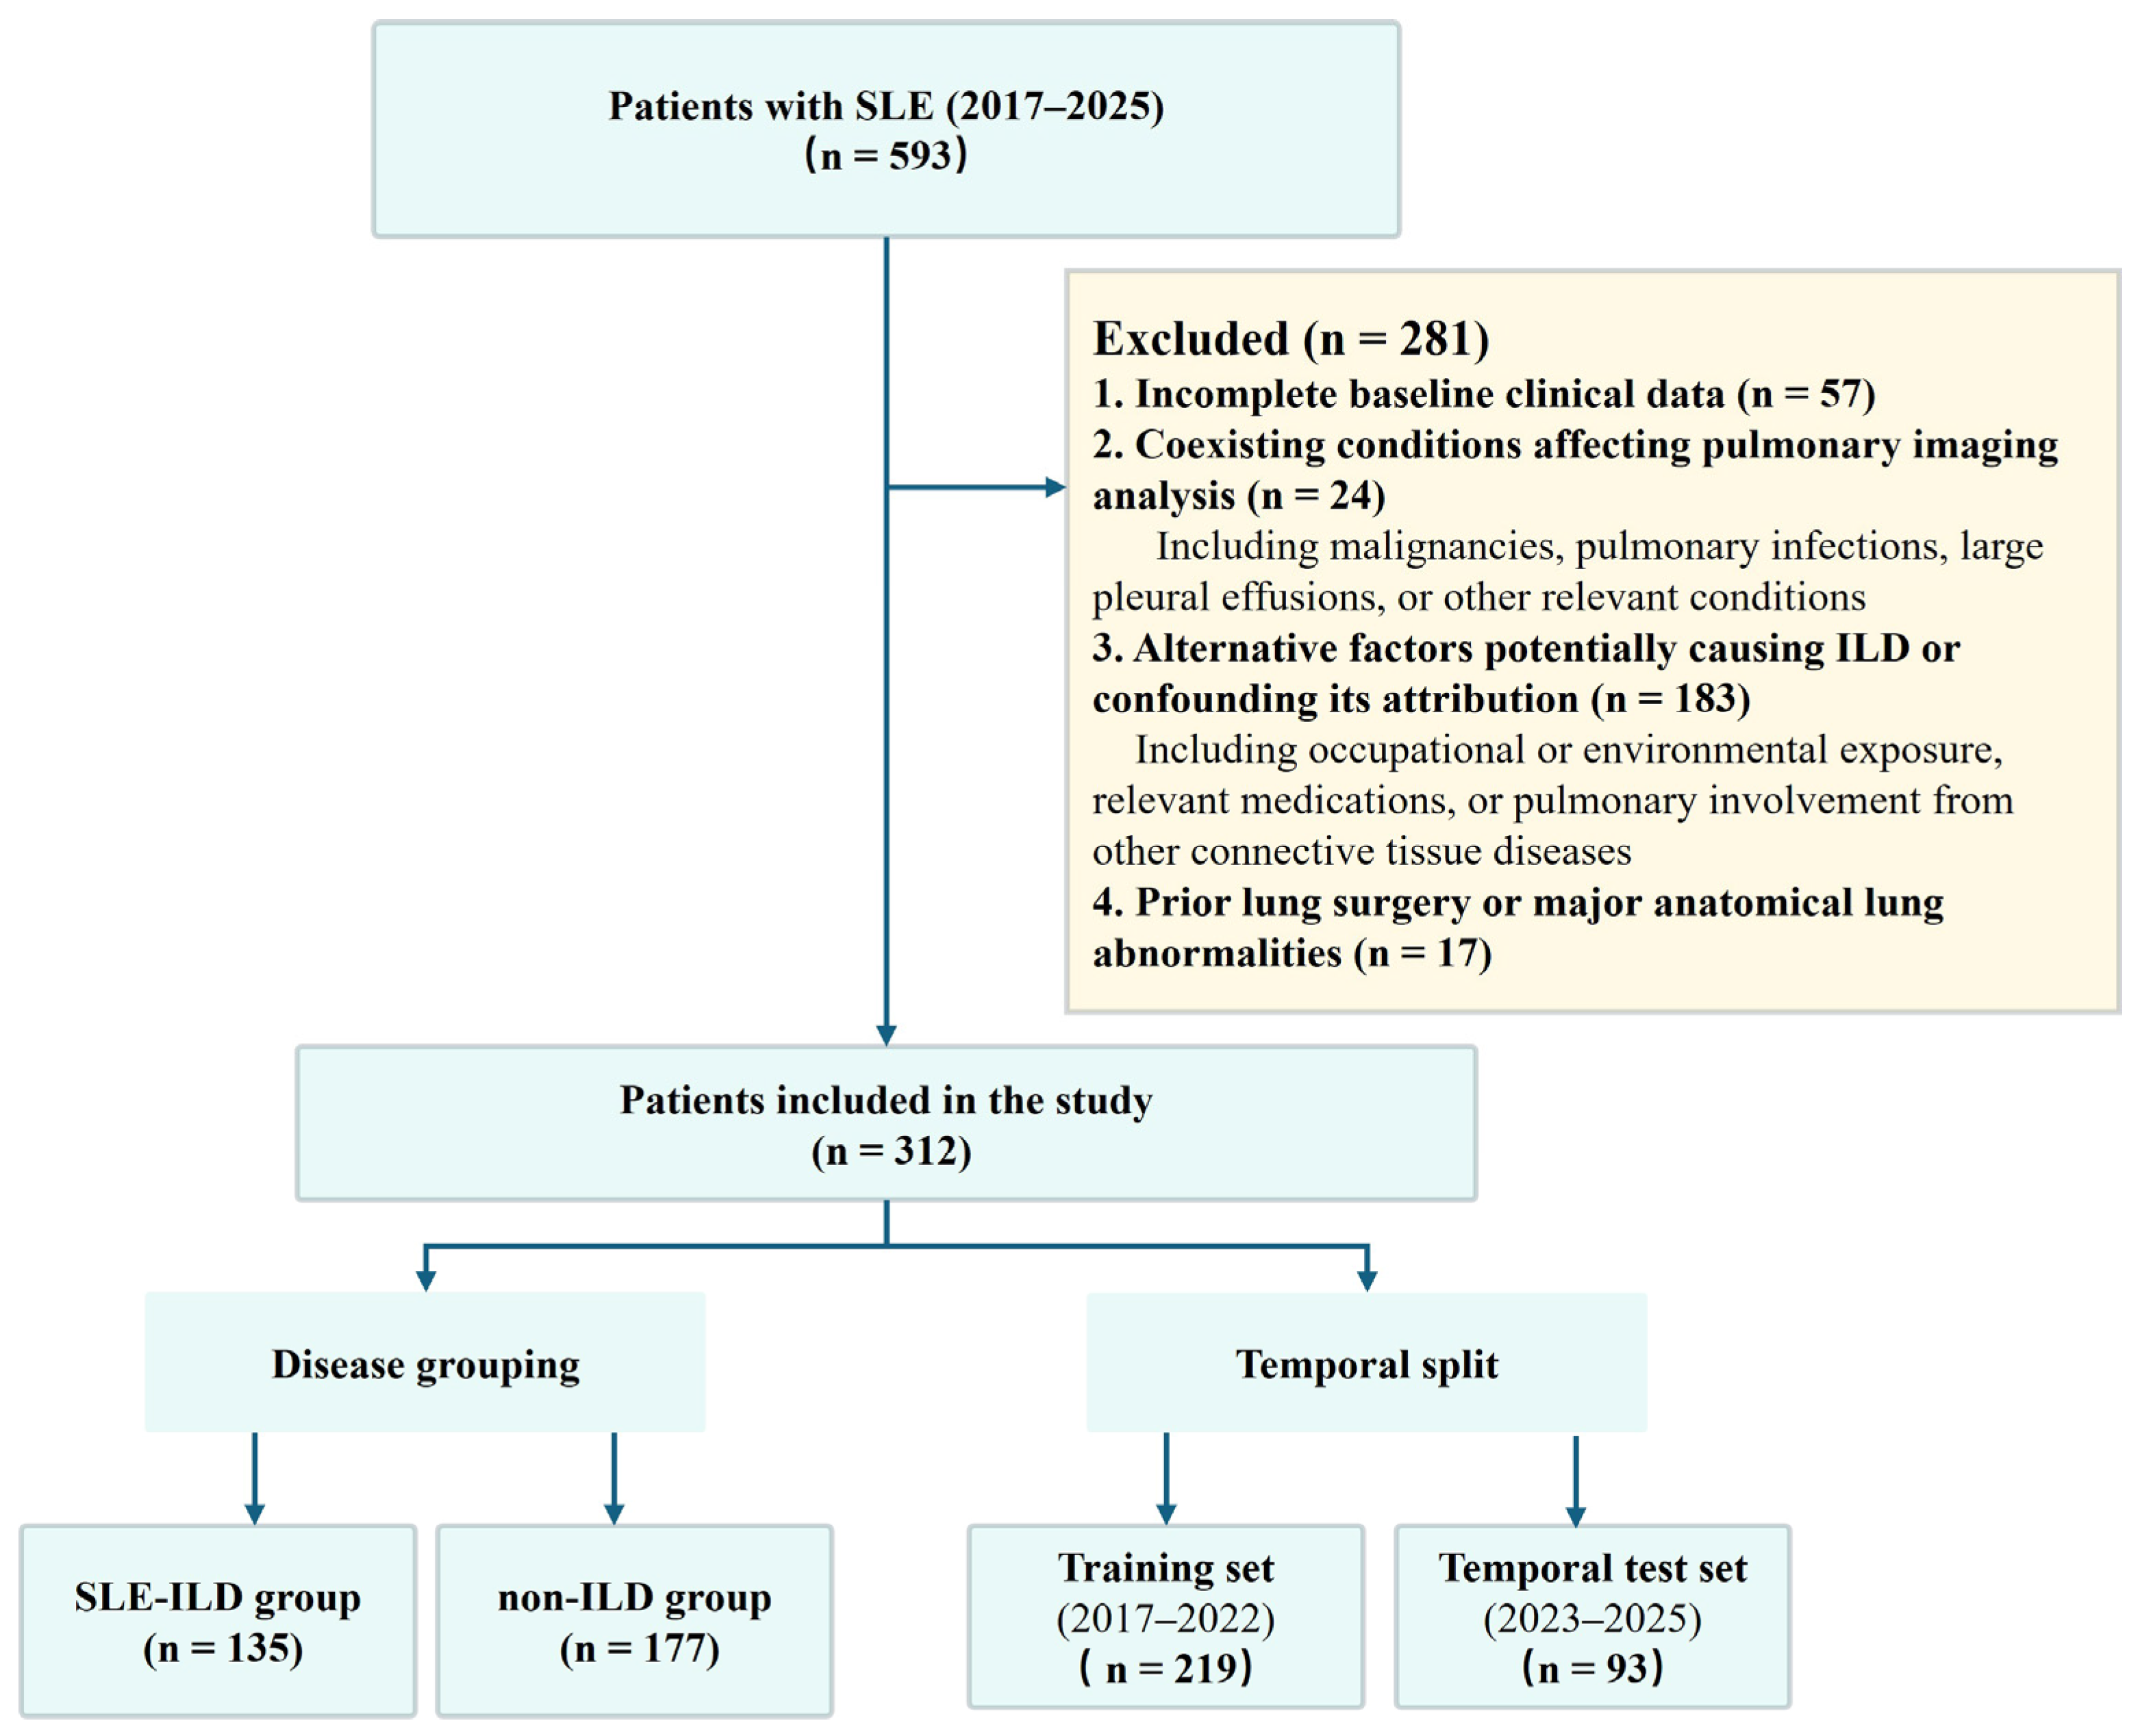
This retrospective study consecutively included 312 patients with SLE who were hospitalized at the First Affiliated Hospital of Xi’an Jiaotong University during 2017–2025. The training set included patients from 2017 to 2022 (n = 219), whereas the temporal test set comprised those from 2023 to 2025 (n = 93). Patients were classified as having SLE if they met either the 2019 European League Against Rheumatism/American College of Rheumatology criteria [19] or the 2012 Systemic Lupus International Collaborating Clinics criteria [20]. All included patients underwent HRCT examination and multidisciplinary evaluation by pulmonologists, rheumatologists, and radiologists, incorporating clinical information and HRCT findings and following the established American Thoracic Society/European Respiratory Society (ATS/ERS) framework [21]. After excluding alternative factors potentially causing ILD or confounding its attribution, the multidisciplinary team determined whether SLE-ILD was present. This evaluation was completed before quantitative CT analysis and machine learning model development. Patients diagnosed with SLE-ILD were assigned to the ILD group, whereas those not diagnosed with ILD were assigned to the non-ILD group. Ultimately, 135 and 177 patients were assigned to the ILD and non-ILD groups, respectively. The patient selection process is shown in Figure 1.
Figure 1.
Flowchart of patient selection and cohort allocation.
Eligible patients required (1) a clinically confirmed SLE diagnosis and (2) HRCT images suitable for quantitative CT analysis. Patients were excluded if they had (1) incomplete baseline clinical data; (2) coexisting malignancies, pulmonary infections, large pleural effusions, or other conditions affecting pulmonary imaging analysis; (3) current or previous alternative factors potentially causing ILD or confounding its attribution, including occupational or environmental exposure, relevant medications, or pulmonary involvement from other connective tissue diseases; or (4) prior lung surgery or major anatomical lung abnormalities.
2.2. Assessment of SLE Disease Activity
The Systemic Lupus Erythematosus Disease Activity Index 2000 (SLEDAI-2K) was used to quantify disease activity in patients with SLE. It comprises 24 items across nine organ systems and has a maximum possible score of 105. Three rheumatologists at our hospital collectively reviewed and confirmed the SLEDAI-2K scores for all patients.
2.3. CT Acquisition
Chest CT scans were performed on scanners with at least 64 detector rows. Patients were positioned supine with both arms above the head, capturing the lung apices through the bases during suspended respiration after deep inspiration. Acquisition settings included 120-kV tube voltage, automatic tube current modulation, and 1.0- or 1.5-mm slice thicknesses. Mediastinal-window images were reconstructed using a soft-tissue algorithm, whereas lung-window images were reconstructed using a bone algorithm.
2.4. Quantitative CT Analysis
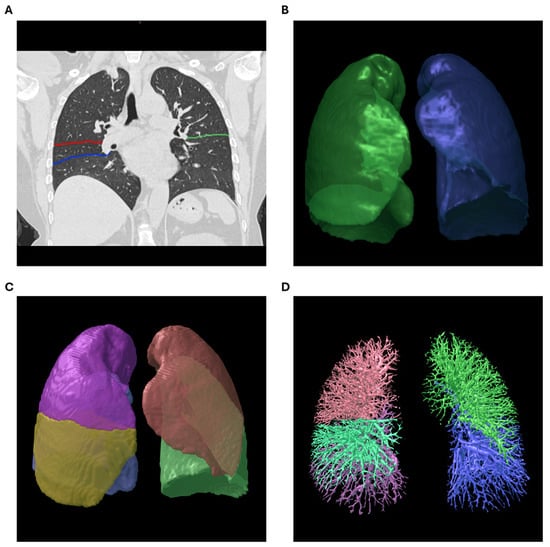
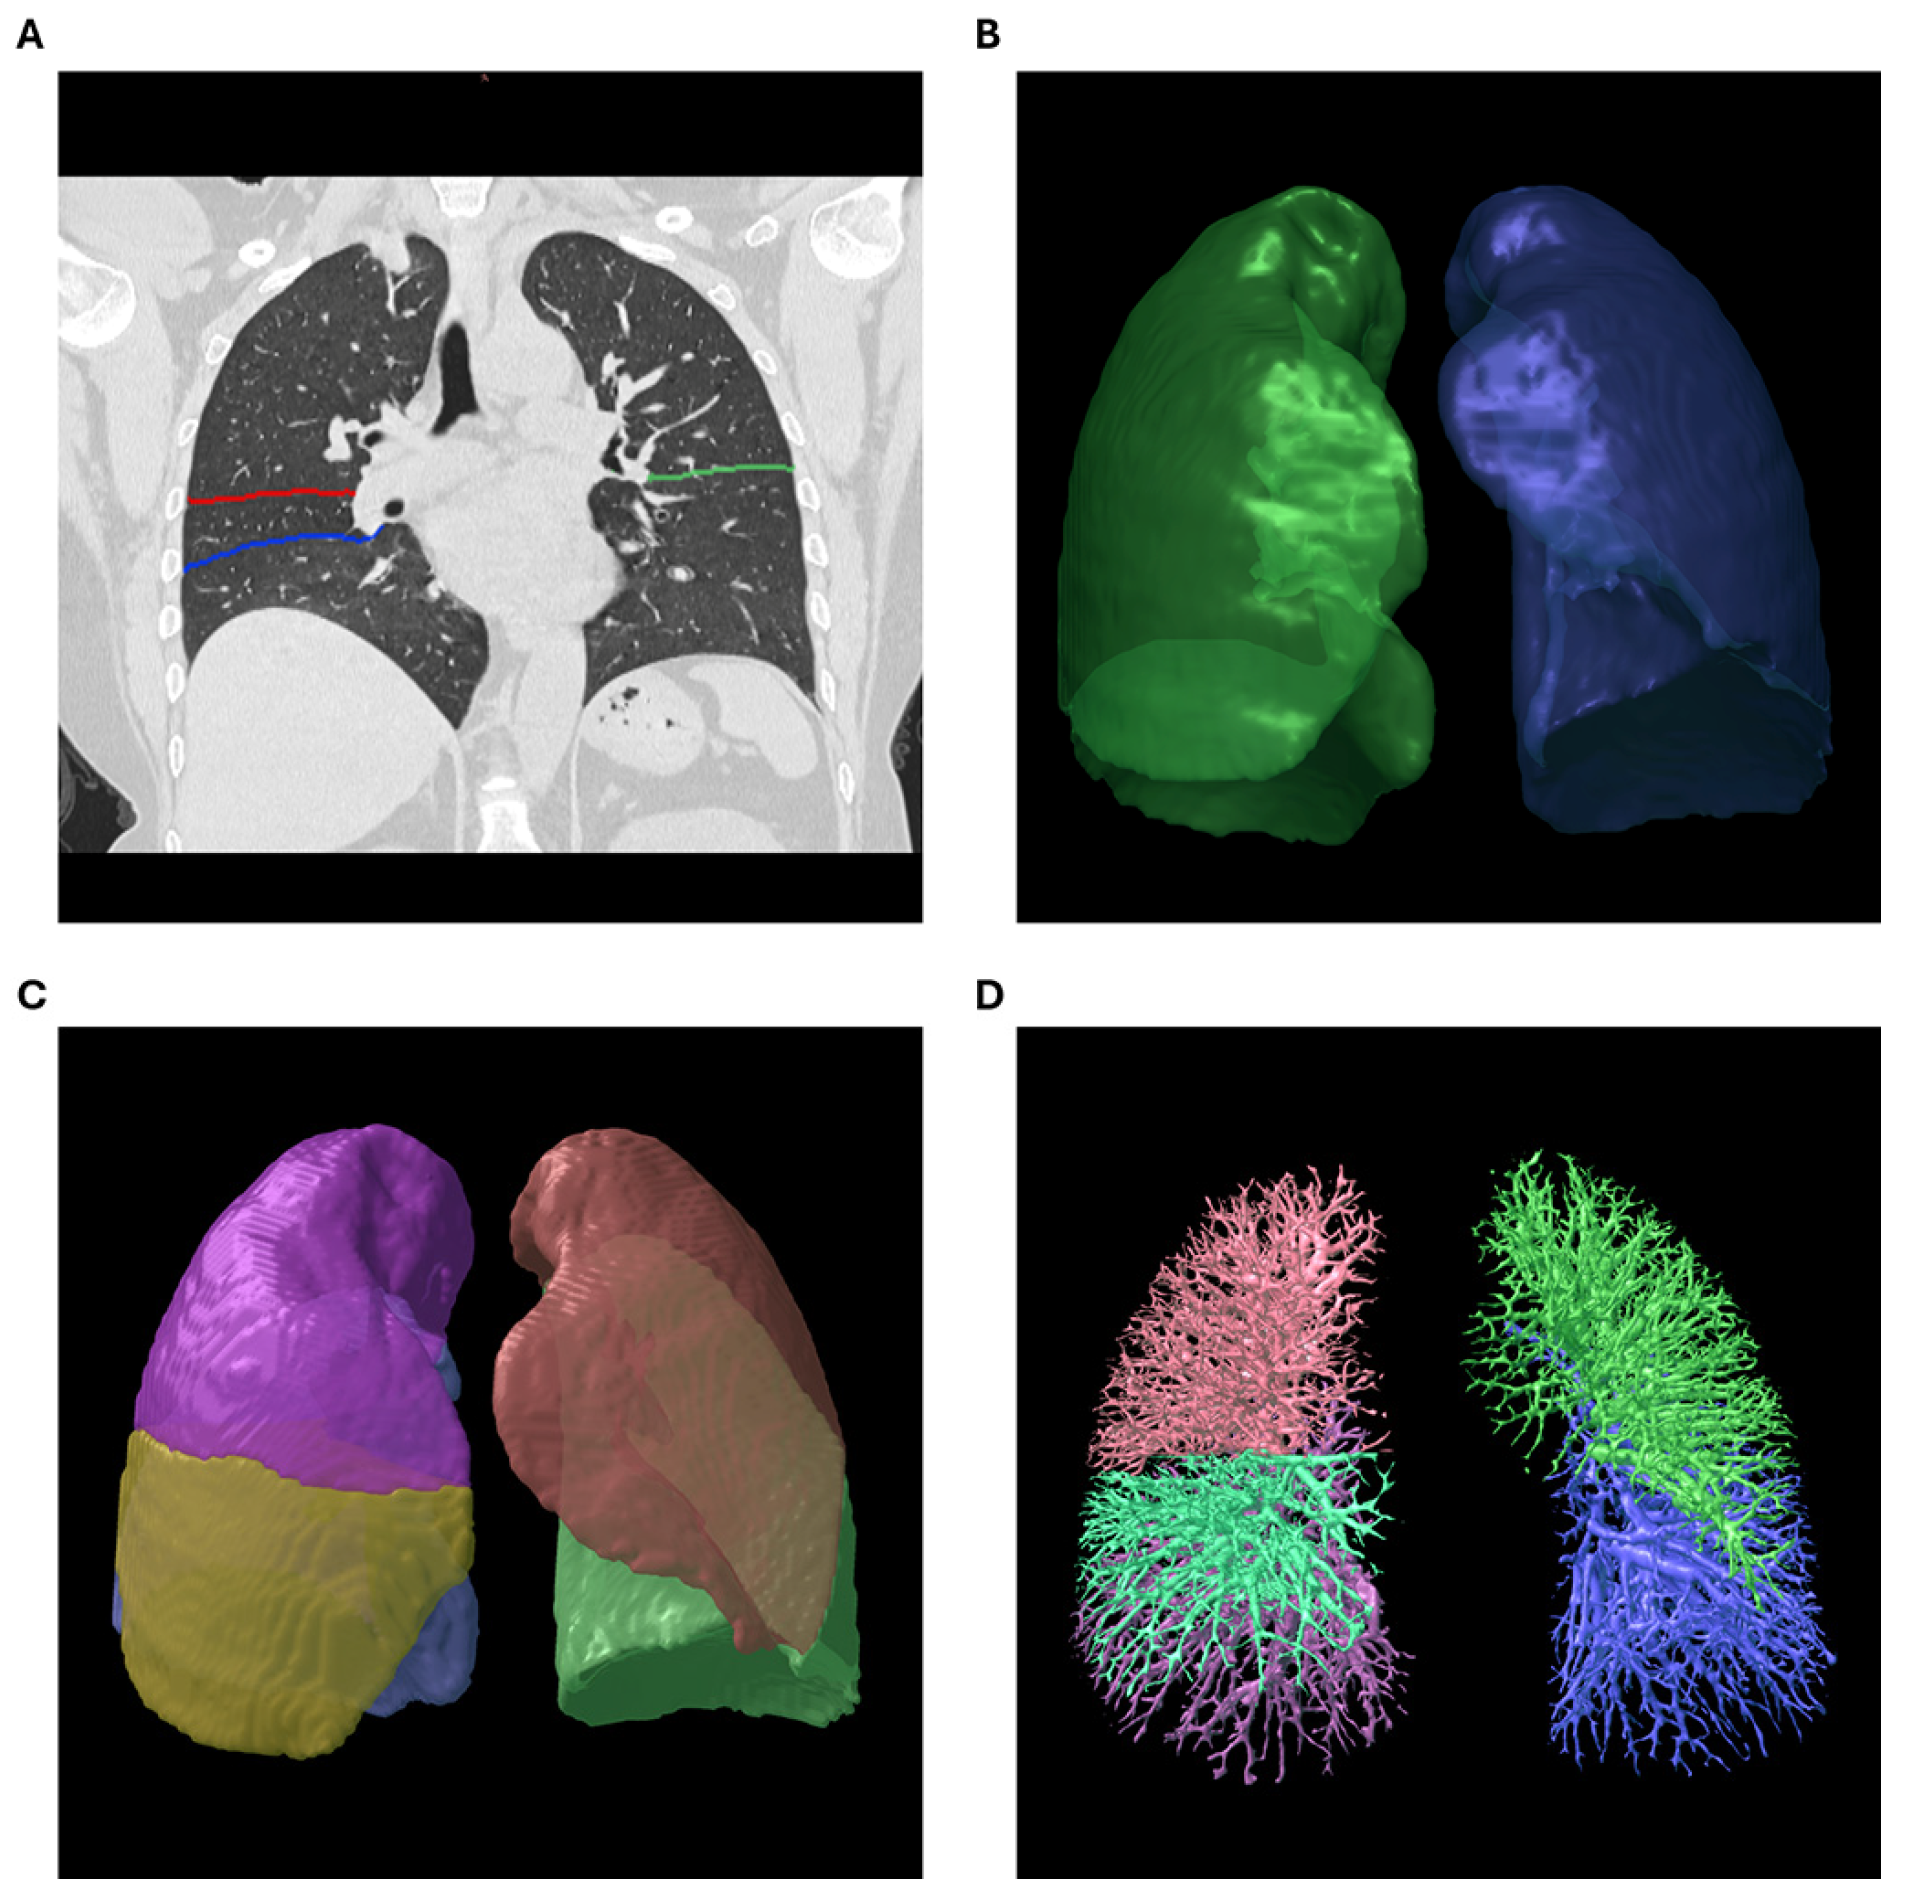
The FACT-Digital Lung Workstation (version 1.0; Dexin, Xi’an, China) was employed for quantitative analysis of the acquired HRCT datasets. This device has received 510(k) clearance from the U.S. Food and Drug Administration. All HRCT datasets underwent automated quantitative analysis using the same version of the FACT software. Automated fissure delineation segmented the right lung (RL) into the upper, middle, and lower lobes (RUL, RML, and RLL, respectively) and the left lung (LL) into the upper and lower lobes (LUL and LLL, respectively). Whole-lung (WL) data were then extracted, with LV and MLD calculated for the WL, RL, LL, and each lobe through the lung tissue visualization module. The automated measurement module also segmented the pulmonary vasculature, producing a visual representation of the pulmonary vascular tree. PIVV values for the WL, RL, LL, and individual lobes were then calculated as follows:
PIVV = (intrapulmonary vascular volume/corresponding lung volume) × 100 (Figure 2).
Figure 2.
Workflow of digital lung processing for quantitative CT analysis. (A–C) Segmentation of (A) the pulmonary fissures (the right horizontal fissure is shown in red, the right oblique fissure in blue, and the left oblique fissure in green), (B) the left and right lungs (the right lung is shown in green and the left lung in blue), and (C) the individual lung lobes (the right upper lobe, right middle lobe, right lower lobe, left upper lobe, and left lower lobe are shown in purple, yellow, blue, pink, and green, respectively). (D) Pulmonary vascular tree extraction (the vascular trees of the right upper lobe, right middle lobe, right lower lobe, left upper lobe, and left lower lobe are shown in red, light green, purple, dark green, and blue, respectively). The segmentation images shown were obtained from a patient with SLE without ILD included in this study.
2.5. Model Construction and Evaluation
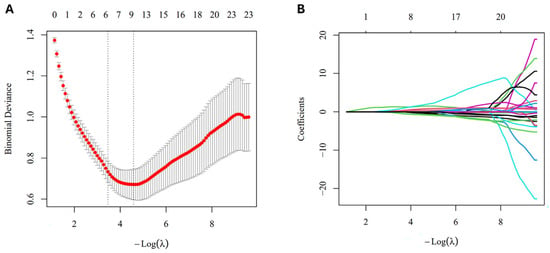
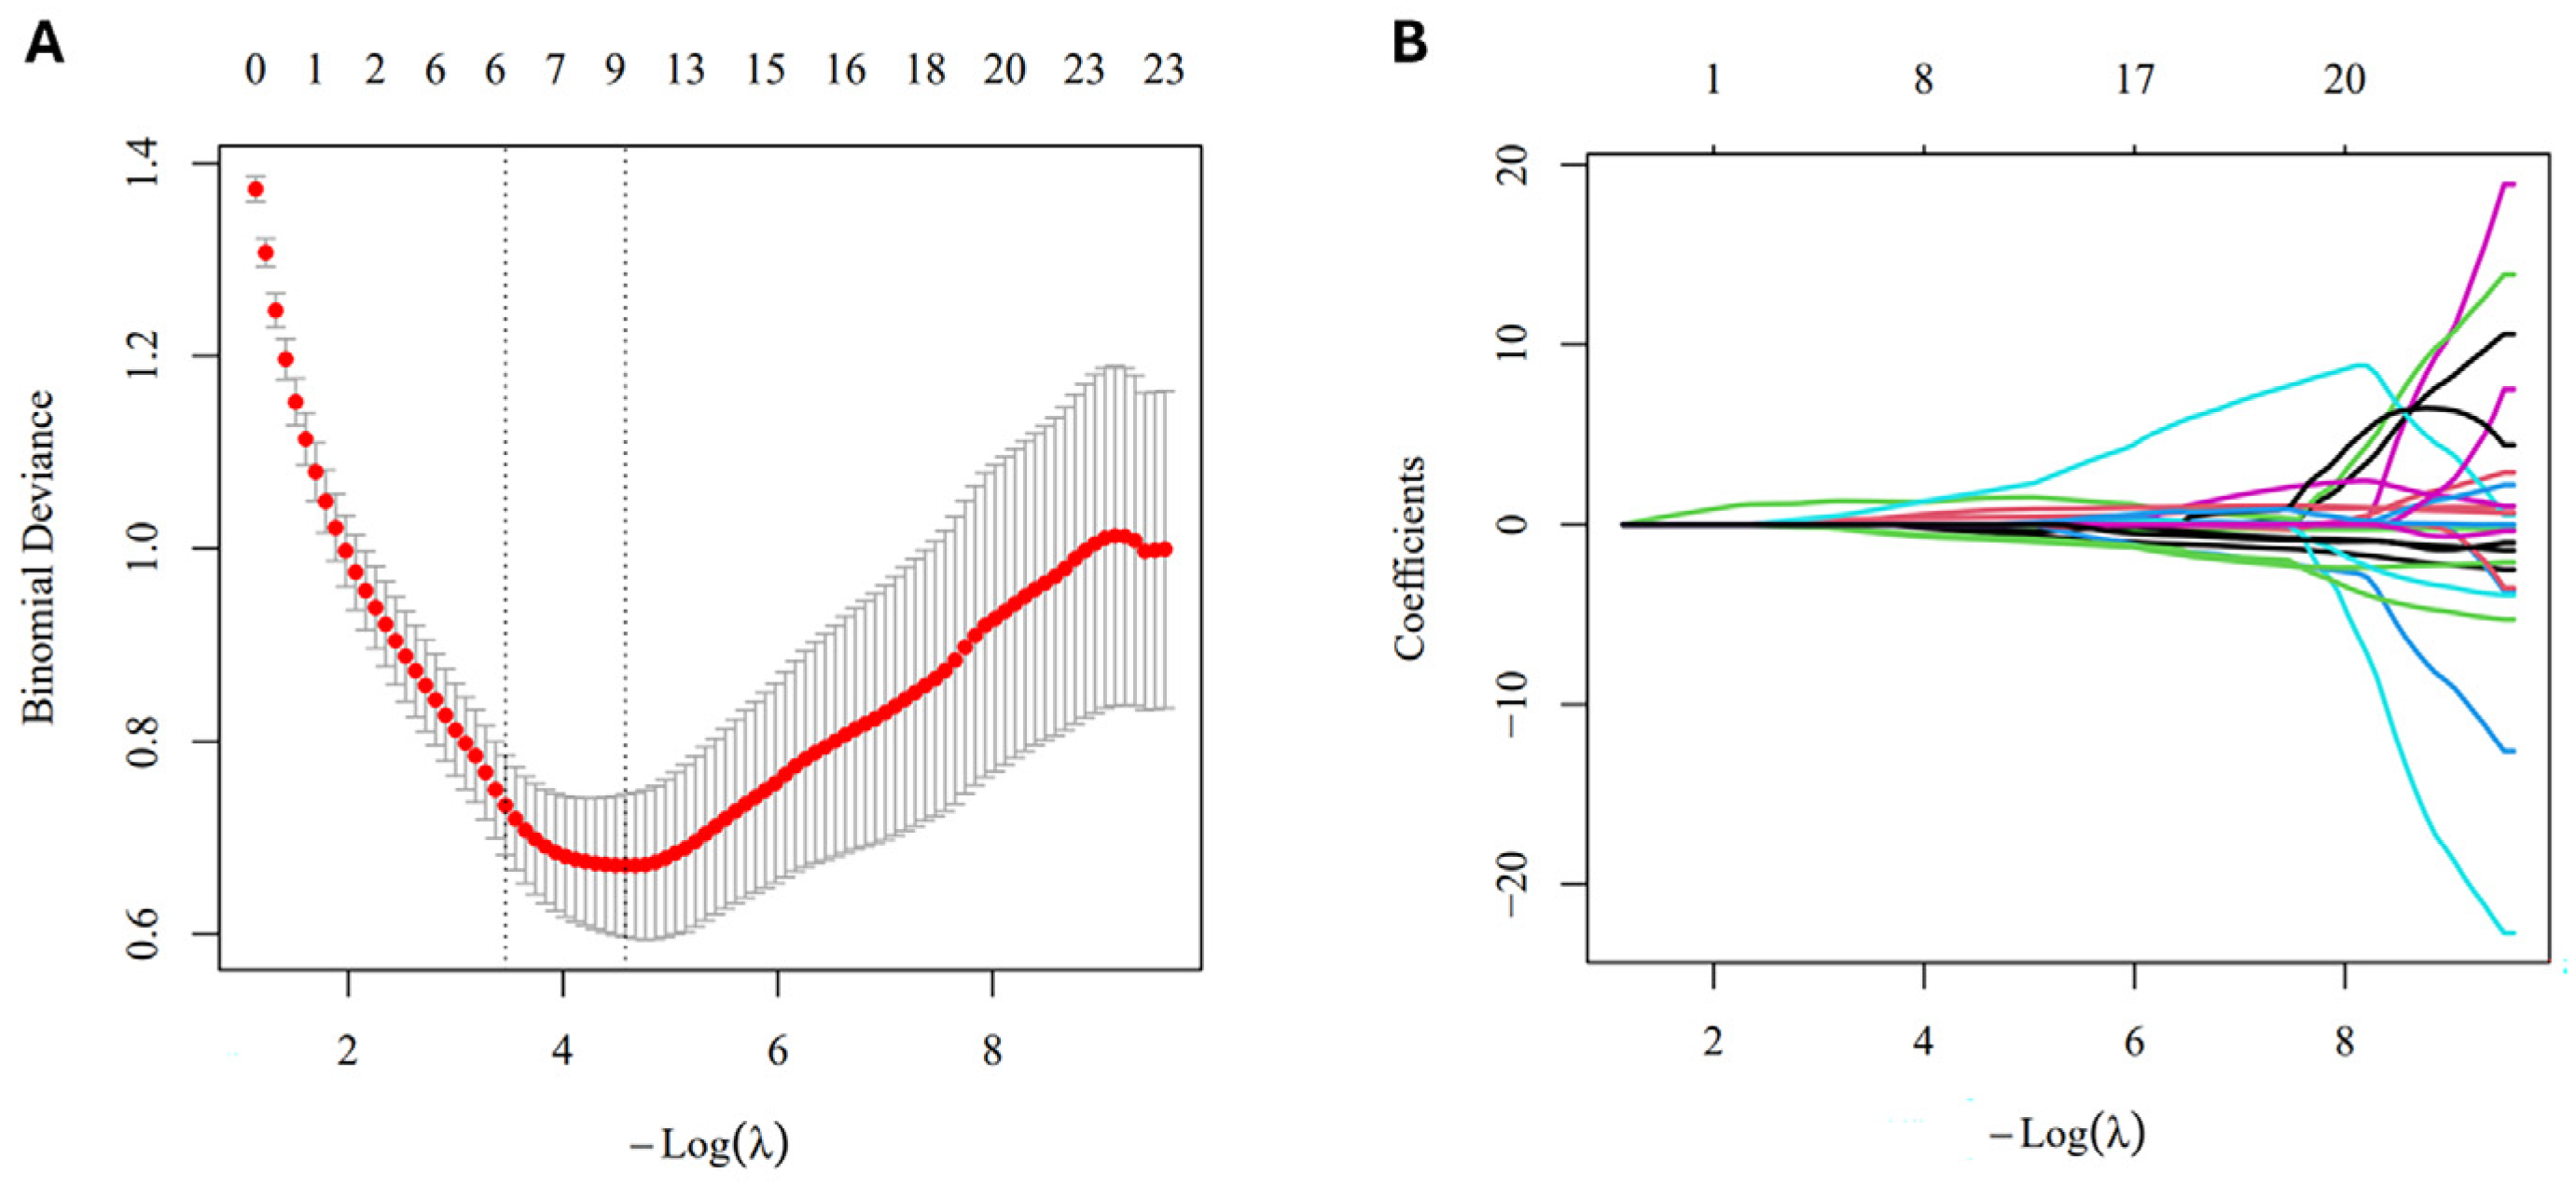
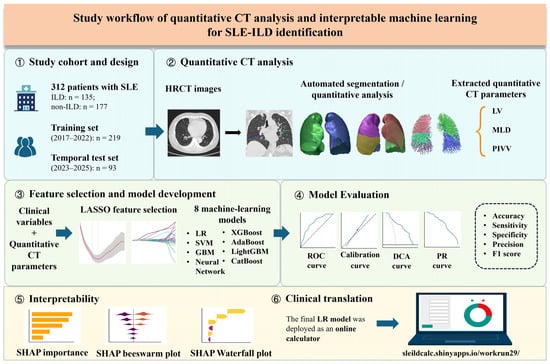
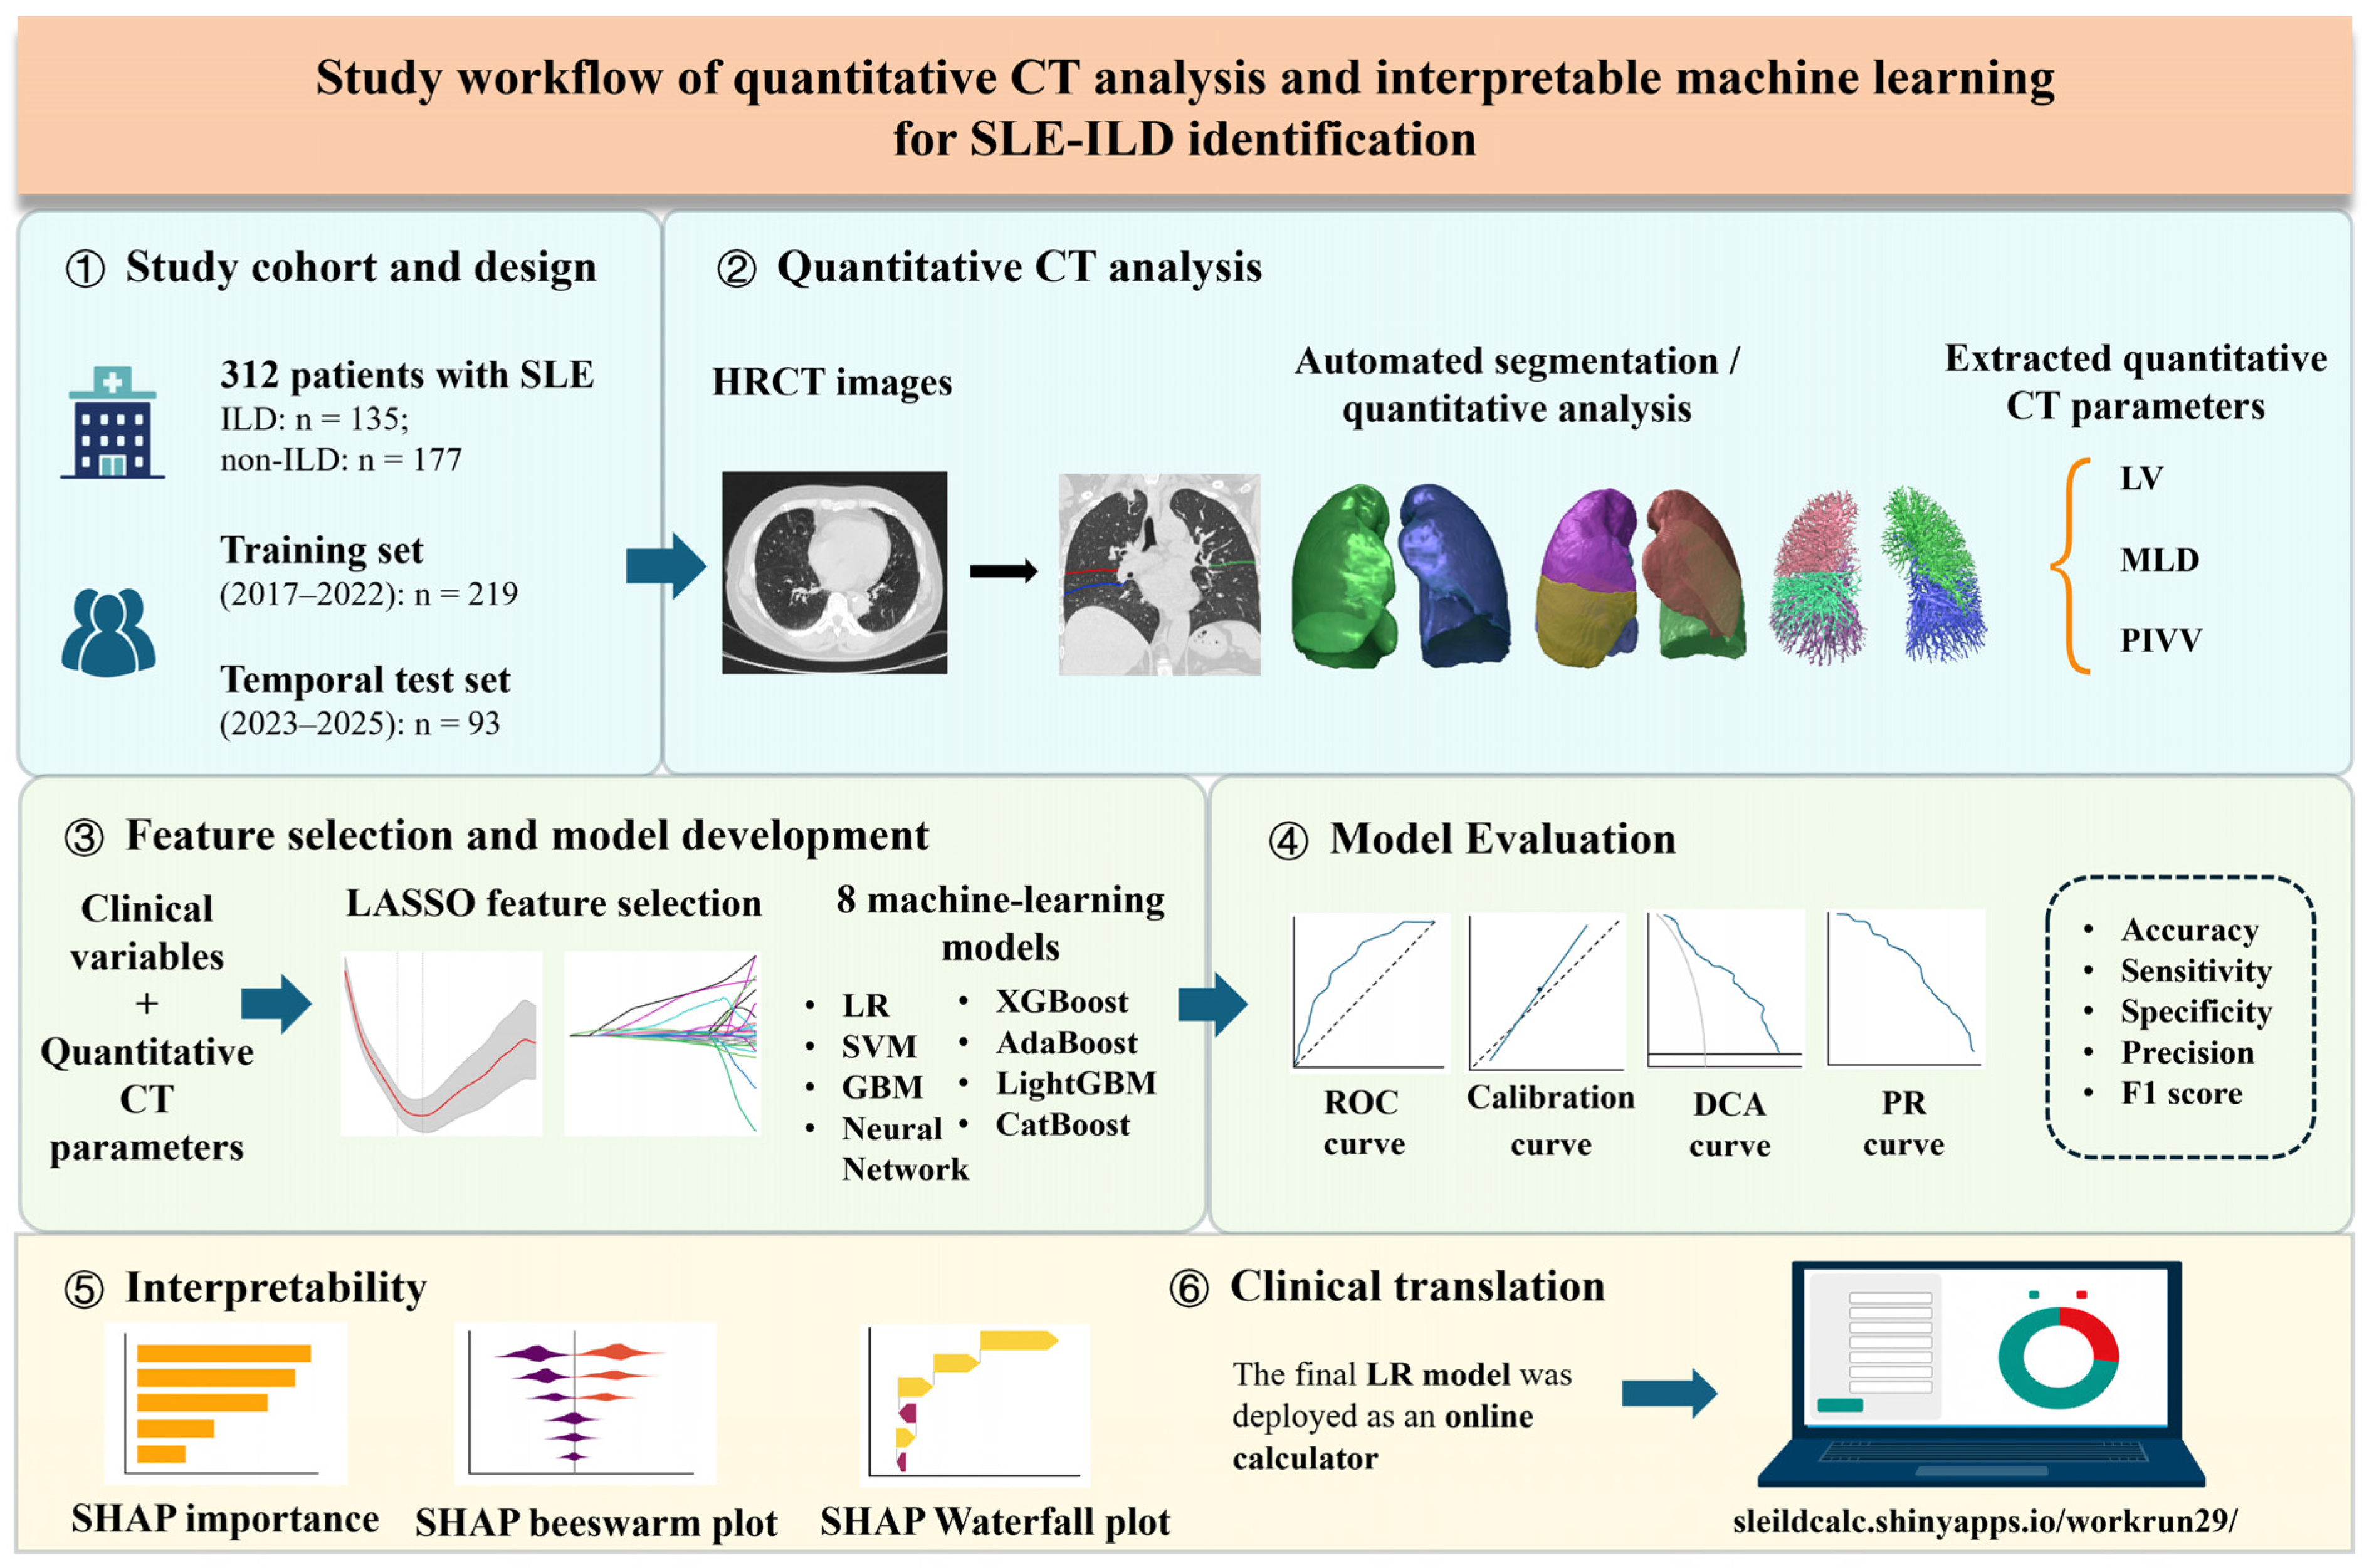
We selected age, sex, and SLEDAI-2K score, together with LV, MLD, and PIVV measured separately for the WL, RL, LL, and individual lobes, as the initial candidate predictors for identifying SLE-ILD. Predictor selection was performed using least absolute shrinkage and selection operator (LASSO) regression on the entire training set, with the penalty parameter (λ_min) determined by 10-fold cross-validation (Figure 3). Eight different ML models were applied: extreme gradient boosting (XGBoost), gradient boosting machine (GBM), categorical boosting (CatBoost), support vector machine (SVM), adaptive boosting (AdaBoost), neural network (NN), lightGBM, and logistic regression (LR). For model tuning, hyperparameters were subsequently optimized using a separate 10-fold cross-validation within the training set. Additionally, a nested cross-validation sensitivity analysis was performed for the final selected model. Discrimination was assessed using receiver operating characteristic (ROC) and precision–recall curves, summarized by the area under the ROC curve (AUC) and average precision (AP), respectively. Classification metrics included accuracy, sensitivity, specificity, precision, and F1 score. Classification thresholds were determined by maximizing the Youden index based on the ROC curves in the training set and were applied to both the training and temporal test sets. Calibration curves were used to assess model calibration, decision curve analysis (DCA) was applied to explore clinical utility, and the selected model was interpreted using Shapley additive explanations (SHAP). Models were developed in R v4.5.2. Figure 4 provides an overview of the study design.
Figure 3.
Feature selection using LASSO regression. (A) LASSO cross-validation plot. (B) LASSO coefficient path plot as a function of λ. In panel A, red points represent the mean cross-validated binomial deviance, gray error bars indicate ±1 standard error, and the left and right vertical dashed lines indicate λ1se and λmin, respectively. In panel B, differently colored lines represent the coefficient paths of individual predictors.
Figure 4.
Study workflow: quantitative CT analysis and interpretable machine learning for SLE-ILD detection.
2.6. Statistical Analysis
Statistical analyses were conducted using IBM SPSS Statistics v27.0. Continuous variables were summarized by distribution: normally distributed data were presented as means ± standard deviations, whereas non-normally distributed data were reported as medians with interquartile ranges. For between-group comparisons, independent-samples t-tests were used to assess normally distributed variables, whereas Mann–Whitney U tests were applied for non-normally distributed variables. Categorical variables were reported as counts (n) and compared using the χ2 test. For the slice-thickness sensitivity analysis, separate linear regression models were fitted, adjusting for ILD status, age, and sex. Statistical tests were two-sided, with significance set at p < 0.05. To account for multiple comparisons of quantitative CT parameters, false discovery rate (FDR) correction was applied, and statistical significance was determined using the adjusted p-values.
3. Results
3.1. Baseline Characteristics
Patients with ILD were significantly older than those without ILD [45.00 (32.00, 55.00) vs. 33.00 (27.00, 46.50) years; p < 0.05]. Sex distribution did not differ significantly between the groups (p > 0.05), with females predominating in both groups. SLEDAI-2K scores showed no significant between-group difference [8 (4, 12) vs. 7 (4, 10); p > 0.05].
3.2. Quantitative CT Features
Quantitative CT comparisons revealed significant between-group differences in the measured parameters (Table 1, Table 2 and Table 3). Compared with the non-ILD group, the ILD group showed lower LV in the WL, RL, LL, and all individual lobes except the RML; higher MLD across all assessed regions; and lower PIVV in the WL, RL, LL, and all lobes except the RUL. All reported differences were statistically significant (p < 0.05). In the slice-thickness sensitivity analysis, no statistically significant differences were observed in any of the 24 quantitative CT parameters between the 1.0-mm and 1.5-mm groups (Table S1).
Table 1.
LV parameters according to ILD status in patients with SLE (mL; median [Q1, Q3]).
Table 2.
MLD parameters according to ILD status in patients with SLE (HU; median [Q1, Q3]).
Table 3.
PIVV according to ILD status in patients with SLE (%; median [Q1, Q3]).
3.3. Model Performance Comparison
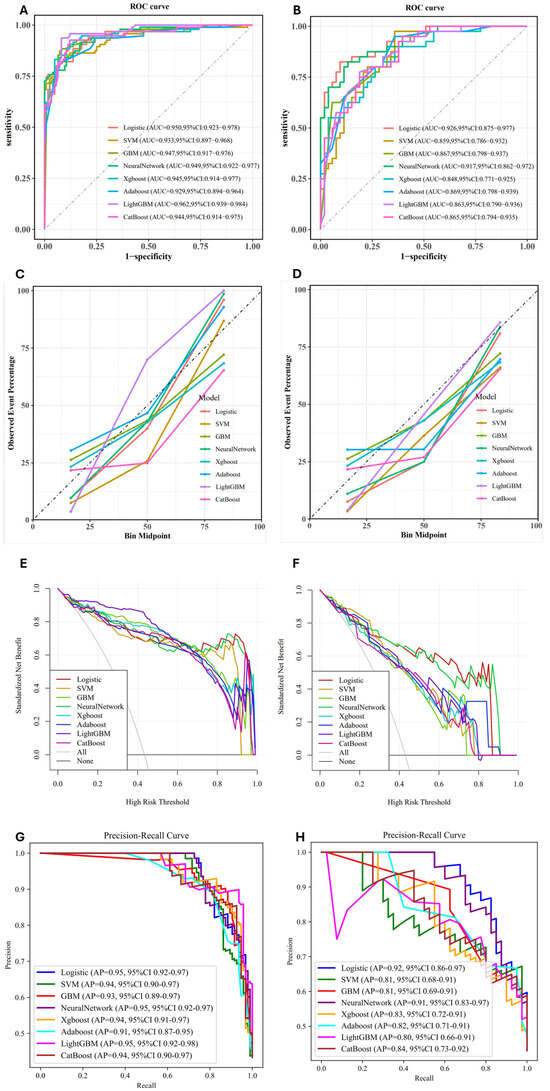
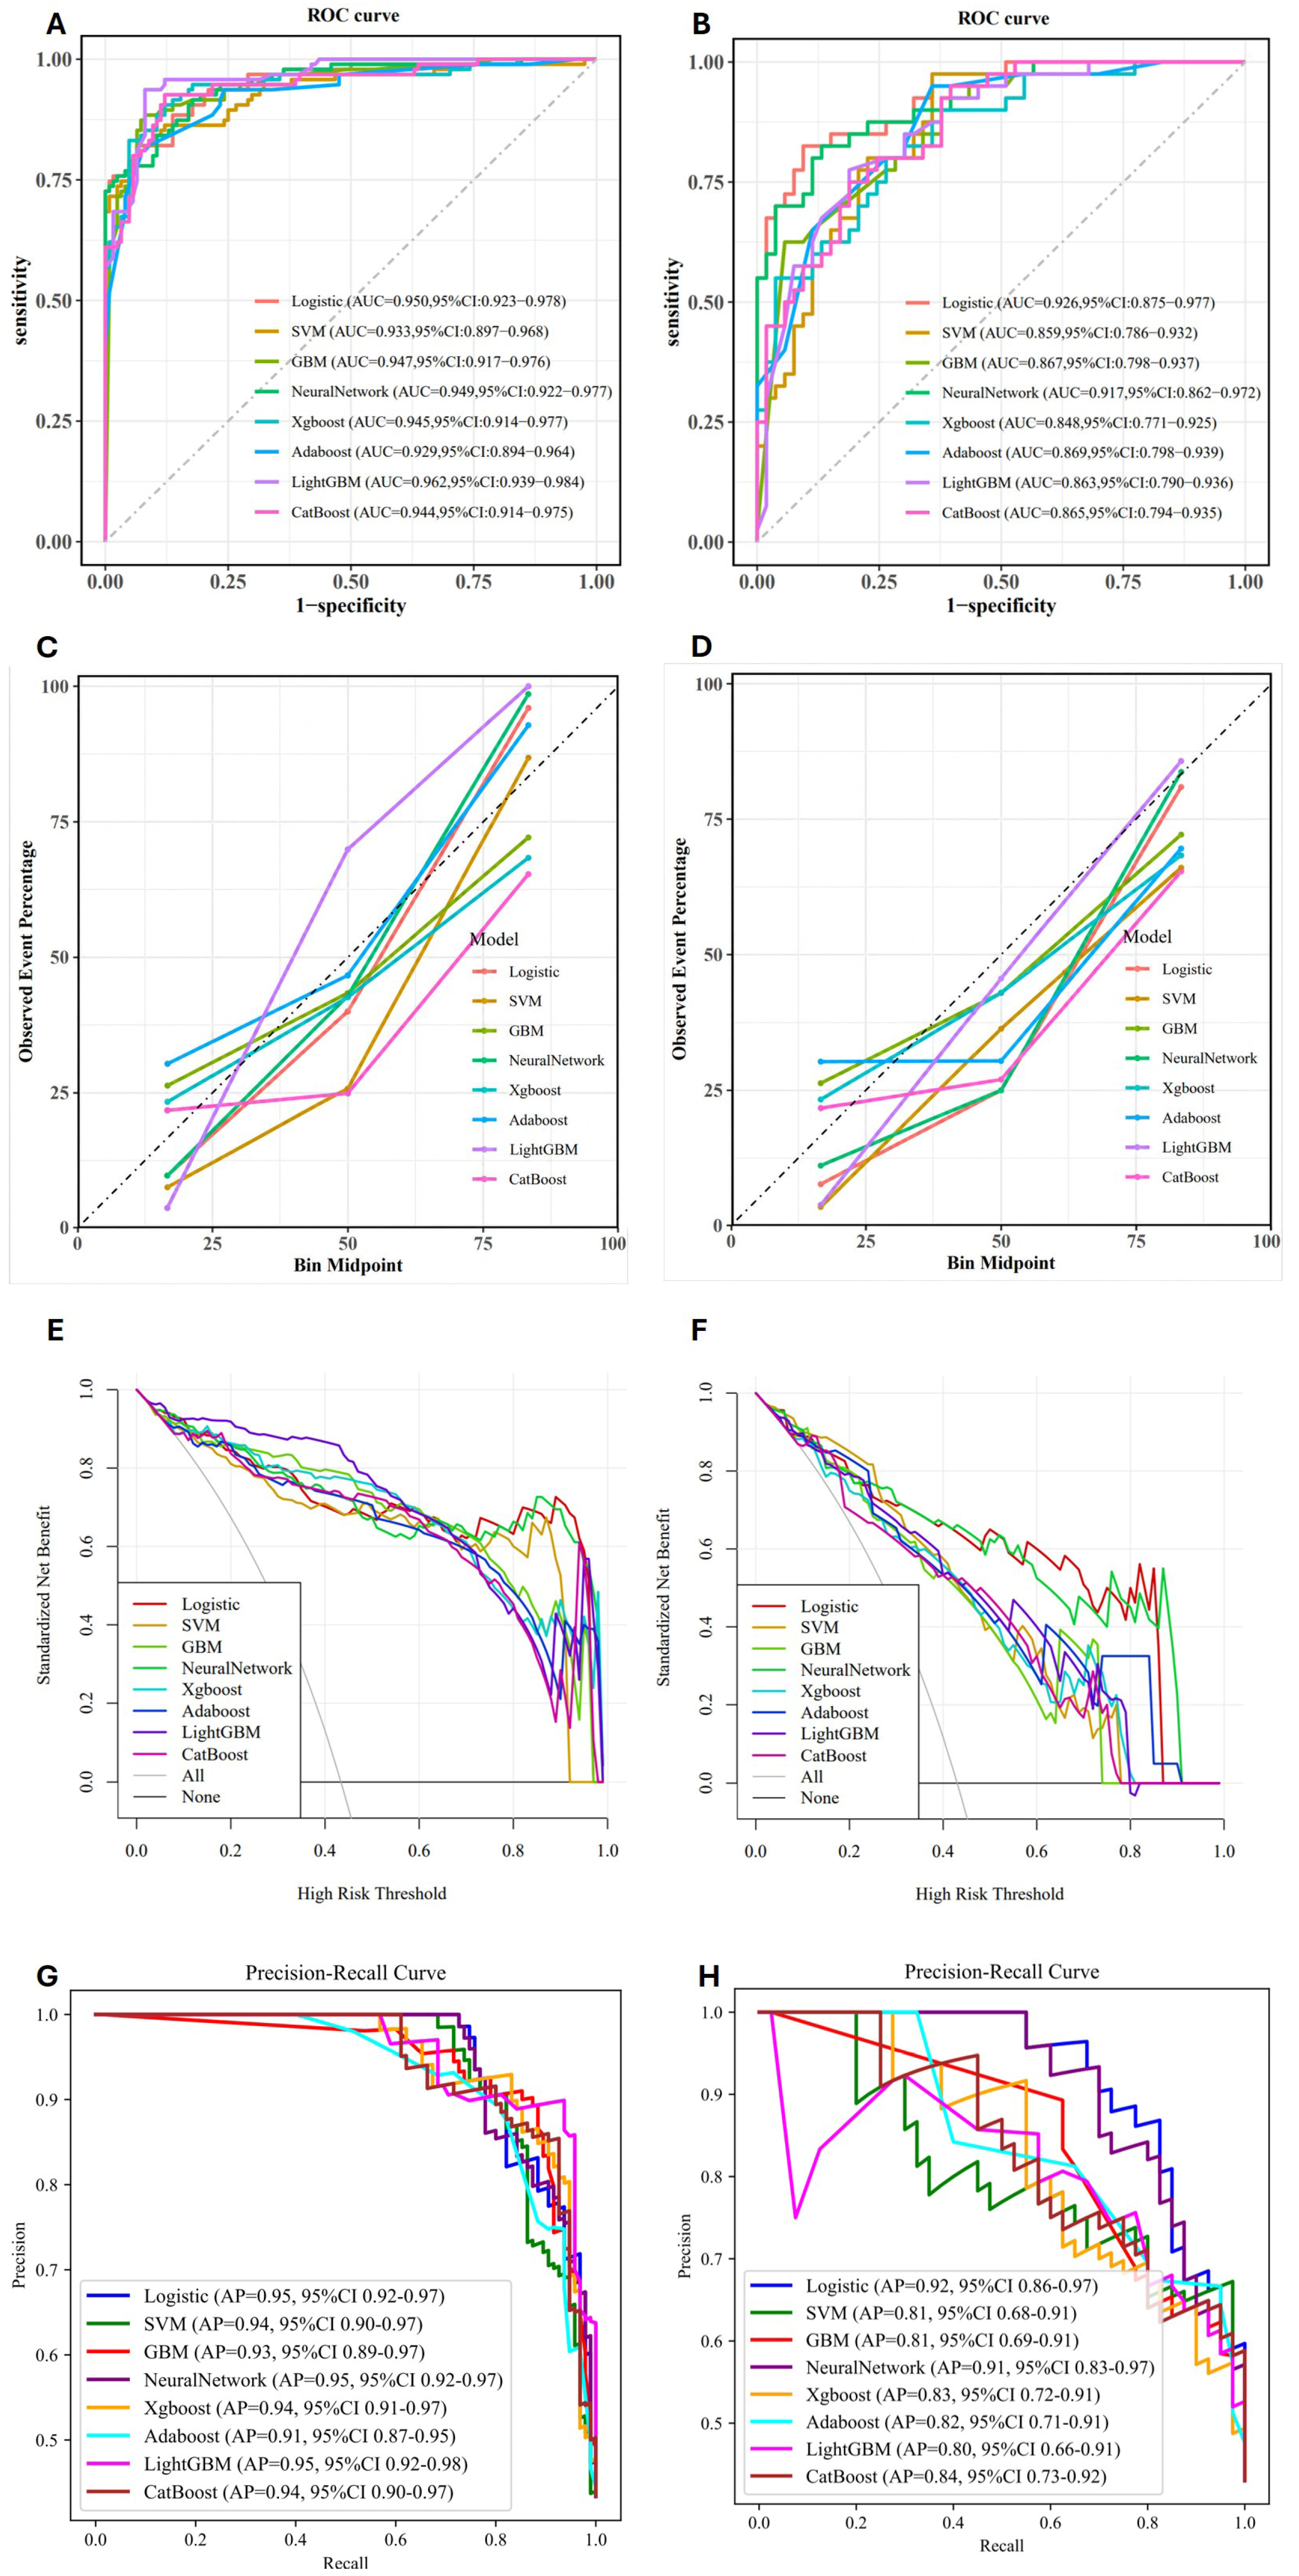
LASSO regression applied to the entire training set identified nine predictors. In the training set, AUC and AP ranges were 0.929–0.962 and 0.91–0.95, respectively. In the temporal test set, LR yielded the highest AUC (0.926; 95% CI, 0.875–0.977) and highest AP (0.92; 95% CI, 0.86–0.97). Its classification metrics included an accuracy of 0.871, sensitivity of 0.825, specificity of 0.906, precision of 0.868, and F1 score of 0.846 (Table 4, Figure S1). Conversely, SVM and AdaBoost showed higher sensitivity but lower specificity, whereas GBM achieved higher specificity but lower sensitivity. Therefore, LR provided a more balanced trade-off between sensitivity and specificity. Calibration curves showed variations across models in both the training and temporal test sets. In the temporal test set, observed event frequencies were below the reference line for all models in the intermediate probability bin, whereas LR, NN, and LightGBM were relatively close to the reference line in the higher probability bin, with the corresponding calibration slopes and intercepts reported in Table S2. DCA revealed differences in standardized net benefit among the eight models across threshold probabilities in both the training and temporal test sets. In the temporal test set, LightGBM and XGBoost showed more pronounced decreases in standardized net benefit over certain higher threshold probabilities, whereas LR exhibited relatively higher standardized net benefit (Figure 5). After considering the performance of all models in both the training and temporal test sets, LR was selected as the final model. However, because the temporal test set was considered during final model selection, the performance estimates obtained from this set may be optimistic. In the LR model, age, MLD_LLL, LV_RML, LV_RLL, and PIVV_RUL had significant regression coefficients (p < 0.05; Table 5). The nested cross-validation sensitivity analysis of the final selected model (LR) yielded an AUC of 0.919 (95% CI, 0.881–0.957) (Figure S2).
Table 4.
Performance metrics from candidate models in the temporal test set.
Figure 5.
Performance of eight machine learning models. (A,C,E,G) Training set; (B,D,F,H) temporal test set. (A,B) Receiver operating characteristic (ROC) curves illustrating model discrimination. (C,D) Calibration curves comparing predicted probabilities with observed event frequencies; the diagonal reference line indicates perfect calibration. (E,F) Decision curve analysis showing standardized net benefit across threshold probabilities; “All” and “None” represent the treat-all and treat-none reference strategies, respectively. (G,H) Precision–recall curves illustrating the relationship between precision and recall. Higher average precision (AP) generally indicates better overall precision–recall performance when evaluated on the same dataset.
Table 5.
Parameter estimates from the multivariable logistic model fitted to the training set.
3.4. SHAP-Based Interpretation of the Logistic Regression Model
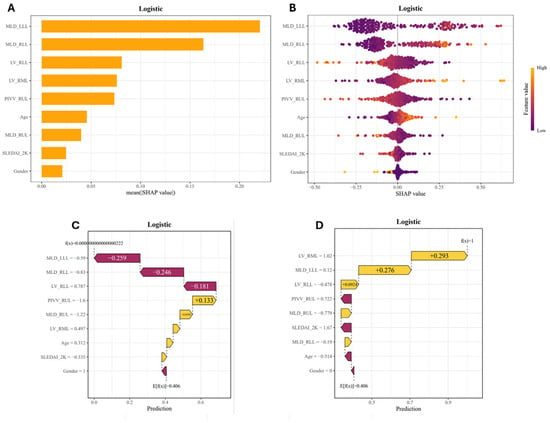
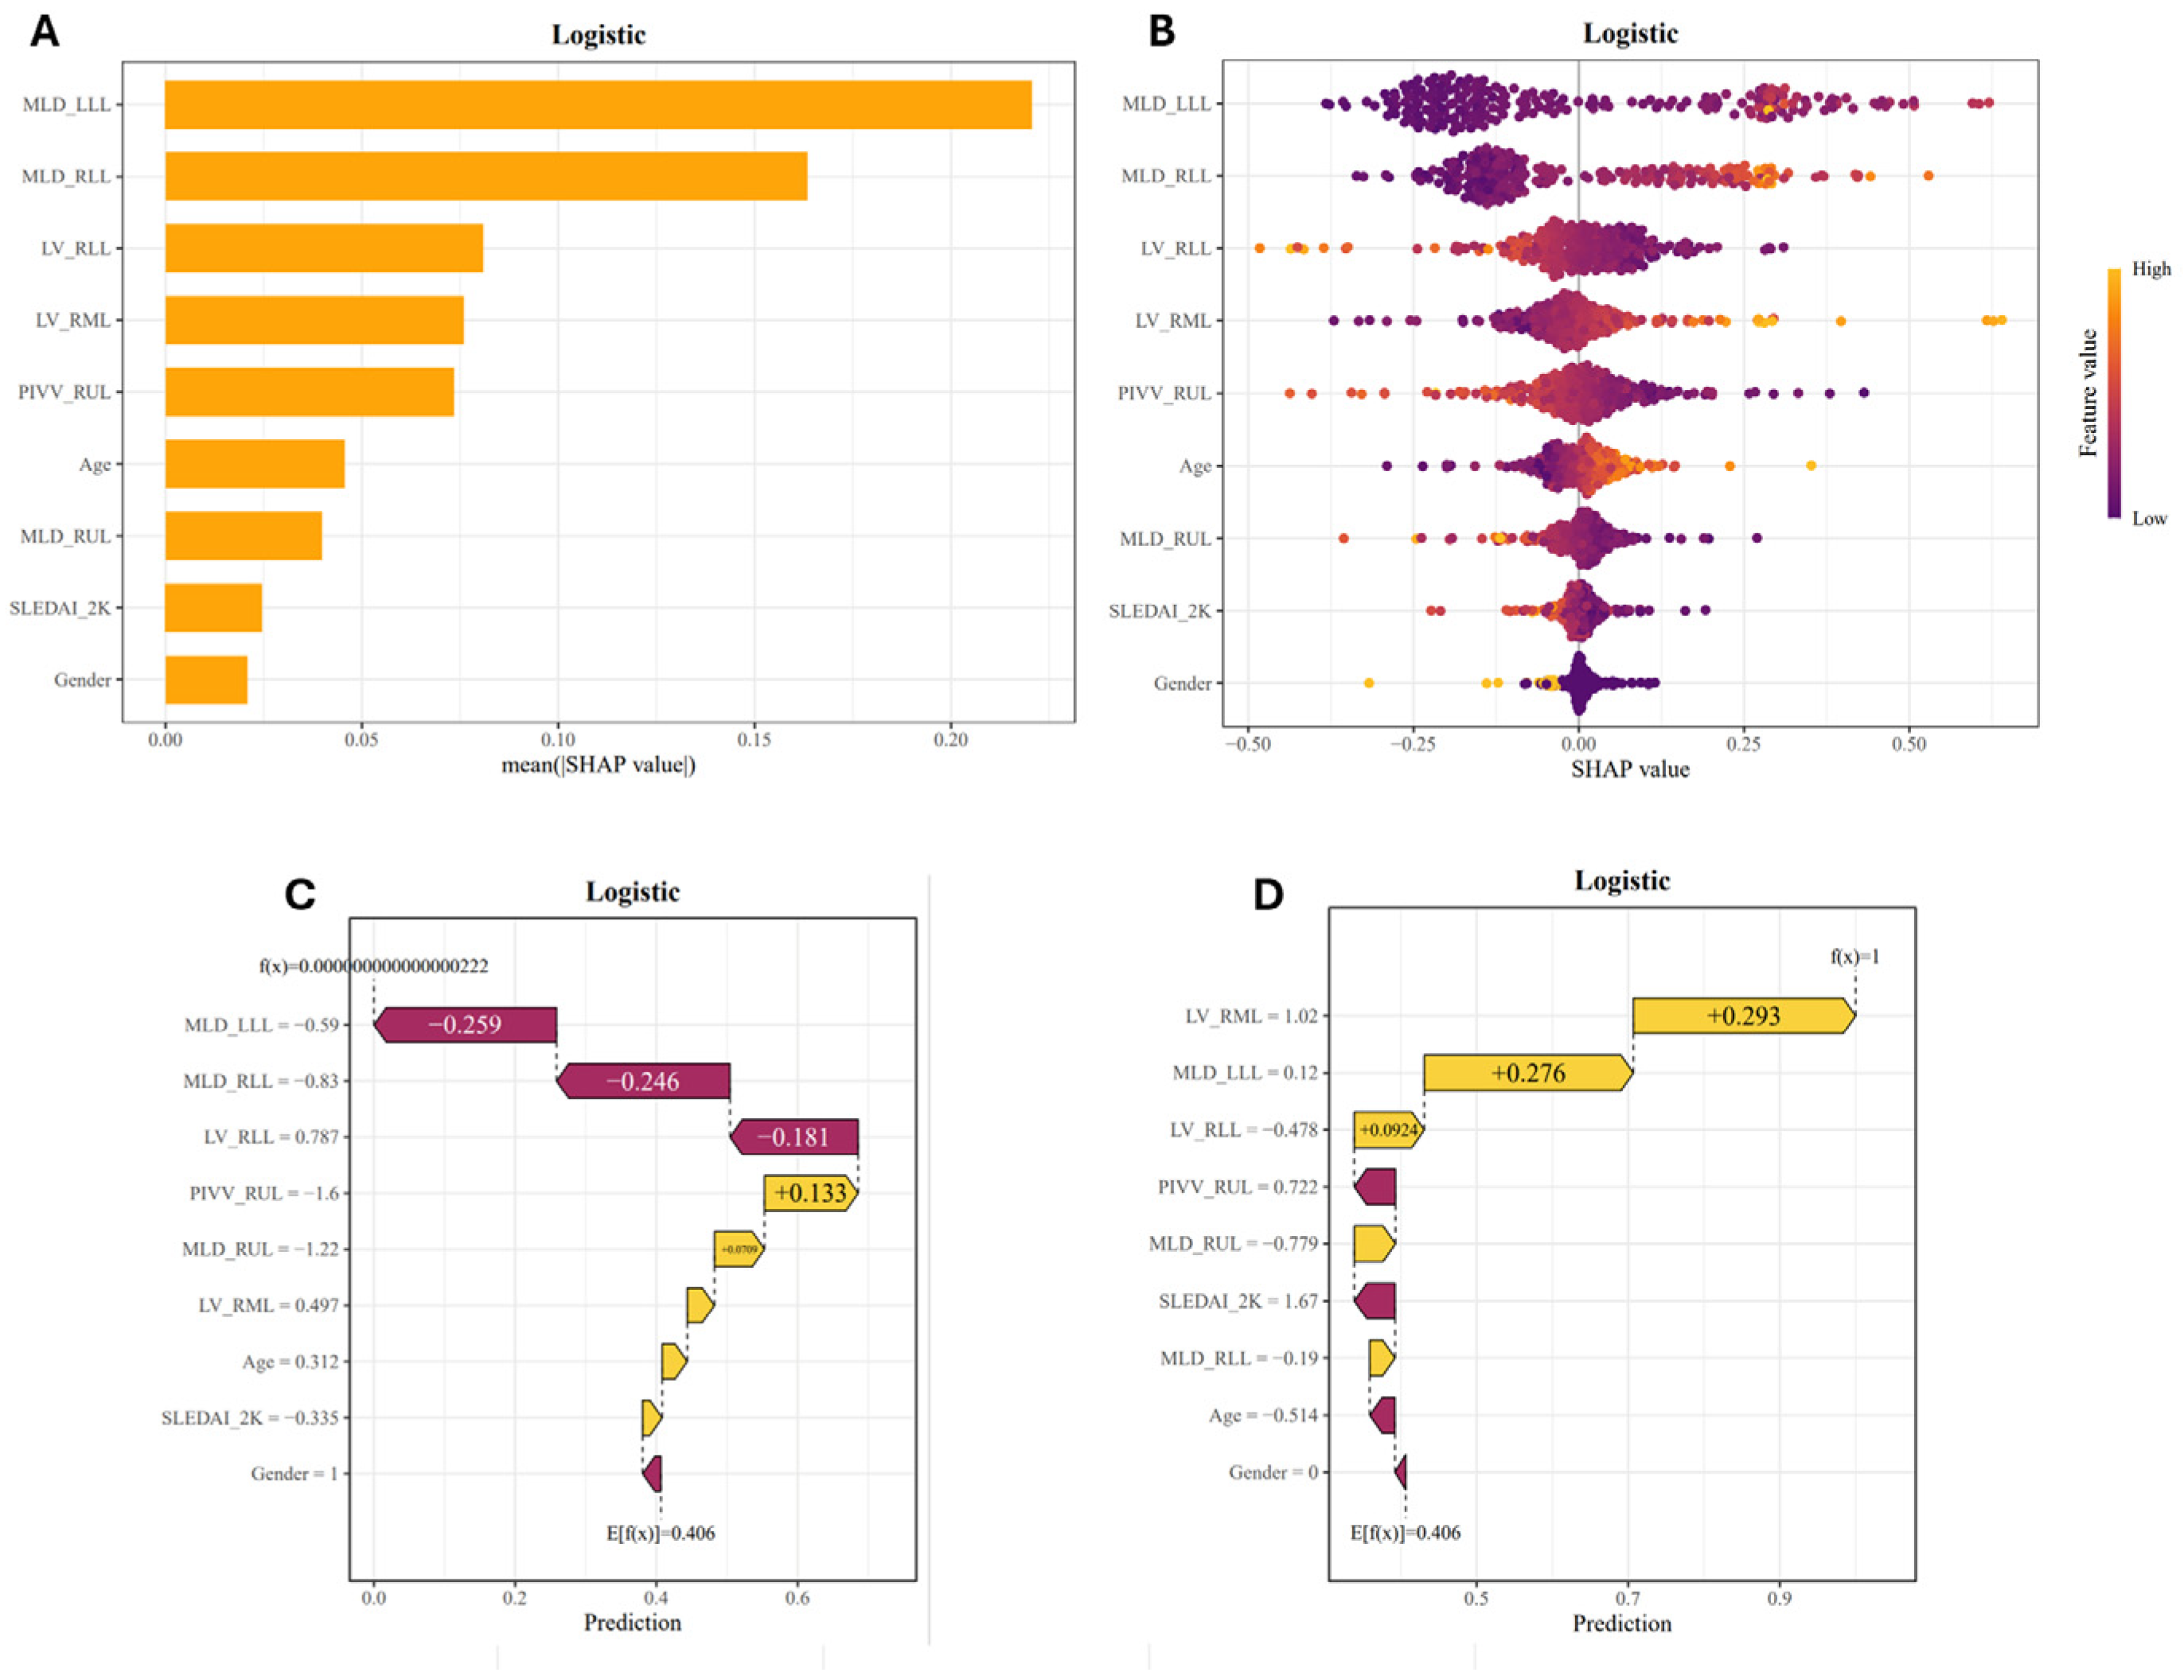
The final LR model was analyzed using SHAP to quantify feature contributions to model predictions at global and patient-specific levels. Global SHAP feature importance analysis identified MLD_LLL, MLD_RLL, LV_RLL, LV_RML, and PIVV_RUL as the top five influential features, with the SHAP beeswarm plot visualizing the direction and strength of their contributions. In the temporal test set, one correctly classified patient from each of the non-ILD and ILD groups was selected for visualization through SHAP waterfall plots. For the patient without ILD, the main negative contributions came from MLD_LLL (−0.259), MLD_RLL (−0.246), and LV_RLL (−0.181). For the patient with ILD, the major positive contributions were from LV_RML (+0.293), MLD_LLL (+0.276), and LV_RLL (+0.0924) (Figure 6). Additionally, Figure S3 illustrates the relationships between feature values and their corresponding SHAP values, while Figure S4 shows the correlations among predictors included in the final LR model.
Figure 6.
SHAP explanations of logistic regression predictions. (A) Predictor ranking according to mean absolute SHAP values, with larger values indicating greater overall feature importance. (B) SHAP beeswarm plot illustrating the direction and magnitude of feature contributions; each point represents a patient, and color indicates the corresponding feature value. Positive SHAP values increase the model output toward the ILD class, whereas negative values decrease it. (C,D) Patient-level waterfall plots from the temporal test set for patients correctly classified as non-ILD (C) and ILD (D), showing how individual features shift the model output from its baseline value.
3.5. Web-Based Diagnostic Calculator
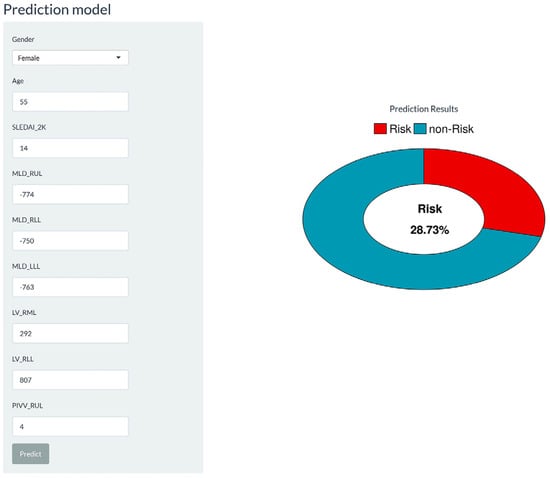
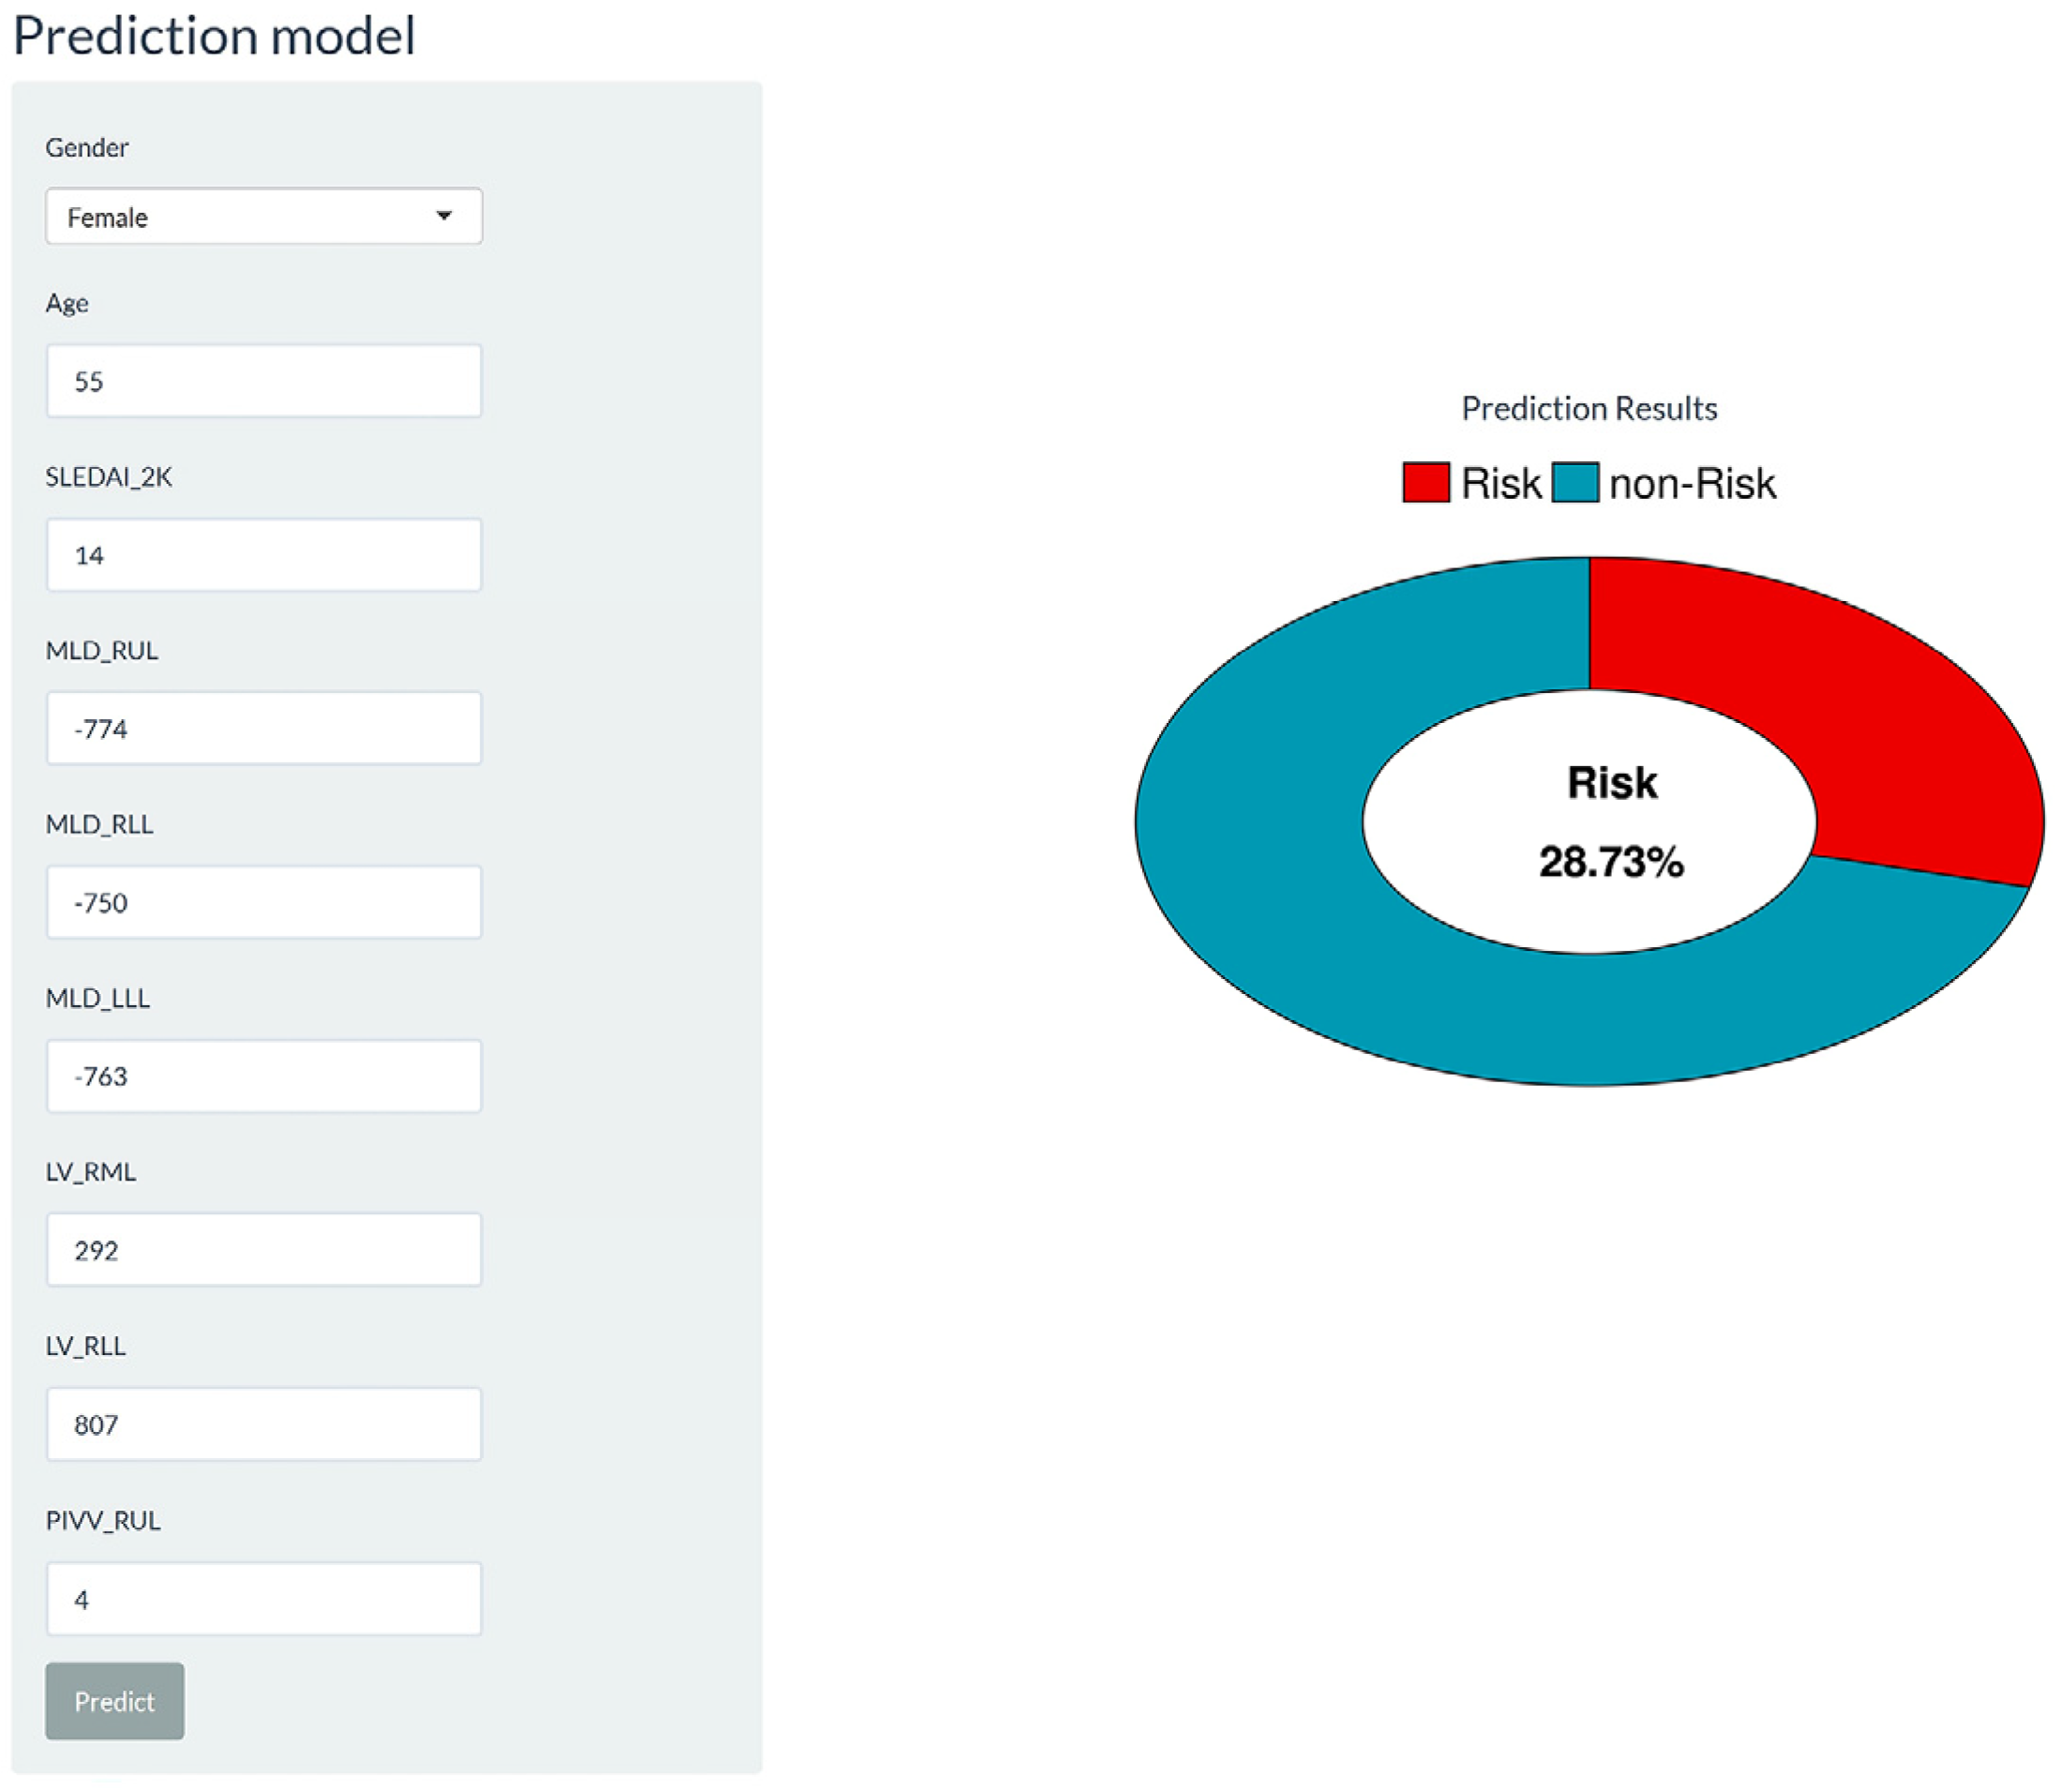
The final LR model was implemented as a web-based diagnostic calculator (Figure 7) incorporating the nine variables in the model and providing an individualized probability estimate for SLE-ILD in real time. This calculator has been deployed and is available at https://sleildcalc.shinyapps.io/workrun29/ (accessed on 15 August 2026).
Figure 7.
Web-based diagnostic calculator for individualized SLE-ILD probability estimation.
4. Discussion
This study demonstrated that quantitative CT parameters could be useful for evaluating pulmonary abnormalities in patients with SLE and identifying SLE-ILD. Among eight ML models developed using clinical variables and quantitative CT parameters, the LR model showed promising performance in classification and net benefit, supporting its potential as an objective tool for SLE-ILD detection.
Overall, the ILD group exhibited higher MLD and lower LV. Research suggests that ILD involves ongoing alveolar epithelial damage and abnormal repair, which gradually replaces healthy lung tissue with fibrotic connective tissue, including collagen deposition and myofibroblast activation [22]. These fibrotic changes may lead to increased lung attenuation, raising MLD values. Additionally, fibrotic remodeling and tissue contraction can distort lung architecture and reduce lung volume, consistent with the quantitative CT findings across the study population. However, as LV was not normalized for body size, the possibility that differences in body size contributed to the observed between-group differences in LV cannot be excluded. We also used an automated pulmonary vascular measurement module for three-dimensional visualization of the WL vascular tree and calculation of PIVV. In the ILD group, PIVV was reduced across the WL and all lobes, excluding RUL. This may reflect SLE-associated immune dysregulation, where immune-complex deposition in small pulmonary vessels activates complement and recruits inflammatory cells, causing vasculitis, vascular-wall edema, or luminal occlusion [23]. Fibrotic lung tissue may also exert traction on and disrupt adjacent capillary beds [24], and ventilation issues and hypoxia associated with fibrosis and peripheral airway effects can aggravate endothelial injury and pulmonary vascular abnormalities [25]. The lack of a significant difference in PIVV_RUL may be attributed to ILD’s primarily basal distribution [26], with greater basal vascular involvement potentially redistributing perfusion toward less affected regions [27]. However, PIVV is a structural volumetric index rather than a direct measure of pulmonary perfusion or pulmonary blood flow, and these potential mechanisms require further investigation and validation. Furthermore, although PIVV normalizes intrapulmonary vascular volume to lung volume, variations in lung volume may still influence this ratio. SLEDAI-2K scores showed no significant differences between groups, aligning with prior findings [28]. This indicates that a single systemic disease activity assessment may not fully reflect ILD presence. Nevertheless, SLEDAI-2K was included in the model as a candidate predictor to evaluate its potential complementary value for identifying SLE-ILD alongside quantitative CT parameters. Its selection through LASSO-based feature selection and subsequent inclusion in the model suggest that systemic disease activity may provide complementary information when combined with quantitative CT data, although it should not be regarded as a strong discriminator on its own.
Imaging-based assessment of SLE-ILD largely relies on conventional visual interpretation, which depends on reader expertise and is prone to intra- and interobserver variability [29]. Pulmonary function tests have been considered in ILD assessment but offer limited sensitivity [30]. Markers such as Krebs von den Lungen-6 and serum surfactant protein-A indicate epithelial injury and have been investigated for ILD diagnosis and prognosis. However, their levels are not specific to ILD, as they also increase during pulmonary infections [31]. Conversely, quantitative CT provides objective measurements of lung density and volume, as well as pulmonary vascular volume, providing more direct imaging data for identifying SLE-ILD [32]. In the slice-thickness sensitivity analysis, no statistically significant differences were observed in any of the 24 quantitative CT parameters between the 1.0-mm and 1.5-mm groups after adjustment for ILD status, age, and sex. It should be noted that this analysis was based on a between-group comparison involving different patients and therefore cannot establish the agreement of measurements across slice thicknesses. Nevertheless, these findings provide supplementary evidence for evaluating differences in quantitative CT parameters between groups with different slice thicknesses in the present cohort. Building on this, ML can combine multiple quantitative CT features with clinical variables to better use multidimensional information.
Among the eight candidate models, LR demonstrated the best overall performance, outperforming more complex nonlinear algorithms. Although LR also exhibited some calibration deviation in the temporal test set, the calibration slopes of more complex algorithms, including XGBoost, LightGBM, and CatBoost, showed greater deviations. This indicates that, given the current sample size, variable count, and feature structure, greater algorithmic complexity does not necessarily improve generalizability [33]. In the nested cross-validation sensitivity analysis, the LR model achieved an AUC of 0.919 (95% CI, 0.881–0.957), which was lower than the performance estimate obtained from the original training-set cross-validation, suggesting that the original estimate of internal performance may have been somewhat optimistic. Nevertheless, the LR model maintained good discriminatory ability, with an AUC of 0.919, under the more rigorous evaluation framework in which feature selection was incorporated into the cross-validation process. SHAP analysis enhanced model interpretability by revealing feature contributions both globally and individually [34]. The main contributing features were MLD_LLL, MLD_RLL, LV_RLL, LV_RML, and PIVV_RUL. Although MLD- and LV-related features were more prominent, PIVV also contributed pulmonary vascular insights. In some patients, conventional visual assessment may miss subtle or atypical lung density and volume abnormalities; therefore, combining pulmonary vascular parameters with lung density and volume measures offers a more comprehensive, objective imaging adjunct. Notably, some predictors in the LR model had nonsignificant regression coefficients. Because the model aims to predict rather than identify independent predictors, the statistical significance of individual variables in a multivariable model does not necessarily reflect their contribution to individual predictions. Accordingly, final model variables were selected via LASSO feature selection, without screening by the p-values of individual LR coefficients. The web-based diagnostic calculator translates the model into a practical tool by generating individualized SLE-ILD probability estimates based on patient-specific clinical and quantitative CT data, thereby facilitating interactive result presentation and further research on clinical implementation [35]. Overall, the developed model integrates clinical and quantitative CT data objectively and interpretably, supporting the identification of SLE-ILD.
Several limitations should be acknowledged. First, the retrospective, single-center design may be susceptible to selection bias. Although the temporal split allowed model evaluation in patients enrolled during a later period, both the training and temporal test sets were derived from the same institution. Therefore, this design cannot eliminate center-specific bias or establish external generalizability. Variations in scanners, protocols and imaging conditions may also have affected the quantitative CT measurements, despite the use of specified acquisition parameters. To further assess potential differences related to slice thickness, we performed a sensitivity analysis. However, because images reconstructed at different slice thicknesses from the same CT examination of an individual patient were unavailable, the agreement of measurements across slice thicknesses could not be established. In addition, no formal assessment of measurement reproducibility based on repeated measurements, including intraclass correlation coefficient (ICC) analyses for LV, MLD, and PIVV, was performed. Future studies should further evaluate the reproducibility of quantitative CT parameters through standardized CT acquisition and reconstruction protocols, paired reconstructions from the same patients, and repeated measurements. Second, because the final reference diagnoses were established through multidisciplinary discussion, inter-rater agreement was not formally assessed. Third, feature selection within the training set was not nested within the cross-validation process, potentially leading to information leakage. In addition, the relatively small training sample size may increase the risk of overfitting in complex machine learning models and affect model performance estimates and result stability. Fourth, the temporal test-set results were considered when selecting the final model, which may have introduced optimism into the reported performance estimates for this model. Independent multicenter validation involving different patient populations and CT acquisition protocols is needed to establish the generalizability and clinical applicability of the model.
5. Conclusions
In conclusion, quantitative CT provides an objective assessment of pulmonary involvement in SLE-ILD. Compared with patients with SLE without ILD, those with SLE-ILD showed lower LV and PIVV in the WL and most lobar regions, together with higher MLD in the WL and all lobes. The interpretable LR model combining clinical and quantitative CT data shows promising discriminatory performance. Furthermore, we developed an online calculator based on this model to facilitate the estimation of individualized SLE-ILD risk. Thus, this model may serve as an auxiliary tool for identifying SLE-ILD, although further validation in larger multicenter cohorts is warranted.
Supplementary Materials
The following supporting information can be downloaded at: https://www.mdpi.com/article/10.3390/diagnostics16223787/s1, Figure S1: Confusion matrices of the eight candidate models in the temporal test set (n = 93); Figure S2: Receiver operating characteristic curve of the final selected logistic regression model in the nested cross-validation sensitivity analysis performed in the training set; Figure S3: SHAP dependence plots of logistic regression predictions; Figure S4: Correlation heatmap of predictors in the logistic regression model; Table S1: Slice thickness sensitivity analysis of quantitative computed tomography parameters across lung regions; Table S2: Calibration slopes and intercepts.
Author Contributions
Conceptualization, Y.B., K.Y. and C.J.; methodology, Y.B., Y.Y., M.T., J.T., P.B., J.L., Y.L., K.Y., H.H., Y.Z., J.Z., L.Y. and C.J.; software, Y.B. and C.J.; validation, Y.B.; formal analysis, Y.B., Y.Y., M.T., J.T., S.Y., K.Y., L.H., H.H. and Y.Z.; investigation, Y.B., Y.Y., J.T., S.Y., P.B., J.L., Y.L., L.H., H.H., Y.Z., J.Z. and C.J.; resources, Y.B., J.T. and C.J.; data curation, Y.B., Y.Y., M.T., J.T., S.Y., K.Y., L.H., H.H., J.Z. and C.J.; writing—original draft preparation, Y.B. and Y.Y.; writing—review and editing, M.T., J.T., S.Y., P.B., J.L., Y.L., K.Y., L.H., H.H., Y.Z., J.Z., L.Y. and C.J.; visualization, Y.B.; supervision, L.H., J.Z. and C.J.; project administration, Y.B., J.T. and C.J.; funding acquisition, C.J. All authors have read and agreed to the published version of the manuscript.
Funding
This research was funded by the National Natural Science Foundation of China (grant number 82572322).
Institutional Review Board Statement
The study was conducted in accordance with the Declaration of Helsinki and was approved by the Ethics Committee of the First Affiliated Hospital of Xi’an Jiaotong University (approval No. XJTU1AF2026LSYY-0101; date of approval: 22 January 2026).
Informed Consent Statement
The requirement for written informed consent was waived by the Ethics Committee due to the retrospective nature of the study.
Data Availability Statement
The datasets presented in this article are not readily available due to patient privacy and ethical restrictions. Requests to access the datasets should be directed to the corresponding author.
Conflicts of Interest
Lingbei Yang is employed by Siemens Healthineers Ltd. The remaining authors declare no conflicts of interest. The funder had no role in the design of the study; in the collection, analyses, or interpretation of data; in the writing of the manuscript; or in the decision to publish the results.
References
- Amarnani, R.; Yeoh, S.-A.; Denneny, E.K.; Wincup, C. Lupus and the lungs: The assessment and management of pulmonary manifestations of systemic lupus erythematosus. Front. Med. 2021, 7, 610257. [Google Scholar] [CrossRef] [Scilit] [PubMed]
- Depascale, R.; Del Frate, G.; Gasparotto, M.; Manfrè, V.; Gatto, M.; Iaccarino, L.; Quartuccio, L.; De Vita, S.; Doria, A. Diagnosis and management of lung involvement in systemic lupus erythematosus and Sjögren’s syndrome: A literature review. Ther. Adv. Musculoskelet. Dis. 2021, 13, 1759720X211040696. [Google Scholar] [CrossRef] [Scilit] [PubMed]
- Jokerst, C.; Yaddanapudi, K.; Chaudhary, S.; Zamora, A.C.; Nagaraja, V. Imaging innovations in the screening, diagnosis, and monitoring of systemic autoimmune disease-related interstitial lung disease. EMJ Radiol. 2024, 5, 71–81. [Google Scholar] [CrossRef] [Scilit]
- Labaki, W.W.; Martinez, C.H.; Martinez, F.J.; Galbán, C.J.; Ross, B.D.; Washko, G.R.; Barr, R.G.; Regan, E.A.; Coxson, H.O.; Hoffman, E.A.; et al. The role of chest computed tomography in the evaluation and management of the patient with chronic obstructive pulmonary disease. Am. J. Respir. Crit. Care Med. 2017, 196, 1372–1379. [Google Scholar] [CrossRef] [Scilit] [PubMed]
- Richter, P.; Cardoneanu, A.; Dima, N.; Bratoiu, I.; Rezus, C.; Burlui, A.M.; Costin, D.; Macovei, L.A.; Rezus, E. Interstitial lung disease in systemic lupus erythematosus and systemic sclerosis: How can we manage the challenge? Int. J. Mol. Sci. 2023, 24, 9388. [Google Scholar] [CrossRef] [Scilit] [PubMed]
- Ryerson, C.J.; Adegunsoye, A.; Piciucchi, S.; Hariri, L.P.; Khor, Y.H.; Wijsenbeek, M.S.; Wells, A.U.; Sharma, A.; Cooper, W.A.; Antoniou, K.; et al. Update of the international multidisciplinary classification of the interstitial pneumonias: An ERS/ATS statement. Eur. Respir. J. 2025, 66, 2500158. [Google Scholar] [CrossRef] [Scilit] [PubMed]
- Raghu, G.; Remy-Jardin, M.; Richeldi, L.; Thomson, C.C.; Inoue, Y.; Johkoh, T.; Kreuter, M.; Lynch, D.A.; Maher, T.M.; Martinez, F.J.; et al. Idiopathic pulmonary fibrosis (an update) and progressive pulmonary fibrosis in adults: An official ATS/ERS/JRS/ALAT clinical practice guideline. Am. J. Respir. Crit. Care Med. 2022, 205, e18–e47. [Google Scholar] [CrossRef] [Scilit] [PubMed]
- Wells, A.U.; Walsh, S.L.F. Quantitative computed tomography and machine learning: Recent data in fibrotic interstitial lung disease and potential role in pulmonary sarcoidosis. Curr. Opin. Pulm. Med. 2022, 28, 492–497. [Google Scholar] [CrossRef] [Scilit] [PubMed]
- Dixon, G.; Thould, H.; Wells, M.; Tsaneva-Atanasova, K.; Scotton, C.J.; Gibbons, M.A.; Barratt, S.L.; Rodrigues, J.C. A systematic review of the role of quantitative CT in the prognostication and disease monitoring of interstitial lung disease. Eur. Respir. Rev. 2025, 34, 240194. [Google Scholar] [CrossRef] [Scilit] [PubMed]
- Cao, X.; Gao, X.; Yu, N.; Shi, M.; Wei, X.; Huang, X.; Xu, S.; Pu, J.; Jin, C.; Guo, Y. Potential value of expiratory CT in quantitative assessment of pulmonary vessels in COPD. Front. Med. 2021, 8, 761804. [Google Scholar] [CrossRef] [Scilit] [PubMed]
- Moslemi, A.; Kontogianni, K.; Brock, J.; Wood, S.; Herth, F.; Kirby, M. Differentiating COPD and asthma using quantitative CT imaging and machine learning. Eur. Respir. J. 2022, 60, 2103078. [Google Scholar] [CrossRef] [Scilit] [PubMed]
- Kline, A.; Wang, H.; Li, Y.; Dennis, S.; Hutch, M.; Xu, Z.; Wang, F.; Cheng, F.; Luo, Y. Multimodal machine learning in precision health: A scoping review. Npj Digit. Med. 2022, 5, 171. [Google Scholar] [CrossRef] [Scilit] [PubMed]
- Xue, Y.; Zhang, J.; Li, C.; Liu, X.; Kuang, W.; Deng, J.; Wang, J.; Tan, X.; Li, S.; Li, C. Machine learning for screening and predicting the risk of anti-MDA5 antibody in juvenile dermatomyositis children. Front. Immunol. 2023, 13, 940802. [Google Scholar] [CrossRef] [Scilit] [PubMed]
- Pahud de Mortanges, A.; Luo, H.; Shu, S.Z.; Kamath, A.; Suter, Y.; Shelan, M.; Pöllinger, A.; Reyes, M. Orchestrating explainable artificial intelligence for multimodal and longitudinal data in medical imaging. Npj Digit. Med. 2024, 7, 195. [Google Scholar] [CrossRef] [Scilit] [PubMed]
- Yang, K.; Chen, Y.; He, L.; Sheng, Y.; Hei, H.; Zhang, J.; Jin, C. Application of quantitative CT and machine learning in the evaluation and diagnosis of polymyositis/dermatomyositis-associated interstitial lung disease. Acad. Radiol. 2025, 32, 4871–4879. [Google Scholar] [CrossRef] [Scilit] [PubMed]
- Lin, F.; Zhang, Z.; Wang, J.; Liang, C.; Xu, J.; Zeng, X.; Zeng, Q.; Chen, H.; Zhuang, J.; Ma, Y.; et al. AutoCOPD—A novel and practical machine learning model for COPD detection using whole-lung inspiratory quantitative CT measurements: A retrospective, multicenter study. EClinicalMedicine 2025, 82, 103166. [Google Scholar] [CrossRef] [Scilit] [PubMed]
- Xu, W.-D.; Chen, Y.-Y.; Wang, X.; Su, L.-C.; Huang, A.-F. Development and external validation of a prediction model for interstitial lung disease in systemic lupus erythematosus patients: A cross-sectional study. Semin. Arthritis Rheum. 2024, 69, 152556. [Google Scholar] [CrossRef] [Scilit] [PubMed]
- Niu, Q.; Li, Q.; Chen, S.; Xiao, L.; Luo, J.; Wang, M.; Song, L. First nomogram for predicting interstitial lung disease and pulmonary arterial hypertension in SLE: A machine learning approach. Respir. Res. 2025, 26, 197. [Google Scholar] [CrossRef] [Scilit] [PubMed]
- Aringer, M.; Costenbader, K.; Daikh, D.; Brinks, R.; Mosca, M.; Ramsey-Goldman, R.; Smolen, J.S.; Wofsy, D.; Boumpas, D.T.; Kamen, D.L.; et al. 2019 European League Against Rheumatism/American College of Rheumatology classification criteria for systemic lupus erythematosus. Arthritis Rheumatol. 2019, 71, 1400–1412. [Google Scholar] [CrossRef] [Scilit] [PubMed]
- Petri, M.; Orbai, A.-M.; Alarcón, G.S.; Gordon, C.; Merrill, J.T.; Fortin, P.R.; Bruce, I.N.; Isenberg, D.; Wallace, D.J.; Nived, O.; et al. Derivation and validation of the Systemic Lupus International Collaborating Clinics classification criteria for systemic lupus erythematosus. Arthritis Rheum. 2012, 64, 2677–2686. [Google Scholar] [CrossRef] [Scilit]
- Travis, W.D.; Costabel, U.; Hansell, D.M.; King, T.E.; Lynch, D.A.; Nicholson, A.G.; Ryerson, C.J.; Ryu, J.H.; Selman, M.; Wells, A.U.; et al. An official American Thoracic Society/European Respiratory Society statement: Update of the international multidisciplinary classification of the idiopathic interstitial pneumonias. Am. J. Respir. Crit. Care Med. 2013, 188, 733–748. [Google Scholar] [CrossRef] [Scilit] [PubMed]
- Wynn, T.A. Cellular and molecular mechanisms of fibrosis. J. Pathol. 2008, 214, 199–210. [Google Scholar] [CrossRef] [Scilit] [PubMed]
- Li, Z.; Ma, J.; Wang, X.; Zhu, L.; Gan, Y.; Dai, B. The role of immune cells in the pathogenesis of connective tissue diseases-associated pulmonary arterial hypertension. Front. Immunol. 2024, 15, 1464762. [Google Scholar] [CrossRef] [Scilit] [PubMed]
- Chen, A.; Karwoski, R.A.; Gierada, D.S.; Bartholmai, B.J.; Koo, C.W. Quantitative CT analysis of diffuse lung disease. Radiographics 2020, 40, 28–43. [Google Scholar] [CrossRef] [Scilit] [PubMed]
- Shao, T.; Shi, X.; Yang, S.; Zhang, W.; Li, X.; Shu, J.; Alqalyoobi, S.; Zeki, A.A.; Leung, P.S.; Shuai, Z. Interstitial lung disease in connective tissue disease: A common lesion with heterogeneous mechanisms and treatment considerations. Front. Immunol. 2021, 12, 684699. [Google Scholar] [CrossRef] [Scilit] [PubMed]
- Palmucci, S.; Galioto, F.; Fazio, G.; Ferlito, A.; Cancemi, G.; Di Mari, A.; Sambataro, G.; Sambataro, D.; Zanframundo, G.; Mauro, L.A.; et al. Clinical and radiological features of lung disorders related to connective-tissue diseases: A pictorial essay. Insights Imaging 2022, 13, 108. [Google Scholar] [CrossRef] [Scilit] [PubMed]
- Garcia, A.R.; Vollmer, I.; Blanco, I.; San José Estepar, R.; Rodriguez-Chiaradía, D.A.; López-Meseguer, M.; Martin-Ontiyuelo, C.; Nardelli, P.; Hernandez-Gonzalez, F.; Bosacoma, A.; et al. Characterization of CT imaging-derived pulmonary vascular abnormalities associated with pulmonary hypertension in chronic lung disease. CHEST 2026, 170, 1232–1248. [Google Scholar] [CrossRef] [Scilit] [PubMed]
- Guo, A.; Chen, Y.; Liu, H.; Gao, S.; Huang, X.; Liu, D.; Zhao, Q.; Hong, X. Predicting and validating the risk of interstitial lung disease in systemic lupus erythematosus. Int. J. Med. Inform. 2025, 197, 105839. [Google Scholar] [CrossRef] [Scilit] [PubMed]
- Barnes, H.; Humphries, S.M.; George, P.M.; Assayag, D.; Glaspole, I.; Mackintosh, J.A.; Corte, T.J.; Glassberg, M.; Johannson, K.A.; Calandriello, L.; et al. Machine learning in radiology: The new frontier in interstitial lung diseases. Lancet Digit. Health 2023, 5, e41–e50. [Google Scholar] [CrossRef] [Scilit] [PubMed]
- Suliman, Y.A.; Dobrota, R.; Huscher, D.; Nguyen-Kim, T.D.L.; Maurer, B.; Jordan, S.; Speich, R.; Frauenfelder, T.; Distler, O. Brief report: Pulmonary function tests: High rate of false-negative results in the early detection and screening of scleroderma-related interstitial lung disease. Arthritis Rheumatol. 2015, 67, 3256–3261. [Google Scholar] [CrossRef] [Scilit] [PubMed]
- Ke, Y.; Zhu, Y.; Chen, S.; Hu, J.; Chen, R.; Li, W.; Liu, S. Clinical utility of circulating pneumoproteins as diagnostic and prognostic biomarkers in COVID-19: A systematic review and meta-analysis. Infect. Dis. Ther. 2022, 11, 1981–1998. [Google Scholar] [CrossRef] [Scilit] [PubMed]
- Anderson, C.M.; Singh, R.; Koo, C.W. Quantitative imaging for interstitial lung disease. Radiol. Cardiothorac. Imaging 2025, 7, e250041. [Google Scholar] [CrossRef] [Scilit] [PubMed]
- Hu, Y.; Zhang, X.; Slavin, V.; Belsti, Y.; Tiruneh, S.A.; Callander, E.; Enticott, J. Beyond comparing machine learning and logistic regression in clinical prediction modelling: Shifting from model debate to data quality. J. Med. Internet Res. 2025, 27, e77721. [Google Scholar] [CrossRef] [Scilit] [PubMed]
- Ponce-Bobadilla, A.V.; Schmitt, V.; Maier, C.S.; Mensing, S.; Stodtmann, S. Practical guide to SHAP analysis: Explaining supervised machine learning model predictions in drug development. Clin. Transl. Sci. 2024, 17, e70056. [Google Scholar] [CrossRef] [Scilit] [PubMed]
- Lentz, T.A.; Stephens, B.F.; Abtahi, A.M.; Schwarz, J.; Schoenfeld, A.J.; Rhoten, B.A.; Block, S.; O’Brien, A.; Archer, K.R. Leveraging web-based prediction calculators to set patient expectations for elective spine surgery: A qualitative study to inform implementation. BMC Med. Inform. Decis. Mak. 2023, 23, 149. [Google Scholar] [CrossRef] [Scilit] [PubMed]

Disclaimer/Publisher’s Note: The statements, opinions and data contained in all publications are solely those of the individual author(s) and contributor(s) and not of MDPI and/or the editor(s). MDPI and/or the editor(s) disclaim responsibility for any injury to people or property resulting from any ideas, methods, instructions or products referred to in the content. |
© 2026 by the authors. Licensee MDPI, Basel, Switzerland. This article is an open access article distributed under the terms and conditions of the Creative Commons Attribution (CC BY) license.