


Abstract
Background/Objectives: This retrospective benchmark evaluated scores for selecting regions of panoramic tooth segmentations for review. Methods: Three-member U-Net ensembles trained on UFBA-425 were evaluated on 590 held-out images and subsequently on 329 photographed radiographs. The original mixed-granularity pipeline comparison used the calibrated residual ensemble on 100 pediatric images. Cells in a 2 × 4 grid received regional mutual information (MI) scores but shared one whole-image soft Dice confidence (SDC) value. A lower Dice-risk area under the risk–coverage curve (AURC) indicated better ranking against source masks. Interaction tests, quality subset analyses, and prediction-positive sensitivity analyses were post hoc. Image-key bootstrap intervals may be too narrow for patient-level inference because patient independence was unverified. Results: The primary MI-minus-SDC AURC difference was +0.007 (95% confidence interval −0.033 to +0.041), leaving the comparison inconclusive. Subsequent evaluations were exploratory. Analyses of reference-positive cells (containing reference tooth pixels) received co-principal emphasis after outcomes were known. MI had a higher Dice-risk AURC than the replicated SDC in the pediatric main subset (+0.238) and the local SDC in AKUDENTAL (+0.157 residual, +0.134 ResNet18). When 20% of grid cells were reviewed, the mean maximum pixel probability (MSP) captured more error pixels than MI in seven of ten source/model comparisons, including both AKUDENTAL ensembles. On photographed radiographs, the MSP led by 15.73 percentage points for the residual ensemble and MI by 3.66 for ResNet18. For ResNet18, equal weighting of false-positive and false-negative capture favored MSP by 6.59 points. Conclusions: The primary comparison established neither superiority nor equivalence. Exploratory capture varied by source, model, and error mix.
1. Introduction
Artificial intelligence (AI)-based dental image analysis requires evaluation beyond segmentation overlap [1]. Public panoramic datasets include tooth masks, abnormalities and anatomical labels [2,3], but these targets are not interchangeable. Pediatric collections add developing and mixed dentitions, and their tooth structure and disease annotations are produced through different workflows [3]. A segmentation that agrees with a released mask is not necessarily clinically acceptable, and neither confidence nor uncertainty alone establishes that human review will be useful. Review prioritization is therefore a separate question: whether a score orders images or regions so that more of the measured disagreement with the released mask is examined first.
U-Net provides a segmentation architecture [4], ResNet18 a residual encoder [5], and nnU-Net a self-configuring baseline [6]. Panoramic methods have combined segmentation and identification, delineated tooth instances, and incorporated numbering or tooth state [7,8,9]. Nevertheless, a systematic review found substantial heterogeneity in datasets, annotations and metrics [10]. Restoration segmentation, practitioner-facing assessments and attention-based dental models have also used different tasks and reference protocols [11,12,13]. AKUDENTAL documents cross-dataset discrepancies in boundary definitions, missing labels and taxonomies [14], while the Dental Enumeration and Diagnosis on Panoramic X-Rays Challenge (DENTEX) and photographed radiographs broaden acquisition diversity [15,16]. Each source warrants testing against its own reference.
Medical-imaging and AI diagnostic-reporting guidance emphasizes reference provenance, applicability, and transparent evaluation [17,18]. Such guidance recommends describing the reference standard and annotation variability rather than assuming unquestioned ground truth [17]. Biomedical rankings can change with data, observers, metrics and aggregation [19]. Monte Carlo (MC) dropout and deep ensembles estimate predictive uncertainty [20,21], with epistemic and aleatoric components reflecting different sources of variation [22]. Temperature scaling addresses probability calibration [23], but segmentation studies and radiology reviews show that calibration, uncertainty, and image-level reliability are distinct and source-dependent [24,25,26,27]. A radiology review describes pixel- or voxel-level uncertainty maps as potential prompts for expert reevaluation [25], and segmentation uncertainty can appear calibrated after pooling yet remain unreliable for individual subjects [26]. High confidence therefore does not guarantee a correct mask, nor does uncertainty universally predict error.
Reverse Classification Accuracy uses other labeled images to assess an unlabeled test image [28]. Soft Dice confidence (SDC) scores whole-image binary segmentations for selective prediction [29]. Its theoretical analysis uses conditional-independence assumptions, and its image-level evidence does not establish regional dental performance. Surface-error detection and voxelwise confidence methods provide related approaches [30,31], while selective prediction supplies the risk–coverage framework [32]. Spatial aggregation can improve ranking in evaluated settings, but its performance remains dataset-dependent [33]. A regional adaptation of an image-level score therefore needs separate evaluation. Panoramic image regions can contain several teeth, partial teeth, or no reference foreground, so image-level confidence, regional difficulty, and tooth-level confidence are not equivalent quantities.
The review target is equally important. Dice and intersection over union (IoU) measure overlap [34,35]. Scores depend on the foreground size and the convention for two empty masks [36]. Boundary, topology, reference uncertainty, and aggregation can change a metric’s interpretation [36,37,38]. Metrics Reloaded recommends problem-aware selection that considers target size, boundary importance, and annotation uncertainty [38]. Dice-based risk and the fraction of misclassified pixels answer different questions, and reference-derived targets remain evaluation-only because an inference-time selector has no reference mask. A grid cell, a tooth, and a whole image are different review units, and equal item budgets do not imply equal reader effort.
This retrospective benchmark compared ensemble mutual information (MI) with conventional confidence scores, particularly mean maximum pixel probability (MSP), across source-specific tooth-foreground references. Residual U-Net and ImageNet-pretrained ResNet18 U-Net ensembles were developed on study-defined splits of UFBA-425 (UFBA) [39] and evaluated on the pediatric source family [3], AKUDENTAL [14], and a photographed-radiograph source [16]. It retained the original pediatric MI-versus-image-SDC comparison and separated later exploratory evaluations. Xu et al. modeled uncertainty at tooth boundaries during training [40]. Borges et al. evaluated SDC for whole-image selective prediction [29], and Guarino et al. pooled pixel uncertainty to detect image-level failures [33]. Cui et al. tested tooth masks on cone–beam computed tomography scans from external clinics [41].
Convolutional U-Nets remained competitive with newer architectures in a benchmark of three-dimensional medical image segmentation [42]. Cheng et al. tested domain generalization by training on one source and evaluating on unseen sources in separate experiments on retinal fundus images and prostate magnetic resonance images [43]. Zenk et al. compared uncertainty measures across five three-dimensional datasets and found that pairwise Dice agreement between ensemble predictions helped detect segmentation failures under distribution shift [44]. Barfoot et al. found that the loss function that most improved pixelwise calibration often reduced Dice overlap [45]. Here, exploratory analyses tested whether the review unit or the weighting of false positives and false negatives changed which score captured more error in the same predictions. This is computational prioritization, not a validated determination of which region a dentist should review or evidence of improved diagnosis, workload or patient safety.
2. Materials and Methods
2.1. Study Design, Sources and Reference Masks
Figure 1 summarizes the recorded three-stage chronology (Table S2). Stage 1 asked whether regional MI reduced the pediatric Dice-risk area under the risk–coverage curve (AURC) relative to replicated image-level SDC. Its local protocol described this question and fixed UFBA partitions and a selection partition rule for choosing the compact architecture before training and pediatric outcome calculation, and it used the selected residual ensemble as the retained primary comparison. Stage 2 introduced ResNet18 and AKUDENTAL after the original pediatric outcomes were known. Local records place its model, label, and evaluation decisions before AKUDENTAL predictions. Stage 3 comprised two distinct branches: a post hoc empty-region reanalysis of known earlier outcomes, and a separate photographed-source evaluation planned with those earlier outcomes already known. For the latter, local records describe fixing source eligibility, the frozen models, and the MSP-minus-MI 20% capture contrast before selected-source predictions while allowing for metadata and annotation schema inspection. The protocol version, recorded times, and hash evidence are detailed in Table S37. These records do not independently verify decision timing; no stage was preregistered or prospective, and the later evaluations remain exploratory.
Figure 1.
Chronology of source-separated benchmark: (a) compact-model development and pediatric evaluation; (b) later ResNet18/AKUDENTAL extension; (c) empty-region reanalysis and photographed-source evaluation. Fitting used UFBA-425 only. Arrows denote chronology, not external fitting. Stage 3 reused six frozen checkpoints and UFBA-425 temperatures. Empty-region branch followed known outcomes; photographed-source branch used locally recorded pre-inference protocol without external registration or time stamping. Both analyses are exploratory.
As shown in Figure 1, training, model selection, and temperature fitting used UFBA-425 only. External masks did not select checkpoints or temperatures. The sensitivity and interaction analyses in Section 2.4 were designed after the original and photographed-source results were available. They and the reporting emphasis on reference-positive evaluation were post hoc and exploratory, not amendments that changed the original hypothesis.
This study used publicly available radiographs and existing annotations, without recruiting participants or collecting new patient-linked data. No dentist or radiologist reviewed study masks or predictions, defined review units, or interpreted segmentation errors. The acknowledged dentists provided general information and advice only; clinician annotation by public data providers belongs to source creation, not participation in this benchmark.
Table 1 summarizes the retained sources and their roles. UFBA-425 supplied development data [39]; the two pediatric subsets form one source family [3]. AKUDENTAL provides tooth-instance labels [14]. The photographed-radiograph source comprises smartphone photographs of panoramic radiographs from Pioneer OPG X ray Centre, Sylhet, Bangladesh [16]. Patient-level linkage was not independently verifiable.
Table 1.
Retained sources, reference masks and development/evaluation roles.
As shown in Table 1, only UFBA-425 was partitioned for development, with 296 training, 31 selection, 32 calibration, and 64 internal-test images. The pediatric masks identify a single tooth class. Three dentists delineated the teeth in the 100 main images. The source gives neither annotator assignments for the 93 additional images nor an inclusion rule for developing teeth [3]. UFBA tooth instances were combined, and AKUDENTAL combined its 32 Fédération Dentaire Internationale (FDI) tooth categories, excluding restoration categories. Photographed-source binary masks retained provider boundaries. No source released repeat annotations, and no masks were clinically harmonized or reannotated. Partitioning and source conversion are detailed in Tables S1–S3.
Source conversion was intentionally source-local. The pediatric archive contributed 100 main and 93 supplementary external images; its original training/test folder names were not used to assign development roles. AKUDENTAL supplied 333 radiographs with Common Objects in Context (COCO)-instance annotations, while the photographed source supplied 329 paired Joint Photographic Experts Group (JPEG) images and Portable Network Graphics (PNG) masks from smartphone photographs of panoramic radiographs. The latter masks encoded background as zero and tooth foreground as one; source boundaries were preserved rather than altered to match pediatric or AKUDENTAL contours. UFBA category-stratified splitting followed source filename codes after two same-image discordant records were removed. The available metadata supported image/file allocation, not verifiable patient grouping [39]; distinct roles therefore did not establish patient-separated training, selection, calibration, or internal testing [17] (Tables S1–S3). The photographed release is licensed under Creative Commons Attribution 4.0 International (CC BY 4.0); its provider reports prior anonymization and no patient-personal information [16]. File metadata and illustration checks are documented in Table S37. No patient-linked clinical records were obtained.
2.2. Models, Preprocessing and Calibration
Images and reference masks were mapped to a 256 × 256 canvas by aspect ratio-preserving letterboxing. For elongated released panoramas, the non-padded image height can be well below 256 pixels; the remaining rows contain no anatomical information. Image interpolation was linear; reference interpolation was nearest-neighbor. A geometric validity mask excluded padding. Intensities were scaled to [0, 1]; ResNet18 repeated grayscale inputs into three ImageNet-normalized channels. Native-space checks cropped probabilities to the content rectangle, projected them linearly to released dimensions and thresholded at 0.5. Native space denotes released pixels, not calibrated physical coordinates. Square resizing was an evaluation-only geometry sensitivity (Tables S4 and S68); the paired geometry comparison used the native Dice, not review-score contrasts.
Before model input, dimensions and masks were checked against the released files, and original files were left untouched. Standard grayscale decoding handled eight-bit files directly; four unsigned 16-bit pediatric files were converted by dividing intensities by 257 and nearest-integer rounding, without per-image range stretching. Inputs were then divided by 255. No histogram equalization or contrast enhancement entered the standard pipeline. For inverse projection, only the content rectangle was cropped from the canvas; the probability map, rather than a thresholded mask, was linearly resized back to released dimensions and thresholded there. This is a coordinate round trip, not recovery of physical acquisition geometry. A byte-level audit found agreement for 289 cached inputs used by the extension (Table S4).
Three independently seeded members (17, 29 and 43) formed each retained residual U-Net and ImageNet-initialized ResNet18 U-Net ensemble [4,5,21]. The ResNet18 configuration is a model comparator, not a reference standard; reference masks are the source-derived evaluation targets. Training minimized valid-pixel binary cross-entropy plus soft-Dice loss; checkpoint selection used the mean Dice on the separate selection partition. Training budgets and initialization differed, so this was not an isolated pretraining comparison (Tables S5, S6 and S69). Training and evaluation used central processing unit (CPU) hardware. nnU-Net [6] was not trained because the required graphics-processing hardware was unavailable; review-score comparisons are conditional on these two compact configurations.
Within each training stage, checkpoints were selected using only the UFBA selection partition; the later ResNet18 extension was introduced after earlier outcomes were known. The compact models used five feature levels; the residual version added within-block skip connections and deeper-encoder dilation, whereas the ResNet18 extension used an ImageNet-initialized ResNet18 encoder with a U-Net decoder. Augmentations transformed images, masks and validity masks jointly for geometry, while intensity changes affected images only. At each seed, an unaugmented selection pass at threshold 0.5 updated a checkpoint only when the mean image Dice improved by more than 0.00001. The residual family was retained from the initial architecture comparison, and all three retained runs entered the ensemble. Selection scores were development diagnostics, not held-out estimates (Tables S5, S6 and S69).
After checkpoint selection, each ensemble underwent temperature scaling [23]. A positive temperature shared by its three members minimized the negative log-likelihood (NLL) of the ensemble mean on valid pixels sampled from the 32 UFBA calibration images (Table S7). Calibration did not alter network weights. Member probabilities were first converted to logits, each logit was divided by the shared temperature, and the transformed probabilities were averaged; averaging logits would define a different procedure. External transfers kept network weights and fitted temperatures fixed. The fitted transform was applied to letterboxed external inputs and the square geometry sensitivity without refitting. Raw-versus-scaled variants recomputed review scores using each variant’s own thresholded errors; source-target-fitted temperatures required held-out reference masks and were post hoc diagnostics only, not deployable recalibration (Table S7).
Held-out probability measurements were evaluated against the source-specific binary reference on valid pixels. NLL used binary cross-entropy, and the Brier score used the squared difference between the foreground probability and reference indicator. The expected calibration error (ECE) compared the mean foreground probability with the observed foreground frequency in 15 equal-width probability bins, weighted by bin occupancy. Source-level NLL, Brier and ECE summaries averaged the individual-image measurements; they were not computed by pooling all source pixels into one image. The supplementary reliability curves instead pooled valid pixels within bins (Table S73; Figure S7). This difference matters when interpreting a plotted calibration curve alongside a mean per-image ECE. Fitting-set NLL improvement was not counted as a held-out improvement. Scaled-minus-unscaled changes used 2000 paired image–key draws (seed: 20261031; Table S61), resampling each image’s metric vector in both variants. Nominal 95% percentile intervals condition on fixed checkpoints and temperatures; they do not propagate calibration-fit uncertainty or unidentified patient dependence.
2.3. Review Scores, Units and Outcomes
MI was the entropy of the ensemble mean minus the mean member entropy, summarized by the upper pixel decile; higher values were reviewed first. MSP averaged the larger binary class probability; lower values were reviewed first. SDC compared probabilities with the thresholded prediction, not the reference [29]: , with h = 1[q ≥ 0.5] and q = clip(p,10−7,1 − 10−7). Here, p is the ensemble-mean foreground probability; sums cover valid content pixels of the scoring domain, excluding padding. For regional error-pixel capture, MSP represents conventional confidence, and local SDC is a secondary cell-level comparator. Replicated-image SDC ranks images and assigns the same value to all eight cells in each image. Additional baselines included predictive entropy, the above-quantile average for the foreground ratio (QFR) applied to entropy, and a Moran-weighted spatial MI mass ratio (MOR) [33]. Tables S8 and S70 use the short name “quantile foreground ratio” for the QFR.
The original pediatric comparison used MI to test whether disagreement flags regions of higher Dice risk. Members sharing data, architectures and training procedures can make the same error despite different random seeds. Image-level SDC measures overlap between soft and thresholded masks, aligning it with the Dice-risk endpoint. Replication prevents within-image localization. Local SDC can rank cells within an image but assigns zero to every empty prediction. For later regional comparisons, MSP measured conventional confidence on the same cells using only the mean probability map. Confident background can dilute focal uncertainty in this average. Binary mean margin ranks cells identically to MSP. None directly estimates clinical error probability.
The entropy comparators tested sensitivity to pixel selection. When all members assign a pixel a foreground probability of 0.5, entropy is maximal and MI is zero. The mean entropy summarizes diffuse ambiguity, while the upper decile emphasizes focal uncertainty. Predicted-foreground entropy reduces background dilution but excludes false-negative tooth pixels. The QFR uses the predicted-foreground fraction to select an entropy tail across all valid pixels, making it sensitive to errors in the predicted tooth area. MOR weights spatially clustered disagreement but depends on the neighborhood and returns zero for zero MI mass (Tables S8 and S70).
Operationally, score generation stopped at the prediction maps: padding was removed before aggregation, and each image or region received a scalar under the same validity support. A single deterministic member has no ensemble disagreement (MI = 0), so single-member comparisons used MSP; the two-member subsets retained MI. Reference masks did not enter operational grid-score generation. Retrospective anatomical and sensitivity analyses used references to define evaluator-side units, populations, or targets, as well as evaluation labels (Table S8).
With no thresholded foreground, clipped probabilities make local SDC zero; lower SDC is reviewed first. The helper returns one only for an exact zero denominator, unreachable in nonempty clipped domains. This differs from jointly empty reference/prediction (Dice = 1) (Table S8). Empty predictions can miss teeth. Post hoc prediction-positive and reference-positive capture used fixed scores, 20% of eligible cells and their own error denominator, with 2000 shared image-key draws (seed: 20261101; Tables S89 and S90). Neither filter is a clinical skip rule. Two-member stability pairs shared one trained member, so agreement was not independent replication.
The standard 2 × 4 grid partitioned image content into eight non-overlapping technical units; the 8 × 8 AURC contrasts were purely descriptive point diagnostics, without paired intervals or a score-by-grid test, and do not support the central ranking claim (Table S26). Grid cells are not teeth. Post hoc tooth territories assigned each content pixel to its nearest reference FDI tooth and were combined into sextants in the two sources with numbered instances. These reference-derived units are retrospective and unavailable at inference. Poor-unit flagging used technical Dice cutoffs of 0.5 and 0.7, not clinically validated acceptability thresholds (Tables S9 and S42–S45).
In the post hoc anatomical analysis, each native FDI instance was transformed into the scoring space with the mask geometry, and a Euclidean distance transform assigned every content pixel to the nearest tooth. Thus, each territory retained its tooth foreground plus its adjacent background where false positives could occur; territories were then grouped into six FDI sextants. The union of transformed instances reproduced the binary reference. Score definitions, temperatures, the threshold, the budget, and the tie rule were unchanged; only the scoring unit and within-unit aggregation changed (Tables S9 and S42–S45).
The binary prediction threshold was 0.5. Dice risk was one minus the regional Dice; pixel-error risk was the false-positive-plus-false-negative fraction of valid pixels. Jointly empty regions received Dice = 1 and zero risk; one-sided errors were retained. All-region Dice risk is a technical benchmark, not a clinical target. Area under the risk–coverage curve (AURC) summarized retained risk, with lower values preferable for a fixed population. The original primary AURC used the archived discrete-rank mean; extension analyses used continuous expected-random-order ties. Absolute areas from these conventions were not pooled (Tables S10 and S71).
Risk calculations were performed per image and region before aggregation, rather than from a single pooled foreground count. The four mutually exclusive region foreground-occupancy categories were jointly empty, false-positive-only, missed foreground, and both positive. A post hoc normalized ranking gain was computed as (mean risk − AURC)/(mean risk − oracle AURC), comparing each score with mean-risk random ordering and oracle ordering. Bootstrap contrasts carried all regions from a sampled image together and paired the same image keys across scores, rather than treating regions as independent. These rules separate convention-driven mean-risk shifts from within-population AURC performance (Tables S10–S12). Table S55 reports paired MSP − MI contrasts before and after joint-empty exclusion, not a test of their change.
Error-pixel capture was the fraction of each model’s own source-mask disagreement contained in the units reviewed first. Budgets of 10%, 20% and 30% counted items, with fractional allocation at tied boundaries in the extension; they did not count image area, reader time or correction effort. Reference masks defined retrospective evaluation targets, never inference-time review scores.
For capture, the numerator sums source-mask error pixels inside the reviewed units, and the denominator sums error pixels over all eligible units for the same model, source, and evaluation condition. Uniform random selection at a given item fraction has the same expected error fraction, providing the reference line in capture plots. Each false-positive or false-negative pixel has unit weight: a broad background false-positive area can contribute more than a small tooth omission, even if the latter is clinically more consequential. Capture therefore measures localization of source-mask disagreement at a fixed item budget, not dental-review need, clinical severity, or correction effort.
The pediatric primary compared regional MI with replicated image-level SDC using the calibrated residual Dice-risk AURC; negative MI-minus-SDC favored MI. No equivalence margin was prespecified, and no equivalence test was performed. Pediatric and AKUDENTAL reference-positive Dice-risk evaluations receive co-principal exploratory emphasis chosen after outcomes, not prespecified co-primary status. Eligibility requires source-reference foreground, irrespective of prediction. The photographed ResNet18 MSP-minus-MI 20% capture contrast remains principally exploratory, with both models reported. ResNet18 was an analyst-chosen reporting priority, carrying the earlier ImageNet-initialized encoder comparator forward, not replacing the residual pediatric primary or designating the best-transfer model. No source-blind superiority-based selection rule is documented; 20% was the middle technical item budget; positive MSP-minus-MI favors MSP. Local records permitted eligibility/schema inspection but cannot independently verify pre-outcome timing or source-blind selection; no optimal clinical budget is claimed.
2.4. Sensitivity Analyses, Statistics and Reproducibility
Further post hoc diagnostics covered geometry, reference scope, risk and empty-region populations, resolution, mask quality, ensemble membership, temperature transfer, reference-label conventions and false-positive (FP) and false-negative (FN) pixel capture. Subtype capture kept scores and queues fixed (Tables S83 and S84). Resolution checks comprised model-free round trips and one-seed-17 ResNet18 retraining at 512 pixels; no 512-pixel ensemble ranking was tested. Native-Dice cutoffs were post hoc. Seed subsets, test-time augmentation (TTA), and residual-model MC dropout reused frozen checkpoints; ResNet18 lacked dropout layers. TTA and MC dropout probe sensitivity to the chosen image transformations and dropout masks, respectively, at the cost of repeated inference. Details are in Tables S11, S33–S68 and S74–S81 and Figures S12–S16.
Post hoc resolution and quality analyses were evaluation-only. In the model-free round trip, a released reference was letterboxed into the scoring space, projected back from the content rectangle, and thresholded; the resulting native overlap measures interpolation-, projection-, and threshold-specific reference-resampling sensitivity, not a universal mathematical upper bound or a trained prediction. The operation was applied to numbered teeth; narrow gaps were defined by the morphological closing of the native reference. The one-seed-17 ResNet18 member was retrained at 512 × 512 with unchanged settings, without an ensemble. Native-Dice cutoffs of 0.70 and 0.80 were chosen after outcomes for stratified capture, so these analyses describe conditional robustness and cannot be read as preregistered thresholds (Tables S46–S50 and S76).
The post hoc reference-label analysis included a non-clinical visual check of 48 randomly sampled pediatric images (24 per subset), without dentist or radiologist review. It was applied after prediction generation and never fed back into the inference, checkpoint choice, temperature fitting, or score construction. The contour-band variant excluded pixels within one scoring pixel on either side of the released boundary. The disputed-structure variant excluded sufficiently large eight-connected components (an area of at least 20 pixels and a maximum interior Euclidean distance to the background of at least 2 pixels) that were either foreground-missed by both ensembles or foreground-predicted by both but absent from the reference; combined, eroded and dilated variants were then evaluated with the same predictions and a 2 × 4 grid. Ignored pixels were removed from Dice, error, and capture denominators, and Dice = 1 was retained only when neither non-ignored reference foreground nor predicted foreground remained. Because disputed structures were defined by model agreement, these conditions probe target sensitivity rather than correct annotations or provide independent adjudication (Tables S64–S67 and S81).
Archived image-key intervals retain conventions (Table S12). New post hoc interactions used 5000 paired draws (seed 20261102) across scores, models, risks and populations within sources. MSP-minus-MI advantages underwent difference-in-differences using normalized gain and 20% capture. Nominal 95% percentile intervals and centered two-sided bootstrap p-values accompanied Holm correction over 40 new tests (Tables S85 and S86), not prior exploration. Intervals resample image keys, not verified patients; they may be anticonservative for patient-level inference. The pediatric subsets form one source family.
Computational checks covered source conversion, checkpoint predictions, numerical summaries, and rendered outputs (Table S13). The application passed 65 release tests. The archived application environment included Python 3.12.3, PyTorch 2.14.1+cpu, torchvision 0.29.1+cpu, NumPy 2.5.3, pandas 3.0.6, SciPy 1.18.1, scikit-learn 1.9.1, and Matplotlib 3.11.2. The OpenCV package was opencv-python-headless 5.0.0.93. The extension environment also included segmentation-models-pytorch 0.5.0. Further software details are provided in Tables S4 and S13. These engineering and visual checks did not include expert adjudication or a reader study. Code, archived predictions, individual measurements, and independent addenda are described in the Data Availability statement. Numerical result displays use at most three decimal places; exact implementation constants and unrounded analysis records are retained for reproducibility. Reporting was assessed against the Checklist for Artificial Intelligence in Medical Imaging (CLAIM) 2024 Update [17]; the completed 44-item checklist is supplied separately, with named locations and explanations for unreported or inapplicable items. The author used ChatGPT (GPT-6.1 Sol, OpenAI) to assist with manuscript drafting, English-language editing, and stylistic refinement.
A post hoc CPU latency benchmark used the frozen three-member ensembles at 256 × 256 pixels with a batch size of 1. After five warm-up runs per family, 50 real radiographs (10 from each held-out source/subset) were processed five times in randomized image/model order. A monotonic wall clock separately timed local decoding/preprocessing, three-member prediction, and fixed-temperature application, review-score generation, and native-mask projection. No reference masks or accuracy outcomes entered the timed path. Model loading was measured separately and excluded from per-image latency. The virtualized Intel Xeon host (Intel Corporation, Santa Clara, CA, USA) reported 2.50 GHz and six logical processors; PyTorch 2.14.1+cpu used three intra-operation threads and one inter-operation thread. Table S82 and the independent runtime addendum report the platform, timing scope, dispersion, and batch condition checks; timing did not replace archived outcome analyses.
3. Results
3.1. Source-Separated Segmentation
Table 2 summarizes the standardized Dice values in all held-out sources. Calibration images were excluded, and each source retained its own tooth-foreground reference. Full overlap, boundary and photographed-source summaries are presented in Tables S14, S38, S39 and S72.
Table 2.
Standardized mean image Dice by held-out source.
As shown in Table 2, both ensembles had their highest Dice values internally. ResNet18 improved pediatric overlap but not AKUDENTAL overlap and transferred poorly to the photographed source. Its photographed standardized/native mean Dice was 0.429/0.433, compared with 0.684/0.689 for the residual ensemble. A review score therefore cannot compensate for poor absolute segmentation.
Figure 2 shows provider contours and model disagreements in median-nearest UFBA and pediatric examples.
Figure 2.
Median-nearest tooth-foreground examples: (a–c) UFBA internal test and (d–f) pediatric main subset. Columns show provider contour, residual U-Net, and ResNet18 U-Net. Yellow marks reference; green, magenta, and blue mark true-positive (TP), false-positive (FP), and false-negative (FN) pixels. Displayed Dice uses released-image coordinates, not standardized cohort means. Selection targeted each subset’s median residual Dice (Table S15). Source images/masks: UFBA-425, CC BY 4.0 [39]; pediatric main dataset, CC0 [46]. Pediatric L marker is part of released image. These are non-clinical illustrations.
As shown in Figure 2, the pediatric example shows more missed foreground for the residual model; the internal example shows similar overlap.
3.2. Retained Pediatric Primary Comparison
Table 3 reports the original calibrated residual-ensemble MI-versus-replicated-image-SDC comparison in 100 pediatric images and 800 regions. This is a mixed-granularity pipeline comparison, not an isolated comparison of region-level scores; the regional-SDC companion did not replace it.
Table 3.
Retained original all-region Dice-risk comparison in main pediatric subset.
As shown in Table 3, the primary MI-minus-SDC AURC difference was +0.007, with a 95% confidence interval (CI) of −0.033 to +0.041. The comparison was inconclusive: the interval is compatible with either score having a lower AURC and is not evidence of equivalence. The 93-image supplementary pediatric subset had the same point estimate direction but is part of the same source family, not an independent replication (Table S17; Figure S8).
All performance confidence intervals and the tests yielding Holm-adjusted interaction p-values used image keys as the bootstrap unit. Patient-level sensitivity analysis was infeasible because image-to-patient linkage could not be verified. Each contrast was estimated within a single source family, precluding a source-family sensitivity analysis. If the same patient contributes multiple correlated images, the intervals may be anticonservative (too narrow) for patient-level inference.
With co-principal exploratory emphasis, 577 reference-positive cells in the same 100 pediatric images gave a MI-minus-replicated-image-SDC ΔAURC of +0.238 (95% CI +0.210 to +0.264), favoring SDC (Table S18). The 93-image subset showed +0.237 (+0.196 to +0.270), without independent replication. These archived discrete-rank contrasts concern source-defined cells; reporting priority changed after outcomes. The all-region local-SDC companion retained an AURC of 0.280 and an ΔAURC of −0.014 (−0.048 to +0.022), not a replacement primary. Crossed curves do not identify clinical budgets (Figure S8).
3.3. Exploratory Grid and Anatomical-Unit Review
AKUDENTAL capture used 2664 cells from 333 images and each model’s own false-positive-plus-false-negative denominator. Table 4 summarizes the MSP, MI, and local SDC across sources; all nine AKUDENTAL scores are presented in Table S20.
Table 4.
Exploratory cross-source summary of error-pixel capture at 20% all-region item budget.
In AKUDENTAL, MSP captured more error pixels than MI for both ensembles: MI captured 38.73% and 43.37%, versus 52.51% and 54.61% for MSP in the residual and ResNet18 models. Original paired MI-minus-MSP differences (Table S22) were −13.79 points (95% CI −15.36 to −11.93) and −11.24 points (−12.74 to −9.71). The anatomy-based results are presented below; complete budget and score contrasts are presented in Tables S20–S22. The post hoc prediction-positive analysis retained 1676 cells with predicted tooth foreground for the residual ensemble and 1732 for ResNet18 (Table S89). Reviewing 20% of these eligible cells captured 5.699% of their error pixels with local SDCs of 27.793% with MI and 35.459% with MSP for the residual ensemble. For ResNet18, the corresponding capture rates were 3.926%, 29.385% and 36.945% (Table S90). The excluded 988/932 cells included 64/33 missed-foreground cells and removed 1742/462 FN pixels (0.407%/0.106% of original errors). These missed pixels preclude treating empty predictions as safe to skip. Even after excluding prediction-empty cells, local-SDC capture remained below the 20% expected from random review. MI’s higher capture than local SDC alone provides no evidence of superiority over conventional confidence. In the direct comparison, MSP captured a larger share of eligible error pixels than MI for both ensembles.
In AKUDENTAL, co-principal exploratory reference-positive evaluation retained 1698 of 2664 cells (333 images). The MI-minus-local-SDC Dice-risk ΔAURC favored local SDC: residual: +0.157 (95% CI +0.135 to +0.180); ResNet18: +0.134 (+0.110 to +0.157) (Table S74; Figure S9). The all-region MI advantage did not persist. Pixel-error–risk contrasts remained MI-favorable (−0.044/−0.048), a distinct target. Restriction excludes jointly empty and false-positive-only cells and defines no clinical routing rule. Archived intervals pair scores, not populations (Table S88).
3.4. Exploratory Photographed-Source Evaluation
Figure 3 shows two photographed-source examples selected separately near each model’s native-Dice median. The 329-image source was evaluated without new fitting or exclusions; duplicate checks do not prove patient independence (Table S37).
Figure 3.
Native-pixel photographed-source examples [16] (CC BY 4.0). Case A ((a–c); img165) was nearest ResNet18 median native Dice; Case B ((d–f); img389) was nearest residual median. Columns show source/provider contour, ResNet18, and residual predictions. Green, magenta, and blue denote true-positive (TP), false-positive (FP), and false-negative (FN) pixels. Frozen temperature scaling preceded averaging and native projection. Selection was post-outcome-descriptive, not preregistered; neither case represents both distributions. Source masks are not harmonized clinical ground truth. Display resizing and study-generated overlays are adaptations; attribution and license terms are provided in the Data Availability Statement and Table S37.
As shown in Figure 3, the two configurations produce different patterns of missed and excess foreground relative to the provider masks. The model-specific median examples are descriptive and do not explain the cohort-level score rankings.
The photographed-source FP/FN analysis retained fixed regional queues (Tables S83 and S84). At 20%, the MSP-minus-MI was +20.457 percentage points for ResNet18 FP pixels but −7.281 for FN pixels; residual contrasts favored MSP for both (+15.466/+19.638). ResNet18’s 86.962% FN share and the residual model’s 93.624% FP share weighted these contrasts unequally. With equal-type weights, both contrasts favored MSP (+6.588/+17.552, ResNet18/residual). The reversal reflects both type-specific ordering and error composition, not a general MI advantage. Distinct source-mask error sets prevent causal or clinical inference.
Figure 4 presents the principal exploratory 20% MSP-minus-MI capture contrast and 10–30% capture curves. Full estimates are retained in Tables S39–S41.
Figure 4.
Frozen photographed-source evaluation (329 images). (a) MSP-minus-MI capture at 20% region budget with nominal 95% image-key bootstrap confidence intervals (2000 draws); negative favors MI. Blue: principal ResNet18; orange: supporting residual. (b) Capture at 10–30% budgets: solid lines/filled circles, MSP; dashed lines/open squares, MI. Denominators are each model’s own source-mask false-positive-plus-false-negative pixels. Budgets count regions, not reader time. MSP, mean maximum pixel probability; MI, mutual information.
As shown in Figure 4, the principal ResNet18 contrast was −3.664 percentage points (95% CI −5.193 to −2.227), favoring MI; the residual contrast was +15.732 points (+13.850 to +17.522), favoring MSP. Four rows of Table 4 cover AKUDENTAL and photographed radiographs (two ensembles per source). At the 20% all-region grid budget, MSP had higher error-pixel capture in three of these four rows (both AKUDENTAL ensembles and the photographed residual ensemble). MI had higher capture for photographed ResNet18. This is not a general AURC or anatomical-unit ranking. In the post hoc subset with native Dice ≥ 0.70, the ResNet18 contrast reversed to +6.398 points (+4.316 to +7.693; 115 images). Across the three two-seed ensembles, it ranged from −1.891 to +0.426 and was not retained in two subsets. Quality and membership sensitivity therefore qualify the principal result (Tables S50, S57, S77 and S79).
The native-Dice quality subsets require reference masks and cannot validate an inference-time screening threshold. Membership sensitivities held the archived three-seed error target fixed while changing review scores. TTA and residual-model MC dropout reused trained networks, not additional independent members; larger independently trained ensembles were not evaluated. Cutoff-specific estimates and score-order agreement are presented in Tables S50, S51 and S56–S59.
3.5. Evaluation-Target and Robustness Sensitivity
Figure 5 compares grid cells, reference-derived tooth territories and sextants, including model-error and unit-level displays.
Figure 5.
Post hoc anatomical-unit analysis. (a) UFBA-425 image cate2-00034 [39] with Fédération Dentaire Internationale (FDI) tooth numbering, reference tooth contours (yellow), nearest-tooth territories (white) and sextant shading (S1–S6 denote six sextants); (b) ResNet18 true-positive/false-positive/false-negative pixels (green/magenta/blue) and dashed yellow 2 × 4 grid; (c) AKUDENTAL 20% error capture by unit; (d) percentage of units with Dice < 0.5 selected within 20% review budget. Each pair of counts lists total for residual U-Net first and ResNet18 U-Net second (Table S75). Open/filled markers: residual/ResNet18; bars: nominal 95% image-cluster bootstrap confidence intervals (CIs). Grid CIs re-estimated; point estimates match Table S20. Reference-derived territories are unavailable at inference. UFBA-425: CC BY 4.0; AKUDENTAL: aggregate results only. Unit definitions/counts: Tables S42–S45. MI, mutual information; MSP, mean maximum pixel probability; SDC, soft Dice confidence.
As shown in Figure 5, grid cells cross teeth and sextants. With AKUDENTAL tooth territories, MI captured slightly more than MSP (+2.52 and +2.38 points for the residual and ResNet18 ensembles, respectively), and the capture across scores was close to the 20% random expectation. For teeth with Dice < 0.5, local SDC flagged 78.65% and 77.88%, compared with MI’s 44.66% and 41.52%. A grid-level MSP advantage therefore does not reflect better identification of poorly segmented teeth. Territories were reference-derived, and these technical cutoffs and units were not expert-validated (Tables S42–S45 and S75).
AKUDENTAL contained 8790 tooth territories and 1964 sextants; every retained unit contained at least one error pixel, unlike the grid (Tables S42 and S43). There were 356 residual and 330 ResNet18 teeth below a Dice of 0.5. UFBA had only three such teeth per ensemble, so poor-unit flagging was not estimated. These composition differences qualify comparisons across unit types.
Figure 6 shows the pediatric error classes and the effect of evaluation-only reference variants on MSP − MI capture. Capture differences are expressed in percentage points (pp), and reference perturbations are expressed in pixels (px).
Figure 6.
Post hoc reference-label sensitivity. (a) Released pediatric contour; (b) residual-model errors: contour-band, jointly missed, jointly added or other disagreement; (c) source/model error composition; (d) MSP-minus-MI capture at 20% grid budget under six reference variants, with nominal 95% image-cluster bootstrap confidence intervals (2000 resamples); positive favors MSP. These are evaluator-defined sensitivity categories, not reannotations or clinical adjudication. Pediatric image and mask in panels (a,b) come from main dataset (CC0) [46]; L marker belongs to released image. MI, mutual information; MSP, mean maximum pixel probability; pp, percentage points; px, pixels.
As shown in Figure 6, contour-band and jointly missed-structure disagreements form different parts of the target. The contrast changed sign under at least one variant in eight of ten source/model combinations. Ignoring the contour band reduced the residual AKUDENTAL MSP advantage from +13.79 to −0.50 points; model-informed structure exclusions could change pediatric directions. Visible developing teeth were discernible in 46 of 48 sampled pediatric radiographs and lay inside the released contours in all 46, but the non-clinical check cannot establish a general labeling rule or assess unmineralized tooth germs (Tables S64–S67 and S81).
The pediatric subsets contained a larger share of jointly missed foreground structures than the internal and AKUDENTAL sources. Those structures accounted for 18.13–28.84% of pediatric error pixels and 15.23–19.34% of pediatric reference foreground (Table S65). Ignoring contour-band or model-informed disputed pixels narrowed the evaluated target and raised the measured overlap without altering any prediction. Such increases are therefore not segmentation improvements. The same pediatric MI-versus-replicated-SDC comparison remained unresolved under the contour-band, disputed-structure, and combined variants when recomputed with the continuous tie-aware convention (Table S67). Its interval excluded zero only under systematic one-pixel erosion or dilation, in opposite directions. These perturbations illustrate reference-definition dependence, not adjudicated annotation noise or evidence for choosing a preferred reference.
Other sensitivities supply no new primary endpoints. Joint-empty exclusion raised the mean risk and both scores’ AURCs, but Dice-risk MSP-minus-MI point contrasts remained positive in all eight source/model combinations (Table S55). Negative normalized gains mean worse-than-random performance, not an MI–MSP reversal (Tables S52–S54 and S78). The 256-pixel representation preserved only part of fine dental detail; one 512-pixel retraining improved photographed overlap but not pediatric overlap (Tables S46–S49 and S76; Figure S14). ResNet18’s UFBA temperature showed within-partition resampling stability but sharpened probabilities, whereas post hoc source-fitted NLL-optimal temperatures exceeded 1 in every external source; omitting it left review rankings practically unchanged (Tables S60–S63 and S80; Figure S16). Native-Dice geometry comparisons and square AURC point diagnostics do not establish ranking robustness (Tables S11 and S24–S26); no paired geometry test of capture/AURC contrasts was performed.
The model-free analysis measured sensitivity to reference-mask resampling. Only 33.16–35.75% of narrow background gaps remained background after the 256-pixel round trip in the high-resolution external subsets. However, reference-round-trip error pixels overlapped only 7.54–23.35% of ensemble errors (Tables S46–S48). This descriptive overlap does not attribute model error to downsampling. The 512-pixel retraining result was neither an ensemble evaluation nor a demonstration that the original review-score rankings would persist at that resolution.
Paired scaled-minus-unscaled changes at the fixed UFBA temperatures are reported for all five held-out subsets in Table S61. The residual NLL, Brier, and ECE decreased in each, with nominal 95% intervals below zero. The ResNet18 NLL and Brier increased in all four external subsets; its ECE decreased on AKUDENTAL but increased in both pediatric subsets and the photographed source. For photographed ResNet18, the NLL changed by +0.009 (+0.008 to +0.010); Brier and ECE changes, displayed ×103, were +0.231 (+0.217 to +0.245) and +0.853 (+0.722 to +0.977), respectively (95% CIs). Review ordering was almost unchanged (Tables S60–S63). These conditional probability changes do not establish clinical benefit.
For this CPU benchmark, the median per-image processing times were 0.214 s (25th–75th percentiles: 0.200–0.224) for the residual ensemble and 0.211 s (0.195–0.227) for ResNet18; the corresponding 95th percentiles were 0.285 and 0.283 s (Table S82). These are warm-process, batch-1 measurements including local image decoding and native-mask/review-score production, not the throughput of the original batched evaluation or a clinical workflow.
Direct paired interactions were heterogeneous (Tables S85–S87). Normalized model, risk, and population interactions survived Holm correction in 2/5, 7/10, and 6/10 comparisons, respectively. Across all eligible grid cells in the photographed source, the score-by-model interaction was the difference between the two model-specific score contrasts (ResNet18 minus residual). For normalized Dice-risk ranking gain (MSP minus MI), the interaction was +0.080 (nominal 95% CI +0.041 to +0.117, Holm-adjusted p = 0.008, Table S85). For the raw Dice-risk AURC (MI minus MSP, since a lower AURC is better), the corresponding estimate was +0.003 (nominal 95% CI −0.007 to +0.014, Table S87). This descriptive diagnostic was outside the 40-test Holm family. Its interval included zero, leaving the raw-scale interaction inconclusive. For the separate 20% error-pixel capture endpoint, the photographed model interaction was −19.397 pp (nominal 95% CI −21.740 to −16.987, Holm-adjusted p = 0.008, Table S86). Non-rejection elsewhere does not establish homogeneity; changing risk evaluates unchanged score queues against another target.
Table 4 summarizes the archived MSP, MI, and local-SDC error-pixel capture for all held-out sources/subsets at the common 20% all-region grid-item budget.
As shown in Table 4, MSP had higher capture point estimates in seven of the ten source–model rows (both UFBA and AKUDENTAL configurations, both pediatric ResNet18 configurations, and photographed residual U-Net). MI had higher point estimates in the remaining three rows (both pediatric residual configurations and photographed ResNet18). Both pediatric residual confidence intervals included zero. Local-SDC capture point estimates were lower throughout. These exploratory capture results do not establish Dice-risk or clinical superiority.
4. Discussion
The original pediatric comparison asked whether regional MI could prioritize poorly segmented cells for review more effectively than a single SDC value shared by all eight cells of each image. For the calibrated residual ensemble, the MI-minus-SDC difference in the Dice-risk AURC across all 800 cells from 100 images was +0.007 (95% image-key bootstrap CI −0.033 to +0.041). A lower AURC indicates lower average Dice risk among the cells left unreviewed across coverage levels. The point estimate in Table 3 slightly favored replicated SDC, but the interval was compatible with an advantage for either approach. The primary analysis therefore did not demonstrate that regional MI improved review prioritization in this cohort. Equivalence was not tested. The scoring rule and spatial scale changed together, leaving their individual contributions unresolved.
SDC was developed as an image-level selective-segmentation estimator [29]; the existing local-SDC companion is a separate regional adaptation, not a replacement primary. These findings agree that biomedical rankings change with test data, references, metrics, and aggregation [19], and with problem-aware metric guidance [35,36,37,38]. Spatial aggregation is dataset-dependent [33]. Statistical separation from zero does not establish clinically meaningful superiority; no clinically important difference threshold was specified.
No reader study was performed. Clinical benefit is unknown. The retrospective technical results do not demonstrate improved clinician performance or patient outcomes. Future blinded-reader studies could compare assisted and unassisted review, measuring correction time, workload, and clinically important segmentation errors.
Source separation preserves different tasks and annotation conventions. Dental studies cover binary foreground, instances, numbering, tooth state, restorations, and detection–segmentation outputs [7,8,9,10,11,12,13,14], which assign different meanings to omissions and boundaries. Released references were retained without constructing a harmonized clinical target. Native exports, pediatric images, and photographed radiographs also differ in acquisition and visible structures. Cross-source performance therefore reflects task, reference, and acquisition jointly; it does not isolate architecture or uncertainty-score transfer [14,19].
The two ensembles performed similarly on the UFBA internal test set, with mean standardized Dice values of 0.906 for ResNet18 U-Net and 0.909 for residual U-Net. When both frozen ensembles were applied to the 329 photographed radiographs, the mean Dice values fell to 0.429 and 0.684, respectively (Table 2). Of the pixels where each ensemble disagreed with the reference mask, 86.96% were false negatives for ResNet18 and 93.62% were false positives for the residual ensemble (Table S38). ResNet18 missed more reference tooth pixels and had poorer foreground overlap despite a lower mean pixel-error rate. Its MI ranking could concentrate missed pixels in cells selected for review even when the underlying mask was inaccurate.
The photographed images came from one center, and the provider reports variation in brightness, contrast and sharpness [16]. Resizing these photographs to a 256-pixel long side could make faint tooth margins harder to resolve. In a post hoc comparison using one uncalibrated ResNet18 model per resolution and the same training seed, the mean native-space Dice on the photographs rose from 0.376 at 256 pixels to 0.679 at 512 (Table S49). The resolution effect on the full ensemble remains unknown. Applying the UFBA-fitted temperature to the ResNet18 ensemble changed the Dice on these photographs by only +0.001 (Table S61). The benchmark included no matched scanner exports of the photographed examinations. Source-specific masks and uncontrolled case mix limit attribution to photography, and the comparison of two trained configurations cannot isolate an encoder effect. Assessing generalizability would require testing both mask overlap and error prioritization at other centers. Paired scanner exports and photographs of the same examinations, scored against a common reference after spatial alignment, would help isolate the effect of recapture.
The co-principal exploratory foreground-bearing evaluations do not support a general MI advantage. Reference-positive pediatric Dice risk favored replicated-image SDC; AKUDENTAL Dice risk favored local SDC (Tables S18 and S74). All-region Dice risk includes non-tooth-bearing and jointly empty cells and is not a stand-alone clinical target. The all-region Dice-risk advantage for MI over local SDC in AKUDENTAL (Table S74) did not extend to reference-positive cells and concerns a different comparator from the pediatric primary. The archived MI–SDC intervals do not directly test the population difference (Table S88); separate MSP − MI interactions test their own contrast (Tables S85–S87). In AKUDENTAL, reviewing 20% of grid cells captured more error pixels with MSP than with MI for both ensembles. When 20% of reference-derived tooth territories were reviewed using the same predictions, the capture point estimates favored MI by 2.52 and 2.38 percentage points for the residual and ResNet18 ensembles, respectively, although capture was close to random (Figure 5 and Table S75). A grid-cell advantage thus need not carry over to tooth review. Local SDC flagged most tooth territories with Dice values below 0.5 (Table S44). The study did not measure the clinical importance of flagged errors, reader time, or correction effort.
Overlap, probability calibration and review ranking address different outcomes. The Dice/IoU measure agreement with a foreground reference; the NLL, Brier score and ECE assess probabilities; review scores order units against a declared target [24,25,26,27,28,29]. Calibration can differ between pooled pixels and individual subjects, and better probabilities need not concentrate the errors of interest [24,25,26,27]. Reverse Classification Accuracy, surface-error detection and selective prediction likewise use distinct estimands [28,30,31,32]. These rankings measure conditional error concentration, not an intrinsic uncertainty scale or a universal aggregation correction [33].
The empty-region analysis separates a definitional population change from comparative AURC performance. For pediatric residual Dice risk, the MSP-minus-MI ΔAURC was +0.001 (95% CI −0.008 to +0.009) before and +0.043 (+0.033 to +0.054) after joint-empty exclusion (Table S55). These paired within-population intervals do not test the change in contrast. Exclusion left scores and the relative order of retained cells unchanged. Higher mean risk changes the random reference; negative normalized gains are worse-than-random diagnostics, not an MI–MSP reversal. Reference-positive filtering also removes false-positive-only cells; its separate interactions do not test joint-empty exclusion. This analysis did not test whether exclusion changed relative ranking or improved clinical outcomes.
With predictions held fixed, the direction of the exploratory MSP − MI capture difference at a 20% review budget changed with the review unit in AKUDENTAL (grid cells or reference-derived tooth territories) and with the weighting of missed and extra tooth pixels for photographed ResNet18 (Table 4, Figure 5 and Tables S83 and S84). An external evaluation of regional ranking should therefore specify what counts as one review item and report the fraction of each error type captured. The AURC describes retained risk across coverage; capture describes error concentration at a fixed item budget. Image-level SDC, its local adaptation, grid cells, and reference-derived anatomical units are not interchangeable comparisons [29,30,31,32,33]. Reporting each target separately follows problem-aware metric guidance [35,36,37,38]. Fine-grid AURC points lack paired intervals or a score-by-grid test and provide no inferential support for the central ranking claim.
At the 20% all-region 2 × 4 grid budget, the total-error capture point estimate is higher for MSP in seven of the ten rows of Table 4 and for MI in three. Both ensembles were evaluated on the same images within each source or subset, so these counts describe related comparisons. The photographed ResNet18 result (Figure 4) coincided with poor segmentation, reversed in the post hoc native-Dice ≥ 0.70 subset, and depended on seed membership (Tables S50 and S57). For photographed ResNet18, MI captured more FN pixels and MSP captured more FP pixels. With the ranked cells held fixed, the MSP-minus-MI capture difference changed from −3.66 percentage points under the observed error mix to +6.59 under equal weighting of the two error types (Tables S83 and S84). Reporting capture separately for each error type shows which errors a score prioritizes and how their prevalence affects the aggregate result. MSP led for both error types in the residual ensemble. These are not causal architecture effects. Overlapping seed subsets cannot disentangle score characteristics from ensemble diversity; no independent three-member replications or controlled diversity experiment was performed. The findings therefore apply to the sampled ensembles (Tables S56 and S57).
A higher square-input Dice does not establish the geometry robustness of letterbox-based review rankings. The 256-pixel reference round trip lost fine detail, while 512-pixel retraining used one seed and tested no ensemble ranking; pediatric failures cannot be attributed solely to downsampling (Tables S46–S49). The 32-image ResNet18 temperature estimate was conditionally stable (0.929; bootstrap interval: 0.883–0.976), not proof of calibration-sample adequacy or external representativeness. External target-fitted temperatures exceeded 1, opposite to the UFBA correction. Paired intervals showed increased external ResNet18 NLL and Brier but source-dependent ECE changes (Table S61). At T = 0.976, ResNet18 NLL still increased in all four external subsets (Table S62). Regional MSP and MI rankings changed little between unscaled ResNet18 predictions and those scaled with the UFBA-fitted temperature (Table S63). Retaining the fixed scaled pipeline does not recommend unverified temperature transfer. Only two compact configurations were evaluated, without nnU-Net [6]. CPU latencies reflect a shared virtual host and uncontrolled file caches; higher-resolution or larger/stochastic ensembles may scale differently. Image transfer, interfaces, and clinician interaction were not measured; graphics processor speed and deployment feasibility were not established.
The UFBA metadata [39] did not establish patient identity across the training, selection, calibration and internal-test partitions. Excluding two discordant same-image records does not resolve this risk. Overlap could inflate internal performance or influence checkpoint and temperature choices; its effect on review-ranking contrasts is unknown. Image-key bootstrap intervals condition on the fitted pipeline and cannot correct leakage or unidentified within-patient dependence. External testing with UFBA-selected checkpoints and temperatures does not establish patient independence. Target-fitted temperatures served only as post hoc diagnostics (Tables S7 and S80).
Source-mask disagreement is not clinical error. The non-clinical pediatric check and reference perturbations cannot establish annotation truth or a universal developing-tooth rule; repeat annotations were unavailable [3,14,16]. No dentist or radiologist reviewed study masks, predictions, units, or errors; no prospective validation, reader study, clinical utility, or safety assessment was performed. The pediatric subsets form one source family, not independent replications. Image-key intervals may be anticonservative for patient-level inference, and missing acquisition/site metadata limit subgroup validation.
These results translate problem-aware evaluation guidance into checks for dental-review queues [17,19,35,36,37,38]. Comparisons should match score granularity and declare the risk, eligible regions, item budget, and empty-mask/tie rules: foreground and anatomical-unit analyses show why these choices affect interpretation. FP/FN capture should accompany total capture because error composition can conceal opposing subtype advantages (Tables S83 and S84). Paired interaction tests should evaluate the stated estimand, distinguishing the raw AURC from normalized gains (Tables S85–S87). Quality and seed sensitivities further support checking ranking stability for each intended configuration. Reference-dependent restrictions are retrospective diagnostics, not deployable selection rules. Fixed predictions and archived analysis rules make these checks auditable. The inconclusive original pediatric comparison remains distinct from the later exploratory findings. Stage 2 and the empty-region reanalysis followed known earlier outcomes; the photographed-source evaluation was locally planned with those outcomes already available. Its protocol hash identifies the archived text, but local timestamps and later public archiving cannot independently prove pre-outcome specification. The new-source and post hoc results therefore do not confirm or replace the original hypothesis. Post hoc formal interaction tests cannot replace preregistered confirmation, expert review, or measured clinical outcomes.
Future development should keep each patient’s examinations within one partition or grouped cross-validation fold and reserve an untouched patient-separated test set. Independent validation should use patient-separated, multi-site data, repeated expert annotations with an explicit developing-tooth rule, clinically agreed upon review units, stronger native- or patch-resolution segmentation, and larger ensembles. A blinded-reader study should measure correction effort, time, and clinically important misses. The present results identify conditions for that evaluation; they do not validate an autonomous review gate.
5. Conclusions
The pediatric primary comparison was inconclusive; neither superiority nor equivalence was established. Reference-positive results in the pediatric main subset and AKUDENTAL favored SDC over MI for Dice risk. Their co-principal emphasis was post hoc. All-region Dice risk is not a clinical target. Post hoc tests identified selected score-by-risk and score-by-population interactions. The photographed score-by-model interaction was significant after Holm adjustment for normalized Dice-risk gain, but the raw-AURC interval included zero. Descriptive rankings also varied with source, review unit, seed membership, and reference convention. MI–MSP findings depend on the sampled ensembles; they neither isolate score characteristics from ensemble diversity nor establish score-family superiority. Grid findings describe the technical ranking of geometric image regions; reference-derived tooth territories and sextants remain retrospective secondary diagnostics unavailable at inference. Neither geometry nor resolution robustness of review rankings was established. The principal exploratory 20% all-region grid-capture result favored MI for photographed-source ResNet18 despite poor transfer but MSP for the supporting residual model. For ResNet18, MI led only for false-negative pixels, which made up 86.96% of the model’s error pixels. MSP captured more false-positive pixels and led by 6.59 percentage points when the two subtype capture rates received equal weight. The aggregate MI advantage thus depended on both error subtype and composition. Post hoc sensitivities examined native-Dice quality subsets and prediction-positive cells. Quality restriction favored MSP for ResNet18, whose temperature correction transferred in the wrong direction. The 256-pixel analysis concerns coarse errors, and 512-pixel evidence came from one seed. In a non-clinical visual check, visible developing teeth lay inside sampled contours, but no universal labeling rule follows. Source-mask discordance is not a clinical error. No study-specific dentist or radiologist review or prospective validation was performed, and clinical benefit remains unassessed.
Supplementary Materials
The following supporting information can be downloaded at: https://www.mdpi.com/article/10.3390/diagnostics16223758/s1. Figure S1. Fixed-temperature probability transformation in one held-out pediatric image. Figure S2. Illustration of retained initial-stage regional scoring units. Figure S3. Original-stage pediatric example of error-pixel localization and cohort-derived review allocation. Figure S4. Original-stage pediatric example under fixed input perturbations. Figure S5. Exact partition of mean maximum pixel probability (MSP) minus mutual information (MI) Dice-risk area under risk–coverage curve (AURC) contrast. Figure S6. Joint-empty prevalence and change in Dice-risk area under risk–coverage curve (AURC) after joint-empty exclusion. Figure S7. Source-separated reliability of tooth-foreground probabilities. Figure S8. Retained initial-stage regional comparison in 100 main pediatric images. Figure S9. Risk- and foreground-dependent MI–local-SDC contrasts in AKUDENTAL. Figure S10. Contextual illustration of region inclusion and cell-level risk in original pediatric stage. Figure S11. Error-pixel capture under limited regional review in AKUDENTAL. Figure S12. Geometry and controlled-perturbation sensitivity. Figure S13. Change in Dice-risk area under risk–coverage curve (AURC) after excluding jointly empty regions in eight earlier source/model combinations. Figure S14. Post hoc resolution analysis. Figure S15. Post hoc stability of review rankings across ensemble members and stochastic sampling. Figure S16. Post hoc uncertainty and transfer of UFBA-fitted temperatures. Table S1. Fixed image partitions and permitted uses. Table S2. Three-stage evaluation provenance. Table S3. Source-specific derivation and interpretation of reference masks. Table S4. Deterministic intensity, geometry and inverse-mapping conventions. Table S5. Architecture details and implemented training conventions. Table S6. Completed training runs and retained selection checkpoints. Table S7. Ensemble temperature calibration procedure and transfer rules. Table S8. Uncertainty and confidence score definitions and implementation conventions. Table S9. Regional grids, review ordering and budget conventions. Table S10. Evaluation metric definitions, domains and special-case conventions. Table S11. Performed sensitivity analyses and configuration-specific interpretation limits. Table S12. Statistical analysis conventions and limits of interval interpretation. Table S13. Reproducibility materials and scope of recorded quality assurance. Table S14. Source-separated boundary Dice and normalized 95th-percentile boundary distance (HD95), with confidence intervals (CIs). Table S15. Provenance and native-space Dice of two displayed examples. Table S16. Calibrated mean binary negative log-likelihood (NLL), Brier score, and foreground-probability expected calibration error (ECE) with recorded nominal 95% intervals. Table S17. Archived initial-stage all-region Dice-risk contrasts for main and supplementary pediatric subsets. Table S18. Original-stage pediatric sensitivity contrasts against replicated image-level SDC. Table S19. Reference–prediction foreground strata in calibrated AKUDENTAL standard grid. Table S20. AKUDENTAL error-pixel capture across three regional review budgets. Table S21. AKUDENTAL error-pixel capture under image-level review budgets. Table S22. Paired MI-minus-comparator differences in AKUDENTAL regional error-pixel capture. Table S23. Archived false-positive (FP) and false-negative (FN) error counts and cohort-derived review weights for pediatric example. Table S24. External-source geometry sensitivity and original-stage controlled perturbations. Table S25. Native-Dice sensitivity to image geometry and reference coverage. Table S26. Purely descriptive MI–MSP AURC point contrasts under standard and finer regional grids. Table S27. Overlap by presence of released restoration labels in AKUDENTAL. Table S28. Matched original-stage Dice and IoU under fixed perturbations. Table S29. Image-level score discrimination at two technical Dice cutoffs in AKUDENTAL. Table S30. Raw compact-model seed variability on non-calibration evaluation subsets. Table S31. Archived outcomes for original-stage perturbation illustration. Table S32. Selected literature comparators and their relationship to this benchmark. Table S33. Four-region category composition and error accounting in empty-region analysis. Table S34. All-region (ALL) and joint-empty-exclusion AURC estimates with archived confidence intervals. Table S35. Exact λ sensitivity and category contributions to MSP − MI AURC. Table S36. Error-pixel capture in all earlier sources before and after joint-empty exclusion. Table S37. New photographed-source eligibility, provenance and locally recorded evaluation protocol. Table S38. Complete photographed-source segmentation and pixel-error summary. Table S39. Frozen new-source segmentation and 20% error-pixel capture (n = 329). Table S40. New photographed-source paired error-capture contrasts for all review budgets. Table S41. Continuous MI−MSP AURC contrasts on photographed source. Table S42. Tooth territory and sextant review units in two sources with FDI-numbered tooth annotations. Table S43. Error-pixel capture with sextant and tooth territory units at 20% budget. Table S44. Flagging of poorly segmented teeth and sextants in AKUDENTAL. Table S45. Unit-level area under risk–coverage curve (AURC) for tooth territories and sextants. Table S46. Image-level reference-round-trip Dice of scoring representation by source and scoring condition. Table S47. Tooth-instance reference-round-trip Dice in two sources with FDI-numbered tooth annotations. Table S48. Descriptive overlap of model error pixels with 256-pixel reference-round-trip error pixels. Table S49. Native-space overlap of ResNet18 U-Net trained at 256 and 512 pixels. Table S50. Regional MSP − MI error-pixel capture a 20% budget by native segmentation quality. Table S51. Image-level identification of masks with native Dice below 0.70. Table S52. Normalized Dice-risk ranking gain before and after joint-empty exclusion. Table S53. Normalized pixel-error-risk ranking gain before and after joint-empty exclusion. Table S54. Change in reference and score AURCs after joint-empty exclusion. Table S55. Confidence-order position of jointly empty regions and MSP-minus-MI contrasts. Table S56. Ensemble and sampling variants in seed stability analysis. Table S57. MSP and MI error-pixel capture at 20% regional budget for each ensemble variant. Table S58. Dice-risk AURC contrasts and agreement with archived three-seed region orders. Table S59. Agreement of region review orders between seed subsets. Table S60. Uncertainty of UFBA-fitted temperatures. Table S61. Paired probability and overlap changes after temperature scaling, with fitting partition reported separately. Table S62. Sensitivity of held-out NLL and ECE changes to applied temperature. Table S63. Review-order agreement and review contrasts with and without temperature scaling. Table S64. Non-clinical visual check of developing teeth in sampled pediatric reference masks. Table S65. Composition of thresholded-prediction errors relative to published references. Table S66. Mean image Dice and MSP − MI error-pixel capture under evaluation-only reference variants. Table S67. Dice-risk AURC contrasts under evaluation-only reference variants. Table S68. Fixed input transformations and geometry-sensitivity conditions. Table S69. Model development and optimization conditions in Stages 1 and 2. Table S70. Prediction-derived scores used for image and regional review prioritization. Table S71. Outcome families in original stages. Table S72. Source-separated standardized-grid segmentation performance of calibrated ensembles. Table S73. Held-out probability outcomes before and after temperature scaling. Table S74. Regional MI–local-SDC contrasts under alternative risk definitions and foreground inclusion in AKUDENTAL. Table S75. Error-pixel capture and flagging of poorly segmented units with grid, sextant, and tooth territory review units at 20% budget in AKUDENTAL. Table S76. Native-space reference-round-trip Dice and ResNet18 U-Net overlap at 256 and 512 pixels. Table S77. Regional MSP-minus-MI error-pixel capture at 20% budget by native segmentation quality. Table S78. Ranking relative to random and oracle orderings before and after joint-empty exclusion. Table S79. MSP-minus-MI error-pixel capture at 20% regional budget with different ensemble members and stochastic sampling. Table S80. Target-fitted temperatures and paired changes after applying UFBA-fitted temperatures to held-out sources. Table S81. Composition of thresholded-prediction errors and MSP-minus-MI error-pixel capture under evaluation-only reference variants. Table S82. CPU per-image software latency for frozen calibrated three-member ensembles. Table S83. Photographed-source capture of false-positive and false-negative pixels, overall and by type. Table S84. Composition-weighted contributions and equal-type-weight diagnostics for MSP − MI capture. Table S85. Paired score interactions in normalized ranking gain. Table S86. Paired score-by-model and score-by-population interactions in 20% error-pixel capture. Table S87. Raw-AURC difference-in-differences: scale-sensitive exploratory diagnostics. Table S88. Row-specific provenance of archived nominal 95% intervals in Table S74. Table S89. Eligibility and omitted-error accounting for local-SDC capture sensitivity. Table S90. Twenty-percent conditional error-pixel capture by score and region population. A separate completed CLAIM 2024 reporting checklist is supplied as Supplementary_CLAIM_2024_Checklist.docx. Table S91. CLAIM 2024 reporting checklist for manuscript. References cited in Supplementary Materials are included on main reference list.
Funding
This research received no external funding.
Institutional Review Board Statement
This study was a secondary computational analysis of publicly released panoramic radiographs and existing annotations; no participants were recruited, and no additional radiographs or patient-linked clinical data were collected.
Informed Consent Statement
Not applicable. No new participants were recruited; only publicly released images and annotations were analyzed under the providers’ reuse terms, and no patient names or other direct patient identifiers are reported.
Data Availability Statement
The source radiographs and annotations analyzed in this study are publicly available from UFBA-425, version 1 [39] (https://doi.org/10.6084/m9.figshare.29827475.v1), the main pediatric dataset [3,46] (https://doi.org/10.6084/m9.figshare.21621705.v1), its 93-image supplement [47] (https://doi.org/10.6084/m9.figshare.22495645.v1), the official AKUDENTAL repository [14] (https://github.com/melihoz/akudental, accessed on 19 October 2026), and the photographed-radiograph collection [16] (https://doi.org/10.17632/jrz4nj82zv.1). The photographed-radiograph collection is licensed under CC BY 4.0 (https://creativecommons.org/licenses/by/4.0/ (accessed on 19 October 2026)). The application code, trained model checkpoints, archived predictions, and analysis results are available from the Zenodo software archive [48] at https://doi.org/10.5281/zenodo.23863599.
Acknowledgments
The author thanks dentists Melisa Dinçer and Alp Dinçer of the Private Beyaz Oral and Dental Health Center, Karaman, Türkiye, for providing general information from a dental-practice perspective. Their contribution was limited to general information and advice; they did not review the study masks or model predictions, define review regions, or interpret segmentation errors. During manuscript preparation, the author used ChatGPT (model GPT-6.1 Sol; OpenAI) to assist with drafting, English-language editing, and stylistic refinement. The author reviewed and edited all such output and takes full responsibility for the content of this publication.
Conflicts of Interest
The author declares no conflicts of interest.
Abbreviations
The following abbreviations are used in this manuscript:
| AI | Artificial intelligence |
| AURC | Area under risk–coverage curve |
| CI | Confidence interval |
| CLAIM | Checklist for Artificial Intelligence in Medical Imaging |
| COCO | Common Objects in Context |
| CPU | Central processing unit |
| ECE | Expected calibration error |
| FDI | Fédération Dentaire Internationale |
| FN | False negative |
| FP | False positive |
| IoU | Intersection over union |
| JPEG | Joint Photographic Experts Group |
| MC | Monte Carlo |
| MI | Mutual information |
| MOR | Spatial mutual information mass ratio (Moran-weighted) |
| MSP | Mean maximum pixel probability |
| NLL | Negative log-likelihood |
| PNG | Portable Network Graphics |
| pp | Percentage points |
| px | Pixels |
| QFR | Above-quantile average for foreground ratio |
| SDC | Soft Dice confidence |
| TP | True positive |
| TTA | Test-time augmentation |
| UFBA | UFBA-425 dataset (short label used in text and figures) |
References
- Schwendicke, F.; Samek, W.; Krois, J. Artificial Intelligence in Dentistry: Chances and Challenges. J. Dent. Res. 2020, 99, 769–774. [Google Scholar] [CrossRef] [Scilit] [PubMed]
- Panetta, K.; Rajendran, R.; Ramesh, A.; Rao, S.; Agaian, S. Tufts Dental Database: A Multimodal Panoramic X-Ray Dataset for Benchmarking Diagnostic Systems. IEEE J. Biomed. Health Inform. 2022, 26, 1650–1659. [Google Scholar] [CrossRef] [Scilit] [PubMed]
- Zhang, Y.; Ye, F.; Chen, L.; Xu, F.; Chen, X.; Wu, H.; Cao, M.; Li, Y.; Wang, Y.; Huang, X. Children’s Dental Panoramic Radiographs Dataset for Caries Segmentation and Dental Disease Detection. Sci. Data 2023, 10, 380. [Google Scholar] [CrossRef] [Scilit] [PubMed]
- Ronneberger, O.; Fischer, P.; Brox, T. U-Net: Convolutional Networks for Biomedical Image Segmentation. In Medical Image Computing and Computer-Assisted Intervention—MICCAI 2015; Navab, N., Hornegger, J., Wells, W.M., Frangi, A.F., Eds.; Lecture Notes in Computer Science; Springer: Cham, Switzerland, 2015; Volume 9351, pp. 234–241. [Google Scholar] [CrossRef] [Scilit]
- He, K.; Zhang, X.; Ren, S.; Sun, J. Deep Residual Learning for Image Recognition. In Proceedings of the 2016 IEEE Conference on Computer Vision and Pattern Recognition (CVPR), Las Vegas, NV, USA, 27–30 June 2016; pp. 770–778. [Google Scholar] [CrossRef] [Scilit]
- Isensee, F.; Jaeger, P.F.; Kohl, S.A.A.; Petersen, J.; Maier-Hein, K.H. nnU-Net: A Self-Configuring Method for Deep Learning-Based Biomedical Image Segmentation. Nat. Methods 2021, 18, 203–211. [Google Scholar] [CrossRef] [Scilit] [PubMed]
- Chandrashekar, G.; AlQarni, S.; Bumann, E.E.; Lee, Y. Collaborative Deep Learning Model for Tooth Segmentation and Identification Using Panoramic Radiographs. Comput. Biol. Med. 2022, 148, 105829. [Google Scholar] [CrossRef] [Scilit] [PubMed]
- Rubiu, G.; Bologna, M.; Cellina, M.; Cè, M.; Sala, D.; Pagani, R.; Mattavelli, E.; Fazzini, D.; Ibba, S.; Papa, S.; et al. Teeth Segmentation in Panoramic Dental X-ray Using Mask Regional Convolutional Neural Network. Appl. Sci. 2023, 13, 7947. [Google Scholar] [CrossRef] [Scilit]
- Zhou, W.; Lu, X.; Zhao, D.; Jiang, M.; Fan, L.; Zhang, W.; Li, F.; Wang, D.; Yin, W.; Liu, X. A Dual-Labeled Dataset and Fusion Model for Automatic Teeth Segmentation, Numbering, and State Assessment on Panoramic Radiographs. BMC Oral Health 2024, 24, 1201. [Google Scholar] [CrossRef] [Scilit] [PubMed]
- Umer, F.; Habib, S.; Adnan, N. Application of Deep Learning in Teeth Identification Tasks on Panoramic Radiographs. Dentomaxillofac. Radiol. 2022, 51, 20210504. [Google Scholar] [CrossRef] [Scilit] [PubMed]
- Rohrer, C.; Krois, J.; Patel, J.; Meyer-Lueckel, H.; Rodrigues, J.A.; Schwendicke, F. Segmentation of Dental Restorations on Panoramic Radiographs Using Deep Learning. Diagnostics 2022, 12, 1316. [Google Scholar] [CrossRef] [Scilit] [PubMed]
- Bhat, S.; Birajdar, G.K.; Patil, M.D. Tooth Segmentation in Panoramic Dental Radiographs Using Deep Convolution Neural Network—Insights from Subjective Analysis. Discov. Appl. Sci. 2025, 7, 279. [Google Scholar] [CrossRef] [Scilit]
- Özçelik, S.T.A.; Üzen, H.; Şengür, A.; Fırat, H.; Türkoğlu, M.; Çelebi, A.; Gül, S.; Sobahi, N.M. Enhanced Panoramic Radiograph-Based Tooth Segmentation and Identification Using an Attention Gate-Based Encoder–Decoder Network. Diagnostics 2024, 14, 2719. [Google Scholar] [CrossRef] [Scilit] [PubMed]
- Oz, M.; Sengul, A.; Hatipoglu, M.; Danisman, T. AKUDENTAL Teeth Instance Segmentation Dataset: A Cross-Dataset Analysis. BMC Oral Health 2026, 26, 247. [Google Scholar] [CrossRef] [Scilit] [PubMed]
- Er, S. DENTEX CHALLENGE 2023; Dataset; Zenodo: Geneva, Switzerland, 2023. [Google Scholar] [CrossRef]
- Chowdhury, A.S.M.R.; Awsaf, S.A.; Rahman, A.; Rahaman, M.J. Dental Panoramic Radiography Dataset for Pixel Level Semantic Segmentation of Teeth, Version 1; Dataset; Mendeley Data: New York, NY, USA, 2026. [CrossRef]
- Tejani, A.S.; Klontzas, M.E.; Gatti, A.A.; Mongan, J.T.; Moy, L.; Park, S.H.; Kahn, C.E., Jr.; CLAIM 2024 Update Panel. Checklist for Artificial Intelligence in Medical Imaging (CLAIM): 2024 Update. Radiol. Artif. Intell. 2024, 6, e240300. [Google Scholar] [CrossRef] [Scilit] [PubMed]
- Sounderajah, V.; Guni, A.; Liu, X.; Collins, G.S.; Karthikesalingam, A.; Markar, S.R.; Golub, R.M.; Denniston, A.K.; Shetty, S.; Moher, D.; et al. The STARD-AI Reporting Guideline for Diagnostic Accuracy Studies Using Artificial Intelligence. Nat. Med. 2025, 31, 3283–3289. [Google Scholar] [CrossRef] [Scilit] [PubMed]
- Maier-Hein, L.; Eisenmann, M.; Reinke, A.; Onogur, S.; Stankovic, M.; Scholz, P.; Arbel, T.; Bogunovic, H.; Bradley, A.P.; Carass, A.; et al. Why Rankings of Biomedical Image Analysis Competitions Should Be Interpreted with Care. Nat. Commun. 2018, 9, 5217. [Google Scholar] [CrossRef] [Scilit] [PubMed]
- Gal, Y.; Ghahramani, Z. Dropout as a Bayesian Approximation: Representing Model Uncertainty in Deep Learning. In Proceedings of the 33rd International Conference on Machine Learning (ICML), New York, NY, USA, 20–22 June 2016; Proceedings of Machine Learning Research; JMLR: Cambridge, MA, USA, 2016; Volume 48, pp. 1050–1059. Available online: https://proceedings.mlr.press/v48/gal16.html (accessed on 19 October 2026).
- Lakshminarayanan, B.; Pritzel, A.; Blundell, C. Simple and Scalable Predictive Uncertainty Estimation Using Deep Ensembles. In Proceedings of the 31st Conference on Neural Information Processing Systems (NIPS 2017), Long Beach, CA, USA, 4–9 December 2017; Advances in Neural Information Processing Systems; Curran Associates, Inc.: Red Hook, NY, USA, 2017; Volume 30, pp. 6402–6413. Available online: https://proceedings.neurips.cc/paper_files/paper/2017/file/9ef2ed4b7fd2c810847ffa5fa85bce38-Paper.pdf (accessed on 9 November 2026).
- Kendall, A.; Gal, Y. What Uncertainties Do We Need in Bayesian Deep Learning for Computer Vision? In Proceedings of the 31st Conference on Neural Information Processing Systems (NIPS 2017), Long Beach, CA, USA, 4–9 December 2017; Advances in Neural Information Processing Systems; Curran Associates, Inc.: Red Hook, NY, USA, 2017; Volume 30, pp. 5574–5584. Available online: https://proceedings.nips.cc/paper_files/paper/2017/hash/2650d6089a6d640c5e85b2b88265dc2b-Abstract.html (accessed on 9 November 2026).
- Guo, C.; Pleiss, G.; Sun, Y.; Weinberger, K.Q. On Calibration of Modern Neural Networks. In Proceedings of the 34th International Conference on Machine Learning (ICML), Sydney, Australia, 6–11 August 2017; Proceedings of Machine Learning Research; JMLR: Cambridge, MA, USA, 2017; Volume 70, pp. 1321–1330. Available online: https://proceedings.mlr.press/v70/guo17a.html (accessed on 19 October 2026).
- Mehrtash, A.; Wells, W.M., III; Tempany, C.M.; Abolmaesumi, P.; Kapur, T. Confidence Calibration and Predictive Uncertainty Estimation for Deep Medical Image Segmentation. IEEE Trans. Med. Imaging 2020, 39, 3868–3878. [Google Scholar] [CrossRef] [Scilit] [PubMed]
- Faghani, S.; Moassefi, M.; Rouzrokh, P.; Khosravi, B.; Baffour, F.I.; Ringler, M.D.; Erickson, B.J. Quantifying Uncertainty in Deep Learning of Radiologic Images. Radiology 2023, 308, e222217. [Google Scholar] [CrossRef] [Scilit] [PubMed]
- Jungo, A.; Reyes, M. Assessing Reliability and Challenges of Uncertainty Estimations for Medical Image Segmentation. In Proceedings of the Medical Image Computing and Computer Assisted Intervention—MICCAI 2019, Shenzhen, China, 13–17 October 2019; Lecture Notes in Computer Science; Springer: Cham, Switzerland, 2019; Volume 11765, pp. 48–56. [Google Scholar] [CrossRef] [Scilit]
- Yeung, M.; Rundo, L.; Nan, Y.; Sala, E.; Schönlieb, C.-B.; Yang, G. Calibrating the Dice Loss to Handle Neural Network Overconfidence for Biomedical Image Segmentation. J. Digit. Imaging 2023, 36, 739–752. [Google Scholar] [CrossRef] [Scilit] [PubMed]
- Valindria, V.V.; Lavdas, I.; Bai, W.; Kamnitsas, K.; Aboagye, E.O.; Rockall, A.G.; Rueckert, D.; Glocker, B. Reverse Classification Accuracy: Predicting Segmentation Performance in the Absence of Ground Truth. IEEE Trans. Med. Imaging 2017, 36, 1597–1606. [Google Scholar] [CrossRef] [Scilit] [PubMed]
- Borges, B.L.C.; Pacheco, B.M.; Silva, D. Soft Dice Confidence: A Near-Optimal Confidence Estimator for Selective Prediction in Semantic Segmentation. Mach. Learn. 2026, 115, 176. [Google Scholar] [CrossRef] [Scilit]
- Zaman, F.A.; Zhang, L.; Zhang, H.; Sonka, M.; Wu, X. Segmentation Quality Assessment by Automated Detection of Erroneous Surface Regions in Medical Images. Comput. Biol. Med. 2023, 164, 107324. [Google Scholar] [CrossRef] [Scilit] [PubMed]
- Alzahrani, N.M.; Henry, A.M.; Al-Qaisieh, B.M.; Murray, L.J.; Nix, M.G. Automated Confidence Estimation in Deep Learning Auto-Segmentation for Brain Organs at Risk on MRI for Radiotherapy. J. Appl. Clin. Med. Phys. 2024, 25, e14513. [Google Scholar] [CrossRef] [Scilit] [PubMed]
- Geifman, Y.; El-Yaniv, R. Selective Classification for Deep Neural Networks. In Proceedings of the 31st Conference on Neural Information Processing Systems (NIPS 2017), Long Beach, CA, USA, 4–9 December 2017; Advances in Neural Information Processing Systems; Curran Associates, Inc.: Red Hook, NY, USA, 2017; Volume 30, pp. 4878–4887. Available online: https://proceedings.neurips.cc/paper_files/paper/2017/file/4a8423d5e91fda00bb7e46540e2b0cf1-Paper.pdf (accessed on 9 November 2026).
- Guarino, V.E.; Winklmayr, C.; Franzen, J.; Rumberger, J.L.; Pfeuffer, M.; Greven, S.; Maier-Hein, K.; Kainmueller, D.; Karg, C.; Lüth, C.T. Better than Average: Spatially-Aware Aggregation of Segmentation Uncertainty Improves Downstream Performance. In Proceedings of the IEEE/CVF Conference on Computer Vision and Pattern Recognition (CVPR), Denver, CO, USA, 3–7 June 2026; pp. 13145–13156. Available online: https://openaccess.thecvf.com/content/CVPR2026/html/Guarino_Better_than_Average_Spatially-Aware_Aggregation_of_Segmentation_Uncertainty_Improves_Downstream_CVPR_2026_paper.html (accessed on 19 October 2026).
- Dice, L.R. Measures of the Amount of Ecologic Association Between Species. Ecology 1945, 26, 297–302. [Google Scholar] [CrossRef] [Scilit]
- Taha, A.A.; Hanbury, A. Metrics for Evaluating 3D Medical Image Segmentation: Analysis, Selection, and Tool. BMC Med. Imaging 2015, 15, 29. [Google Scholar] [CrossRef] [Scilit] [PubMed]
- Reinke, A.; Tizabi, M.D.; Baumgartner, M.; Eisenmann, M.; Heckmann-Nötzel, D.; Kavur, A.E.; Rädsch, T.; Sudre, C.H.; Acion, L.; Antonelli, M.; et al. Understanding Metric-Related Pitfalls in Image Analysis Validation. Nat. Methods 2024, 21, 182–194. [Google Scholar] [CrossRef] [Scilit] [PubMed]
- Müller, D.; Soto-Rey, I.; Kramer, F. Towards a Guideline for Evaluation Metrics in Medical Image Segmentation. BMC Res. Notes 2022, 15, 210. [Google Scholar] [CrossRef] [Scilit] [PubMed]
- Maier-Hein, L.; Reinke, A.; Godau, P.; Tizabi, M.D.; Buettner, F.; Christodoulou, E.; Glocker, B.; Isensee, F.; Kleesiek, J.; Kozubek, M.; et al. Metrics Reloaded: Recommendations for Image Analysis Validation. Nat. Methods 2024, 21, 195–212. [Google Scholar] [CrossRef] [Scilit] [PubMed]
- Budagam, D.; Zhanatuly Imanbayev, A.; Rafailovich Akhmetov, I.; Sinitca, A.; Antonov, S.; Kaplun, D. UFBA-425, Version 1; Dataset; Figshare: London, UK, 2025. [CrossRef]
- Xu, X.; Chen, J.; Yin, J. Tooth Instance Segmentation and Disease Detection With Uncertainty-Aware Contrastive Learning and Cross-Scale Attention. IEEE J. Biomed. Health Inform. 2026, 30, 2915–2926. [Google Scholar] [CrossRef] [Scilit] [PubMed]
- Cui, Z.; Fang, Y.; Mei, L.; Zhang, B.; Yu, B.; Liu, J.; Jiang, C.; Sun, Y.; Ma, L.; Huang, J.; et al. A Fully Automatic AI System for Tooth and Alveolar Bone Segmentation from Cone-Beam CT Images. Nat. Commun. 2022, 13, 2096. [Google Scholar] [CrossRef] [Scilit] [PubMed]
- Isensee, F.; Wald, T.; Ulrich, C.; Baumgartner, M.; Roy, S.; Maier-Hein, K.; Jäger, P.F. nnU-Net Revisited: A Call for Rigorous Validation in 3D Medical Image Segmentation. In Medical Image Computing and Computer Assisted Intervention—MICCAI 2024; Lecture Notes in Computer Science; Springer Nature Switzerland: Cham, Switzerland, 2024; Volume 15009, pp. 488–498. [Google Scholar] [CrossRef] [Scilit]
- Cheng, Z.; Wang, S.; Gao, Y.; Zhu, Z.; Yan, C. Invariant Content Representation for Generalizable Medical Image Segmentation. J. Imaging Inform. Med. 2024, 37, 3193–3207. [Google Scholar] [CrossRef] [Scilit] [PubMed]
- Zenk, M.; Zimmerer, D.; Isensee, F.; Traub, J.; Norajitra, T.; Jäger, P.F.; Maier-Hein, K. Comparative Benchmarking of Failure Detection Methods in Medical Image Segmentation: Unveiling the Role of Confidence Aggregation. Med. Image Anal. 2025, 101, 103392. [Google Scholar] [CrossRef] [Scilit] [PubMed]
- Barfoot, T.; Garcia-Peraza-Herrera, L.C.; Akcay, S.; Glocker, B.; Vercauteren, T. Average Calibration Losses for Reliable Uncertainty in Medical Image Segmentation. IEEE Trans. Med. Imaging 2026, 45, 3412–3423. [Google Scholar] [CrossRef] [Scilit] [PubMed]
- Zhang, Y.; Ye, F.; Chen, L.; Xu, F.; Chen, X.; Wu, H.; Wang, Y.; Huang, X.; Cao, M.; Li, Y. Children’s Dental Panoramic Radiographs Dataset, Version 1; Dataset; Figshare: London, UK, 2023. [CrossRef]
- Zhang, Y.; Ye, F.; Chen, L.; Xu, F.; Chen, X.; Wu, H.; Wang, Y.; Huang, X. Children’s Teeth—Supplement, Version 1; Dataset; Figshare: London, UK, 2023. [CrossRef]
- Fırat, Y. Uncertainty and Geometric Image-Region Ranking in Artificial Intelligence–Based Panoramic Tooth Segmentation: A Multi-Source External Benchmark, Version 3; Software; Zenodo: Geneva, Switzerland, 2026. [CrossRef]
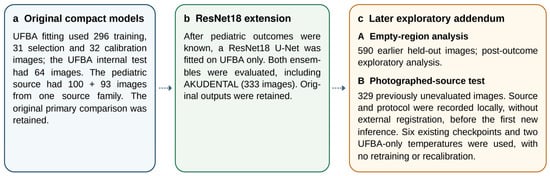
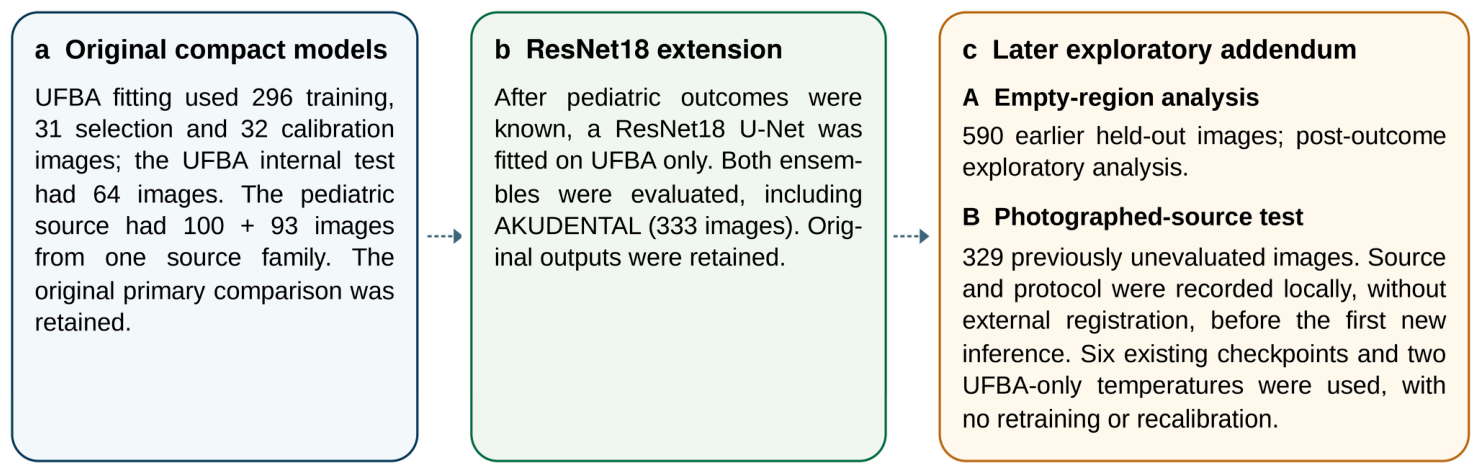
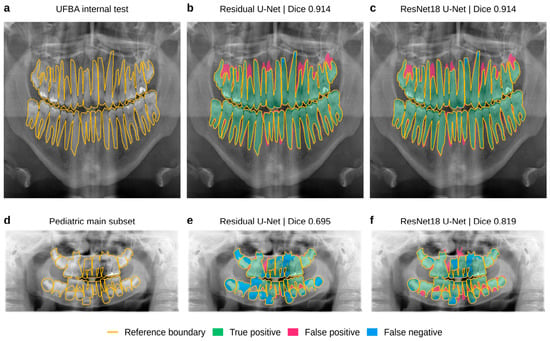
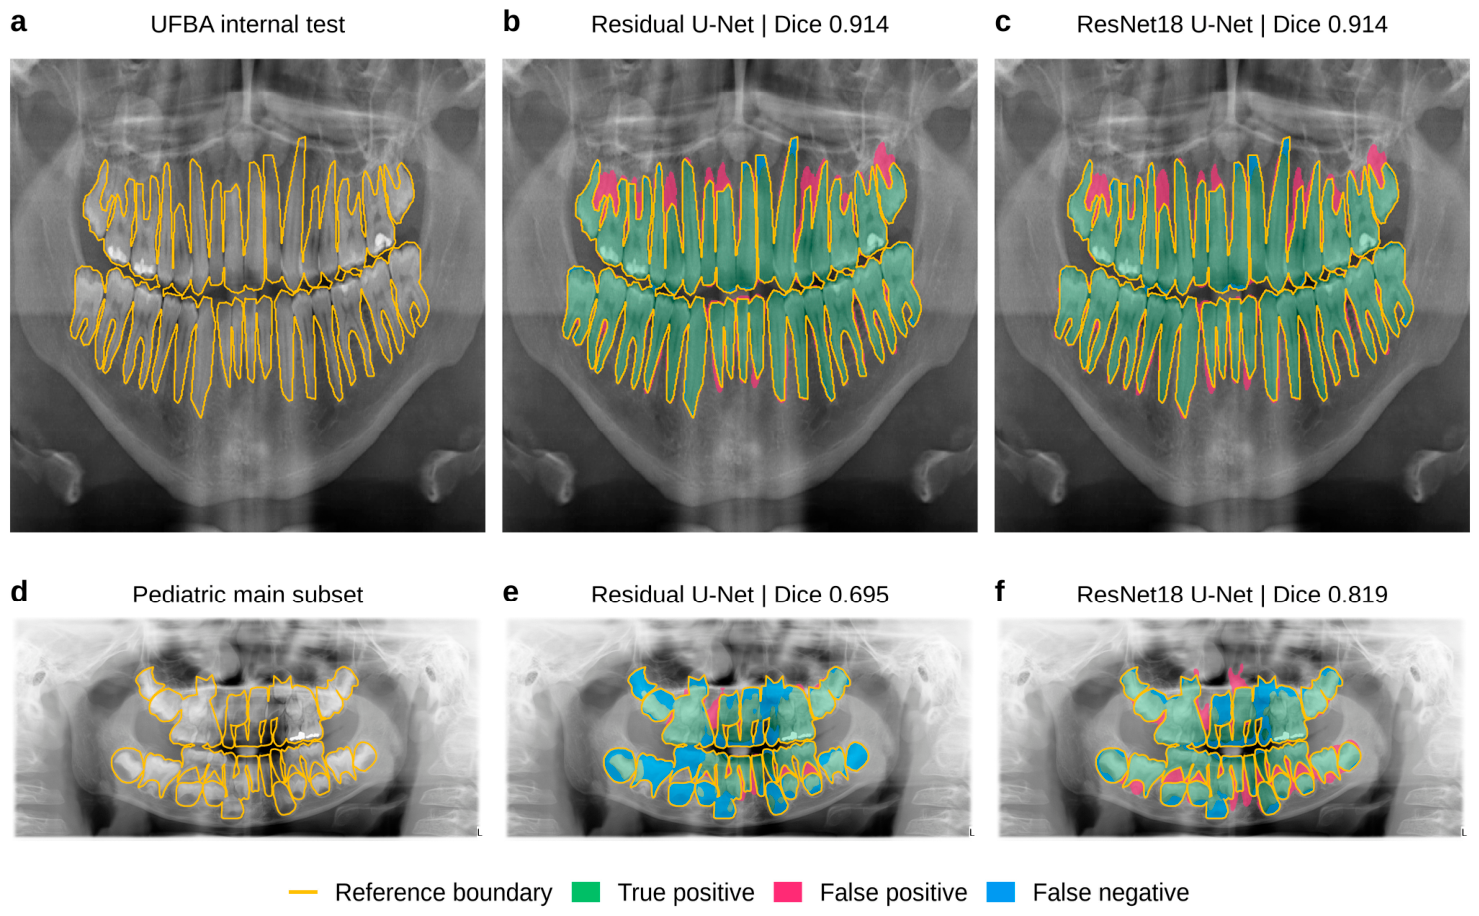
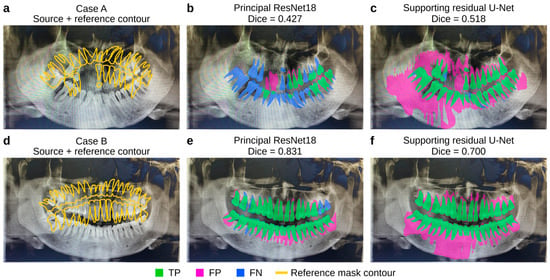
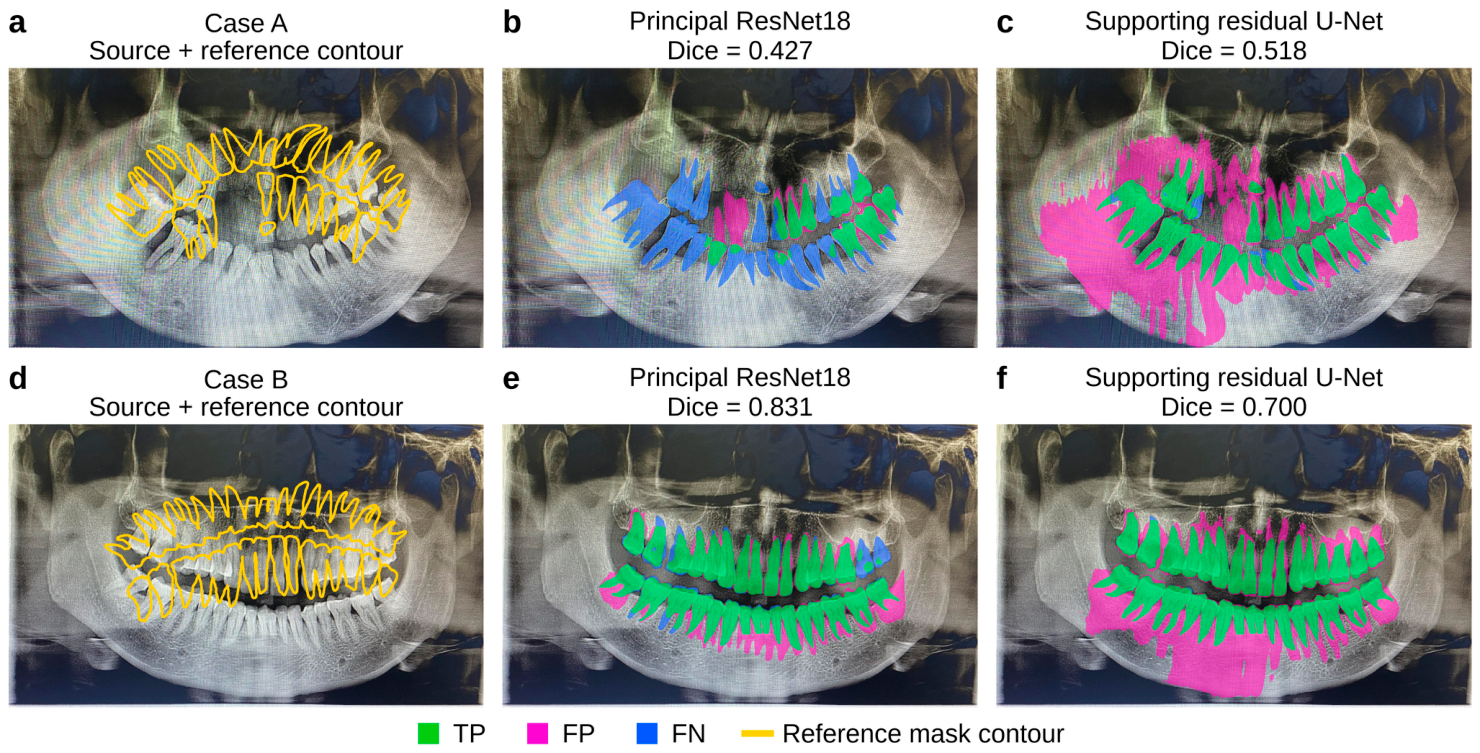
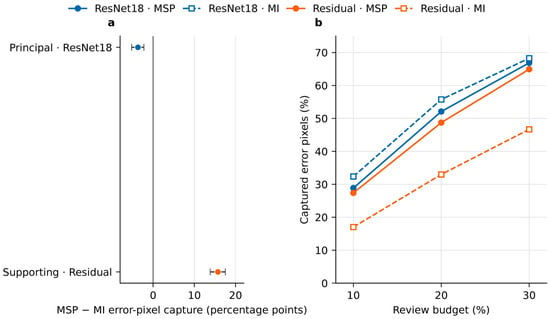
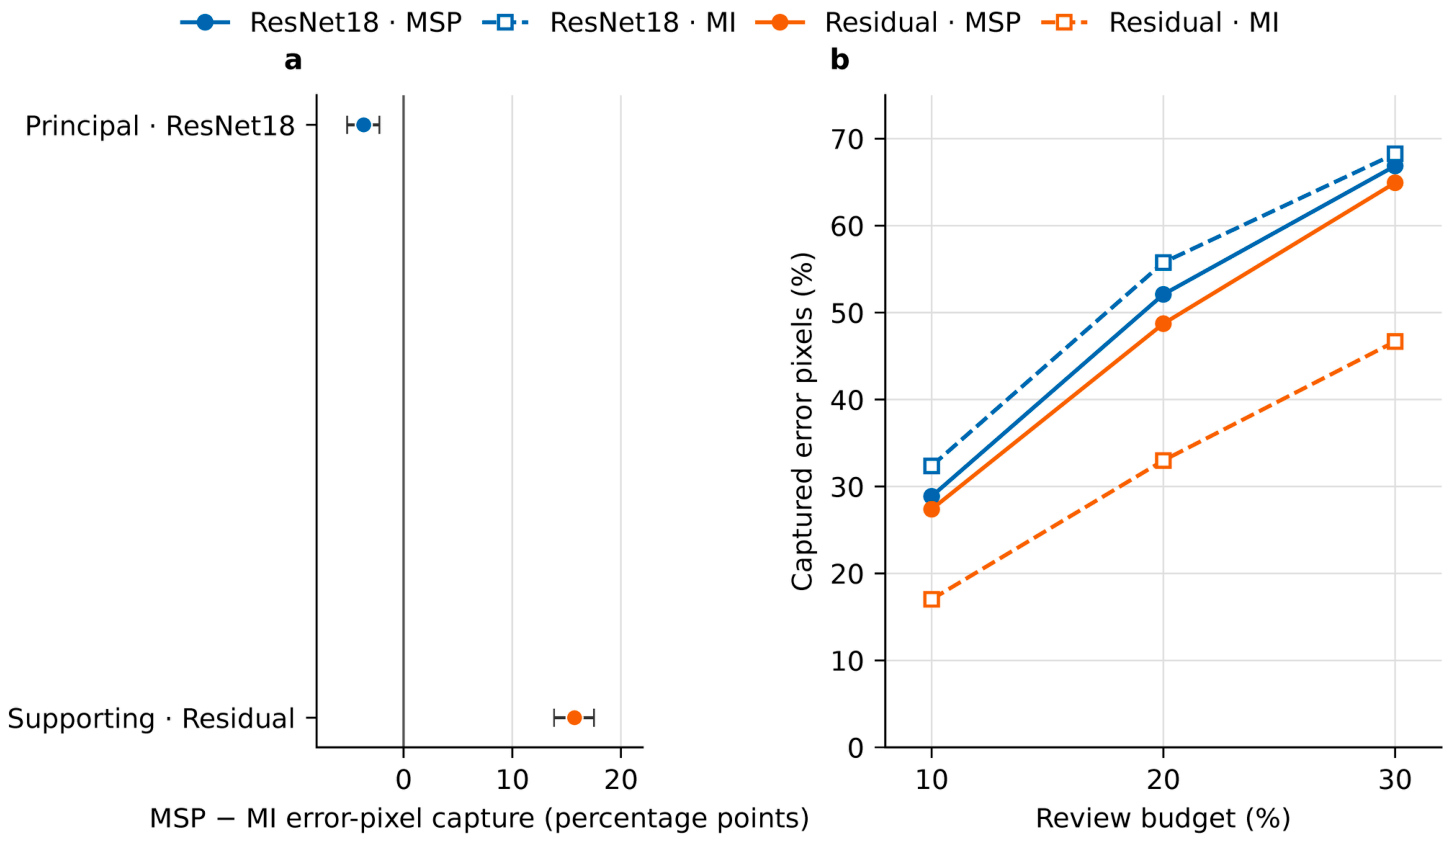
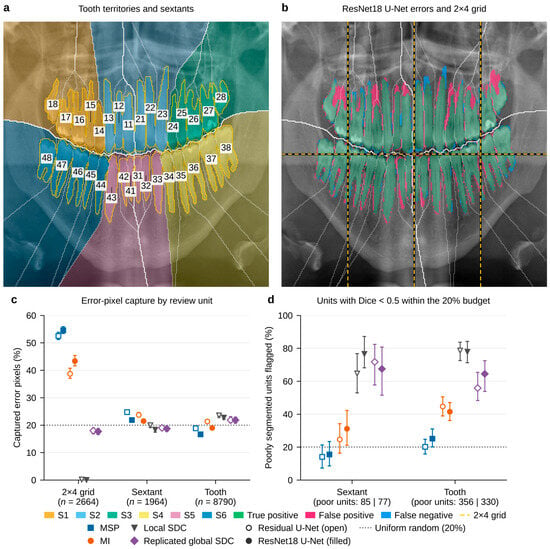
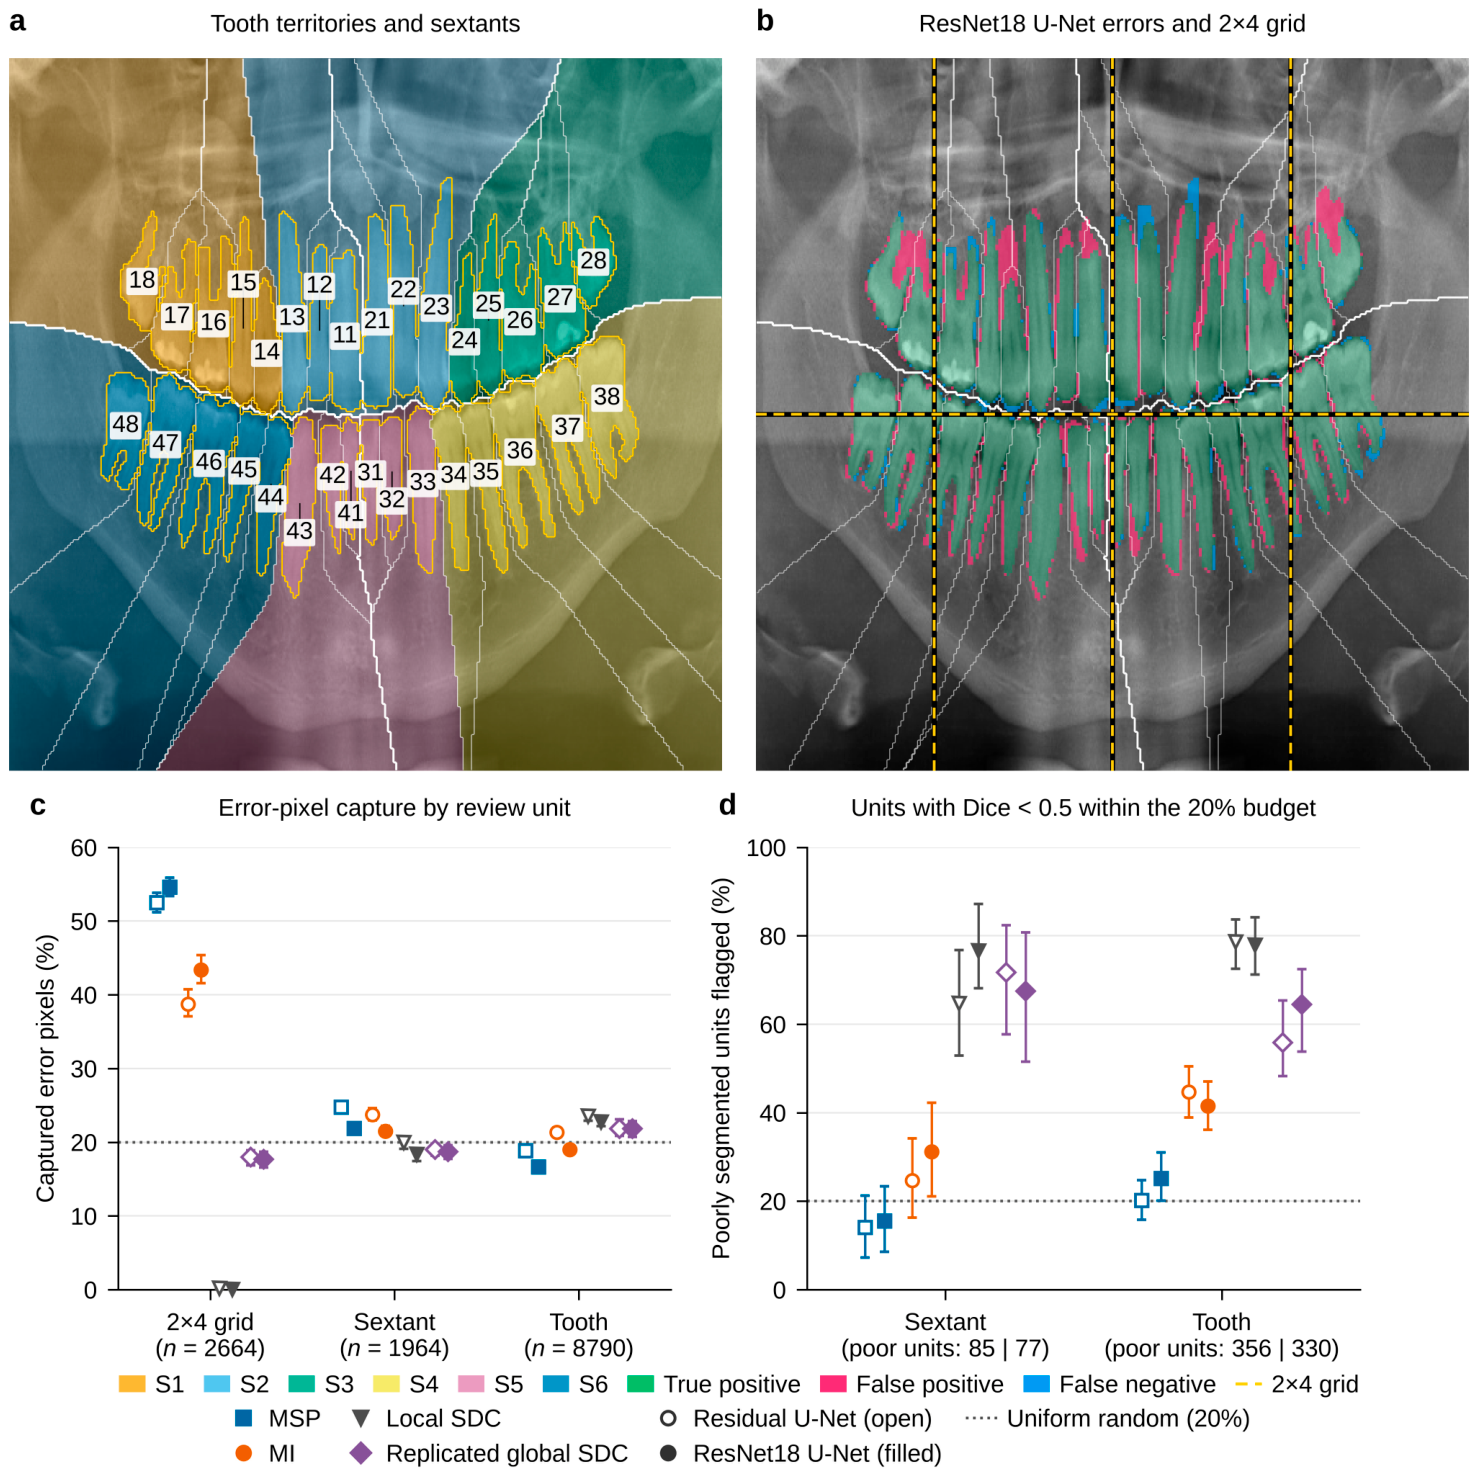
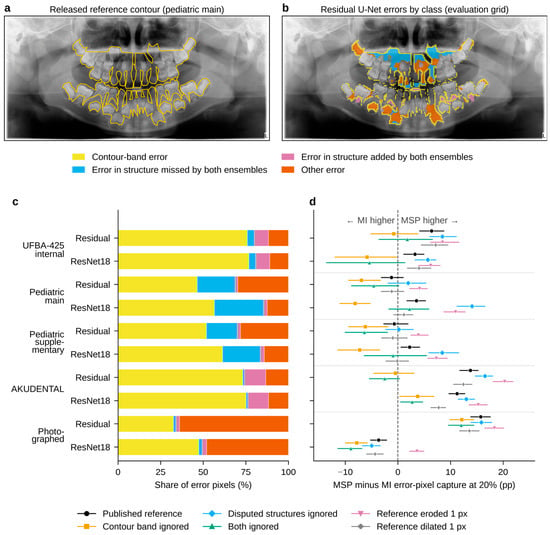
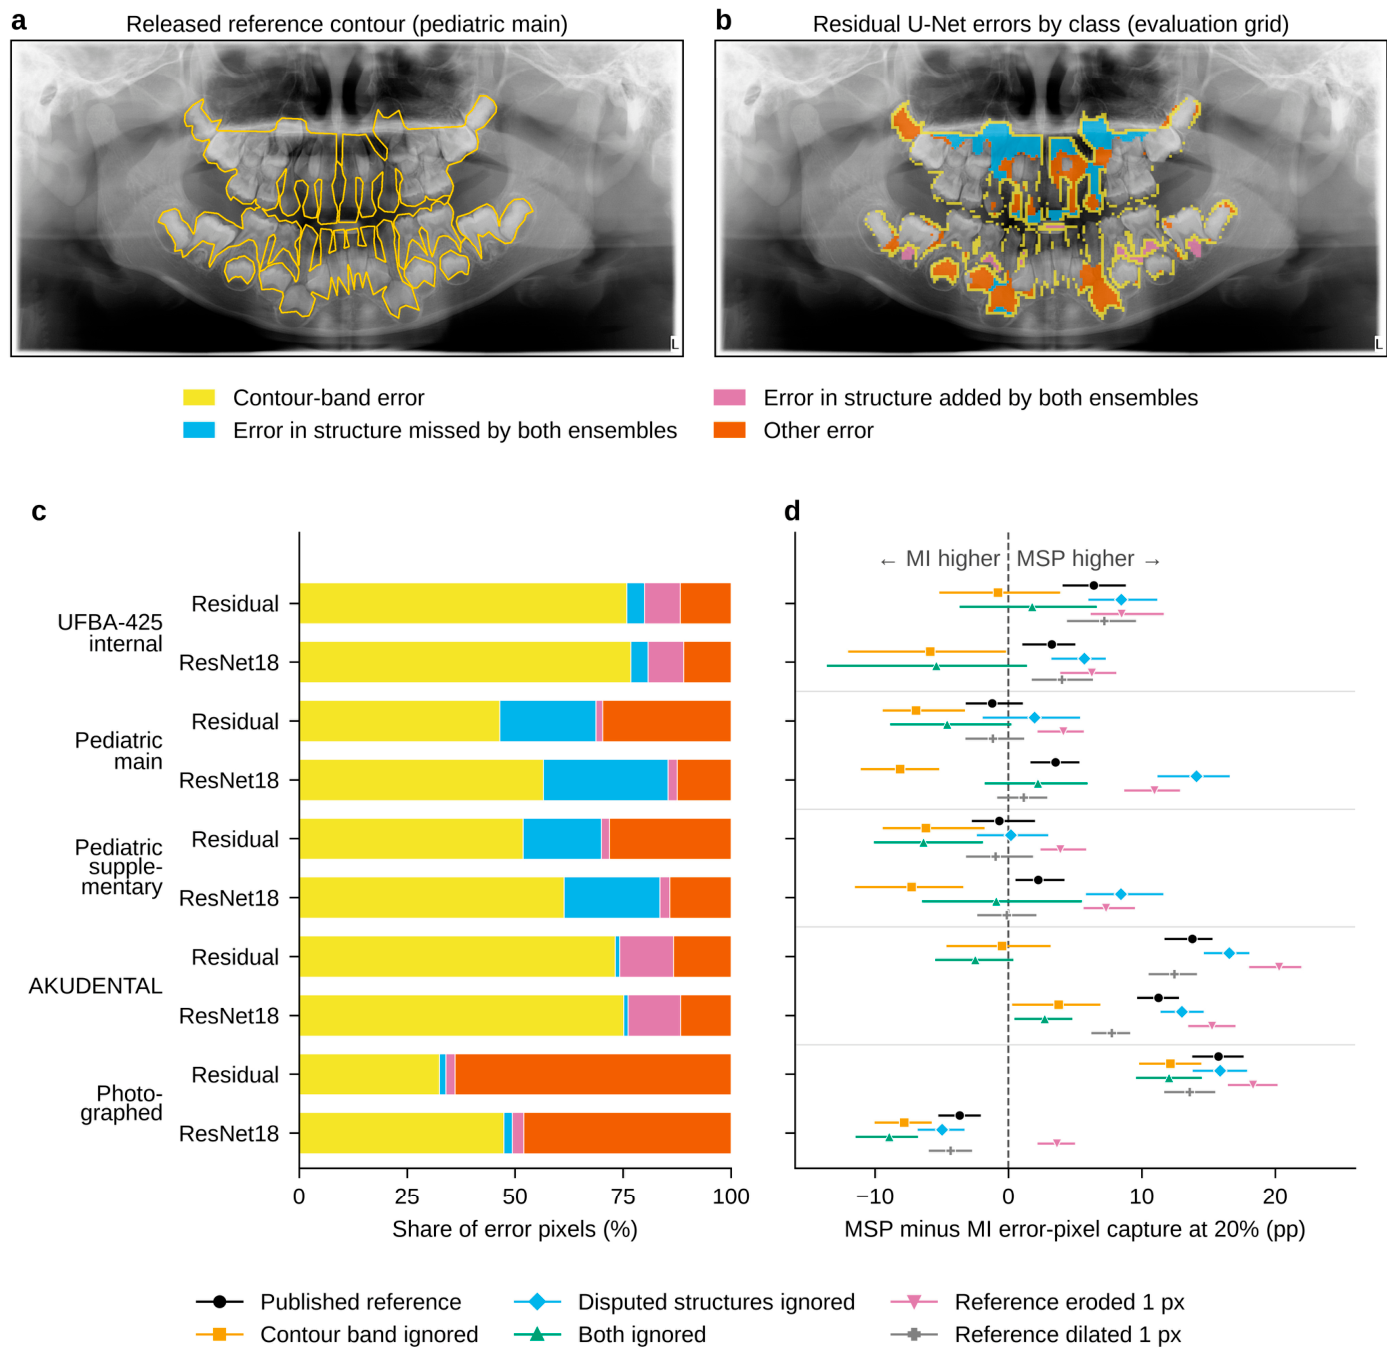

Disclaimer/Publisher’s Note: The statements, opinions and data contained in all publications are solely those of the individual author(s) and contributor(s) and not of MDPI and/or the editor(s). MDPI and/or the editor(s) disclaim responsibility for any injury to people or property resulting from any ideas, methods, instructions or products referred to in the content. |
© 2026 by the author. Licensee MDPI, Basel, Switzerland. This article is an open access article distributed under the terms and conditions of the Creative Commons Attribution (CC BY) license.