


Abstract
Background/Objectives: Fibroblast activation protein inhibitor (FAPI)-directed PET/CT has emerged as a promising approach for non-invasive assessment of arterial wall pathology. While a target-to-background ratio (TBR) threshold of 1.6 has previously been applied for vascular [68Ga]Ga-FAPI-04 imaging, no established threshold exists for [18F]F-FAPI-74. Given differences in physical imaging characteristics and tracer kinetics, this study systematically evaluated candidate TBR thresholds for arterial [18F]F-FAPI-74 uptake, using CT-derived calcification as a morphological comparator. Methods: Seventy-two oncological patients undergoing [18F]F-FAPI-74 PET/CT were retrospectively analyzed. Six vascular territories were assessed for focal vessel wall-associated tracer uptake and CT-derived calcification. Three primary candidate TBR thresholds (1.2, 1.4, and 1.6) were selected for focused comparison, while complementary thresholds from 1.0 to 2.0 in increments of 0.1 were assessed descriptively. For each threshold, the number of FAPI-positive sites, proportion of FAPI-positive sites with concomitant calcification, and proportion of calcification-positive sites with concomitant FAPI uptake were determined. All co-localization measures were interpreted as descriptive morphological comparisons and not as measures of biological FAP expression, diagnostic sensitivity, or diagnostic accuracy. Results: Focal arterial uptake was detected in 69/72 patients (95.8%) at a TBR threshold of 1.2, 61/72 (84.7%) at 1.4 and 38/72 (52.8%) at 1.6. The corresponding numbers of FAPI-positive sites were 896, 452 and 220. Among the three primary candidate thresholds, the proportion of FAPI-positive sites with concomitant calcification remained broadly comparable (66.7%, 60.2%, and 68.2%, respectively), whereas the proportion of calcification-positive sites with concomitant FAPI uptake decreased from 23.4% at a TBR threshold of 1.2 to 10.7% at 1.4 and 5.9% at 1.6. Across the broader TBR range, lower thresholds, including 1.0 and 1.1, yielded greater site detection and numerically higher calcification co-localization than the TBR threshold of 1.2, and no unique empirical optimum was identified. Conclusions: A TBR threshold of 1.2 represents a pragmatic candidate threshold within the predefined primary range rather than an empirically optimized cut-off. Prospective validation in dedicated cardiovascular cohorts using standardized imaging protocols and biological reference standards is required before a generally applicable threshold for arterial [18F]F-FAPI-74 imaging can be established.
1. Introduction
Molecular imaging of fibroblast activation protein (FAP) using FAP inhibitor (FAPI)-directed positron emission tomography/computed tomography (PET/CT) has emerged as a potential approach for the non-invasive assessment of arterial wall pathology [1]. Beyond its established expression in activated fibroblasts, FAP has been identified in modulated vascular smooth muscle cells within atherosclerotic lesions and has been linked to fibroinflammatory plaque remodeling [2,3,4]. These observations provide a biological rationale for FAP-targeted imaging as a means of interrogating vascular processes that are not directly captured by conventional morphological imaging. Initial clinical studies using [68Ga]Ga-FAPI-04 have demonstrated measurable arterial tracer uptake and reported associations with established markers of atherosclerotic burden, including CT-derived vascular calcification [5,6].
Quantitative interpretation of vascular FAPI PET nevertheless remains incompletely standardized. Arterial uptake is commonly expressed as the target-to-background ratio (TBR), calculated from lesion maximum standardized uptake value (SUVmax) relative to blood-pool mean standardized uptake value (SUVmean) [5,6,7,8]. In contrast to imaging targets characterized by high lesion-to-background contrast, vascular FAPI uptake is frequently modest and occurs in small structures adjacent to circulating blood activity. The definition of threshold-defined FAPI uptake therefore depends substantially on the applied TBR threshold. Increasing the threshold improves separation from background activity but progressively reduces the number of detectable vascular uptake sites, whereas lower thresholds may include more borderline signal at the expense of including non-specific or borderline signal.
Previous cardiovascular studies with [68Ga]Ga-FAPI-04 have applied a TBR threshold of 1.6 to define focal arterial uptake [5,6]. Whether this threshold can be transferred directly to fluorine-18-labelled FAPI tracers is uncertain. 18F and 68Ga differ in their physical imaging characteristics, including positron energy and positron range, which may influence spatial resolution, recovery of activity from small vascular structures and consequently quantitative PET measurements [9]. In addition, tracer-specific pharmacokinetics, acquisition protocols and blood-pool activity may influence vascular TBR. A dedicated evaluation of potential thresholds for [18F]F-FAPI-74 is therefore warranted rather than adopting a threshold derived from another radiopharmaceutical.
CT-defined vascular calcification provides a readily available morphological reference for such an exploratory evaluation but does not represent a biological reference standard for FAP expression [10]. Calcification reflects cumulative structural atherosclerotic burden, whereas FAPI uptake may potentially indicate a distinct component of active fibroinflammatory remodeling [11]. Complete spatial co-localization between both imaging findings should therefore not necessarily be expected. Moreover, CT acquisition parameters, including the use of low-dose attenuation-correction versus contrast-enhanced diagnostic CT, may affect the detection and classification of calcification and require consideration when interpreting site-level co-localization.
The present study therefore aimed to systematically explore candidate TBR thresholds for defining focal arterial [18F]F-FAPI-74 uptake. Threshold-dependent changes in the prevalence and number of detected uptake sites were assessed together with their site-level co-localization with CT-derived vascular calcification, using calcification as a pragmatic morphological comparator rather than a biological reference standard. Complementary thresholds were additionally evaluated descriptively to characterize the behavior of vascular FAPI detection across a broader range of potential cut-offs.
2. Materials and Methods
2.1. Study Population
A retrospective analysis was conducted at the Department of Nuclear Medicine, LMU University Hospital Munich, including consecutive patients who underwent oncological [18F]F-FAPI-74 PET/CT imaging. Patients who received systemic antitumor therapy within 4 weeks before the PET/CT were excluded to minimize potential short-term treatment-related modulation of FAPI uptake. All study procedures were carried out in accordance with the Declaration of Helsinki and the requirements of the German Medicines Products Act (§13(2b)). Ethical clearance was granted by the Ethics Committee of Ludwig-Maximilians-University Munich (IRB #24-0255_1).
2.2. Radiopharmaceutical Preparation
The FAPI-74 precursor was obtained in GMP grade from SOFIE Biosciences (Dulles, VA, USA) and [18F]Fluoride was produced on site using a 16.5 MeV PETtrace cyclotron (GE Healthcare, Uppsala, Sweden) via the 18O(p,n)18F nuclear reaction. The radiosynthesis was performed according to a previously published method [12] on an AllinOne® module using a FAPI-74 cassette and reagent kits (Trasis, Liège, Belgium). The synthesis started with preformulating aluminum chloride in dimethyl sulfoxide and acetonitrile as well as pH adjustment to a value of 4 to 5 with ascorbic acid. With starting activities of 53 ± 8 GBq [18F]Fluoride was trapped on a QMA cartridge and eluted by a NaCl-based eluent. The radiolabeling step was performed at 70 °C for 10 min and the crude product was purified by SPE (tC18) followed by formulation in a sodium ascorbate-containing matrix. The short sequence yielded radiochemical yields (RCY) of 69 ± 11% (n = 87) with a radiochemical purity (RCP) of 99.4 ± 0.3% (n = 87) without HPLC purification. The product was sterile filtered through a Merck Cathivex-GV and subsequently dispensed. The specific activity of the final product at EOS was between 1729 GBq/µmol and 10,286 GBq/µmol. The final product underwent a quality control procedure in accordance with methods of the European Pharmacopoeia.
2.3. PET/CT Acquisition
Patients received an intravenous bolus injection of [18F]F-FAPI-74 at a median administered activity of 227.5 MBq (IQR 63.5). PET imaging was initiated 63 min (median; IQR 24.5) after tracer injection from skull base to mid-thigh at 2.5 min per bed position (Siemens Biograph mCT Flow or Siemens Biograph 64 PET/CT system; Siemens Healthineers, Erlangen, Germany). Both PET/CT systems were EARL-certified and operated under standardized quantitative performance requirements. Unless contraindicated, intravenous furosemide (20 mg/2 mL) was administered to minimise urinary tracer accumulation within the renal collecting system. The CT component comprised either a contrast-enhanced diagnostic acquisition (n = 20) or a low-dose attenuation correction scan (n = 52), determined by the availability of recent cross-sectional imaging. PET emission data were reconstructed iteratively using the TrueX algorithm (3 iterations, 21 subsets), followed by Gaussian post-filter smoothing with a full width at half-maximum of 2 mm. Fused PET/CT datasets were reviewed using Hermes Hybrid Viewer (Hermes Medical Solutions, Stockholm, Sweden).
2.4. Threshold Evaluation
Fused PET/CT datasets were reviewed by a single reader for vessel-wall-associated FAPI uptake and spatially concomitant CT-derived calcification.
To evaluate candidate TBR thresholds for arterial threshold-defined FAPI uptake, three primary thresholds (TBR threshold of 1.2, 1.4, and 1.6) were selected for focused evaluation. In addition, complementary thresholds ranging from 1.0 to 2.0 in increments of 0.1 were assessed descriptively to characterize threshold-dependent changes across the full range of potential cut-offs and to support evaluation of the robustness of the candidate thresholds. The three primary thresholds were defined before threshold-specific outcome comparisons: 1.6 reflected prior cardiovascular FAPI work [6], whereas 1.2 and 1.4 represented lower and intermediate alternatives for characterizing threshold-dependent uptake classification and calcification co-localization.
For each threshold, the total number of FAPI-positive (FAPI+) uptake sites, the proportion of patients with at least one FAPI+ site, the proportion of FAPI+ sites with concomitant CT-derived calcification, and the proportion of calcification-positive sites with concomitant FAPI uptake were determined. Threshold-defined FAPI+ denotes uptake above the specified TBR and is a measurement label only; it does not imply histologically confirmed FAP expression, a specific cellular source, or diagnostic validity. FAPI uptake and calcification were considered concomitant when both findings spatially co-localized at the same arterial wall site on fused PET/CT images. Six major vascular territories were systematically evaluated for the presence of calcified plaques and focal vessel wall-associated tracer uptake: the ascending aorta, aortic arch, descending thoracic aorta, abdominal aorta as well as the left and right iliac arteries [6]. Uptake was considered vessel wall-associated only when anatomically colocalized with the arterial wall on fused PET/CT images and clearly distinguishable from adjacent tumor lesions, lymph nodes or physiological tracer accumulation. A site was defined as an individual focal vessel wall-associated uptake or calcification focus within one of the six predefined vascular territories; multiple sites could be recorded within the same vascular territory when spatially distinct. Three-dimensional ellipsoidal volumes of interest (VOIs) of 10 mm diameter were placed at each site of focal tracer uptake, and the maximum standardised uptake value (SUVmax) was recorded. For threshold comparisons, uptake sites were classified according to their measured TBR at each cut-off within the same predefined spatial measurement framework. All datasets were initially assessed by one primary reader. In cases of uncertainty, a second reader was consulted and the final classification was established by consensus.
Background activity was assessed from three ellipsoidal VOIs of 10 mm diameter positioned within the mid-lumen of the superior vena cava on non-adjacent slices, yielding the mean blood-pool SUVmean. The TBR was calculated as the ratio of lesion SUVmax to blood-pool SUVmean [5,6].
Vascular calcification was assessed across all six territories. Calcification-positive (CP+) sites were defined as focal high attenuation of ≥130 Hounsfield units (HU) within the vessel wall on CT images [6]. Because no histological or other biological reference standard was available, CT-derived calcification was used only for descriptive morphological co-localization. No threshold was therefore evaluated for biological sensitivity, specificity, or diagnostic accuracy.
2.5. Statistical Analysis
Categorical variables are reported as counts with percentages. Continuous variables are presented as mean ± standard deviation (SD) or median with interquartile range (IQR), depending on data distribution. Threshold-specific detection metrics were calculated descriptively across TBR values from 1.0 to 2.0 in increments of 0.1. Inferential comparisons were restricted to the three primary candidate thresholds of 1.2, 1.4, and 1.6. The number of FAPI+ sites per patient across the three thresholds was compared using the Friedman test with Dunn’s multiple comparisons. The patient was the statistical unit for this repeated-measures analysis. Site-level co-localization proportions were summarized descriptively only. No inferential testing of site-level proportions was performed under an assumption of independent vascular sites, because multiple sites were clustered within patients and threshold classifications were deterministically nested. Patient-level proportions were accompanied by descriptive 95% Wilson confidence intervals. Aggregate site counts were not interpreted as independent sample sizes. As a protocol-stratified exploratory sensitivity analysis, threshold-specific co-localization proportions were summarized separately for low-dose attenuation-correction CT and contrast-enhanced diagnostic CT. Statistical significance was defined as p < 0.05. All statistical analyses were performed using GraphPad Prism (version 10.6.1, GraphPad Software, La Jolla, CA, USA).
3. Results
3.1. Patients’ Characteristics
In total, 72 oncological patients were included in the analysis. The cohort was predominantly male (73.6%, n = 53), with a mean age of 72 ± 11 years (Table 1).
Table 1.
Patients’ characteristics.
3.2. Vascular [18F]F-FAPI-74 Uptake Across TBR Thresholds
Focal arterial [18F]F-FAPI-74 uptake was evaluated at three predefined candidate TBR thresholds of 1.2, 1.4, and 1.6. At the lowest primary candidate evaluated threshold of 1.2, focal arterial uptake was detected in 69 of 72 patients (95.8%), comprising 896 uptake sites across all vascular territories. With increasing threshold values, both the number of patients with detectable uptake and the total number of identified uptake sites declined progressively (TBR threshold of 1.4: 61/72 patients (84.7%) and 452 uptake sites; TBR threshold of 1.6: 38/72 patients (52.8%) and 220 uptake sites; Table 2). The number of FAPI+ sites per patient decreased significantly across the three thresholds (Friedman test p < 0.01; Dunn’s multiple comparisons). Corresponding threshold-specific uptake characteristics are provided in Table 2. Descriptive Wilson 95% confidence intervals for the patient-level proportions were 88.5–98.6%, 74.7–91.3%, and 41.4–63.9%, respectively. Because multiple vascular sites originated from the same patients and threshold classifications were nested, site-level co-localization proportions were interpreted descriptively. The inferential comparison was performed only at the patient level, whereas aggregate vascular site counts were not treated as independent observations.
Table 2.
Overview of uptake metrics across TBR thresholds.
Detailed uptake characteristics per vascular territory for each threshold are provided in Supplemental Table S1–S3, showing a consistent decline of detected uptake sites across all investigated vessels with increasing TBR.
To further characterize threshold-dependent changes, complementary TBR thresholds from 1.0 to 2.0 in increments of 0.1 were evaluated descriptively; corresponding patient-level and site-level detection metrics are provided in Supplemental Table S4. Thresholds of 1.0 and 1.1 yielded more threshold-defined uptake sites and numerically higher descriptive co-localization with CT-derived calcification than the threshold of 1.2. Accordingly, the complementary analysis did not identify a unique empirical optimum.
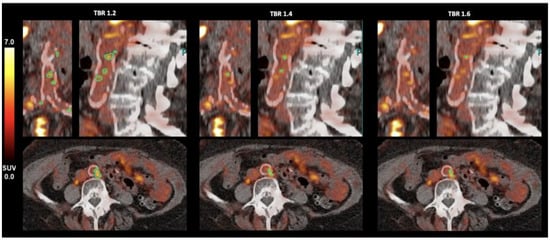
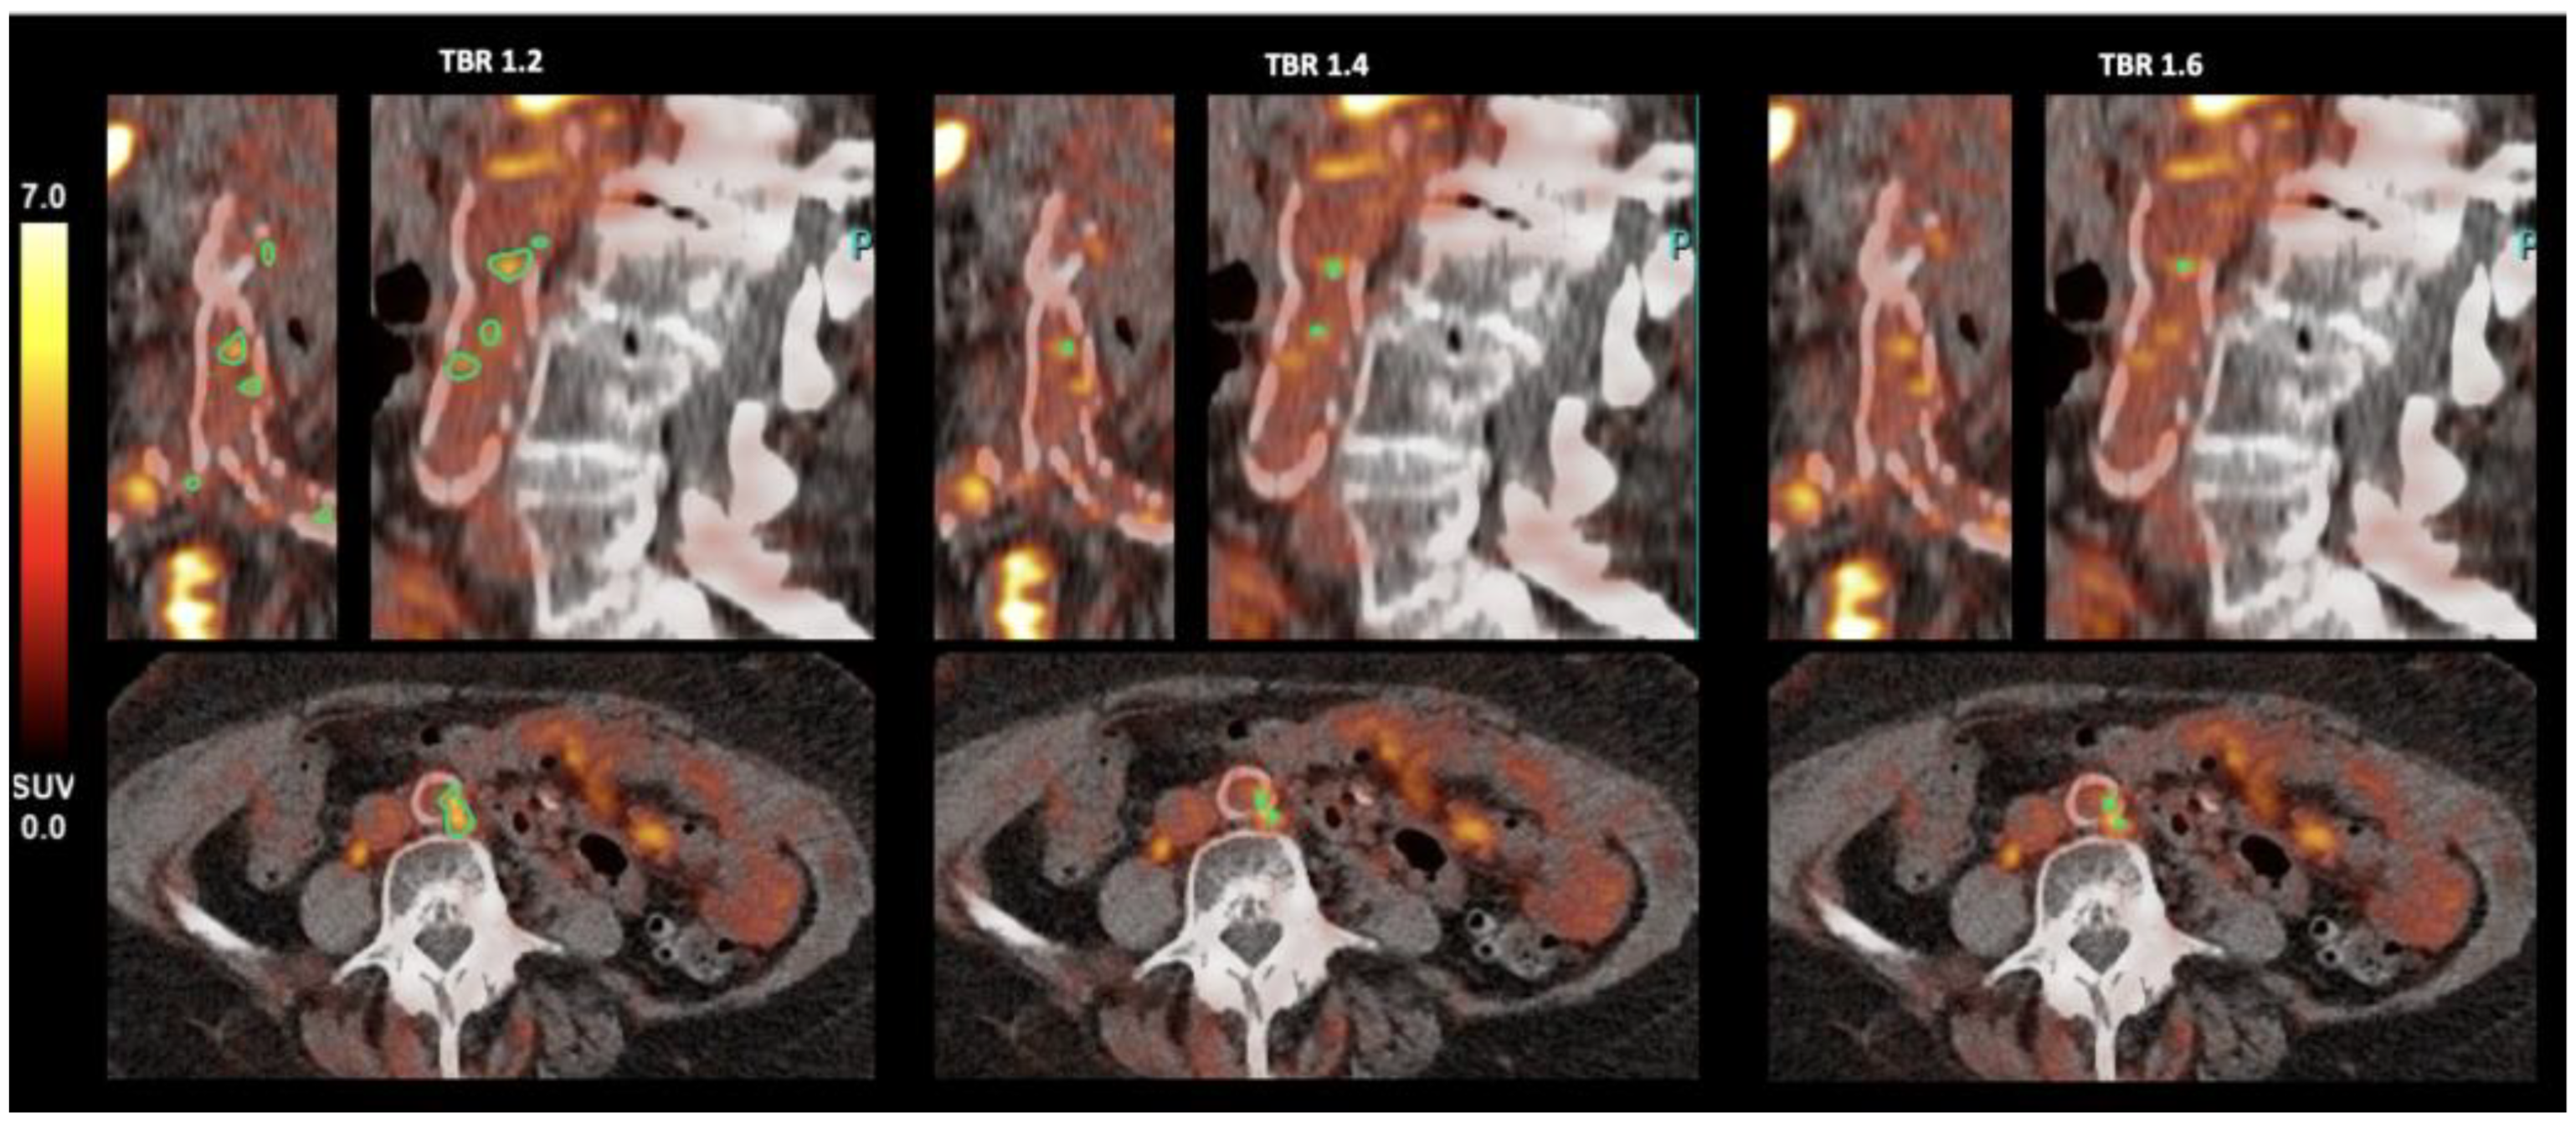
Representative fused PET/CT images of the abdominal aorta at the three evaluated thresholds are shown in Figure 1.
Figure 1.
Threshold-dependent visualisation of vascular [18F]F-FAPI-74 uptake in the abdominal aorta. Representative fused PET/CT images of the abdominal aorta in a 75-year-old female patient (blood-pool SUVmean 2.50), demonstrating threshold-dependent detection of focal arterial [18F]F-FAPI-74 uptake. Each column shows the same threshold in axial, coronal and sagittal views: left TBR threshold 1.2, middle TBR threshold 1.4, right TBR threshold 1.6. With increasing TBR threshold, the number of detected FAPI-positive sites (green) decreases progressively, illustrating the impact of threshold selection and lesion detectability. FAPI fibroblast activation protein inhibitor; PET/CT positron emission tomography/computed tomography; SUV standardised uptake value; TBR target-to-background ratio.
3.3. Site-Level Morphological Co-Localization Between [18F]F-FAPI-74 Uptake and CT-Derived Calcification
Site-level co-localization was summarized across the three predefined candidate TBR thresholds. Because CT-derived calcification was used as a morphological comparator only, these proportions were not interpreted as biological validation of arterial FAP expression or as diagnostic sensitivity.
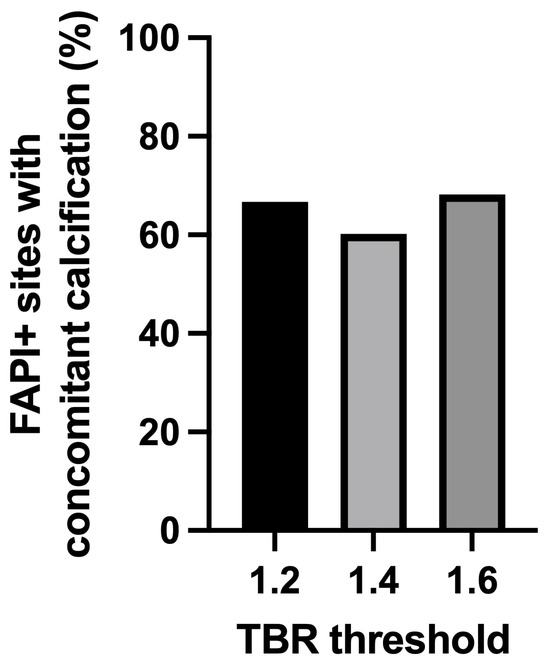
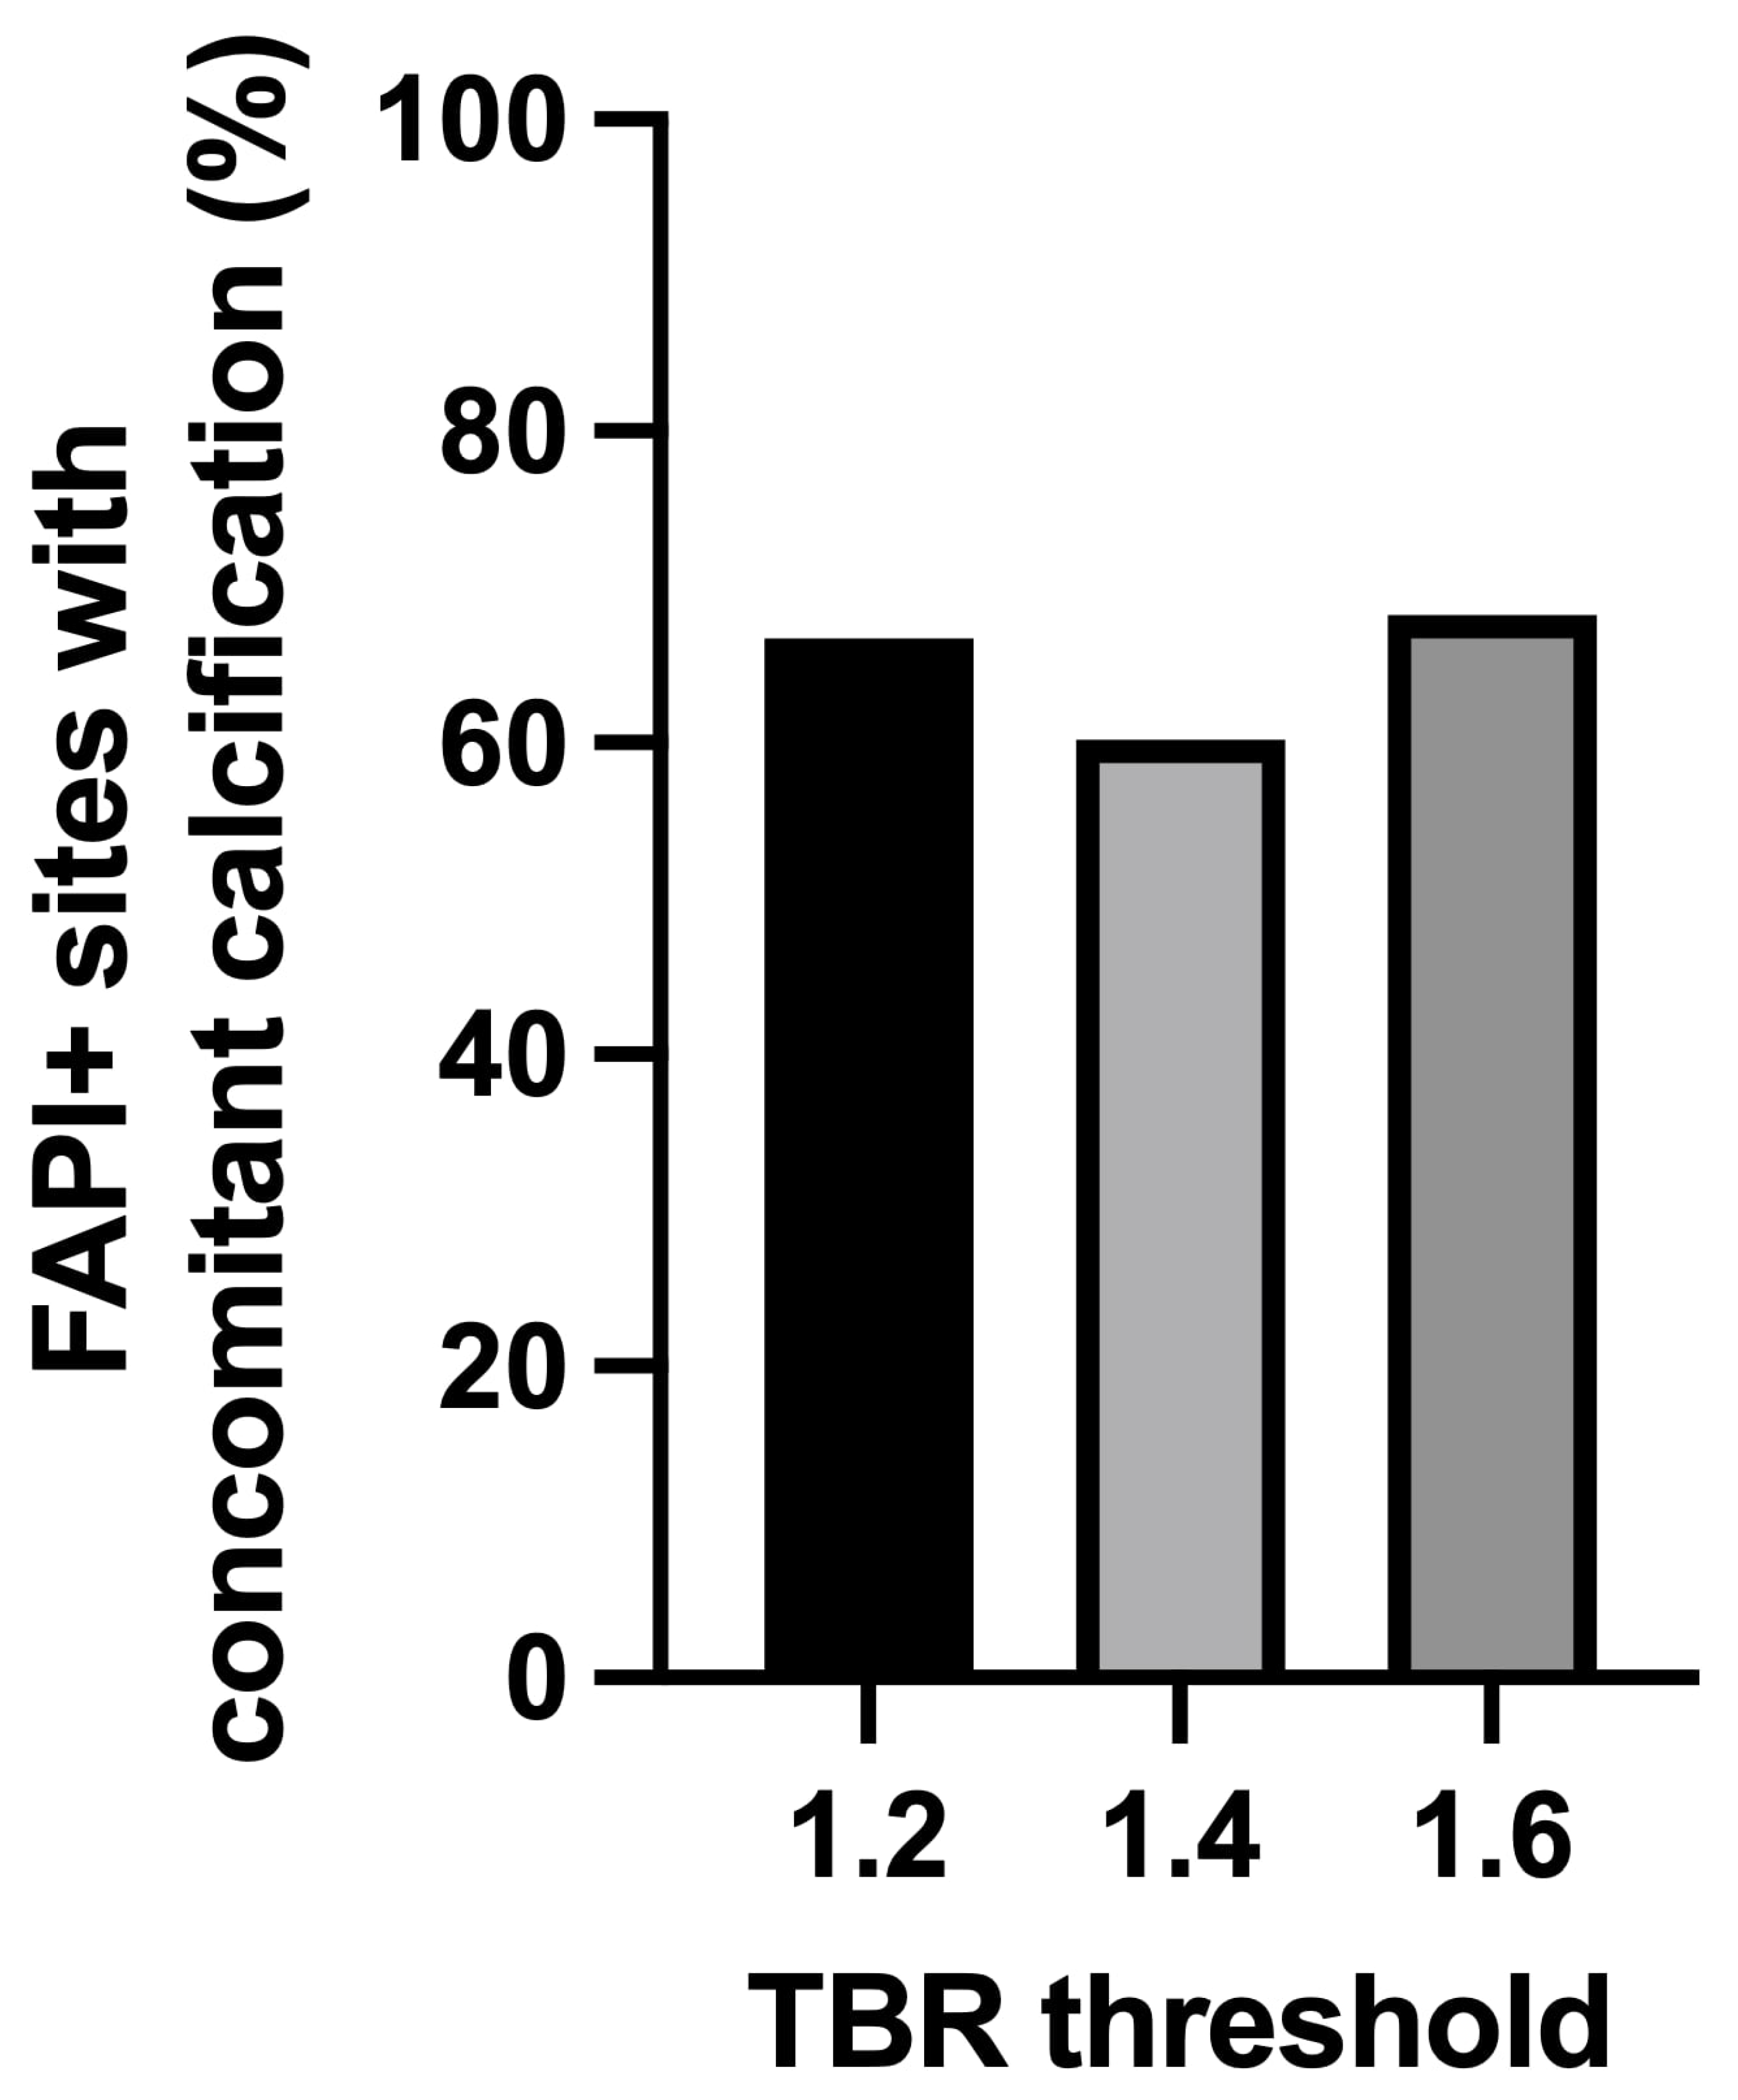
The proportion of FAPI-positive sites with concomitant CT-derived vessel wall calcification was 66.7% (598/896) at a TBR threshold of 1.2, 60.2% (272/452) at a TBR threshold of 1.4, and 68.2% (150/220) at a TBR threshold of 1.6 (Table 2, Figure 2).
Figure 2.
Proportion of FAPI+ sites with concomitant CT-derived calcification across TBR thresholds. Bar chart showing the proportion of FAPI+ sites with concomitant CT-derived vessel calcification at TBR thresholds. For a TBR threshold of 1.2 598/896 (66.7%) FAPI+ sites showed concomitant calcification, for 1.4 272/452 (60.2%) and for 1.6 150/220 (68.2%). Here, FAPI+ denotes threshold-defined uptake above the specified TBR and not histologically validated FAP expression; CT-derived calcification is shown as a morphological comparator and not as a biological reference standard or diagnostic reference. CP+ calcification-positive; FAPI fibroblast activation protein inhibitor; TBR target-to-background ratio.
Marked territory-level heterogeneity was observed, with the proportion of FAPI-positive sites showing concomitant calcification ranging from 17.1% in the ascending aorta to 94.4% in the left iliac artery at TBR 1.2 (Supplemental Table S1).
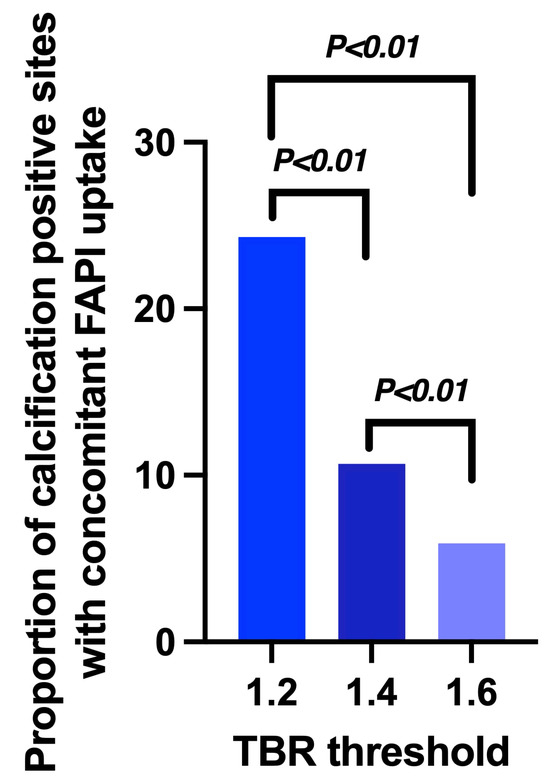
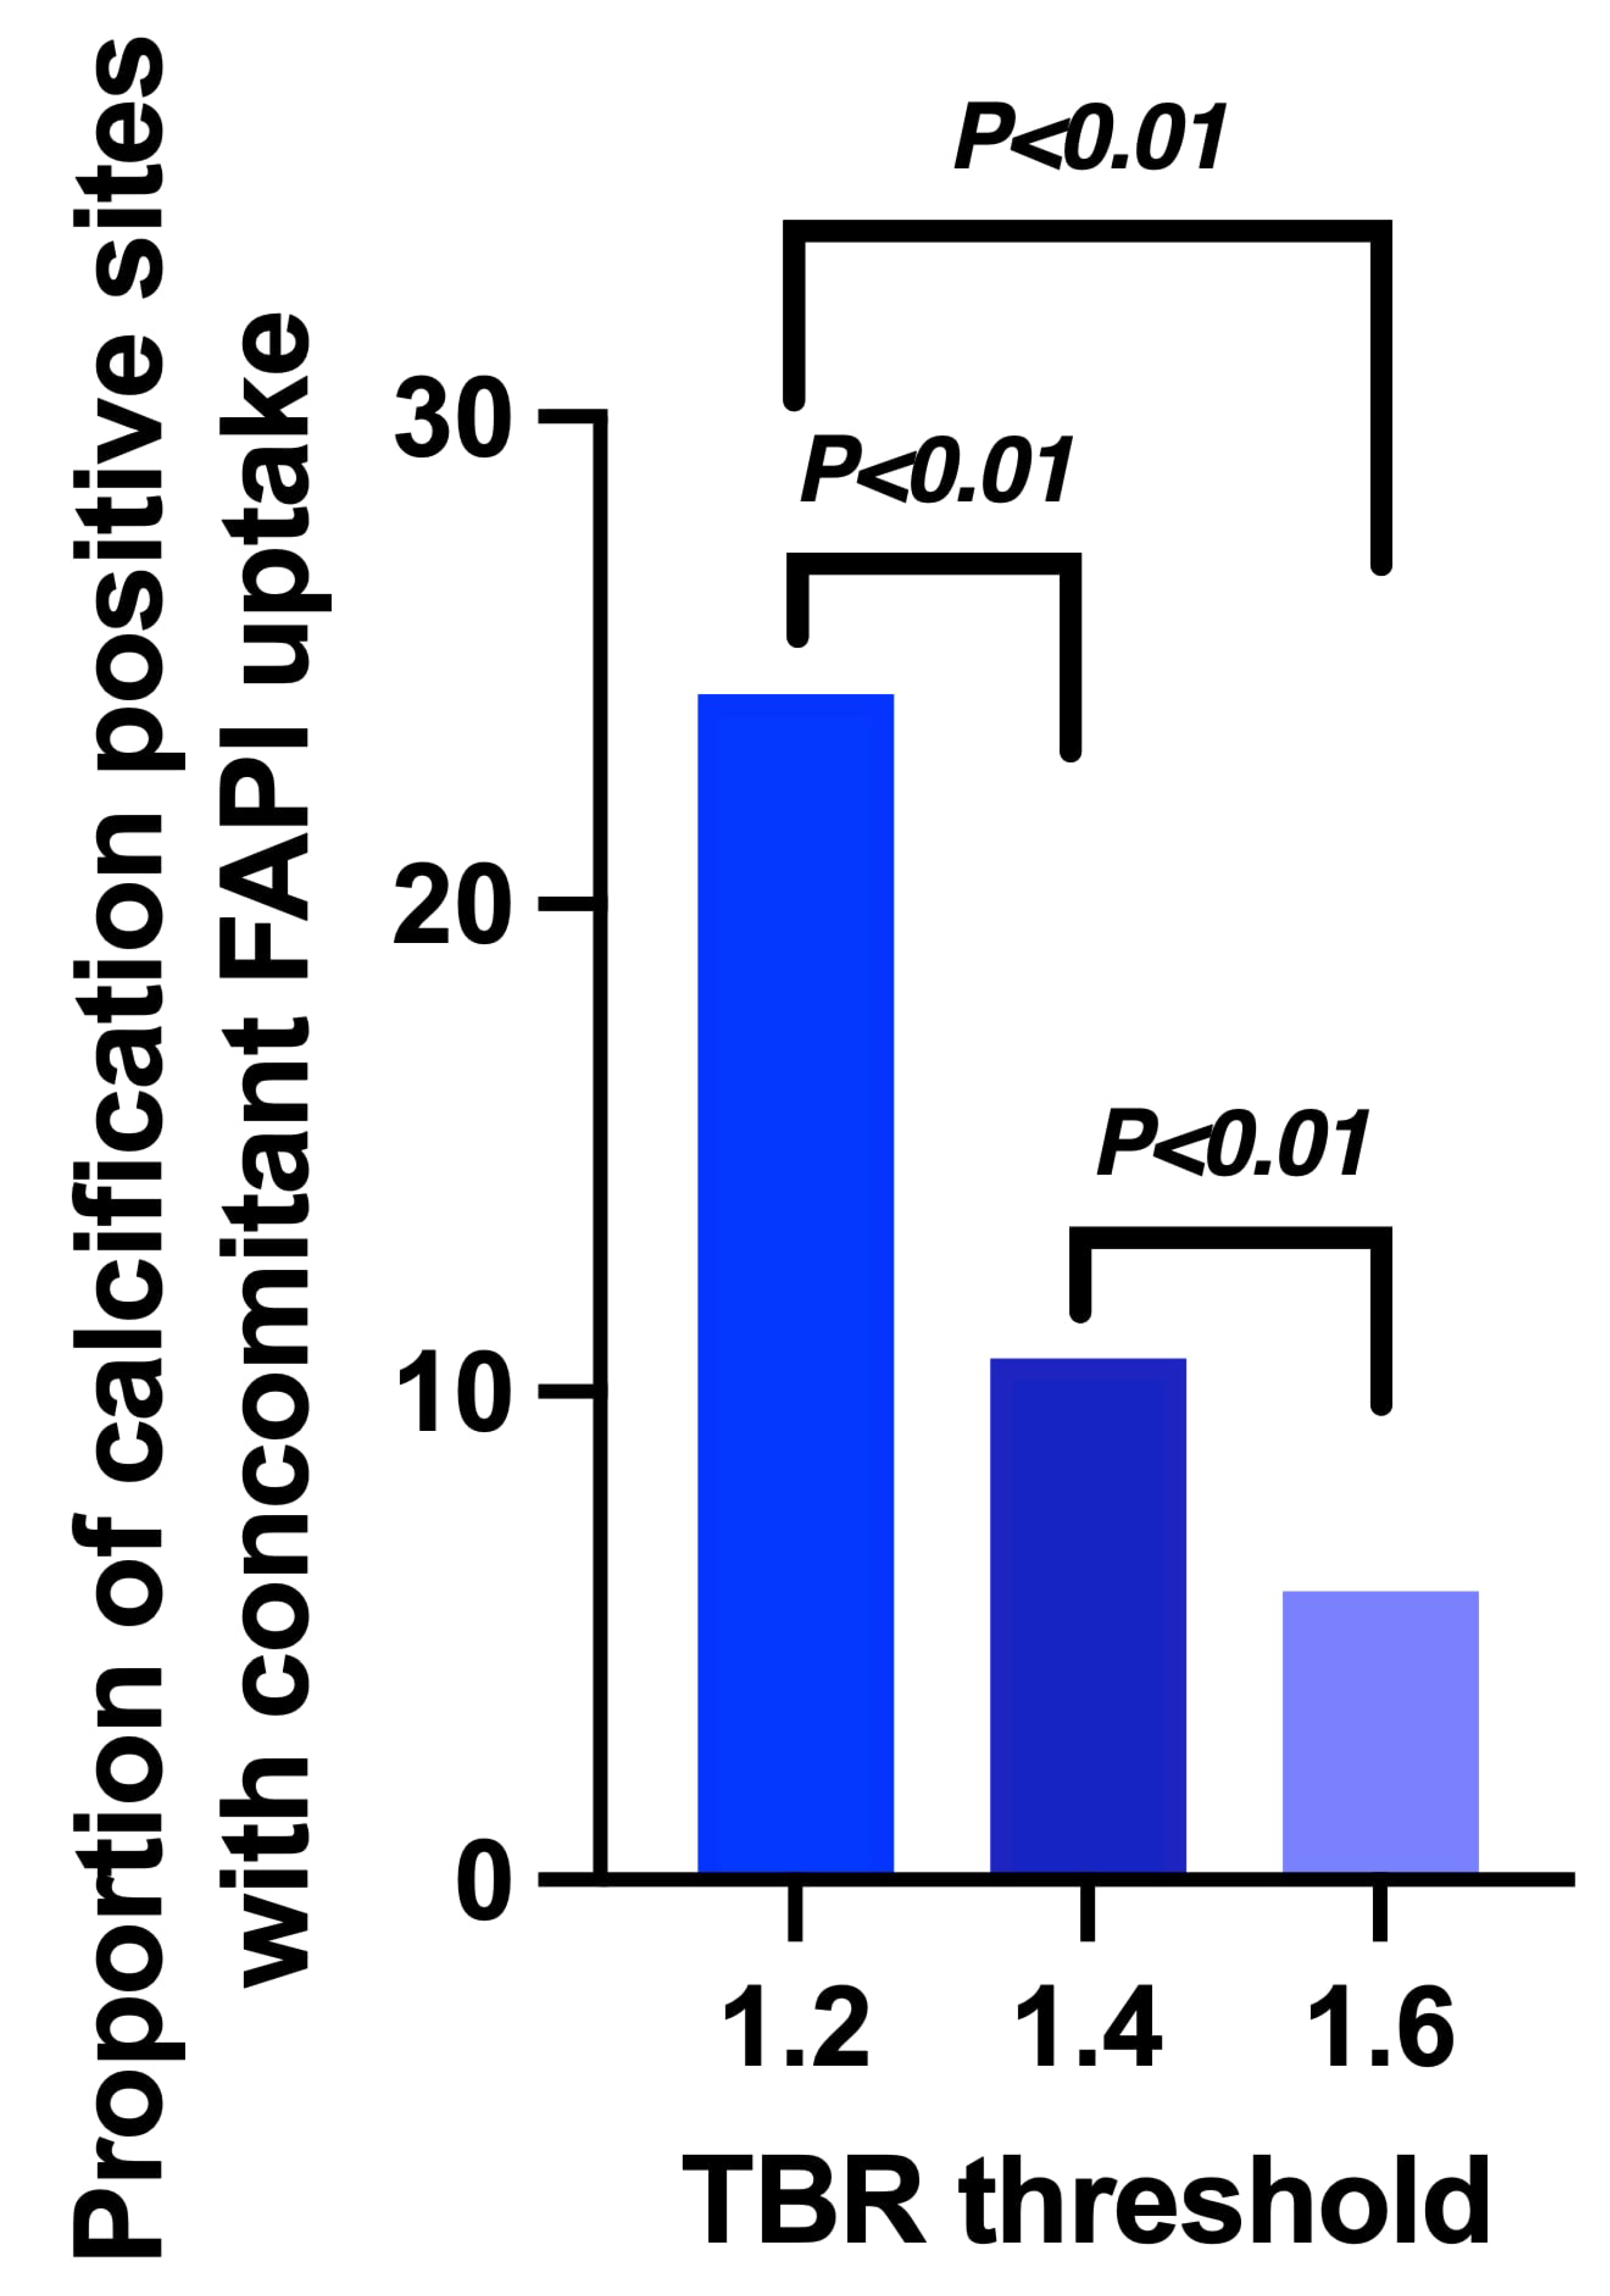
Using CT-defined calcification-positive sites as the reference, the proportion of calcification-positive sites with concomitant FAPI uptake decreased with increasing TBR threshold: 598 of 2553 calcification-positive sites (23.4%) showed concomitant threshold-defined FAPI uptake at 1.2, compared with 272 of 2553 (10.7%) at 1.4 and 150 of 2553 (5.9%) at 1.6 (Table 2; Figure 3). The number of CP+ sites in patients with low-dose CT was 1886 and in patients with diagnostic contrast-enhanced CT 667 with no significant difference in the median number of CP+ sites per patient (29.0, IQR 14.8–57.8 vs. 31.5, IQR 9.8–49.8; p = 0.66). These values represent descriptive morphological co-localization and must not be interpreted as diagnostic sensitivity or as evidence that the two signals reflect identical biological processes.
Figure 3.
Proportion of calcification-positive sites with concomitant FAPI uptake across TBR thresholds. Bar chart showing the proportion of CT-derived calcification-positive (CP+) sites with concomitant threshold-defined FAPI uptake at TBR thresholds (n (total) = 2553 CP+ sites). Here, FAPI+ denotes threshold-defined uptake above the specified TBR and not histologically validated FAP expression; CT-derived calcification is shown as a morphological comparator and not as a biological reference standard or diagnostic reference. CP+ calcification-positive; FAPI fibroblast activation protein inhibitor; TBR target-to-background ratio.
In an exploratory sensitivity analysis stratified by CT acquisition protocol, the proportion of FAPI+ sites with concomitant CT-derived calcification was higher for low-dose CT than for contrast-enhanced diagnostic CT at a TBR threshold of 1.2 (70.7% vs. 54.8%). Differences in the proportion of calcification-positive sites with concomitant FAPI uptake between CT protocols were smaller at TBR thresholds of 1.4 and 1.6 (Supplementary Table S5).
4. Discussion
The present study characterized threshold-dependent arterial [18F]F-FAPI-74 uptake and compared three primary candidate thresholds of 1.2, 1.4 and 1.6. Increasing the threshold progressively reduced both the number of patients with detectable arterial uptake and the number of FAPI-positive sites. Although the number of FAPI-positive sites per patient differed significantly across candidate thresholds, the proportion of FAPI-positive sites with concomitant CT-derived calcification remained broadly comparable. By contrast, the proportion of calcification-positive sites with concomitant FAPI uptake decreased from 23.4% at a TBR threshold of 1.2 to 10.7% at 1.4 and 5.9% at 1.6. Thus, TBR 1.2 yielded the greatest descriptive site detection among the three predefined primary thresholds, but this finding does not establish technical superiority. Because lower complementary thresholds of 1.0 and 1.1 yielded even more detected sites and numerically higher descriptive co-localization, TBR 1.2 should be regarded only as a pragmatic candidate within the predefined comparison range. The present dataset does not contain an independent technical criterion, such as test–retest reproducibility, reader reproducibility, normal arterial-wall signal distribution, or measurement stability, that would justify a preferred threshold.
Complementary evaluation across TBR thresholds from 1.0 to 2.0 confirmed the expected progressive decline in detected uptake sites with increasing TBR. Notably, the lower complementary thresholds of 1.0 and 1.1 yielded even higher proportions of calcification-positive sites with concomitant FAPI uptake and numerically higher proportions of FAPI-positive sites with concomitant calcification than the TBR threshold of 1.2. Accordingly, the broader analysis did not identify a unique empirical optimum and does not support interpretation of a TBR threshold of 1.2 as a statistically derived cut-off. Rather, the TBR threshold of 1.2 should be regarded as a pragmatic candidate threshold within the predefined primary range, warranting prospective validation against biological reference standards. Accordingly, TBR 1.2 should not be presented as the preferred threshold based on calcification co-localization alone. Because CT-derived calcification is not a biological reference standard, these co-localization measures cannot establish arterial FAP expression or diagnostic threshold performance.
The upper candidate threshold of 1.6 was selected because this cut-off has previously been applied in cardiovascular [68Ga]Ga-FAPI-04 PET/CT studies [5,6]. The different imaging characteristics of 18F and 68Ga, including lower positron energy and shorter positron range for 18F, provide a rationale for tracer-specific threshold evaluation [9]. However, these physical differences do not themselves imply that a lower threshold should necessarily be used. Vascular TBR is additionally influenced by tracer pharmacokinetics, blood-pool activity, spatial resolution, reconstruction methodology and acquisition timing. The threshold proposed here should therefore be considered specific to the investigated [18F]F-FAPI-74 imaging setting until independently validated. Within this predefined framework, 1.2 and 1.4 were selected as lower and intermediate alternatives to the literature-derived 1.6 threshold [6]. They were not derived by outcome-based optimization of the present dataset.
CT-derived calcification was used as a morphological comparator rather than a biological reference standard for arterial FAP expression. Accordingly, the reported proportions of calcification-positive sites with concomitant FAPI uptake should not be interpreted as diagnostic sensitivity for vascular FAP activity. Macrocalcification reflects cumulative structural atherosclerotic burden, whereas FAPI uptake may reflect fibroinflammatory remodeling and cellular plasticity within the arterial wall [3,4,5,13]. Wu et al. reported more pronounced FAPI uptake in non-calcified and low-level calcified arterial segments than in heavily calcified lesions [5], further indicating that FAPI uptake and CT calcification represent partially overlapping rather than interchangeable features of atherosclerotic disease. The absence of complete spatial co-localization is therefore biologically plausible, and direct histopathological validation against vascular FAP expression remains necessary. Accordingly, neither a TBR value nor co-localization with calcification can, by itself, identify the responsible cellular population or establish active FAP biology.
CT acquisition protocol represents an additional methodological consideration. In an exploratory stratified analysis, the proportion of FAPI+ sites with concomitant CT-derived calcification differed between low-dose attenuation-correction CT and contrast-enhanced diagnostic CT at a TBR threshold of 1.2 (70.7% vs. 54.8%), whereas no significant differences were observed at TBR threshold of 1.4 or 1.6. This finding suggests that apparent FAPI–calcification co-localization, particularly at lower uptake thresholds, may partly depend on CT acquisition characteristics. Differences in contrast enhancement, image noise and reconstruction may affect the detection and classification of calcification. However, these site-level comparisons were exploratory and unadjusted for within-patient clustering and should therefore be interpreted descriptively.
Several additional limitations warrant consideration. The retrospective single-center design and restriction to oncological patients may limit generalizability to populations with primary cardiovascular disease. No histological reference standard was available, and no direct intra-individual comparison with [68Ga]Ga-FAPI-04 was performed. Consequently, the contribution of radionuclide substitution to differences in vascular TBR cannot be isolated. The small dimensions of the arterial wall relative to PET spatial resolution also render measurements susceptible to partial-volume effects and spill-over from adjacent structures. Furthermore, multiple vascular sites were assessed within individual patients, while classifications at increasing TBR thresholds were inherently nested. Site-level co-localization was not subjected to independent-observation inferential testing because observations were clustered within patients and threshold classifications were nested; the aggregate proportions were therefore interpreted descriptively. Although a clustered mixed-effects, GEE, or patient-clustered bootstrap framework would be appropriate for a confirmatory prospective study, the present exploratory analysis deliberately restricted inferential testing to patient-level repeated-measures comparisons. The marked variation in morphological co-localization across vascular territories suggests that arterial threshold behavior may be territory dependent. Because no formal threshold-by-territory interaction model was fitted, the present data cannot establish whether a single threshold is valid across all arterial territories. A universal arterial threshold should therefore not be assumed without prospective, territory-specific validation. Quantitative TBR measurements may additionally depend on PET system and reconstruction characteristics as well as uptake time, limiting direct transferability of a single threshold across acquisition protocols. In addition, SUVmax-based quantification and blood-pool normalization may be affected by partial-volume effects, spill-over from adjacent structures, and blood-pool activity. All image assessments were performed by a single reader. The use of two EARL-accredited PET systems, variable uptake times and differing acquisition conditions further limit direct transferability. A formal scanner-equivalence analysis was not performed. Therefore, the present data cannot establish that threshold classification is completely unaffected by scanner platform. The absence of histological validation further precludes confirmation that the measured vascular uptake reflects FAP expression. Detailed cancer-specific disease burden, treatment history and cardiovascular comorbidity were not part of the standardized analysis dataset, limiting extrapolation from this heterogeneous oncological cohort to dedicated cardiovascular populations.
An important perspective for future research would be to evaluate whether cardiovascular risk profiles influence the threshold behavior. Prospective studies in clinically characterized cohorts could determine whether threshold behavior differs across cardiovascular risk strata. Prospective validation should therefore include repeat imaging, independent blinded readers, a prospectively defined arterial-wall reference, standardized blood-pool normalization, and predefined assessment of measurement stability across candidate thresholds.
5. Conclusions
In conclusion, a TBR threshold of 1.2 represents a pragmatic candidate with the greatest descriptive site detection among the three primary thresholds evaluated, but the present data do not establish a unique optimal cut-off. CT-derived calcification served only as a morphological comparator and cannot substitute for histological or other biological validation. Prospective validation in independent cardiovascular cohorts using standardized imaging protocols and, ideally, tissue-based confirmation of FAP expression is warranted.
Supplementary Materials
The following supporting information can be downloaded at https://www.mdpi.com/article/10.3390/diagnostics16223731/s1, Table S1, Vascular distribution and quantitative characteristics of arterial [18F]F-FAPI-74 uptake at the candidate threshold TBR 1.2; Table S2, Vascular distribution and quantitative characteristics of arterial [18F]F-FAPI-74 uptake at the candidate threshold TBR 1.4; Table S3, Vascular distribution and quantitative characteristics of arterial [18F]F-FAPI-74 uptake at the candidate threshold TBR 1.6; Table S4, Threshold-dependent arterial FAPI uptake and co-localization with CT-derived calcification; Table S5. Sensitivity analysis of FAPI-calcification co-localization according to CT acquisition protocol, Threshold-specific site-level metrics are shown separately for patients examined with low-dose attenuation-correction CT and contrast-enhanced diagnostic CT.
Author Contributions
Conceptualization, methodology, validation, visualization: C.K., R.A.W. and S.C.S.; writing—original draft preparation: C.K. and S.C.S.; writing—review and editing: M.G.F., F.J.G., M.B., S.M.B., A.H., K.S., T.H. and F.L.G. All authors have read and agreed to the published version of the manuscript.
Funding
SCS was supported by the Munich Clinician Scientist Program (MSCP). MB was funded by the Deutsche Forschungsgemeinschaft (DFG) under Germany’s Excellence Strategy within the framework of the Munich Cluster for Systems Neurology (EXC 2145 SyNergy—ID 390857198). AH was funded by the FöFoLe program (Förderprogramm für Forschung und Lehre), Reg. No. 1287.
Institutional Review Board Statement
This analysis was performed in compliance with the principles of the Declaration of Helsinki and was approved by the institutional ethics board of the LMU Munich (IRB #24-0255_1, approve date 16 April 2025).
Informed Consent Statement
Patient consent was waived due to the retrospective design.
Data Availability Statement
The datasets used and/or analyzed during the current study are available from the corresponding author on reasonable request.
Acknowledgments
The study cohort described herein represents a subset of a larger database. Analyses of cardiovascular risk factor associations and further clinical endpoints in this cohort are reported separately.
Conflicts of Interest
RAW: speaker honoraria from and advisory board work for Novartis/AAA. MB is a member of the Neuroimaging Committee of the EANM. MB has received speaker honoraria from Roche, GE Healthcare, Iba, Miltenyi, and Life Molecular Imaging; has advised Life Molecular Imaging, MIAC, Cenos, and GE healthcare; and is currently on the advisory or imaging review boards of AC Immune and ZRO Imaging. AH reported compensation for scientific consulting by ABX advanced biochemical compounds and for blinded reading by ABX/Pharmtrace. FLG is co-inventor of FAP-derivates (FAPI-46 and FAPI-74) and is an advisor at ABX, Telix, and SOFIE Biosciences.
Abbreviations
The following abbreviations are used in this manuscript:
| CP+ | calcification-positive |
| CT | computed tomography |
| FAP | fibroblast activation protein |
| FAPI | fibroblast activation protein inhibitor |
| IQR | interquartile range |
| MBq | megabecquerel |
| PET | positron emission tomography |
| PET/CT | positron emission tomography/computed tomography |
| SD | standard deviation |
| SUV | standardized uptake value |
| SUVmax | maximum standardised uptake value |
| SUVmean | mean standardized uptake value |
| TBR | target-to-background ratio |
| VOI | volume of interest |
References
- Maier, A.; Teunissen, A.J.P.; Nauta, S.A.; Lutgens, E.; Fayad, Z.A.; van Leent, M.M.T. Uncovering atherosclerotic cardiovascular disease by PET imaging. Nat. Rev. Cardiol. 2024, 21, 632–651. [Google Scholar] [CrossRef] [Scilit] [PubMed]
- Amrute, J.M.; Jung, I.H.; Yamawaki, T.; Lin, W.-L.; Bredemeyer, A.; Diekmann, J.; Hayat, S.; Zhang, X.; Wakefield, D.L.; Luo, X.; et al. Targeting modulated vascular smooth muscle cells in atherosclerosis via FAP-directed immunotherapy. Science 2026, 392, eadx1736. [Google Scholar] [CrossRef] [Scilit] [PubMed]
- Monslow, J.; Todd, L.; Chojnowski, J.E.; Govindaraju, P.K.; Assoian, R.K.; Puré, E. Fibroblast Activation Protein Regulates Lesion Burden and the Fibroinflammatory Response in Apoe-Deficient Mice in a Sexually Dimorphic Manner. Am. J. Pathol. 2020, 190, 1118–1136. [Google Scholar] [CrossRef] [Scilit] [PubMed]
- Brokopp, C.E.; Schoenauer, R.; Richards, P.; Bauer, S.; Lohmann, C.; Emmert, M.Y. Fibroblast activation protein is induced by inflammation and degrades type I collagen in thin-cap fibroatheromata. Eur. Heart J. 2011, 32, 2713–2722. [Google Scholar] [CrossRef] [Scilit] [PubMed]
- Wu, M.; Ning, J.; Li, J.; Lai, Z.; Shi, X.; Xing, H. Feasibility of in vivo imaging of fibroblast activation protein in human arterial walls. J. Nucl. Med. 2022, 63, 948–951. [Google Scholar] [CrossRef] [Scilit] [PubMed]
- Kosmala, A.; Serfling, S.E.; Michalski, K.; Lindner, T.; Schirbel, A.; Higuchi, T.; Hartrampf, P.E.; Derlin, T.; Buck, A.K.; Weich, A.; et al. Molecular imaging of arterial fibroblast activation protein: Association with calcified plaque burden and cardiovascular risk factors. Eur. J. Nucl. Med. Mol. Imaging 2023, 50, 3011–3021. [Google Scholar] [CrossRef] [Scilit] [PubMed]
- Rominger, A.; Saam, T.; Wolpers, S.; Cyran, C.C.; Schmidt, M.; Foerster, S.; Nikolaou, K.; Reiser, M.F.; Bartenstein, P.; Hacker, M. 18F-FDG PET/CT identifies patients at risk for future vascular events in an otherwise asymptomatic cohort with neoplastic disease. J. Nucl. Med. 2009, 50, 1611–1620. [Google Scholar] [CrossRef] [Scilit] [PubMed]
- van der Valk, F.M.; Verweij, S.L.; Zwinderman, K.A.; Strang, A.C.; Kaiser, Y.; Marquering, H.A.; Nederveen, A.J.; Stroes, E.S.G.; Verberne, H.J.; Rudd, J.H.F. Thresholds for Arterial Wall Inflammation Quantified by (18)F-FDG PET Imaging: Implications for Vascular Interventional Studies. JACC Cardiovasc Imaging 2016, 9, 1198–1207. [Google Scholar] [PubMed]
- Samuel, S.L.; Fernandez, S.; Cingoranelli, S.J.; Pyles, J.M.; Bartels, J.L.; Houson, H.A.; Lu, Y.; Wright, B.D.; Yasui, N.; Sorace, A.G.; et al. Spatial resolution and image quality of radionuclides for PET imaging. Nucl. Med. Biol. 2026, 154–155, 109612. [Google Scholar] [CrossRef] [Scilit] [PubMed]
- Vatsa, N.; Faaborg-Andersen, C.; Dong, T.; Blaha, M.J.; Shaw, L.J.; Quintana, R.A. Coronary Atherosclerotic Plaque Burden Assessment by Computed Tomography and Its Clinical Implications. Circ. Cardiovasc Imaging 2024, 17, e016443. [Google Scholar] [CrossRef] [Scilit] [PubMed]
- Matsuo, Y.; Takumi, T.; Mathew, V.; Chung, W.-Y.; Barsness, G.W.; Rihal, C.S.; Gulati, R.; McCue, E.T.; Holmes, D.R.; Eeckhout, E.; et al. Plaque characteristics and arterial remodeling in coronary and peripheral arterial systems. Atherosclerosis 2012, 223, 365–371. [Google Scholar] [CrossRef] [Scilit] [PubMed]
- Unterrainer, L.M.; Schmid, H.P.; Kunte, S.C.; Holzgreve, A.; Toms, J.; Menold, P.; Cyran, C.C.; Karl, A.; Tschirdewahn, S.; Ledderose, S.T.; et al. 68Ga-FAPI and 18F-FAPI PET/CT for detection of nodal metastases prior radical cystectomy in high-risk urothelial carcinoma patients. Eur. J. Nucl. Med. Mol. Imaging 2025, 52, 3963–3974. [Google Scholar] [CrossRef] [Scilit] [PubMed]
- Rennenberg, R.J.; Kessels, A.G.; Schurgers, L.J.; van Engelshoven, J.M.; de Leeuw, P.W.; Kroon, A.A. Vascular calcifications as a marker of increased cardiovascular risk: A meta-analysis. Vasc. Health Risk Manag. 2009, 5, 185–197. [Google Scholar] [CrossRef] [Scilit] [PubMed]

Disclaimer/Publisher’s Note: The statements, opinions and data contained in all publications are solely those of the individual author(s) and contributor(s) and not of MDPI and/or the editor(s). MDPI and/or the editor(s) disclaim responsibility for any injury to people or property resulting from any ideas, methods, instructions or products referred to in the content. |
© 2026 by the authors. Licensee MDPI, Basel, Switzerland. This article is an open access article distributed under the terms and conditions of the Creative Commons Attribution (CC BY) license.