


Abstract
Background/Objectives: To investigate the scleral inferior rectus–optic nerve distance (SIROND) and its association with intraocular pressure (IOP) elevation during upward gaze in patients with thyroid eye disease (TED), based on magnetic resonance imaging (MRI) examinations. Methods: This prospective study included 20 eyes (13 patients) diagnosed with active TED. All patients underwent orbital MRI in both primary and upward gaze positions before and 6 months after steroid pulse therapy. The SIROND was measured on MRI. IOP was recorded in both gazes. Changes in SIROND, inferior rectus (IR) muscle volume, proptosis, optic disc and scleral morphology, and IOP were analyzed pre- and post-treatment. Results: SIROND significantly decreased from primary gaze to upward gaze both before and after treatment (p < 0.001). Following steroid pulse therapy, there were significant reductions in IR muscle volume and proptosis (p < 0.05). Correspondingly, SIROND significantly increased in both primary and more in upward gaze post-treatment (p < 0.05). Although IOP during upward gaze was significantly higher than that in primary gaze both before and after treatment (p < 0.001), the gaze-related difference in IOP (p = 0.059), as well as SIROND, tended to be smaller after treatment (p < 0.001). A larger reduction in gaze-related pre-treatment SIROND was associated with greater IOP elevation in upward gaze (p = 0.038). MRI showed no evidence of globe compression by the IR muscle, and optic disc morphology remained unchanged following treatment. Conclusions: SIROND may serve as supportive radiological evidence for IOP elevation induced by upward gaze in patients with TED.
1. Introduction
Thyroid eye disease (TED) is an autoimmune condition characterized by increased orbital tissue volume and subsequent proptosis, and anti-thyroid antibodies are thought to cross-react with antigens in orbital fibroblasts, triggering an inflammatory response [1]. This immune response leads to inflammatory cell infiltration in the extraocular muscles (EOMs) and orbital fat, resulting in EOM enlargement and increased orbital fat volume [1,2,3]. Orbital imaging is essential for diagnosing TED, as it clearly demonstrates these characteristic changes in orbital structures [4]. Among the available modalities, magnetic resonance imaging (MRI) is particularly valuable, as it can also assess disease activity, typically indicated by high signal intensity in EOMs and orbital fat [5].
Remodeling of orbital structures commonly results in elevated intraocular pressure (IOP) [6], which is often exacerbated during upward gaze [7,8,9,10,11,12,13]. This is primarily due to the frequent involvement and enlargement of the inferior rectus (IR) muscle in TED [14]. The thickened and fibrotic IR muscle becomes less elastic, creating mechanical resistance during upward gaze [15]. This resistance increases orbital congestion and episcleral venous pressures, contributing to IOP elevation [15,16]. Additionally, the stiffened IR muscle may exert direct compression on the globe during upward gaze, particularly near its insertion point [17].
Despite previous reports describing IOP elevation in upward gaze in TED [6,7,8,9,10,11,12,13,14,15,16,17,18,19], there remains a lack of objective radiological parameters that can quantitatively reflect the underlying orbital changes contributing to this phenomenon. Intraconal congestion and IR muscle enlargement are thought to play a key role, yet their relationship with IOP changes has not been well characterized using imaging-based metrics. Therefore, we introduce a novel radiological parameter, the scleral inferior rectus–optic nerve distance (SIROND), as a potential marker of infero-anterior intraconal crowding. We hypothesized that SIROND may reflect the degree of IR-related compression and congestion within the orbit and correlate with IOP elevation, particularly during upward gaze.
In this study, we evaluated and compared several radiographic parameters on MRI in both primary and upward gazes in patients with TED before and after steroid pulse therapy. These parameters were analyzed in relation to IOP elevation during upward gaze. To our knowledge, this is the first study to investigate IOP elevation during upward gaze in TED patients using MRI-based imaging analysis.
2. Materials and Methods
2.1. Study Design
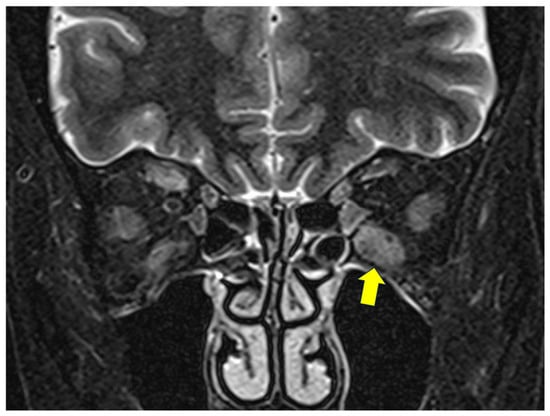
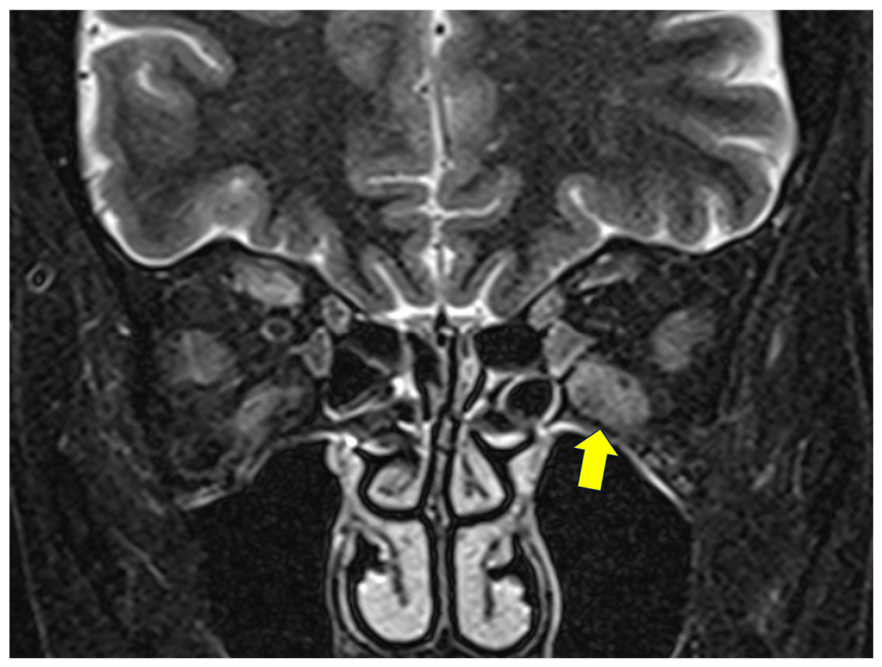
This prospective observational study included patients with TED who received steroid pulse therapy, with or without orbital irradiation, and demonstrated radiographic evidence of IR muscle inflammation on MRI from January 2024 to November 2024. This study was conducted in accordance with the STROBE (Strengthening the Reporting of Observational Studies in Epidemiology) guidelines for observational studies (Supplementary Material). The diagnosis of TED was established according to the criteria defined by Bartley [20]. The disease activity was determined by the presence of EOM inflammation on short tau inversion recovery (STIR) MRI, as a considerable number of Japanese patients with MRI-confirmed orbital soft tissue inflammation show a low clinical activity score (CAS) [21]. Active TED is characterized by increased water content within the EOMs and orbital soft tissues due to inflammatory infiltration and edema, which appears as high signal intensity on these sequences (Figure 1). MRI has been shown to provide an objective assessment of disease activity and may detect active inflammation even in cases with low CAS. This is particularly relevant in Japanese patients, among whom discordance between CAS and imaging findings has been reported [22,23,24].
Figure 1.
Inflammation of the left inferior rectus muscle shown as high signal intensity on a short tau inversion recovery (STIR) magnetic resonance image (arrow).
2.1.1. Inclusion Criteria
Patients were included if they had active, moderate-to-severe TED, received steroid pulse therapy with or without orbital irradiation, and demonstrated radiographic evidence of IR muscle inflammation on STIR MRI.
2.1.2. Exclusion Criteria
Patients were excluded if they had a history of orbital surgery, strabismus surgery, or glaucoma surgery, or if they were using anti-glaucomatous eyedrops. Eyes without IR muscle inflammation were also excluded.
2.1.3. Study Workflow
After meeting the inclusion criteria, patients underwent (1) baseline clinical and MRI assessment in both primary and upward gaze positions; (2) steroid pulse therapy; (3) post-treatment clinical and MRI assessment at 6 months using the same protocol; and (4) radiological and statistical analyses.
2.2. Data Collection
The following data were collected: age, sex, laterality, thyroid disease (Graves’ disease or Hashimoto’s thyroiditis), and thyroid functional status.
Ophthalmic evaluation included IOP, optic disc morphology, and proptosis, assessed both before and 6 months after steroid pulse therapy. IOP was measured using a rebound tonometer (iCARE IC200; Icare Finland, Vantaa, Finland) in the primary gaze and 20° upward gaze [13]. Optic disc morphology was evaluated using optical coherence tomography (OCT) (CIRRUS HD-OCT; Carl Zeiss Meditec Co., Ltd., Tokyo, Japan), with parameters including mean retinal nerve fiber layer (RNFL) thickness and vertical and horizontal cup/disc (C/D) ratios. The grade of proptosis was measured using a Hertel exophthalmometer. Clinical assessment was performed by the same experienced examiner (YT) before and six months after steroid pulse therapy using a standardized protocol.
2.3. MRI
MRI was performed using a 1.5-Tesla scanner (Magnetom Abant™; Siemens Healthcare, Erlangen, Germany), with the patients in the supine position both before and 6 months after steroid pulse therapy. T1- and T2-weighted gradient-echo sequences were acquired (T1—repetition time: 500 ms, echo time: 10 ms, field of view: 140 × 140 mm, matrix: 256 × 220, section thickness: 2.5–3 mm with a 0.6 mm gap between slices; T2—repetition time: 4000 ms, echo time: 100 ms, all other parameters were the same as in T1).
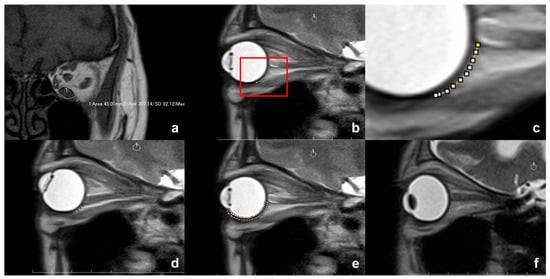
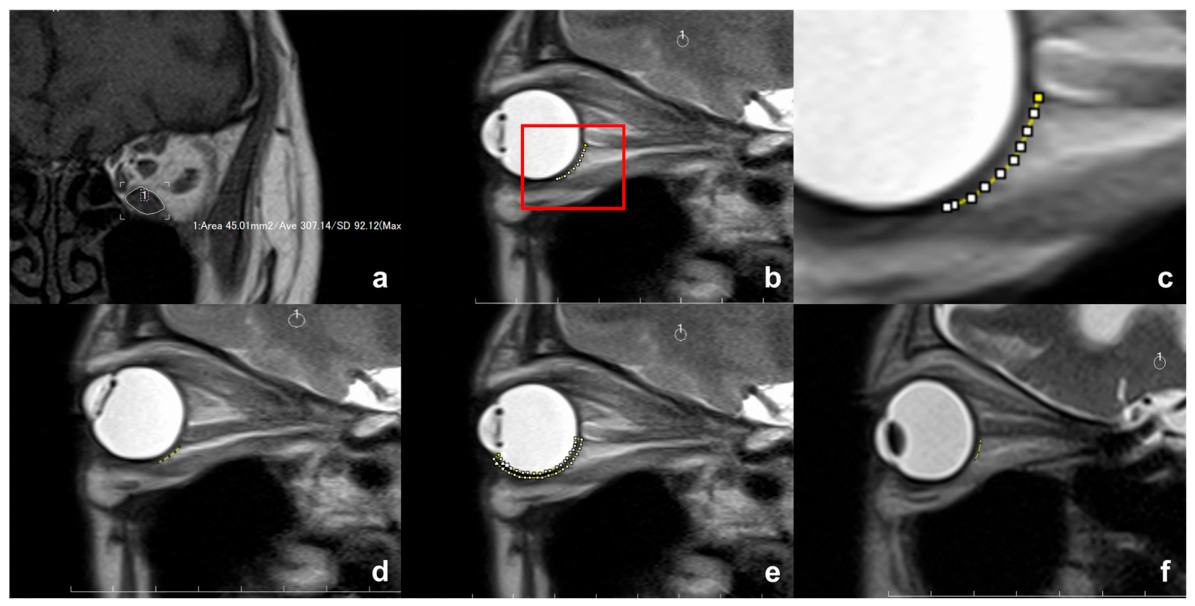
The cross-sectional areas of the IR muscle were measured on a coronal T1-weighted MRI in each slice where the EOM was visualized using the measuring tool available in the MRI viewer (ShadeQuest/ViewR™; Yokogawa Medical Solutions Corporation, Tokyo, Japan) (Figure 2a). The IR muscle volume was calculated as the total summed of cross-sectional areas multiplied by slice thickness.
Figure 2.
(a) Measurement of the cross-sectional area of the inferior rectus (IR) muscle. (b–d) Measurement of scleral inferior rectus–optic nerve distance (SIROND) in the primary gaze (b); (c) magnified image of the rectangular area in part (b) and upward gaze (d) (yellow broken lines). (e) Measurement of the cross-sectional area of the sclera from the iridocorneal angle to the inferior margin of the optic nerve at its insertion into the globe (yellow broken line). (f) A shorter line of the non-contact plane (yellow broken line) with enlargement of the anterior portion of the IR muscle.
T2-weighted sagittal section of cine-mode MRI through the IR muscle and optic nerve (ON) was taken in a similar fashion as in a previous study [25]. Patients were instructed to fixate on a vertical row of numbered marks placed on the inner aspect of the scanner bore above their heads. The vertical row consisted of 5 fixation marks placed at intervals corresponding to a 10° gaze angle difference (from −20° to 20°). The slices obtained in the primary and 20° upward gazes were used for analyses. In patients with severe IR muscle enlargement and hypotropia, the eye with milder restriction of upward gaze was fixed to the fixation marks. Due to the obscured insertion of the IR muscle into the globe, the length of the contact plane between the globe and the IR muscle could not be directly measured. Instead, the non-contact distance from the inferior margin of the ON at its insertion into the globe to the posterior point of the IR muscle insertion was measured along the scleral surface and referred as the scleral IR-ON distance (SIROND) (Figure 2b,c). A shorter length of SIROND indicates greater contact between the globe and IR muscle, resulting in more compression of the globe by the IR muscle. The number of patients in whom the sclera was yielded by compression of the IR muscle was recorded. Since the cornea was obscure on MRI, the cross-sectional area of the sclera was measured from the level of iridocorneal angle to the inferior margin of the ON at its insertion into the globe (Figure 2d). Those two measurements were performed by one of the authors (YT) using ImageJ 1.54g software (National Institute of Health, Bethesda, MD, USA).
All MRI measurements, including SIROND, cross-sectional area, and muscle volume, were performed by a single experienced examiner (YT) using a standardized protocol to ensure consistency.
2.4. Treatment
Patients underwent three cycles of steroid pulse therapy under a regimen of body weight × 10 mg/kg/day of methylprednisolone for 3 consecutive days per cycle, based on the guideline for treatment of thyroid eye disease established by the Japanese Committee for Diagnostic Criteria and Guideline to Medical Care for Thyroid-Associated Malignant Exophthalmos [26]. The total cumulative dose of methylprednisolone did not exceed 8 g in all patients. Regarding orbital irradiation, a total dose of 20 Gy in 10 fractions was delivered during hospitalization for steroid pulse therapy.
2.5. Statistical Analyses
Patient data and measurement results were expressed as means ± standard deviations (SDs). Decreasing rates of SIROND were calculated as follows:
The normal distribution of measurement results was examined using the Shapiro–Wilk test, and dependent continuous variables were compared using the paired t-test or Wilcoxon signed-rank test, based on the results of the Shapiro–Wilk test. The Mann–Whitney-U test was used for comparison of independent continuous variables. The relationship between changes in pre-treatment IOP by gazes and clinical and radiographic variables using univariate and multivariate linear regression analyses. The variables included the Hertel exophthalmometric value, IR muscle volume, pre-treatment SIROND in the primary position, difference in the pre-treatment SIROND between gazes, and decreasing rate of the pre-treatment SIROND. All statistical analyses were performed using SPSS™ version 26 software (IBM Japan, Tokyo, Japan). Two-tailed p values < 0.05 were deemed to indicate statistical significance.
3. Results
Data on patient characteristics are shown in Table 1. This study included 20 eyes from 13 patients (2 males and 11 females; mean age, 55.3 ± 17.4 years). Bilateral inflammatory enlargement of the IR muscle was observed in 7 patients, and 6 eyes without IR muscle inflammation were excluded. All patients were diagnosed with Graves’ disease, and thyroid status was controlled to euthyroid in 9 of them. Orbital irradiation was performed in 9 patients, while the remaining 4 patients did not undergo it due to either young age (2 patients) or pre-existing diabetes mellitus (2 patients). EOM involvement other than the IR muscle was observed in 18 eyes.
Table 1.
Data on patient characteristics and measurement results.
Measurement results are presented in Table 2. Before treatment, IOP in the primary and 20° upward gazes was 15.0 ± 4.0 and 20.5 ± 6.4 mmHg, respectively. After steroid pulse therapy, IOP decreased to 13.9 ± 2.5 mmHg in the primary gaze and 17.2 ± 4.6 mmHg in the upward gaze. IOP in the upward gaze was significantly higher during both pre- and post-treatment periods (both, p < 0.001). Although the reduction in IOP in the primary gaze after treatment did not reach statistical significance (p = 0.167), IOP in upward gaze showed a significant decrease between pre- and post-treatment periods (p = 0.012). In addition, 13 of 20 eyes showed reduction in IOP in both gaze positions. The difference in IOP between the two gaze positions was 5.5 ± 4.8 mmHg before treatment and 3.3 ± 3.9 mmHg after steroid pulse therapy, but this difference did not reach statistical significance (p = 0.059). The mean RNFL thickness and vertical and horizontal C/D ratios did not significantly change after steroid pulse therapy (p > 0.050). Hertel exophthalmometric values significantly decreased from 17.4 ± 3.2 mm to 16.6 ± 2.7 mm (p = 0.003).
Table 2.
Pre- and post-treatment measurement results with statistical comparison.
The IR muscle volume significantly decreased from 1464.1 ± 458.9 mm3 before steroid pulse therapy to 1219.6 ± 363.6 mm3 after treatment (p < 0.001). Before treatment, the SIROND significantly decreased from 1.01 ± 0.42 mm in the primary gaze to 0.63 ± 0.35 mm in the upward gaze (p < 0.001). After steroid pulse therapy, the SIROND significantly increased in both gaze positions (primary gaze, 1.18 ± 0.29 mm, p = 0.020; upward gaze, 0.94 ± 0.32 mm, p < 0.001). Despite this increase, the SIROND remained significantly shorter in the upward gaze compared to the primary gaze after treatment (p < 0.001). However, the reduction rate of SIROND between the two gaze positions was significantly smaller following steroid pulse therapy (pre-treatment, 40.0 ± 15.2% vs. post-treatment, 22.6 ± 14.0%; p < 0.001). None of the eyes showed that the sclera yielded by compression of the IR muscle, as depicted on MRI. Consequently, the cross-sectional area of the sclera was not significantly different between pre- and post-treatment periods in the primary and upward gazes, as well as between the primary and upward gazes in both pre- and posttreatment periods (all, p > 0.050).
Eyes with a shorter SIROND likely due to enlargement of the anterior portion of the IR muscle seemed to exhibit higher IOP elevation in upward gaze (Figure 2e). We, therefore, classified eyes into two groups: those with IOP elevation of ≥5 mmHg (n = 11) and those with IOP elevation of <5 mmHg (n = 9). Eyes in the ≥5 mmHg group showed a significantly larger reduction rate of SIROND between the two gaze positions (46.4 ± 12.0% vs. 32.2 ± 15.7%, p = 0.038). However, pre-treatment SIROND values were not significantly different between the groups in both the primary gaze (0.96 ± 0.44 mm vs. 1.08 ± 0.41 mm, p = 0.766) and upward gaze (0.53 ± 0.31 mm vs. 0.75 ± 0.37 mm, p = 0.175). Since univariate linear regression analyses did not identify any variables as a significant predictor of upward-gaze-induced IOP (all, p > 0.050) (Table 3), multiple linear regression analysis was not performed.
Table 3.
Results of the univariate regression analyses.
4. Discussion
In this study, we introduced SIROND for the first time as a radiological marker that may serve as an indicator of IOP elevation in TED. The dynamic change in this distance between primary and upward gaze could help explain the mechanism behind IOP elevation during upward gaze.
While previous studies have demonstrated IOP elevation in upward gaze among TED patients [6,7,8,9,10,11,12,13,14,15,16,17,18,19], our study also confirmed a significant increase in IOP during upward gaze both before and after steroid pulse therapy. Correspondingly, we observed that the radiological marker SIROND significantly decreased from the primary to upward gaze in both pre- and post-treatment assessments. We also found that, in pre-treatment measurements, patients with shorter SIROND in the primary gaze exhibited greater IOP elevation in upward gaze. Following treatment, the reduction in SIROND between primary and upward gaze was less pronounced, and, correspondingly, the difference in IOP between the two gaze positions was reduced. These findings may indicate that direct compression of the globe and episcleral veins by an enlarged IR muscle raises IOP and serve as “radiological evidence” supporting the mechanism of IOP elevation during upward gaze.
SIROND may also serve as a radiological marker of intraconal congestion in TED. We hypothesized that greater IR enlargement and intraconal crowding would result in a shorter SIROND, due to the muscle’s extended insertion along the globe. We found that following steroid pulse therapy, which reduced inflammation and congestion, SIROND significantly increased in both primary and upward gazes. This was supported by concurrent significant improvement in proptosis and reduction in IR muscle volume. Additionally, in upward gaze, the thickened and fibrotic IR muscle imposes mechanical resistance and elevates intraconal pressure, resulting in consistently shorter SIROND compared to the primary gaze, both before and after treatment. Clinically, these findings suggest that SIROND may provide a quantitative and objective non-invasive imaging biomarker for assessing intraconal congestion, monitoring treatment response, and potentially identifying patients at risk for gaze-related IOP elevation. This may be particularly valuable in cases where conventional clinical parameters are insufficient to fully capture disease activity or pressure-related changes.
MRI showed no evidence of scleral deformation due to IR muscle compression in any eye. This was further supported by the unchanged cross-sectional area of the sclera between primary and upward gazes, as well as before and after treatment. One possible explanation for these findings is that IOP was sufficiently elevated to prevent scleral deformation despite direct compression of the globe by the enlarged IR muscle. Alternatively, these results suggest that direct globe compression by the IR muscle, as proposed in previous studies [13,17], is less likely the primary mechanism of IOP elevation in upward gaze. Instead, elevated orbital tissue volume and intraconal congestion are likely to raise retrobulbar and episcleral venous pressures [13,17,27], contributing to IOP elevation. Additionally, mucopolysaccharide accumulation in the trabecular meshwork may impair aqueous humor outflow, further increasing IOP [27].
Monitoring and managing IOP in patients with TED are crucial. In our study, although a trend toward IOP reduction was observed following steroid pulse therapy, optic disc morphology, such as vertical and horizontal C/D ratios, and structural parameters including RNFL thickness remained unchanged. This supports the understanding that optic nerve damage due to elevated IOP is often irreversible [28]. Therefore, careful and proactive monitoring of IOP in TED patients is strongly recommended.
Although IOP values remained within the normal range, a significant difference was observed between primary and upward gaze, indicating a measurable effect of intraconal congestion on IOP in TED. The absence of markedly elevated IOP values may be attributed to the limited sample size and the inclusion of fewer patients with severe disease. In addition, we could not find a significant association between upward-gaze-induced IOP and SIROND in the univariate linear regression analyses. This may be attributed to the large SD in IOP changes between the gaze positions, indicating a considerable data dispersion within the study sample. Despite this limitation, the consistent trend supports SIROND as a potentially sensitive imaging marker for detecting subtle pressure-related changes, even when IOP does not exceed normal limits.
Patients received systemic steroid treatment with or without orbital irradiation, as teprotumumab treatment was not available in Japan at the time this study started. To date, no studies have reported changes in upward-gaze-induced IOP and SIROND on MRI post-teprotumumab treatment. However, previous studies have shown that teprotumumab significantly reduces IOP in the primary gaze and decreases EOM volume [29,30,31,32,33]. Additionally, teprotumumab has demonstrated greater improvement in extraocular motility, compared to systemic steroid [1,34,35], suggesting it may lead to a more substantial reduction in IR muscle volume, SIROND, and IOP during upward gaze in comparison to steroid therapy.
This study has several limitations. The sample size was relatively small, which may limit the generalizability of the findings. While IOP measurements were conducted in the upright back position, the MRI examinations were performed in the supine position. This positional difference could have introduced variability in the correlation between anatomical and pressure-related findings [36]. The lack of a control group of healthy participants limits our ability to determine whether the observed radiological changes are specific to TED. Future studies with larger cohorts and appropriate control groups are warranted to validate our findings and further establish the clinical utility of SIROND as a radiological marker.
5. Conclusions
This study suggests the potential utility of SIROND as a novel radiological marker of intraconal congestion in TED and as supportive imaging evidence for upward gaze induced IOP elevation in affected patients. Radiological signs of globe compression were not observed, which may indicate that it is less likely to be a major contributing factor to IOP elevation in this context. Still, further studies are needed to confirm these findings.
Supplementary Materials
The following supporting information can be downloaded at: https://www.mdpi.com/article/10.3390/diagnostics16101521/s1, File S1: STROBE Statement—checklist of items that should be included in reports of observational studies.
Author Contributions
Conceptualization, Y.T.; methodology, Y.T.; data curation, N.U. and Y.T.; validation, Y.T.; formal analysis, Y.T.; investigation, Y.T.; writing—original draft preparation, M.A.; writing—review and editing, C.F.H., N.U. and Y.T.; supervision, Y.T.; project administration, Y.T. All authors have read and agreed to the published version of the manuscript.
Funding
This research received no external funding.
Institutional Review Board Statement
The institutional review board (IRB) of Aichi Medical University Hospital approved this study, which was conducted in accordance with the tenets of the Declaration of Helsinki and its later amendments (approval number: 2025-073; date: 4 July 2025).
Informed Consent Statement
The IRB granted a waiver of informed consent for this study based on the ethical guidelines for medical and health research involving human subjects established by the Japanese Ministry of Education, Culture, Sports, Science, and Technology; and by the Ministry of Health, Labour, and Welfare. The waiver was granted because this study was not an interventional study. Nevertheless, at the request of the IRB, an outline of the study was published on the Aichi Medical University website and is available for public viewing. This also presented the patients with an option to refuse to participate in this study, although none did. Personal identifiers were removed from the records prior to data analysis.
Data Availability Statement
The data are not publicly available due to ethical reasons. But, the datasets generated during and/or analyzed during this study can be made available by the corresponding author upon reasonable request.
Conflicts of Interest
Y.T. received speaker and consultant honoraria from Amgen Inc., Chugai Pharmaceutical Co., Ltd., Santen Pharmaceutical Co., Ltd., and Ono Pharmaceutical Co., Ltd. The other authors declare no conflicts of interest.
Abbreviations
The following abbreviations are used in this manuscript:
| TED | Thyroid eye disease |
| EOM | Extraocular muscle |
| MRI | Magnetic resonance imaging |
| IOP | Intraocular pressure |
| IR | Inferior rectus |
| OCT | Optical coherence tomography |
| RNFL | Retinal nerve fiber layer |
| C/D | Cup/disc |
| ON | Optic nerve |
| SIROND | Scleral inferior rectus–optic nerve distance |
| SD | Standard deviation |
| IRB | Institutional review board |
References
- Hiromatsu, Y.; Ishikawa, E.; Kozaki, A.; Takahashi, Y.; Tanabe, M.; Hayashi, K.; Imagawa, Y.; Kaneda, K.; Mimura, M.; Dai, X.; et al. A randomised, double-masked, placebo-controlled trial evaluating the efficacy and safety of teprotumumab for active thyroid eye disease in Japanese patients. Lancet Reg. Health West. Pac. 2025, 55, 101464. [Google Scholar] [CrossRef] [Scilit] [PubMed]
- Menconi, F.; Marcocci, C.; Marinò, M. Diagnosis and classification of Graves’ disease. Autoimmun. Rev. 2014, 13, 398–402. [Google Scholar] [CrossRef] [Scilit]
- Meyer, P.; Das, T.; Ghadiri, N.; Murthy, R.; Theodoropoulou, S. Clinical pathophysiology of thyroid eye disease: The Cone Model. Eye 2019, 33, 244–253. [Google Scholar] [CrossRef] [Scilit]
- Luccas, R.; Riguetto, C.M.; Alves, M.; Zantut-Wittmann, D.E.; Reis, F. Computed tomography and magnetic resonance imaging approaches to Graves’ ophthalmopathy: A narrative review. Front. Endocrinol. 2024, 14, 1277961. [Google Scholar] [CrossRef] [Scilit] [PubMed]
- Song, Y.; Li, T.; Tang, W.; Lv, Q.; Zhang, X.X.; Zhou, W.Y.; Shi, Y.Q. Application progress of magnetic resonance imaging in thyroid associated ophthalmopathy. Front. Endocrinol. 2025, 16, 1537957. [Google Scholar] [CrossRef] [Scilit]
- Cockerham, K.P.; Pal, C.; Jani, B.; Wolter, A.; Kennerdell, J.S. The prevalence and implications of ocular hypertension and glaucoma in thyroid-associated orbitopathy. Ophthalmology 1997, 104, 914–917. [Google Scholar] [CrossRef] [Scilit]
- Spierer, A.; Eisenstein, Z. The role of increased intraocular pressure on upgaze in the assessment of Graves ophthalmopathy. Ophthalmology 1991, 98, 1491–1494. [Google Scholar] [CrossRef] [Scilit]
- Girod, D.A.; Orcutt, J.A.; Cummings, C.W. Orbital decompression for preservation of vision in Graves’ ophthalmopathy. Arch. Otolaryngol. Head. Neck Surg. 1993, 119, 229–233. [Google Scholar] [CrossRef] [Scilit]
- Ben Simon, G.J.; Syed, H.; Douglas, R.; Schwartz, R.; Goldberg, R.A.; McCann, J.D. Clinical manifestations and treatment outcome of optic neuropathy in thyroid-related orbitopathy. Ophthalmic Surg. Lasers Imaging 2006, 37, 284–290. [Google Scholar] [CrossRef] [Scilit] [PubMed]
- Danesh-Meyer, H.V.; Savino, P.J.; Deramo, V.; Sergott, R.C.; Smith, A.F. Intraocular pressure changes after treatment for Graves’ orbitopathy. Ophthalmology 2001, 108, 145–150. [Google Scholar] [CrossRef] [Scilit]
- Onaran, Z.; Konuk, O.; Sö, O.; Yücel, C.; Ünal, M. Intraocular pressure lowering effect of orbital decompression is related to increased venous outflow in Graves orbitopathy. Curr. Eye Res. 2014, 39, 666–672. [Google Scholar] [CrossRef] [Scilit]
- Norris, J.H.; Ross, J.J.; Kazim, M.; Selva, D.; Malhotra, R. The effect of orbital decompression surgery on refraction and intraocular pressure in patients with thyroid orbitopathy. Eye 2012, 26, 535–543. [Google Scholar] [CrossRef] [Scilit]
- Takahashi, Y.; Nakamura, Y.; Ichinose, A.; Kakizaki, H. Intraocular pressure change with eye positions before and after orbital decompression for thyroid eye disease. Ophthalmic Plast. Reconstr. Surg. 2014, 30, 47–50. [Google Scholar] [CrossRef] [Scilit]
- Gonçalves, A.C.; Gebrim, E.M.; Monteiro, M.L. Imaging studies for diagnosing Graves’ orbitopathy and dysthyroid optic neuropathy. Clinics 2012, 67, 1327–1334. [Google Scholar] [CrossRef] [Scilit]
- Li, X.; Bai, X.; Liu, Z.; Cheng, M.; Li, J.; Tan, N.; Yuan, H. The effect of inferior rectus muscle thickening on intraocular pressure in thyroid-associated ophthalmopathy. J. Ophthalmol. 2021, 2021, 9736247. [Google Scholar] [CrossRef] [Scilit]
- Nassr, M.A.; Morris, C.L.; Netland, P.A.; Karcioglu, Z.A. Intraocular pressure change in orbital disease. Surv. Ophthalmol. 2009, 54, 519–544. [Google Scholar] [CrossRef] [Scilit]
- Takahashi, Y.; Vaidya, A. Secondary effects of orbital decompression in thyroid eye disease: A review. Semin. Ophthalmol. 2023, 38, 465–474. [Google Scholar] [CrossRef] [Scilit]
- Hsia, Y.; Wei, Y.H.; Liao, S.L. The changes in ocular biomechanical response parameters and intraocular pressure after surgical treatment for thyroid eye disease. Investig. Ophthalmol. Vis. Sci. 2023, 64, 31. [Google Scholar] [CrossRef] [Scilit]
- Kim, J.W.; Ko, J.; Woo, Y.J.; Bae, H.W.; Yoon, J.S. Prevalence of ocular hypertension and glaucoma as well as associated factors in Graves’ orbitopathy. J. Glaucoma 2018, 27, 464–469. [Google Scholar] [CrossRef] [Scilit] [PubMed]
- Bartley, G.B.; Gorman, C.A. Diagnostic criteria for Graves’ ophthalmopathy. Am. J. Ophthalmol. 1995, 119, 792–795. [Google Scholar] [CrossRef] [Scilit]
- Takahashi, Y.; Vaidya, A.; Kakizaki, H. Risk factors for development of superior limbic keratoconjunctivitis in thyroid eye disease in Japanese. Graefes Arch. Clin. Exp. Ophthalmol. 2023, 261, 833–839. [Google Scholar] [CrossRef] [Scilit]
- Gou, X.; Cheng, J.; Li, T.; Zhao, W.; Wang, Y.; Zhang, X.; Hong, N. Research progress and clinical utility of multi-parameter orbital MRI in thyroid-associated ophthalmopathy. Eur. J. Radiol. 2026, 195, 112644. [Google Scholar] [CrossRef] [Scilit]
- Zhang, H.; Lu, T.; Liu, Y.; Jiang, M.; Wang, Y.; Song, X.; Fan, X.; Zhou, H. Application of Quantitative MRI in Thyroid Eye Disease: Imaging Techniques and Clinical Practices. J. Magn. Reson. Imaging. 2024, 60, 827–847. [Google Scholar] [CrossRef] [Scilit]
- Cai, M.; Yang, J.; Li, X.; Hu, Y.; Liao, H.; Xiong, C. MRI-based SIR quantitative biomarkers: A novel imaging diagnostic strategy for thyroid eye disease activity staging. Front. Endocrinol. 2025, 16, 1650116. [Google Scholar] [CrossRef] [Scilit]
- Kakizaki, H.; Selva, D.; Leibovitch, I. Dynamic study of the medial and lateral recti capsulopalpebral fasciae using cine mode magnetic resonance imaging. Ophthalmology 2010, 117, 388–391. [Google Scholar] [CrossRef] [Scilit] [PubMed]
- The Japanese Committee for Diagnostic Criteria and Guideline to Medical Care for Thyroid-Associated Malignant Exophthalmos. The Guideline for Treatment of Thyroid Eye Disease. 2018. Available online: http://www.japanthyroid.jp/doctor/img/basedou02.pdf (accessed on 6 November 2025).
- Karhanová, M.; Kalitová, J.; Kovář, R.; Schovánek, J.; Karásek, D.; Čivrný, J.; Hübnerová, P.; Mlčák, P.; Šín, M. Ocular hypertension in patients with active thyroid-associated orbitopathy: A predictor of disease severity, particularly of extraocular muscle enlargement. Graefes Arch. Clin. Exp. Ophthalmol. 2022, 260, 3977–3984. [Google Scholar] [CrossRef] [Scilit] [PubMed]
- Diekmann, H.; Fischer, D. Glaucoma and optic nerve repair. Cell Tissue Res. 2013, 353, 327–337. [Google Scholar] [CrossRef] [Scilit]
- Adetunji, M.O.; Nguyen, B.J.; McGeehan, B.; Tamhankar, M.A.; Briceño, C.A. Effect of teprotumumab on intraocular pressure in thyroid-associated ophthalmopathy. Taiwan J. Ophthalmol. 2022, 12, 325–329. [Google Scholar] [CrossRef] [Scilit]
- Jain, A.P.; Gellada, N.; Ugradar, S.; Kumar, A.; Kahaly, G.; Douglas, R. Teprotumumab reduces extraocular muscle and orbital fat volume in thyroid eye disease. Br. J. Ophthalmol. 2022, 106, 165–171. [Google Scholar] [CrossRef] [Scilit] [PubMed]
- Ugradar, S.; Parunakian, E.; Zimmerman, E.; Malkhasyan, E.; Raika, P.; Douglas, R.N.; Kossler, A.L.; Douglas, R.S. Clinical and radiologic predictors of response to teprutoumumab: A 3D volumetric analysis of 35 patients. Ophthalmic Plast. Reconstr. Surg. 2025, 41, 408–414. [Google Scholar] [CrossRef] [Scilit]
- Richkind, H.; Shoji, M.K.; Walker, E.; Routzong, M.R.; Kikkawa, D.O.; Granet, D.; Rudell, J. Differential change in extraocular muscle volume after teprotumumab for thyroid eye disease. Orbit 2026, 45, 252–260. [Google Scholar] [CrossRef] [Scilit]
- Kozaki, A.; Takahashi, Y.; Tajiri, Y.; Wang, Z.; Hayashida, T.; Kumar, A.; Hiromatsu, Y.; Mimura, M. Reduction in extraocular muscle and orbital fat volumes after teprotumumab treatment in Japanese patients with thyroid eye disease: An exploratory magnetic resonance imaging analysis from the OPTIC-J trial. Jpn. J. Ophthalmol. 2026, in press. [Google Scholar]
- Douglas, R.S.; Dailey, R.; Subramanian, P.S.; Barbesino, G.; Ugradar, S.; Batten, R.; Qadeer, R.A.; Cameron, C. Proptosis and diplopia response with teprotumumab and placebo vs the recommended treatment regimen with intravenous methylprednisolone in moderate to severe thyroid eye disease: A meta-analysis and matching-adjusted indirect comparison. JAMA Ophthalmol. 2022, 140, 328–335. [Google Scholar] [CrossRef] [Scilit] [PubMed]
- Lustig-Barzelay, Y.; Yagoda, D.; Zunz, E.; Hamed-Azzam, S.; Avisar, I.; Kehat-Ophir, S.; Gur, Z.; Cukierman-Yaffe, T.; Agmon-Levin, N.; Landau-Prat, D.; et al. Time to improvement following teprotumumab treatment of thyroid eye disease: Real world experience. Graefes Arch. Clin. Exp. Ophthalmol. 2025, 263, 2349–2358. [Google Scholar] [CrossRef] [Scilit] [PubMed]
- Jorge, J.; Ramoa-Marques, R.; Lourenço, A.; Silva, S.; Nascimento, S.; Queirós, A.; Gonzalez-Méijome, J.M. IOP variations in the sitting and supine positions. J. Glaucoma 2010, 19, 609–612. [Google Scholar] [CrossRef] [Scilit] [PubMed]

Disclaimer/Publisher’s Note: The statements, opinions and data contained in all publications are solely those of the individual author(s) and contributor(s) and not of MDPI and/or the editor(s). MDPI and/or the editor(s) disclaim responsibility for any injury to people or property resulting from any ideas, methods, instructions or products referred to in the content. |
© 2026 by the authors. Licensee MDPI, Basel, Switzerland. This article is an open access article distributed under the terms and conditions of the Creative Commons Attribution (CC BY) license.