


Abstract
This study analyzed the spatiotemporal dynamics of the vegetation ecological quality under climate change. Focusing on the vegetation conditions, a vegetation ecological quality index was constructed, expressing as the product of vegetation fraction cover (VFC), net primary productivity (NPP), and geographic coverage area. The results of trend and significance analysis showed that from 2000 to 2023, the VEQI in the Qinling Mountains exhibited a significant improvement, with an average slope of 4.91 gC·a−1 and 96.2% of the area showing high stable improvement. Partial correlation analysis revealed that precipitation had a stronger positive influence on VEQI than temperature, with over 98% of the area showing a positive correlation with precipitation, while temperature was positively correlated in 95.0% of the area but negatively correlated in high-altitude mountain zones. Therefore, four climate-driven patterns were identified: precipitation-driven (31.2%), temperature-driven (2.3%), co-driven (54.2%), and climate-stable (12.3%), suggesting that vegetation ecological quality in most regions is co-driven by both temperature and precipitation. Based on the results of trend and significance analysis and climate-driven patterns, the Qinling Mountains were divided into three ecological risk zones: low-risk (36.1%), middle-risk (56.9%), and high-risk (7.0%), with corresponding differentiated control measures proposed.
1. Introduction
In recent years, climate change has been recognized as one of the world’s biggest problems, posing a potential threat to the environment and almost all aspects of human life [1]. It has far-reaching impacts on ecosystem structure, composition and functioning through changes in temperature, precipitation patterns and the frequency and intensity of extreme weather events, which in turn weaken ecosystem services [2,3,4]. The Qinling Mountains are the climatic boundary between northern and southern China and an important natural ecological barrier [5]. The forest ecosystems in the Qinling Mountains have unique transitional and vertical zone spectrum characteristics, and are typical representatives of the transition from the northern subtropics to the warm temperate zone in the same latitude region worldwide [6]. Against the backdrop of the increasing global climate change as well as the establishment of the Qinling National Park, it is necessary to investigate the effect of climate changes on the ecosystem of the Qinling Mountains.
Theoretically, the relationship between climate changes and ecological quality involves multifactorial interactions, nonlinear responses, and spatial heterogeneity. Among various ecological factors, vegetation is an important factor in maintaining the structural stability and functioning of ecosystems [7]. In mountain ecosystems like the Qinling Mountains, temperature and precipitation are the most significant factors towards vegetation dynamics [8,9]. Apart from the main effect of climate change, researchers have also discussed other factors such as seasons [10], topography [11], vegetation types [12] and elevation [13]. Meanwhile, vegetation also plays a vital role in ecological services such as the conservation of soil and water, thus making vegetation a key to understand the ecosystem’s condition [14].
As a typical high-elevation transitional forest ecosystem, scholars have assessed the driving forces of vegetation ecological quality in the Qinling Mountains. However, most of the existing studies still focus on a single indicator, such as the Normalized Difference Vegetation Index (NDVI) [15], vegetation fraction cover (VFC) [16] and net primary productivity (NPP) [17]. In recent years, research has tended to use composite indices (such as Remote sensing Ecological Index, and Enhanced Quality Index) to quantitatively assess ecological quality and the contributions of climate changes [18,19]. Comparing to single indicators, a composite index would better capture the diversity of vegetation ecological features [20]. In terms of territorial special planning, a quantifiable and comparable composite index is also suitable for monitoring the implementation of the plan and optimizing it dynamically.
Territorial Spatial Planning raised the principle of “Integration of Multiple Planning”, which requires a single blueprint for the sustainable development of the Qinling Mountains. Therefore, it is necessary for the incorporation of the climate-ecology driving mechanism into the Qinling National Park planning. Zoning is an important part of national park planning and management, and an effective way to resolve the paradox of conservation and utilization [21,22,23]. In practice, the assessment of regional ecological indicators was used as a quantitative basis for the construction of “ecological spatial control units” [24,25,26]. During the process, a functional zoning system is accordingly delineated, such as core zones, buffer zones and experimental zones [27]. The results of the assessment are then translated into control measures, and ultimately realize a closed loop of planning–monitoring–management [28]. Technically, the fusion of high-resolution remote sensing images and geographic information systems provides strong support for the dynamic monitoring of vegetation cover over a long period of time, at a large scale and with high accuracy [29,30,31]. Through large-scale and long-term monitoring and analyzing, vegetation dynamics as well as climate attribution can be monitored in real time with high precision, enabling the implementation of vegetation conservation and restoration measures [32].
Research gaps exist in the integration of climate–ecological analysis and planning practice: (1) Given that future climate scenarios are relatively predictable (such as widespread temperature increases and changes in precipitation patterns), current research lacks discussion on how to translate these into an early warning–response framework for conservation. (2) The response of vegetation to climate change involves long-term cumulative effects. Current assessments of restoration effectiveness primarily rely on short-term indicators (such as changes in NDVI for the current year), which is not enough to capture the long-term effects of vegetation dynamics. (3) Although current research generally employs composite indicators, their practical applicability in planning practice remains to be explored.
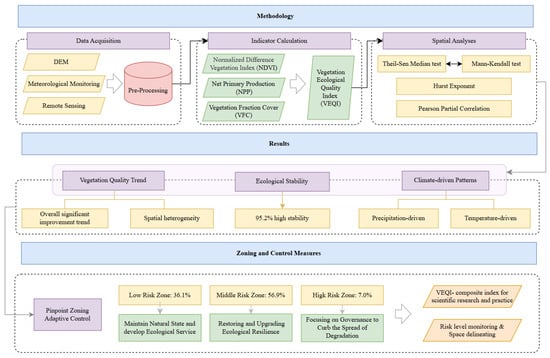
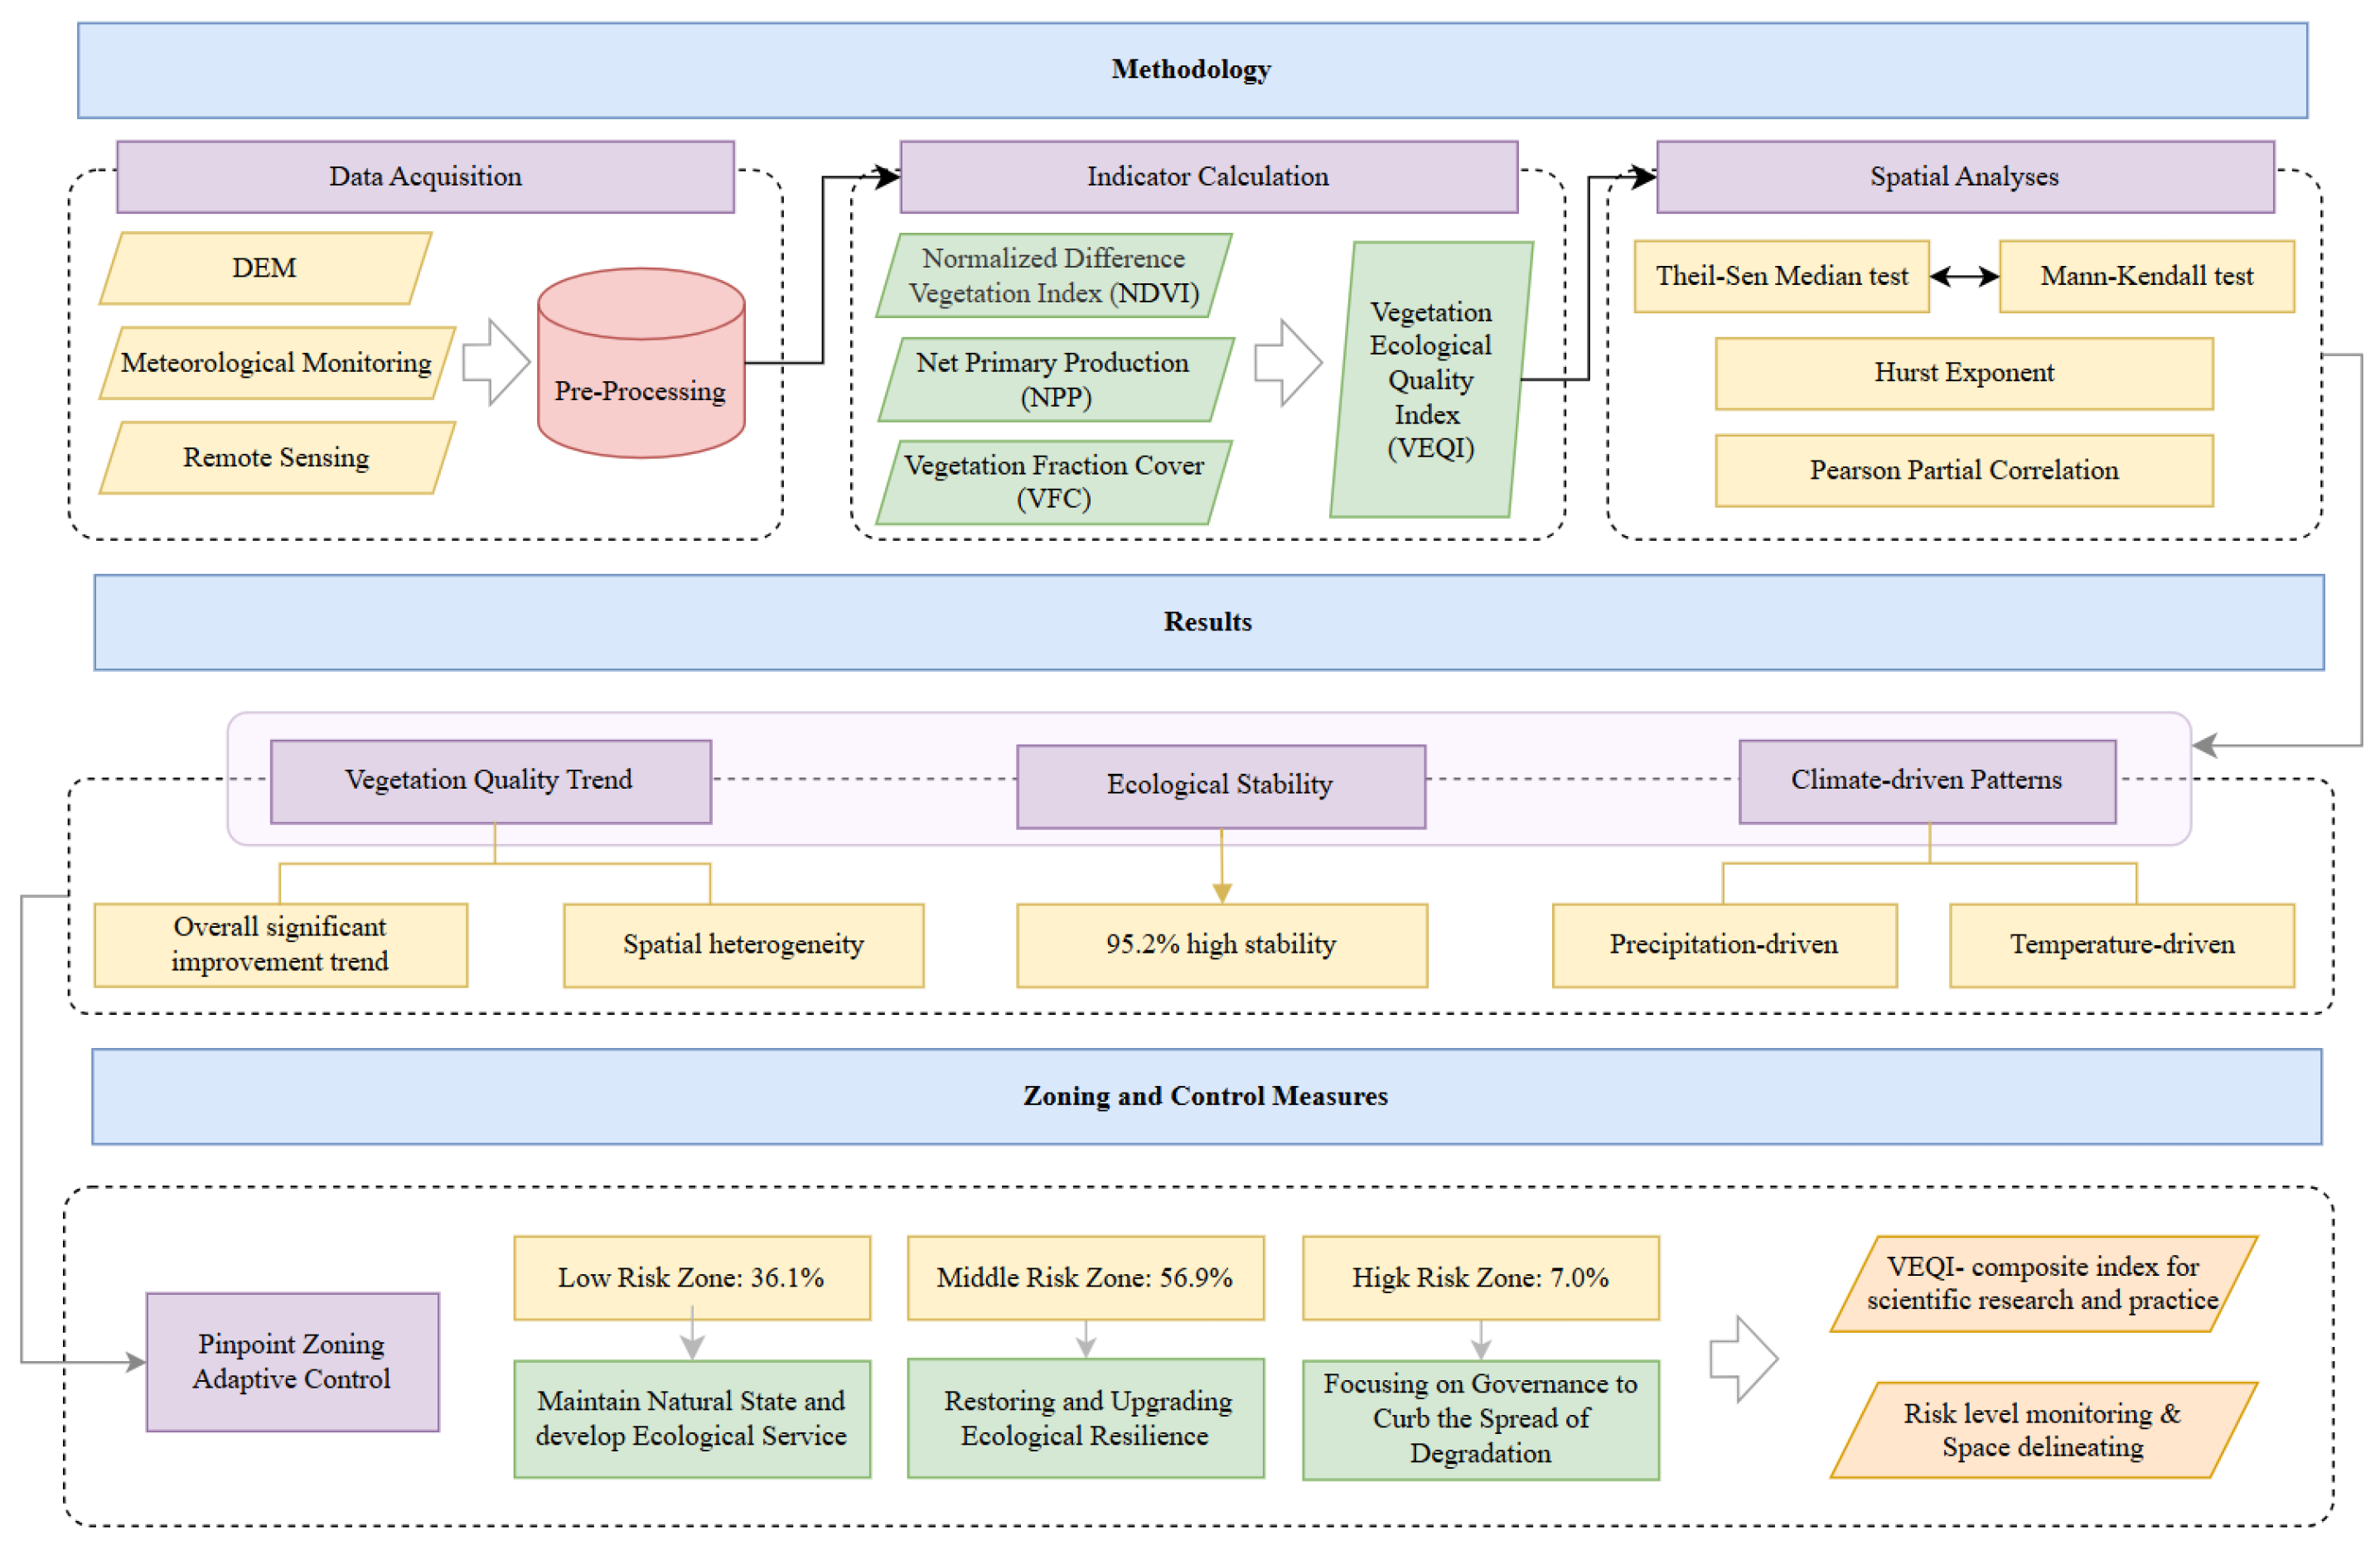
Based on previous research, this study starts with the spatiotemporal dynamics of the vegetation in the Qinling Mountains. Using remote sensing data and meteorological observation data, this study established a vegetation ecological quality index (VEQI) model by integrating vegetation fraction cover and net primary productivity. Furthermore, the trend analysis, significance and stability analysis were conducted. On the basis of statistical analysis, ecological risk levels and zones were classified and differentiated adaptive control strategies were proposed (Figure 1).
Figure 1.
Research Overview.
This study aims to create a simple and practical planning–monitoring–management loop, provide a scientific basis for the dynamic adjustment of ecological protection red lines and control space units. The objectives of this paper are as follows: (1) By constructing a VEQI model, describe the impact of recent climate change in the Qinling Mountains on vegetation dynamics. (2) By delineating and zoning ecological risks based on climate–ecological interactions, establish a bridge between scientific research and planning practice. (3) Provide new perspectives for future research on the development of the Qinling National Park as well as the specialized ecological conservation planning.
2. Materials and Methods
2.1. Study Area and Data Sources
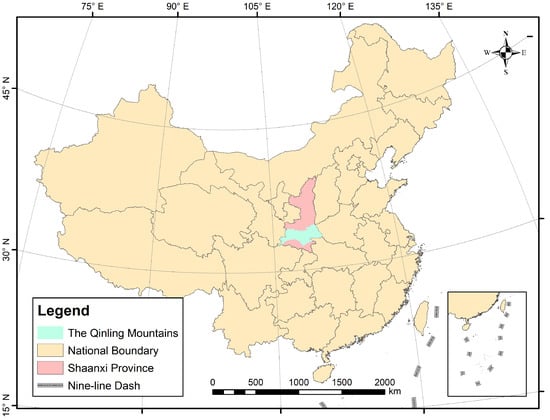
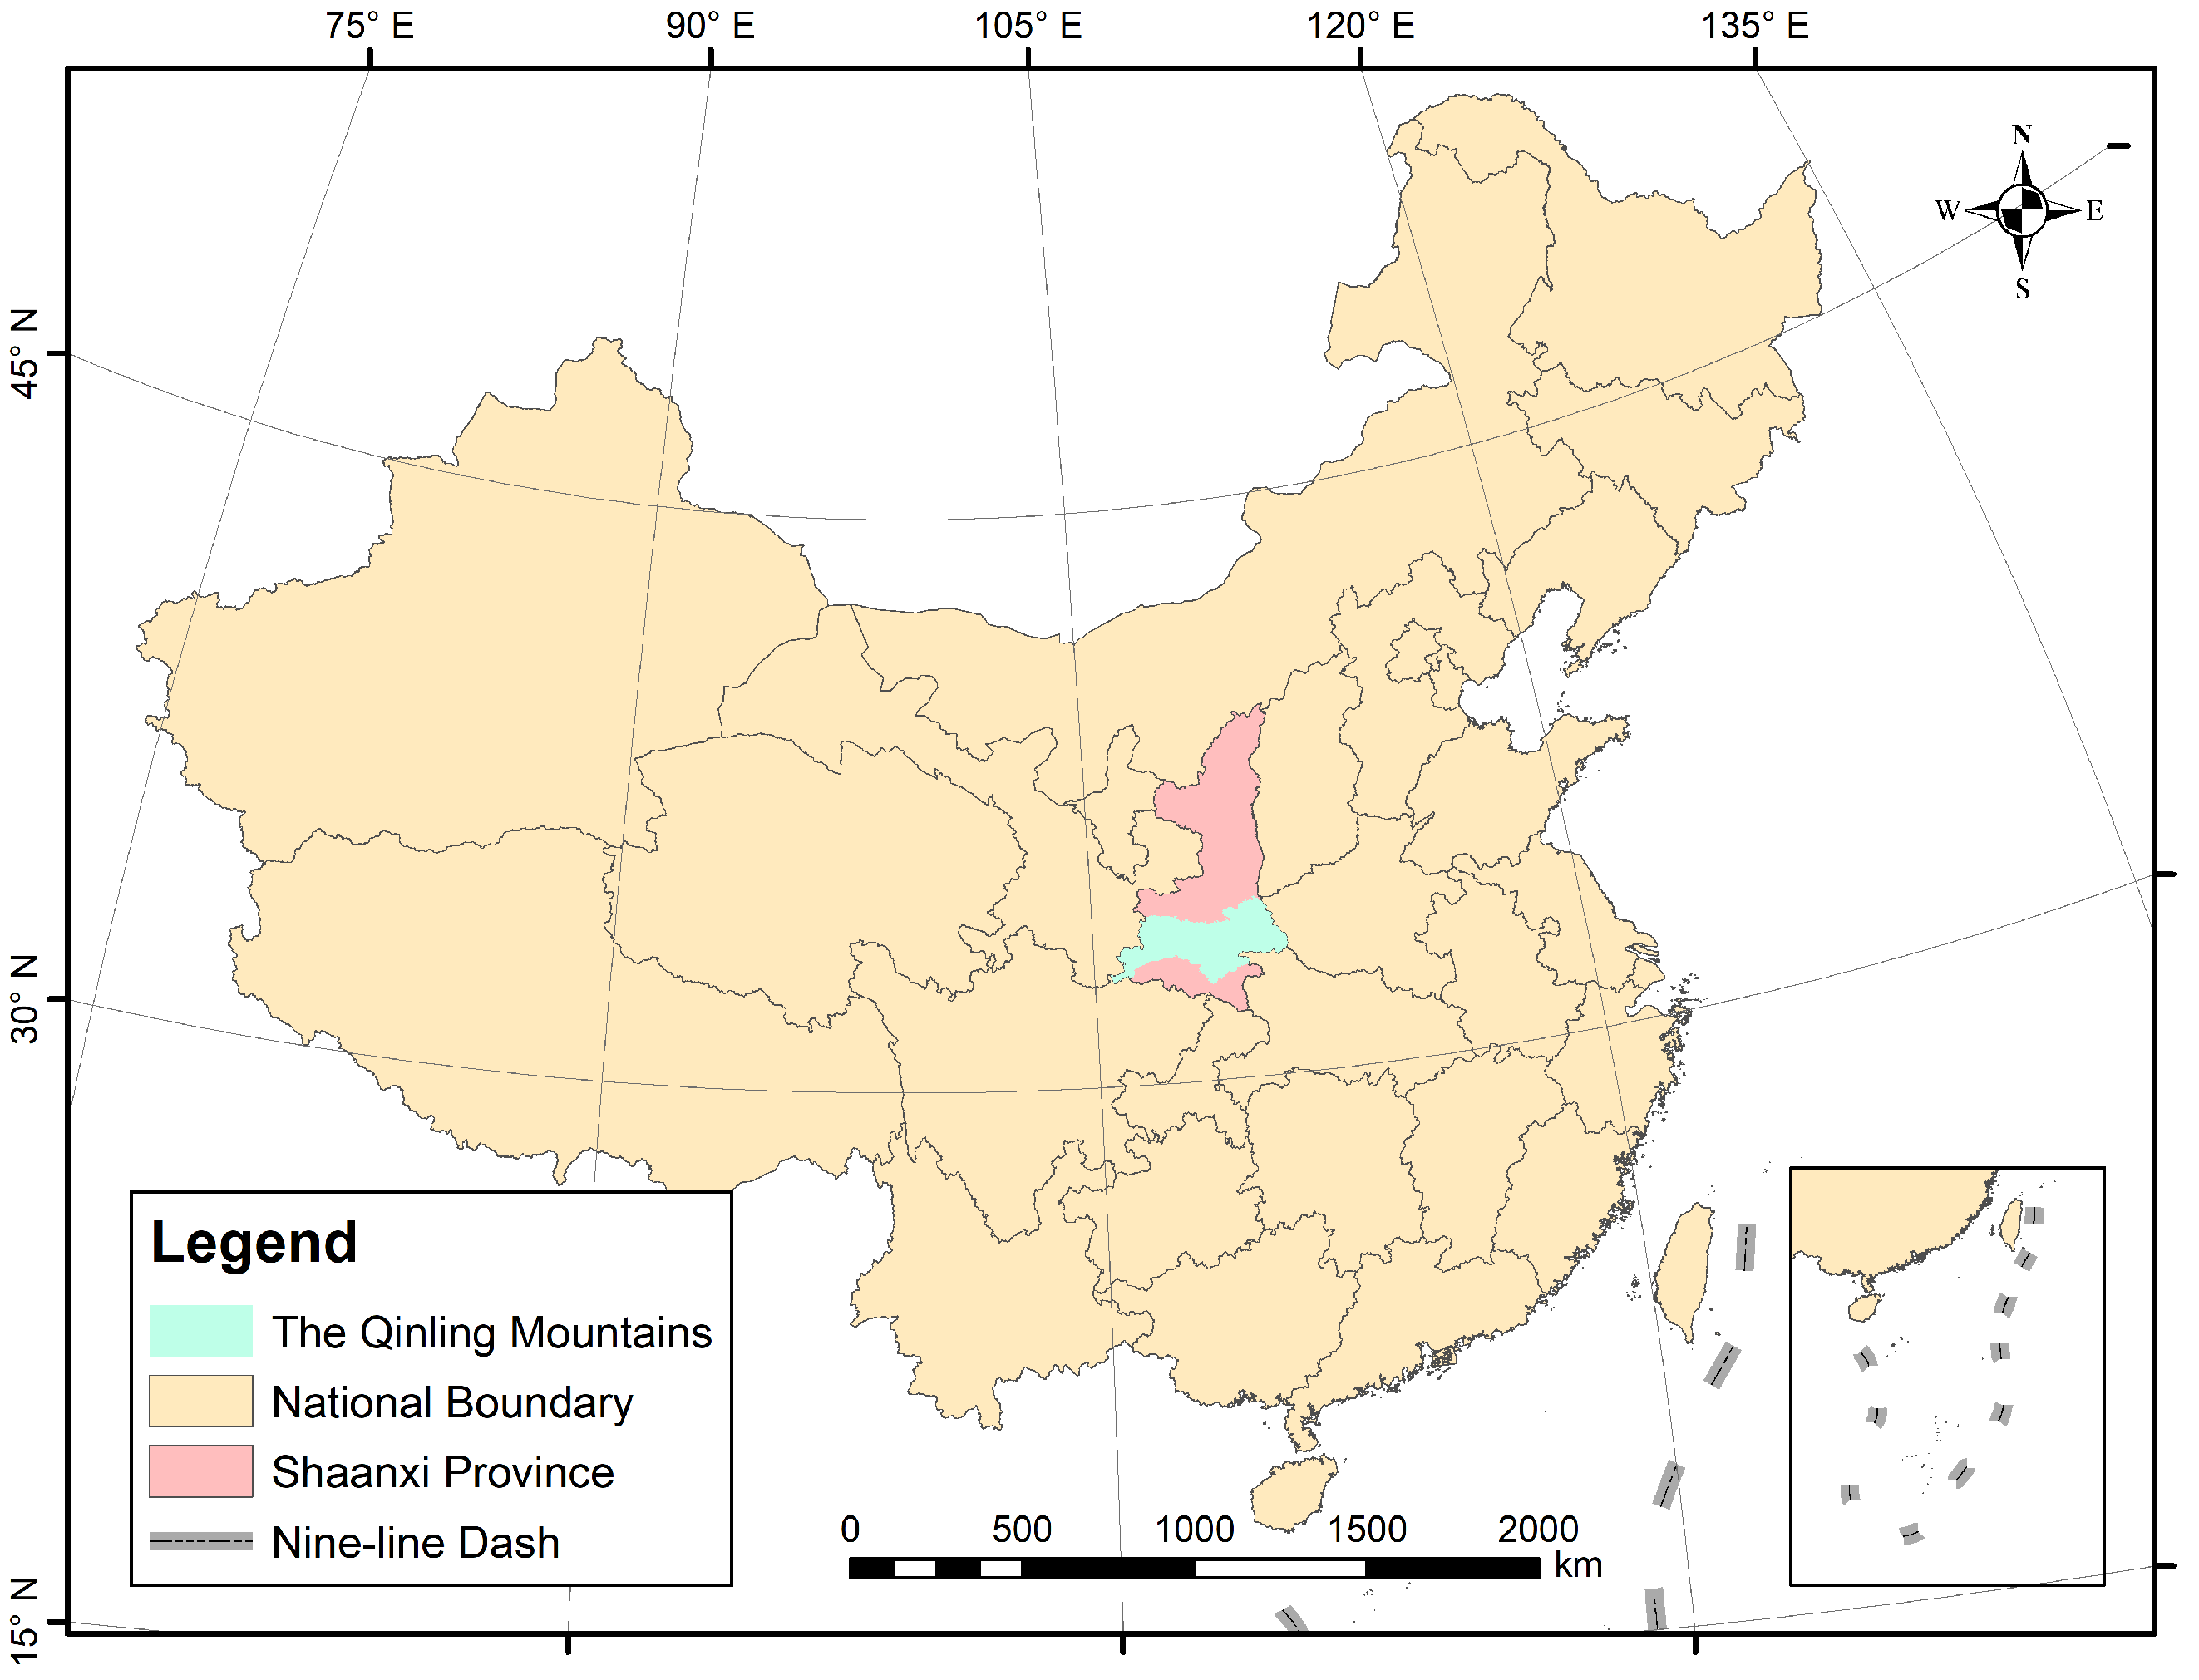
The study area is located on 105°29′18.19″~111°1′53.45″ E, 32°28′58.13″~34°40′14.61″ N, with a total area of 12,600 km2 (Figure 2). Along the main beam of the Qinling mountain system in Shaanxi Province, it extends from Laoyaoling in the east to Majiagou in the west, from Dagouding in the south to Lijiaobao in the north, including 102 townships in 20 counties and districts in six cities in Shaanxi Province, namely Xi’an, Baoji, Weinan, Hanzhong, Ankang and Shangluo.
Figure 2.
Location of the study area.
The following data were used in this study: (1) DEM data. These were obtained from the SRTM 90M digital elevation database v4.1 (https://srtm.csi.cgiar.org/ (accessed on 1 September 2025)). (2) Temperature and precipitation data. These were obtained from the “1-km monthly average temperature dataset for China” and the “1-km monthly precipitation dataset for China” from the National Tibetan Plateau Data Center [33,34]. Both of the dataset was created by downscaling global climate data from the Climatic Research Unit and WorldClim using the Delta spatial downscaling approach, and being validated using ground meteorological observatory data. (3) Normalized Difference Vegetation Index (NDVI). These were obtained from MOD13Q1 products (https://ladsweb.modaps.eosdis.nasa.gov/missions-and-measurements/products/MOD13Q1 (accessed on 1 September 2025)), which is computed from atmospherically corrected bi-directional surface reflectance and provides 16-day composite NDVI data at a 250 m × 250 m spatial resolution. (4) Net primary production (NPP) data. These were obtained from MOD17A3HGF.061 products (https://www.earthdata.nasa.gov/data/catalog/lpcloud-mod17a3hgf-061 (accessed on 1 September 2025)), which is generated using a photosynthetic efficiency model and provides 8-day composite NPP data at a 500 m × 500 m spatial resolution.
To ensure consistency across different data sources, these datasets were annualized by averaging and rescaled to a 250 m × 250 m resolution. The time span is from 2000 to 2023. The original data were projected, spliced and converted into raster datasets for the study area.
2.2. Indicators Process
2.2.1. Normalized Difference Vegetation Index (NDVI)
NDVI is calculated by maximum value composites:
where —reflectance in the near-infrared band; —reflectance in the red band. As for the MOD13Q1 products, and are the reflectance of band 2 (841–876 nm) and band 1 (620–670 nm) after the atmospheric correction.
2.2.2. Vegetation Fraction Cover (VFC)
Assuming that the surface of an image is divided into a vegetated part and an unvegetated part, the spectral information observed by the remote sensing sensor is synthesized by the linear weighting of these two component factors, and the weight of each factor is the ratio of the respective area in the image [35]. VFC can be obtained by inverse calculation.
where —NDVI value of completely bare soil or no vegetation area, —NDVI value of a completely vegetation-covered area.
As the study area is dominated by forest ecosystems, it can be approximated by taking = 100%, = 0%, respectively:
where and are the maximum and minimum NDVI values, respectively.
2.2.3. Vegetation Ecological Quality Index (VEQI)
This study applies the actual vegetation ecological quality index (VEQI) model of the Chinese Academy of Meteorological Sciences [36]. Focusing on the scope, productivity and function of vegetation, VEQI can be expressed as the product of the vegetation fraction cover (calculated from NDVI), the net primary productivity (MOD17A3HGF.061 products). All data were averaged annually and calculated:
where —vegetation ecological quality index in the ith year (gC·a−1·m−2); —net primary productivity in the ith year (gC·m−2·a−1); —vegetation fraction cover in the ith year.
2.3. Analysis Methods
2.3.1. Theil-Sen Median Estimation Coupled with Mann–Kendall Significance Test
Theil-Sen median estimation is a robust non-parametric statistical approach to trend calculation, and Mann–Kendall significance test is a non-parametric test. The coupled calculation of the two can be used to determine whether time series data have an upward or downward trend, without the interference of a few outliers. The Theil-Sen median estimate β is calculated as follows:
where are the indicator’s value in the ith and jth year, respectively; β—the median for calculating the slope of n(n − 1)/2 indicator value pairs. When β > 0, indicator for this time series shows an increasing trend, otherwise it shows a decreasing trend.
Mann–Kendall significance test is calculated as below:
where
The significance was judged at a confidence level of α = 0.05 and α = 0.01, which corresponds to the significance index Z = 2.576 and Z = 1.960, respectively. The significant levels were further classified as significant (|Z| > 2.576), moderate (1.960 ≤ |Z| ≤ 2.576), and insignificant (|Z| < 1.960). Integrating Theil-Sen median estimation, coupled with Mann–Kendall significance test, the degree of improvement or degradation of the indicator was confirmed (Table 1).
Table 1.
Degrees of improvement or degradation.
2.3.2. Hurst Exponent
The Hurst exponent can quantitatively describe the long memory of the time series, where current or past values could influence future values beyond what would be expected from random fluctuations [37]. The Hurst exponent is calculated using the rescaled range method:
Given a time series {ε(t)}, t = 1, 2…, for any integer n = 1, define as follows,
If there exists H, R/S ∝ nH, then there is a Hurst phenomenon for the time series. The value of H is called Hurst exponent, which can be obtained by least squares fitting in a double logarithmic coordinate system (ln n, ln(R/S)). According to the range of values of the Hurst index, the Hurst phenomenon reflects the stable nature of the time series: (1) When 0.5 < H < 1, this is a continuous series, i.e., the trend of future changes is consistent with the past trend. The closer H is to 1, the stronger the continuity is. (2) When H = 0.5, this is a stochastic series, i.e., future trends are independent of past trends. (3) When 0 < H < 0.5, this is an anti-continuous series, i.e., the future trend is opposite to the past trend. The closer H is to 0, the stronger the anti-continuity is. The study area was classified into three stability classes based on the range of their values (Table 2).
Table 2.
Stability levels.
2.3.3. Correlation Analysis
Pearson’s partial correlation analysis was used to study the relationship between climatic factors and vegetation ecological quality indices [6].
where —Pearson’s partial correlation index, n—years’ count, i—the ith year, x—independent variable (temperature or precipitation), y—dependent variable.
3. Results
3.1. Trend Analysis
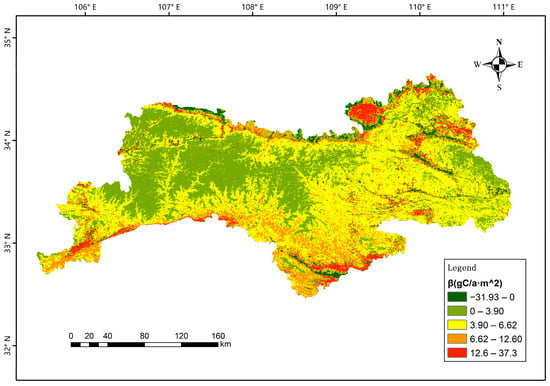
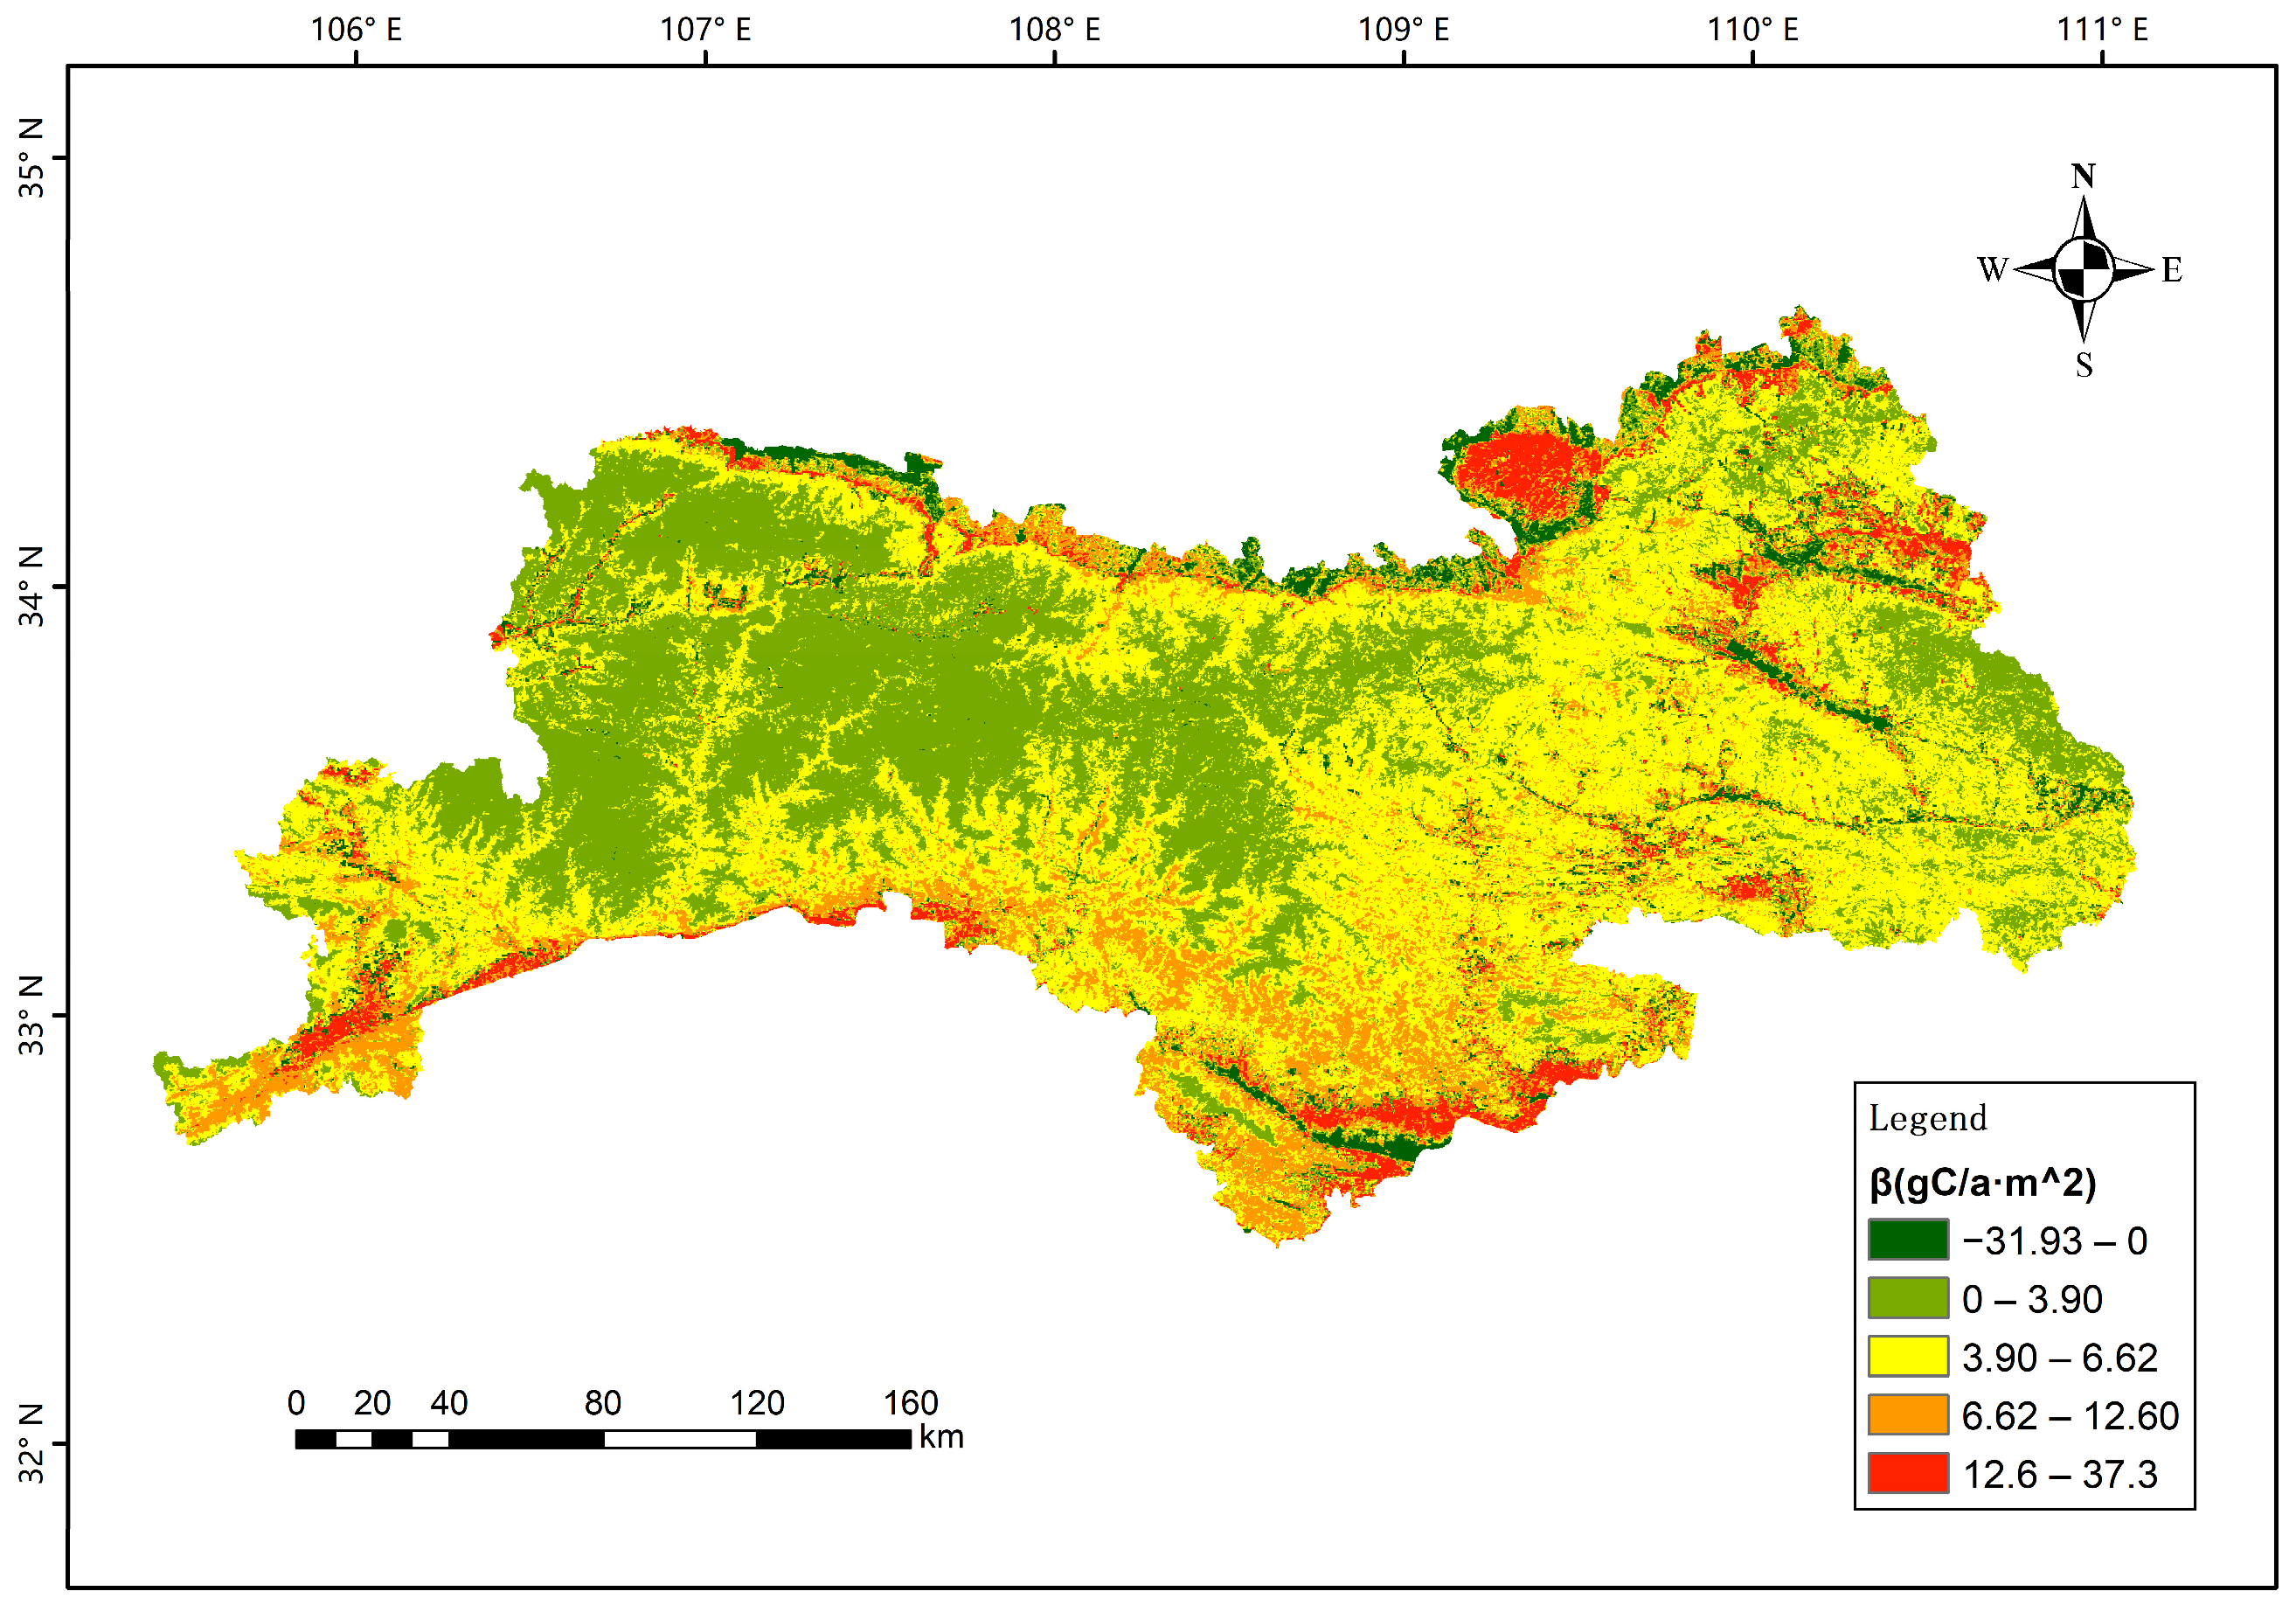
The result of the Theil-Sen median trend analysis of the vegetation ecological quality index (VEQI) is shown in Figure 3. The slope of inter-annual variation in the study area ranged between −31.93 gC·a−1·m−2 and 37.30 gC·a−1·m−2, which was divided into five intervals using natural breaks method to minimize the impact of human factors on the analysis results. The maximum value (37.30 gC·a−1·m−2) corresponded to the upper limit of the highest trend interval, indicating the most improved vegetation area. The minimum value (−31.93 gC·a−1·m−2) corresponded to the lower limit of the lowest interval, reflecting the most degraded vegetation area. The overall average slope of change was 4.91 gC·a−1·m−2.
Figure 3.
Theil-Sen median trend analysis of VEQI from 2000 to 2023.
In terms of spatial pattern, 96.2% of the total area was covered by improving vegetation areas. Specifically, areas with slopes ranging from −31.93 gC·a−1·m−2 to 0 gC·a−1·m−2 took up 3.8%, and sporadically distributed in the northern valleys and in areas of intense human activity; areas with slopes ranging from 0 gC·a−1·m−2 to 3.63 gC·a−1·m−2 accounted for 34.4%, and were widely distributed in the low-elevation plains and gently sloping areas west of the center; the area with slopes ranging from 3.63 gC·a−1·m−2 to 6.35 gC·a−1·m−2 got the highest proportion, 44.2%, and were continuously patched in the core of the mid-elevation mountains; the areas with slopes ranging from 6.35 gC·a−1·m−2 to 12.32 gC·a−1·m−2 covered 13.2%, which were mainly concentrated in high-elevation forest reserves and shaded slopes. Finally, areas with slope greater than 12.32 gC·a−1·m−2 and up to 37.30 gC·a−1·m−2 accounted for 4.4%, which were patchily distributed in the water conservation area and ecological closure area.
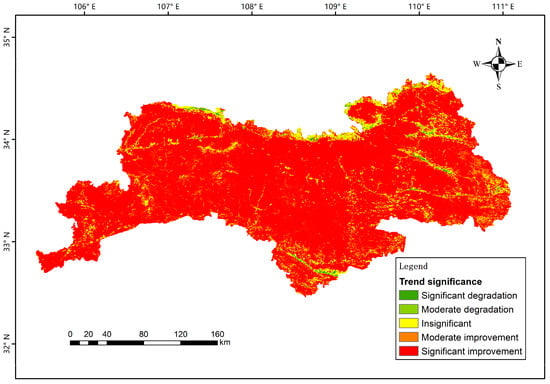
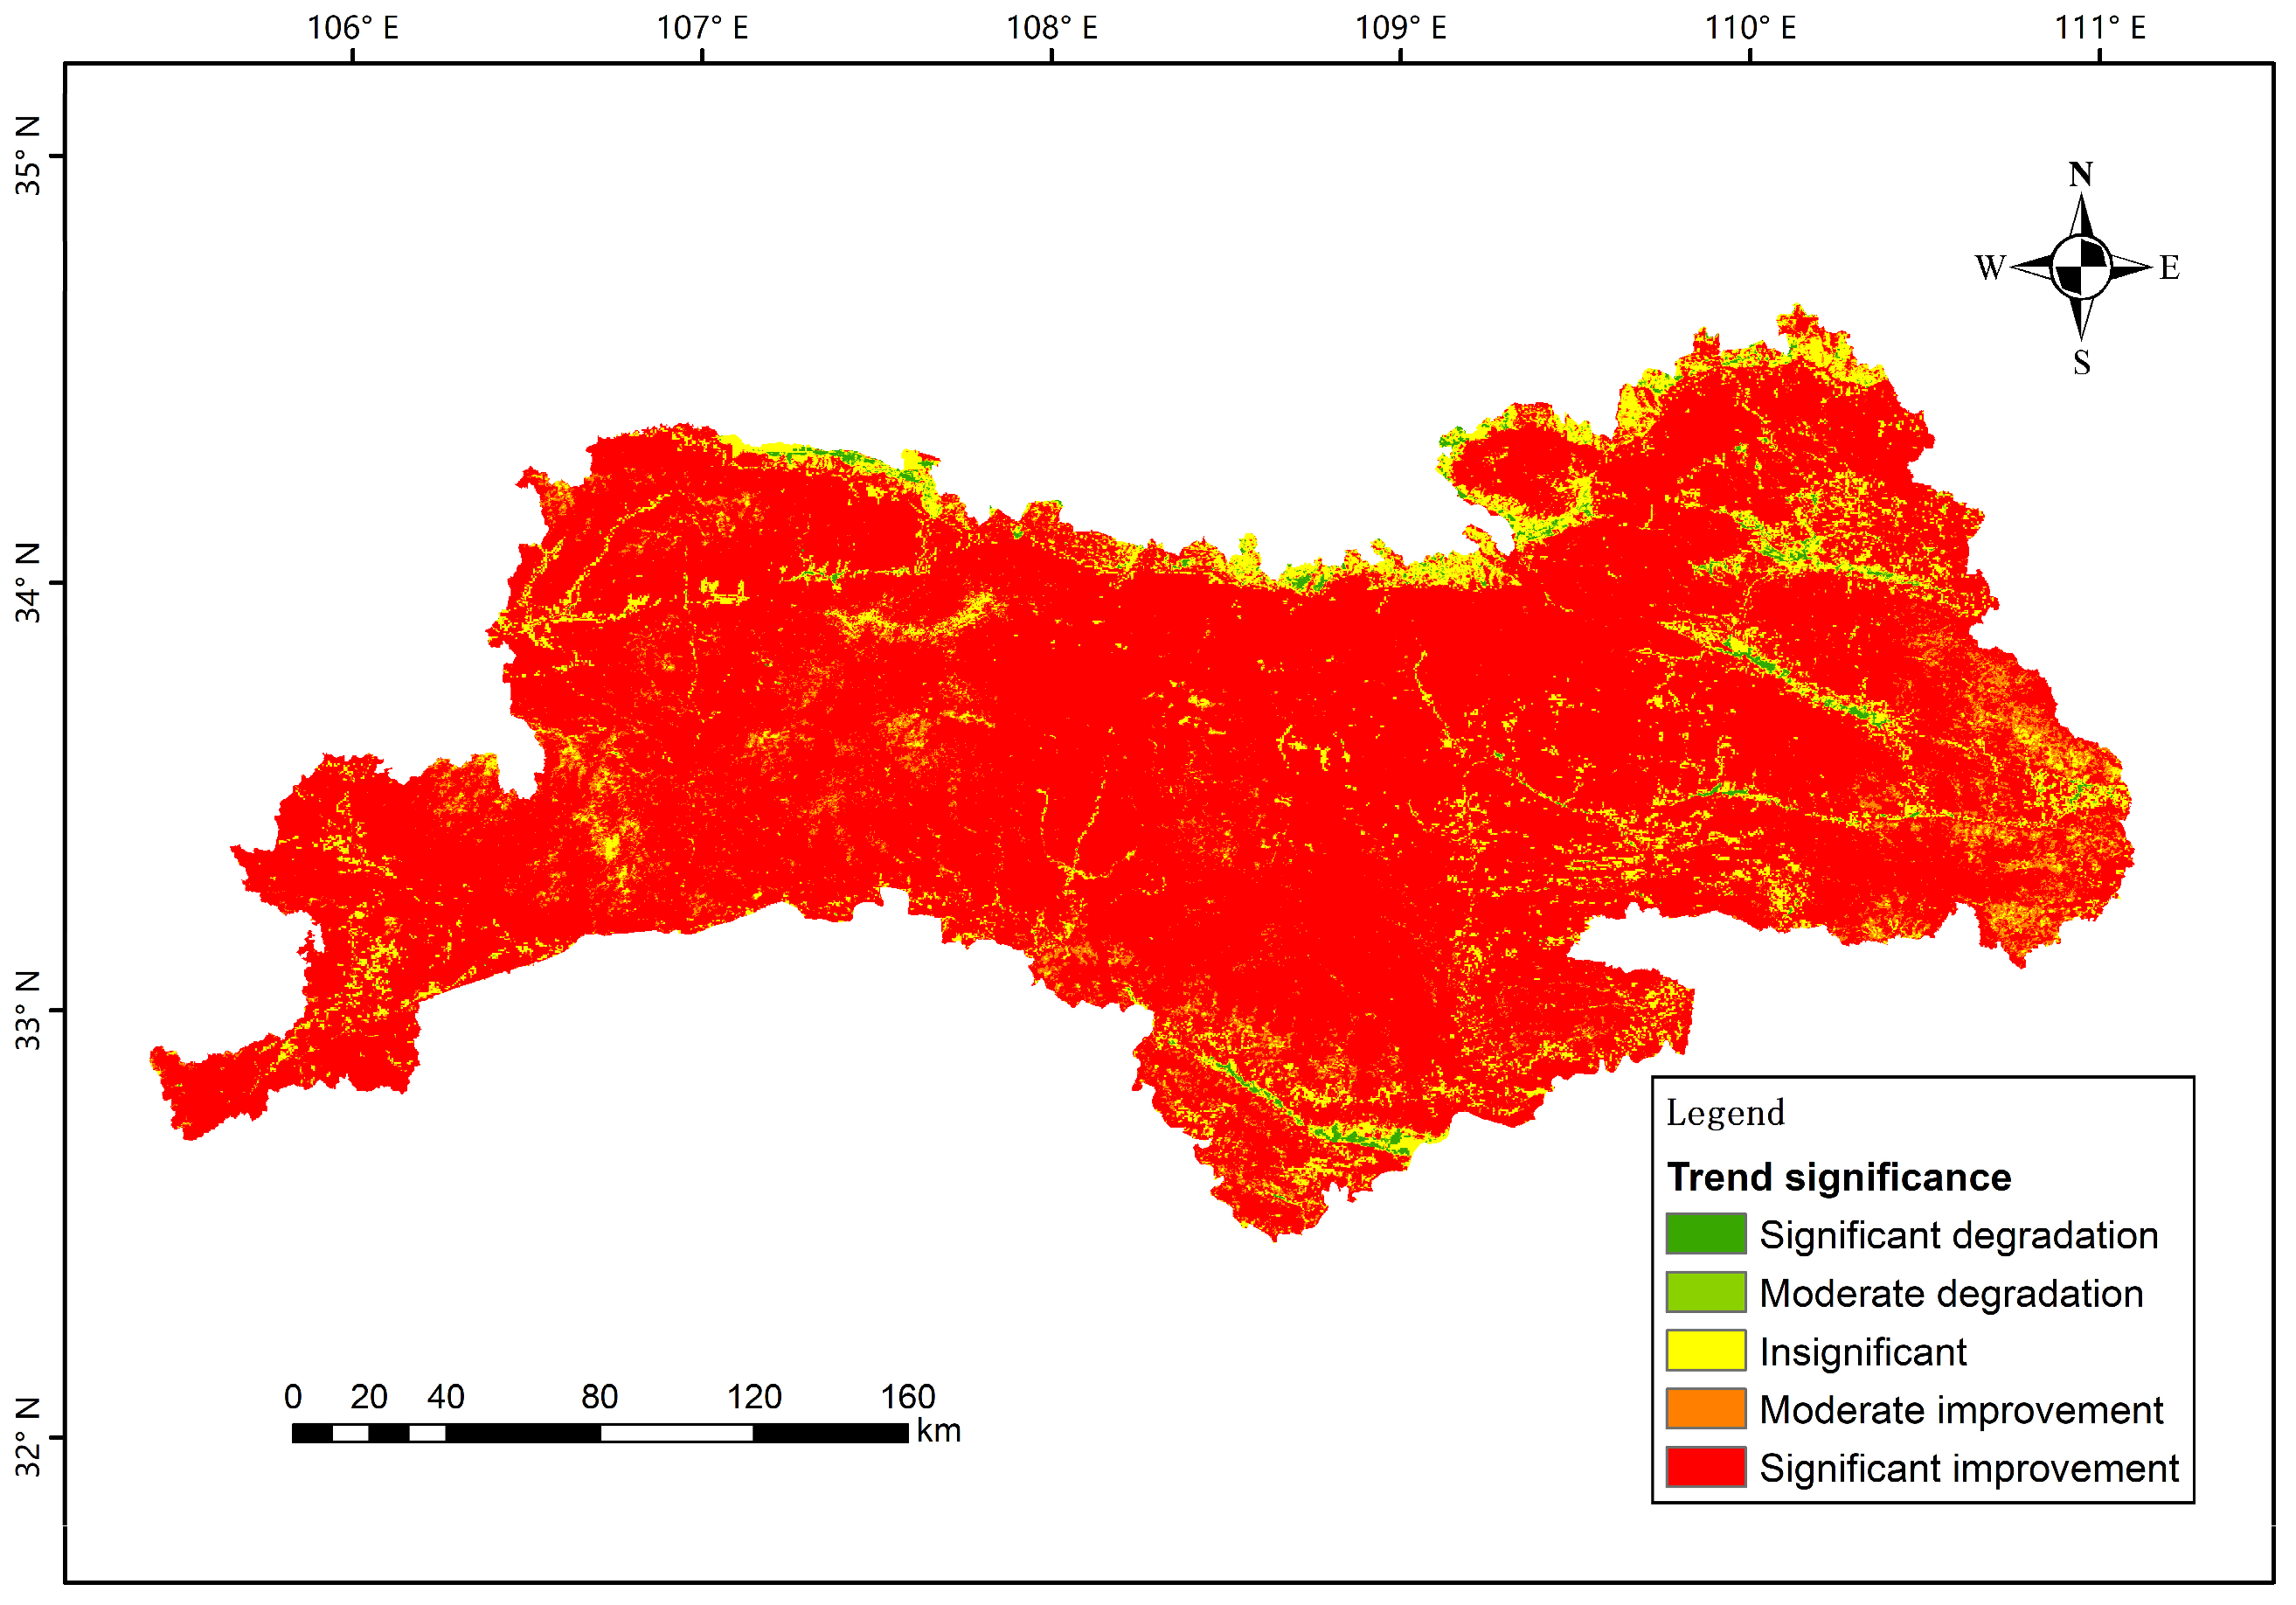
Based on the Mann–Kendall significance test, combined with Theil-Sen median trend analysis, the improvement or degradation trend of VEQI was obtained, as shown in Figure 4. Among them, significantly improved areas cover the highest percentage of 86.1%, which were widely distributed throughout the study area, constituting the dominant pattern of vegetation change; Meanwhile, percentages of moderately significant improvement areas and insignificant areas were 5.1% and 7.9%, respectively. Both types of areas were spatially scattered in patches between significant improvement areas, or concentrated in ecological transition zones and some areas of complex topography. The degradation areas were relatively small, with 0.3% of the moderately significant degraded areas and 0.6% of the significant degraded areas.
Figure 4.
The significance of improvement or degradation trend for VEQI from 2000 to 2023.
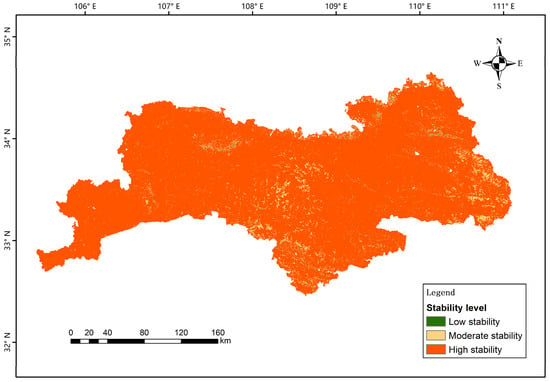
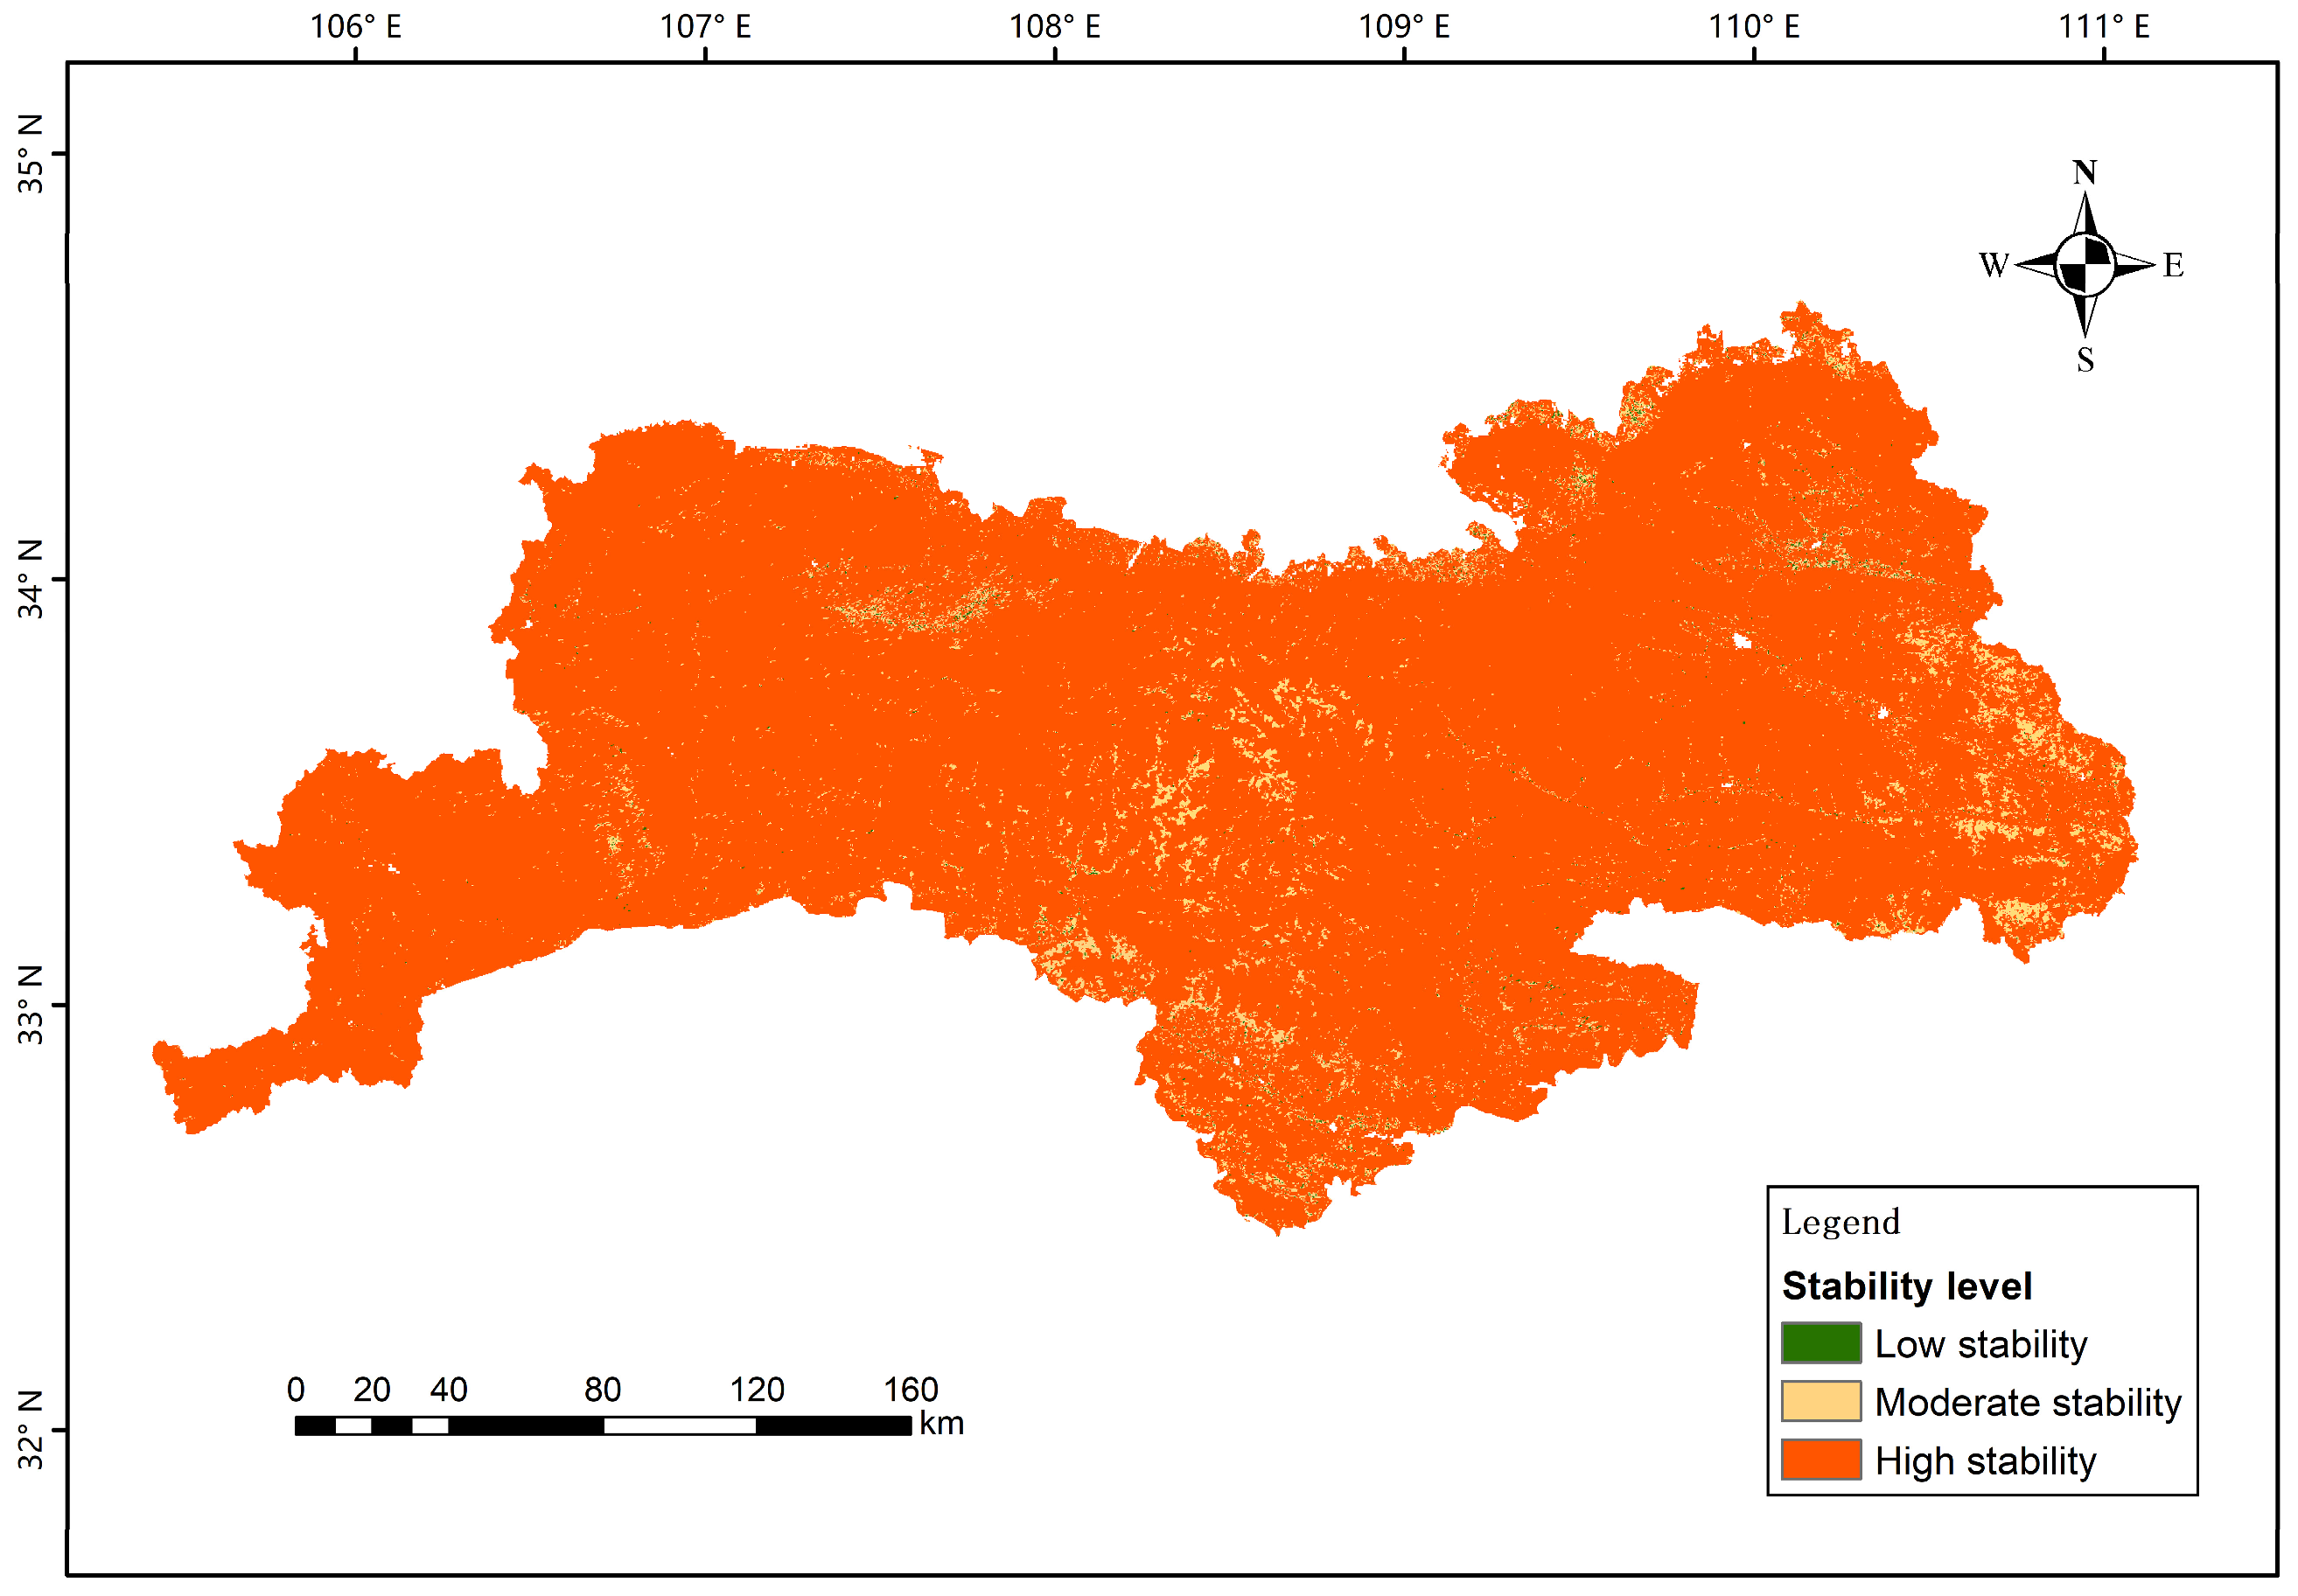
The stability of VEQI was assessed based on the Hurst exponent, which is shown in Figure 5. High stability areas accounted for 95.2%, which were widely distributed in the main vegetation cover area in the hinterland of the Qinling Mountains, constituting the basic pattern of ecological stability in the region; moderate stability and low stability areas covered 4.6% and 0.2%, respectively.
Figure 5.
Stability of VEQI from 2000 to 2023.
In summary, the overall ecological quality of vegetation in the study area showed a significant trend of improvement. Spatial patterns were dominated by large stable and favorable areas, with the degraded areas limited and highly discrete. The ecosystems of the Qinling Mountains have a high degree of long-term stability, though the relatively scattered degraded areas also pose challenges for subsequent ecological restoration efforts.
3.2. Partial Correlation Analysis
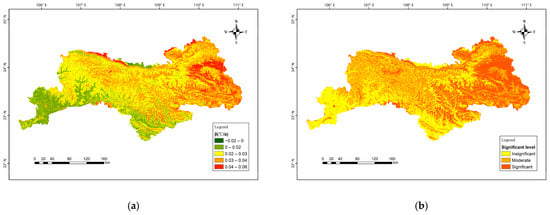
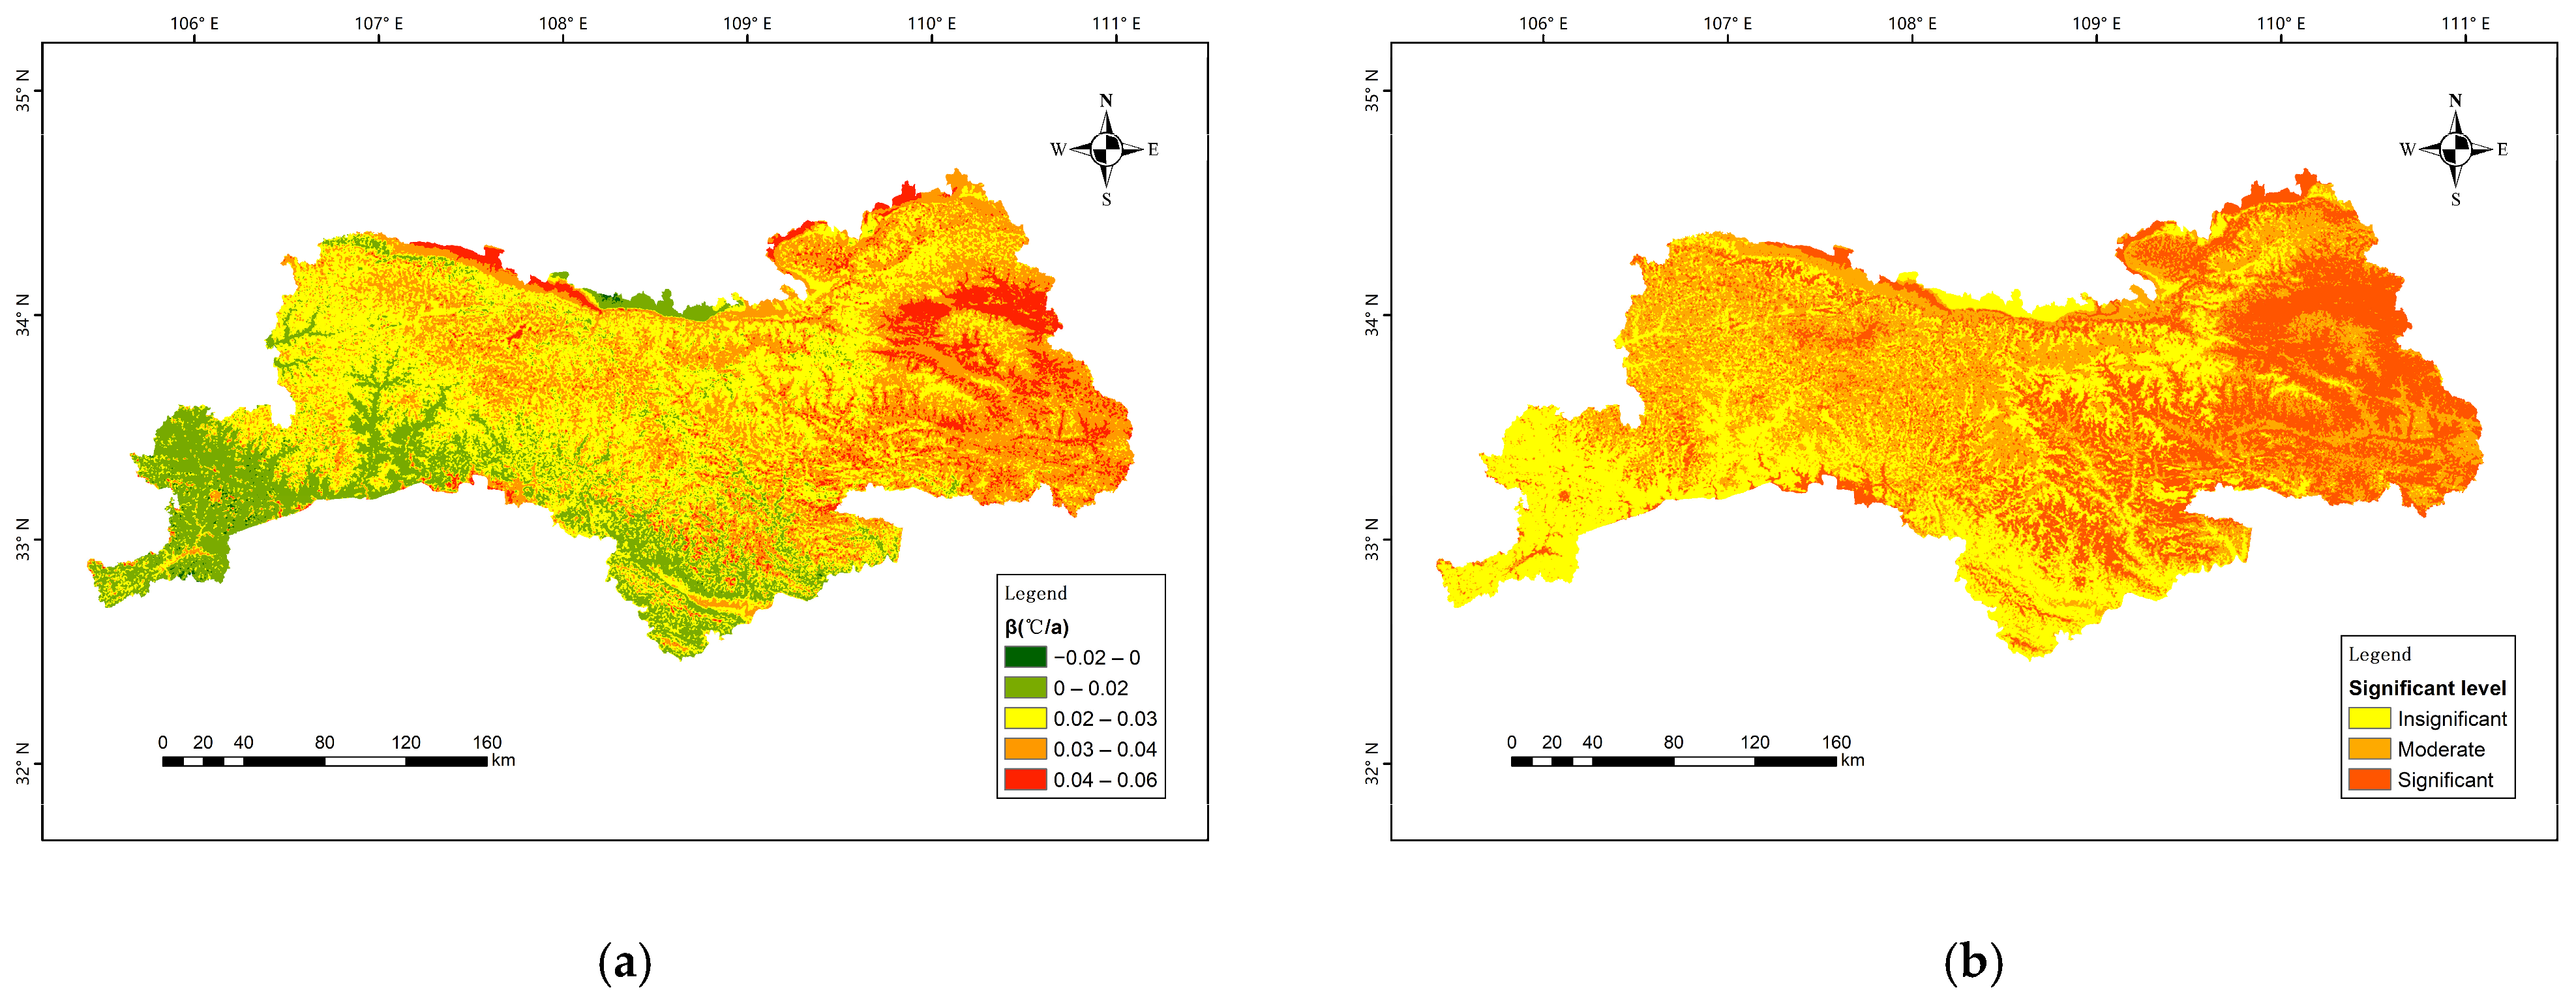
Temperature and precipitation are the most dominant climatic factors, thus separate partial correlation analyses of temperature and precipitation with VEQI were performed. The trend and significant level of annual mean temperature is shown in Figure 6. The slope varies between −0.02 °C·a−1 and 0.06 °C·a−1, with an average rate of change of 0.03 °C·a−1. The heating areas accounted for 91.0% of the total area, with high warming zones (>0.04 °C·a−1) accounted for 13.5%; moderate warming zones (0.02–0.04 °C·a−1) covered nearly 59.2% and is widely distributed over most of the study area, constituting the main part of the warming; the weakly warming and stable zones (0–0.02 °C·a−1, 18.3%) follow. While the cooling area covered 9.0%, mainly distributed in sporadic patches and some high-elevation mountains. Significant and moderate significant totally account for 68.2%, with insignificant areas covers 31.8%, aligning with the distribution of trend.
Figure 6.
(a) Trend and (b) significant level of the temperature from 2000 to 2023.
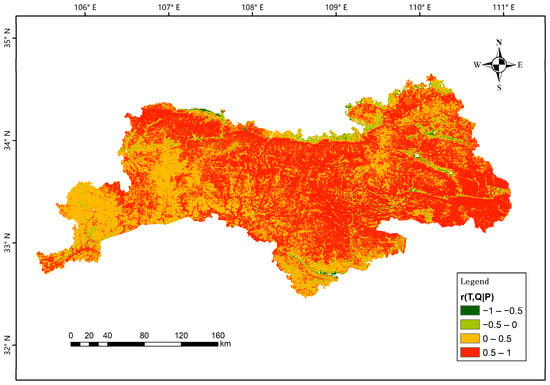
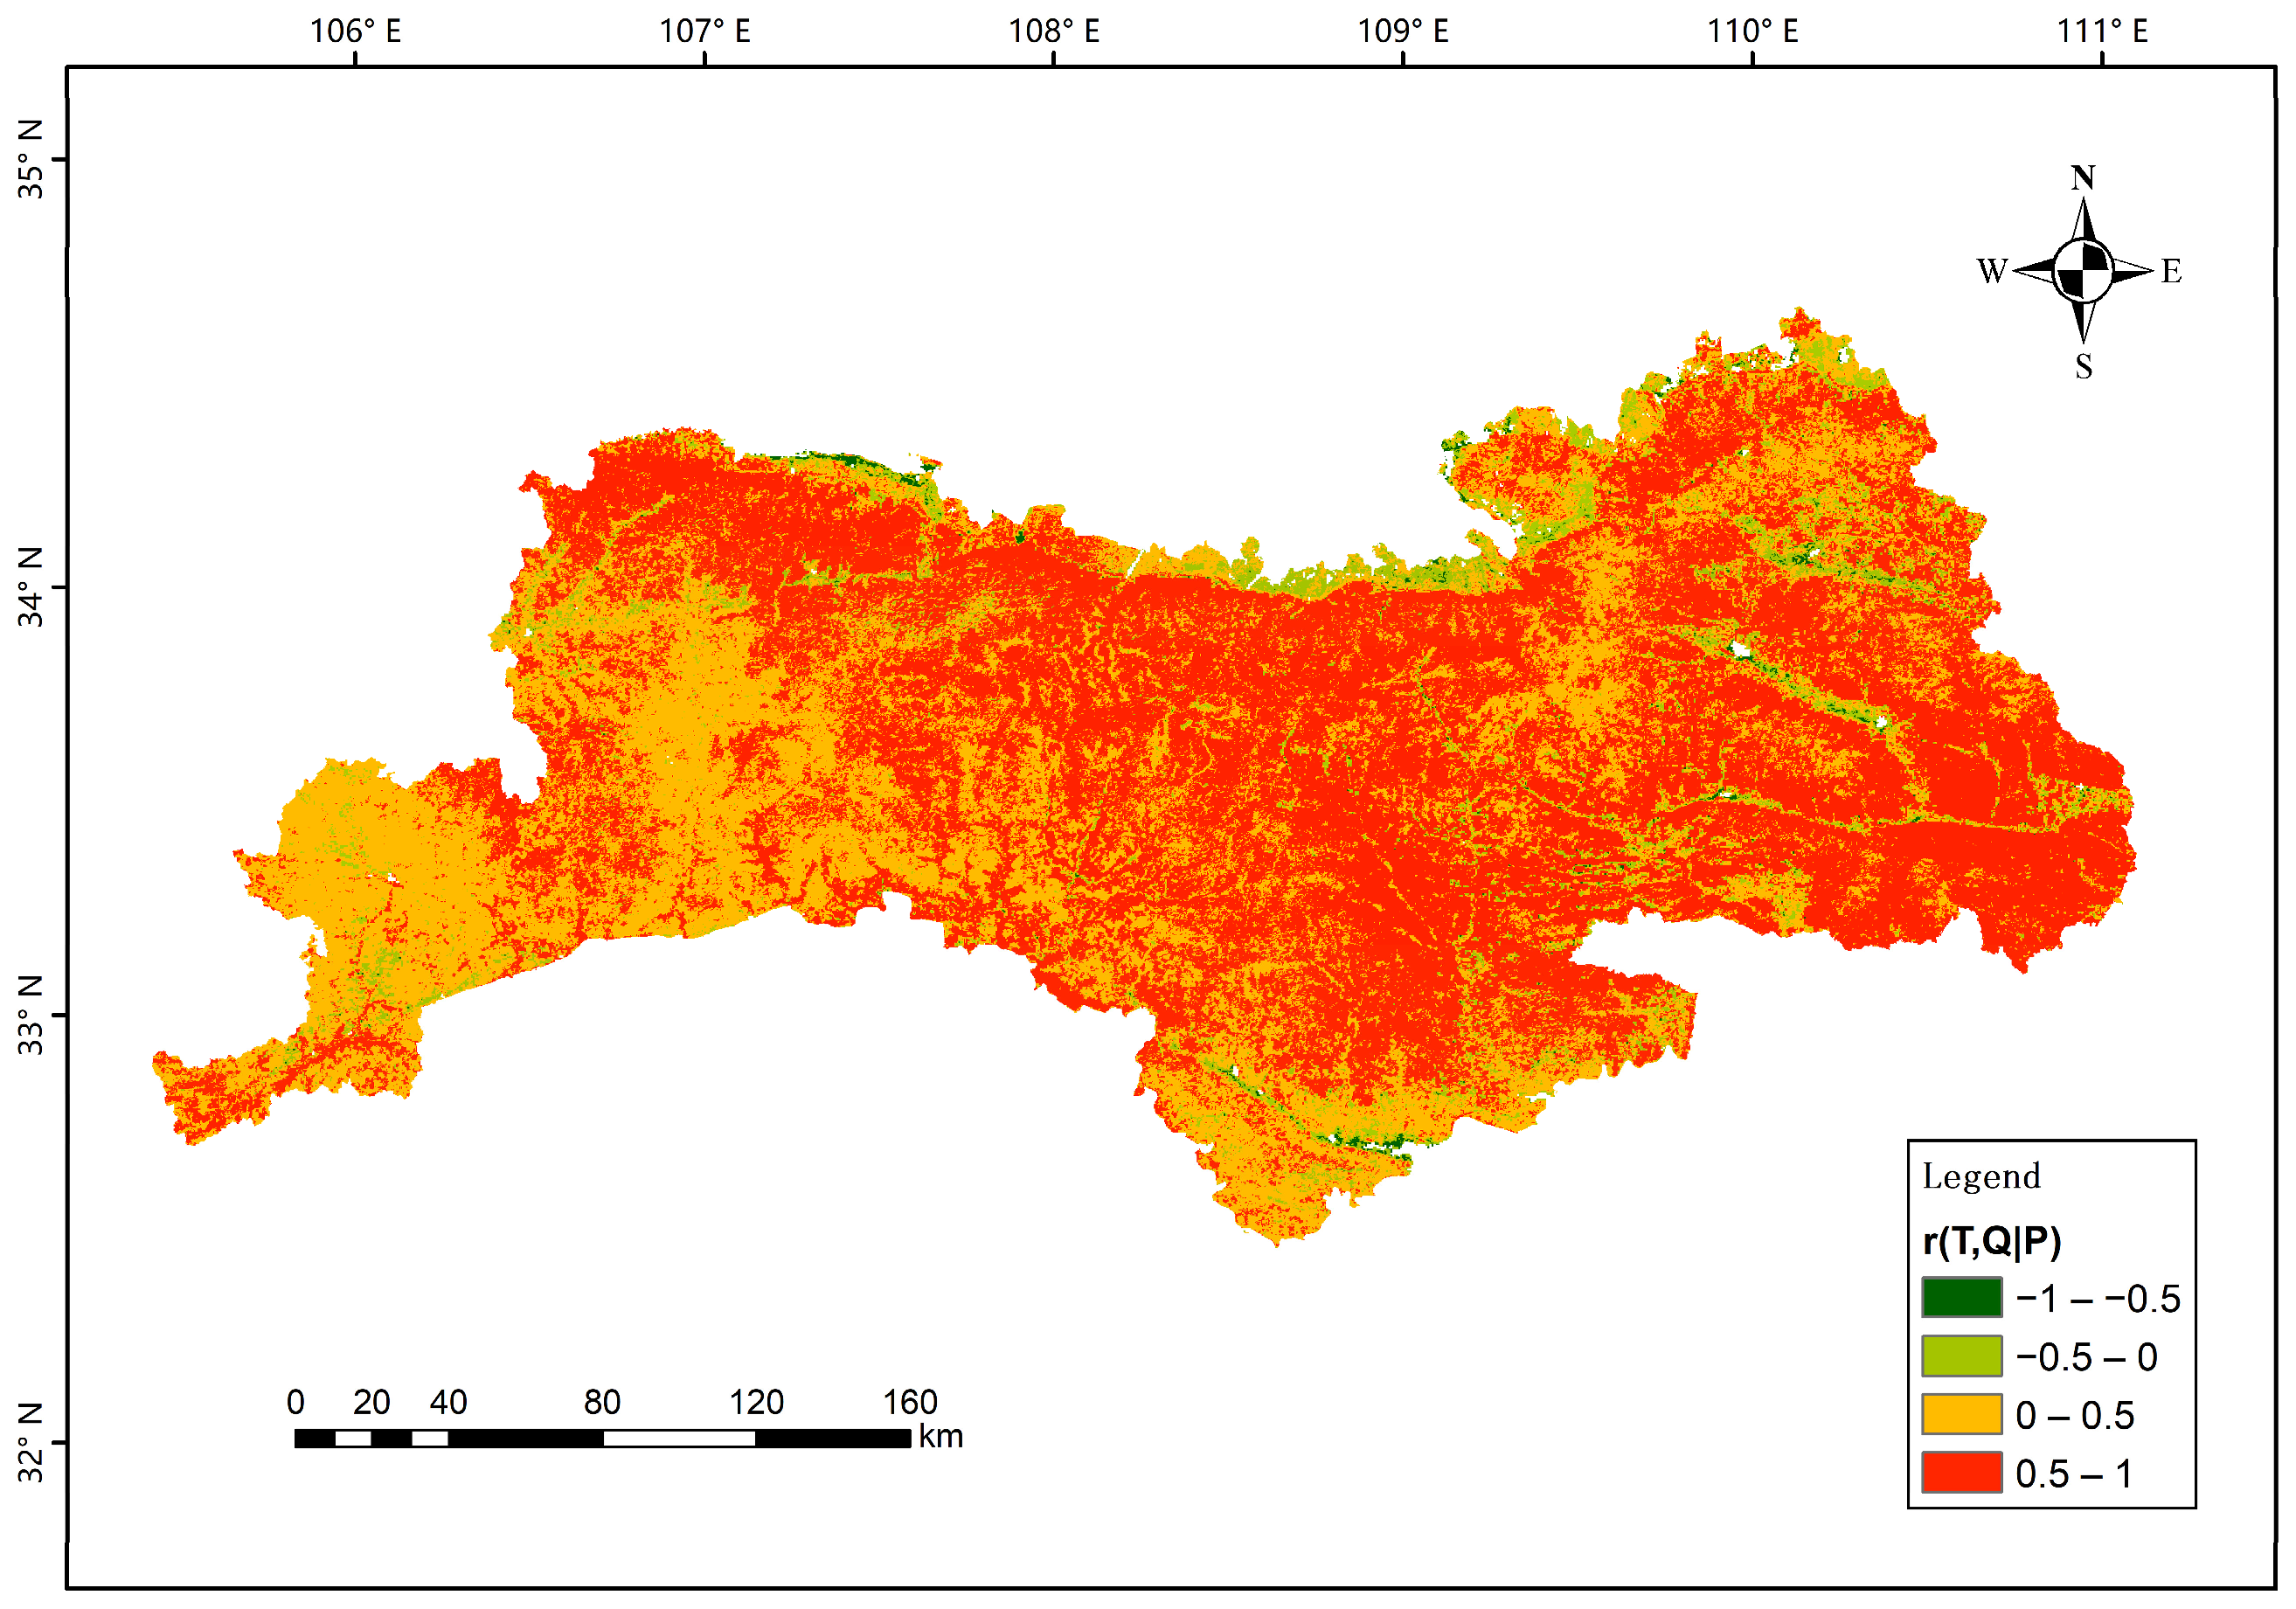
Based on the partial correlation analysis, the relationship between vegetation ecological quality and temperature change showed significant spatial heterogeneity (Figure 7). A positive correlation was observed in most of the study area (95.0%), and the positive effect was particularly significant in the low-elevation river valleys and south slopes. However, in high-elevation mountainous areas, especially the main ridge of the Qinling Mountains and its surrounding alpine zone, the partial correlation coefficients between vegetation ecological quality and temperature were negative.
Figure 7.
Partial correlation between temperature and VEQI from 2000 to 2023. Where r(T, Q|P) represents the partial correlation r of temperature on VEQI eliminating the influence of precipitation.
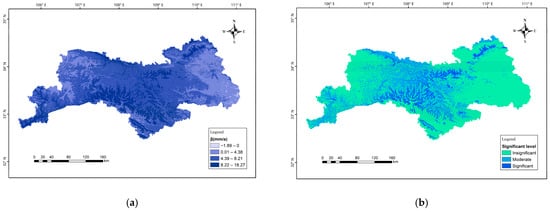
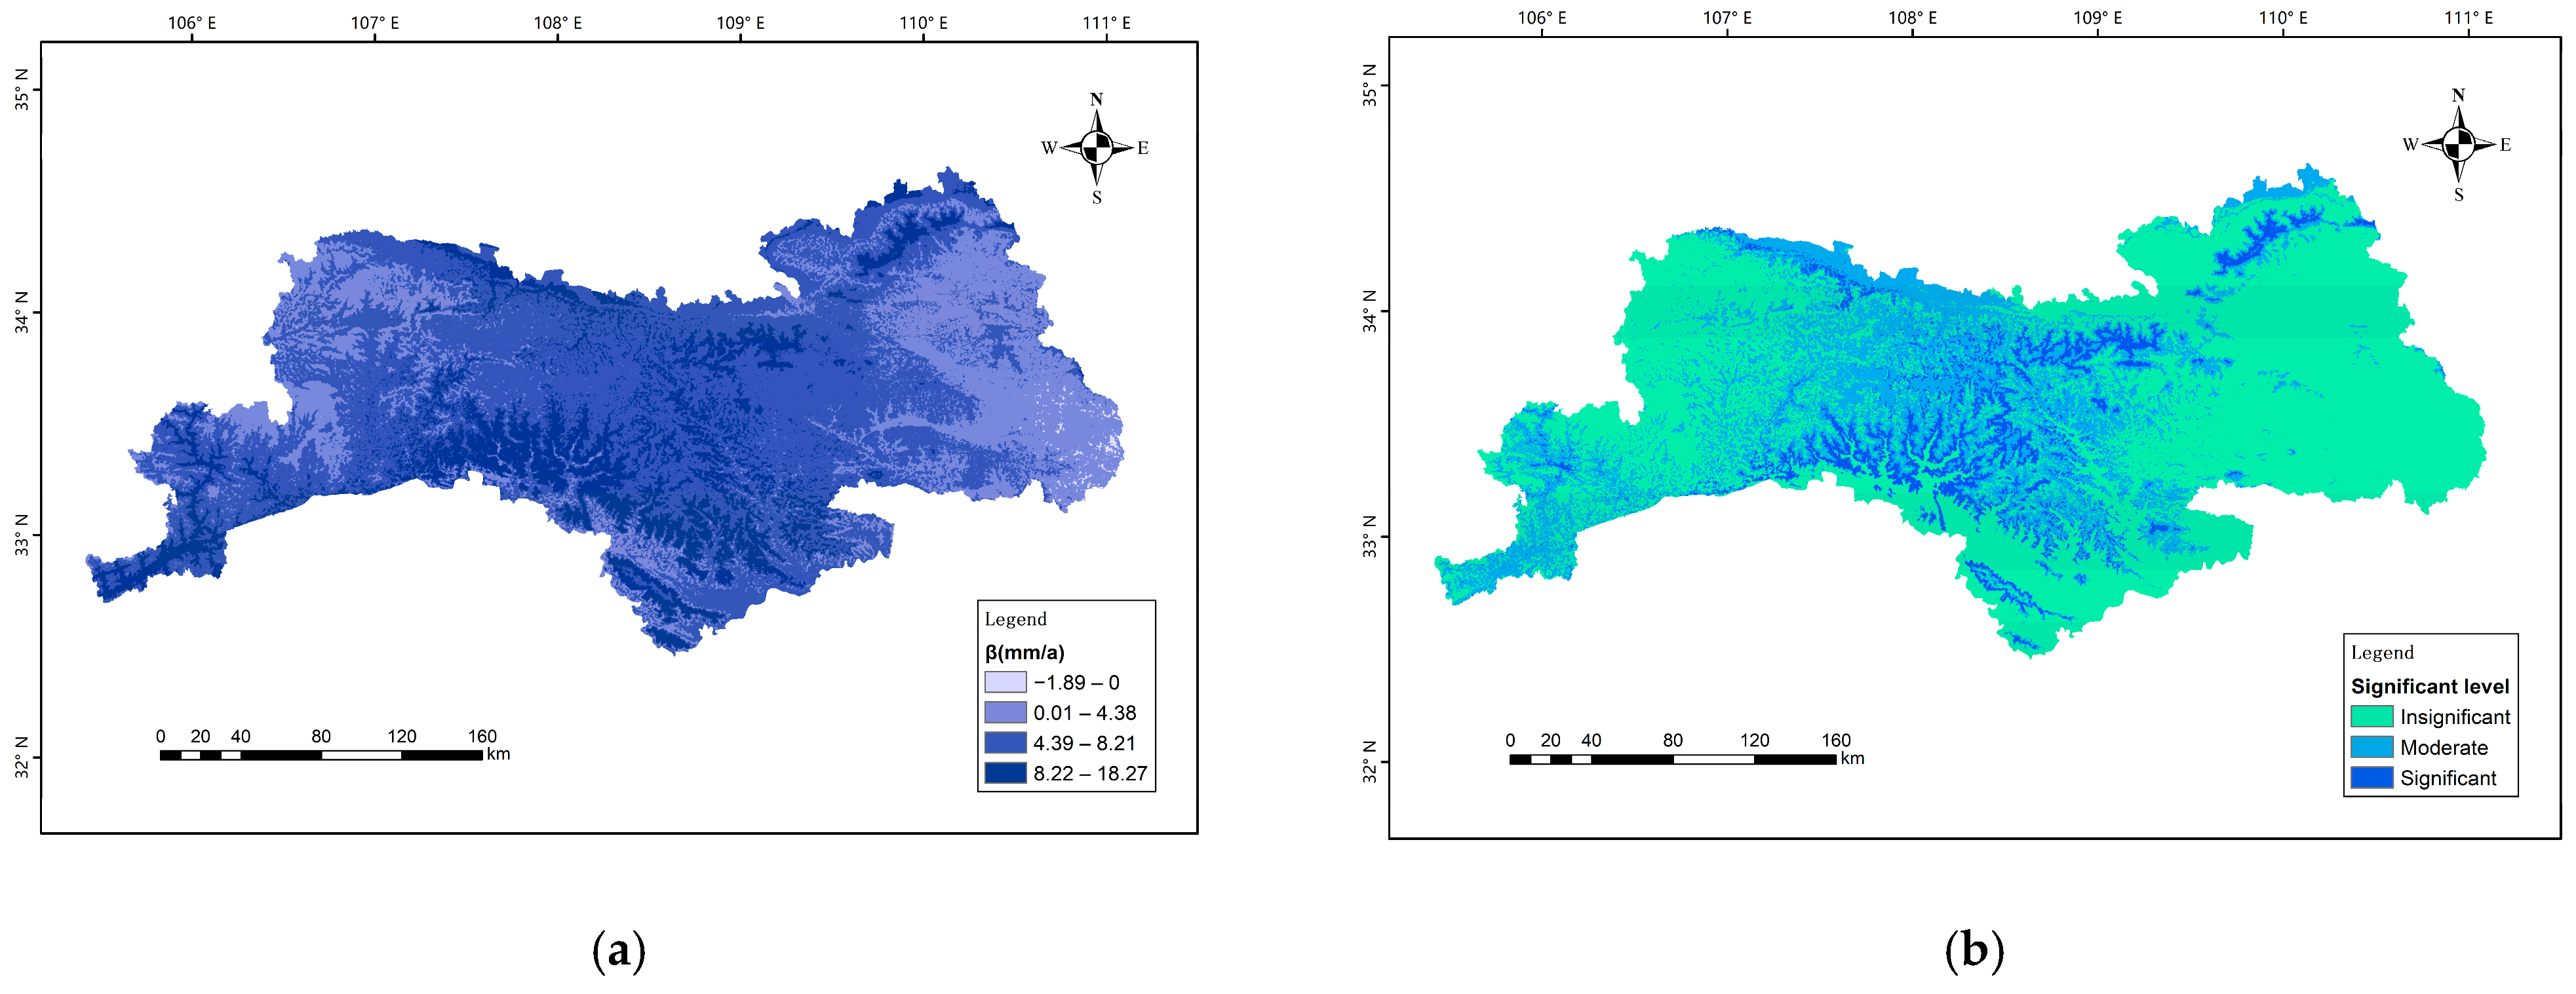
The trend of average annual precipitation in the Qinling area is shown in Figure 8. The slope of precipitation changes ranged between −1.894 mm·a−1 and 18.27 mm·a−1. The positive slope area accounted for 99.8%, while the negative slope area accounted for merely 0.2%, which is negligible and confirms the humidification of the Qinling Mountains. In terms of spatial distribution, the trend of precipitation increase has obvious vertical zoning characteristics. Slight increasing areas (26.8%) with slopes ranging from 0 to 4.5 mm·a−1 were sporadically distributed in valleys or basins. High increasing areas (10.6%) from 9 to 18.27 mm·a−1 were mainly concentrated in mountain peaks and windward slopes of mountain ridges. Moderate increasing areas (62.4%) with slopes between 4.5 and 9.0 mm·a−1 widely covered the rest part of the Qinling Mountains.
Figure 8.
(a) Trend and (b) significant level of the precipitation from 2000 to 2023.
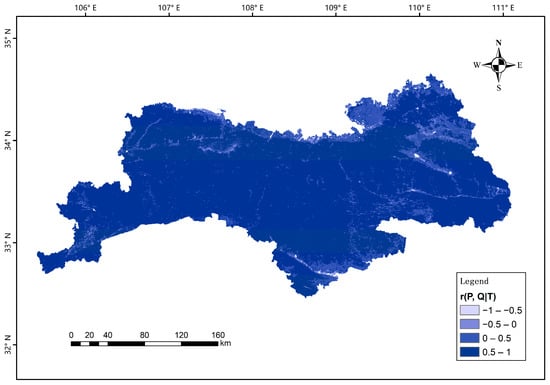
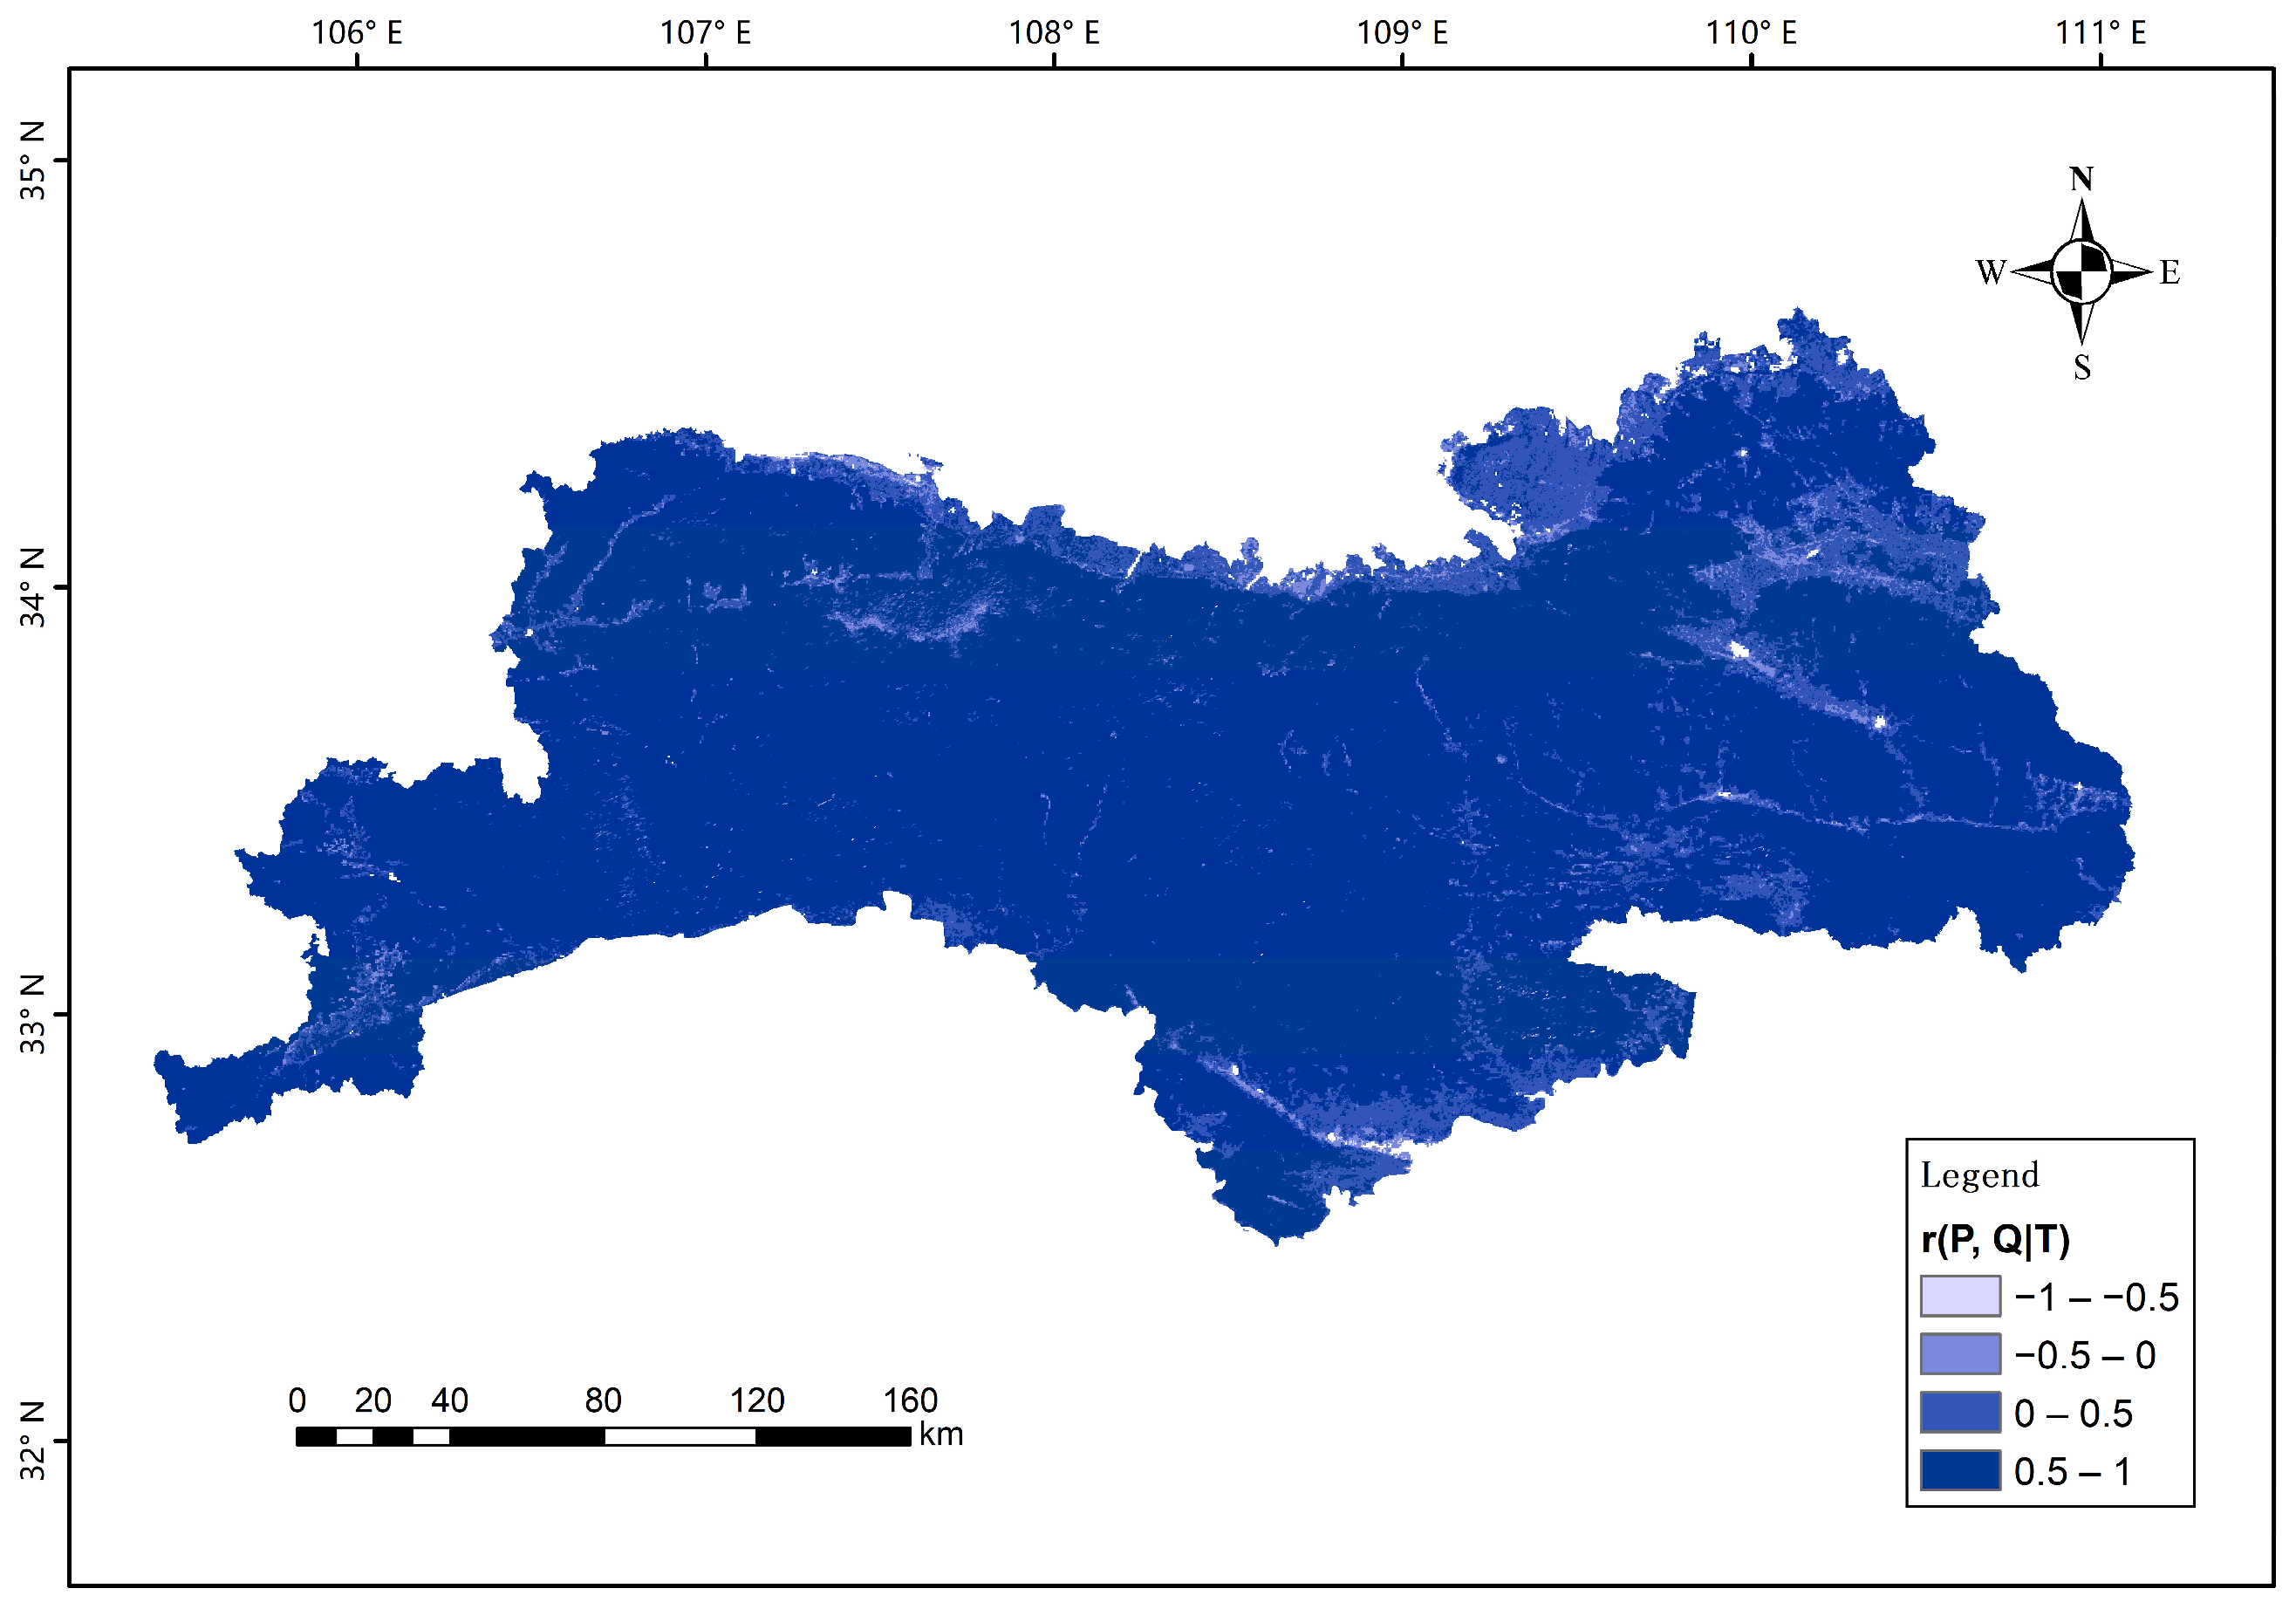
Based on the partial correlation analysis, a highly consistent positive correlation was observed between precipitation changes and vegetation ecological quality in the Qinling region (Figure 9). More than 98% of the regional bias correlation coefficients were positive, indicating that increased precipitation had a generally positive effect on vegetation growth and improved ecological quality. Negative correlation areas were only sporadically distributed in the fringes of the study area, accounting for less than 2%. Significant and moderate significant totally account for 35.4%, with insignificant areas covers 64.6%, aligning with the distribution of trend.
Figure 9.
Partial correlation between precipitation and VEQI from 2000 to 2023, where r(P, Q|T) represents the partial correlation r of precipitation on VEQI, eliminating the influence of temperature.
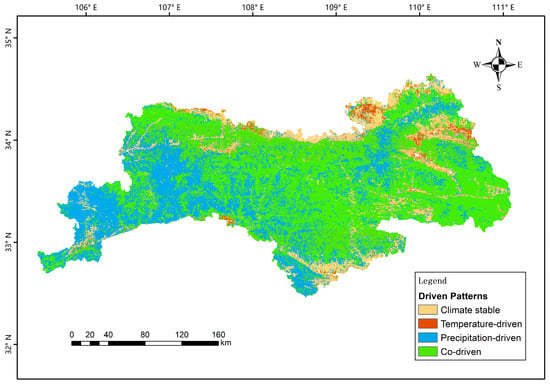
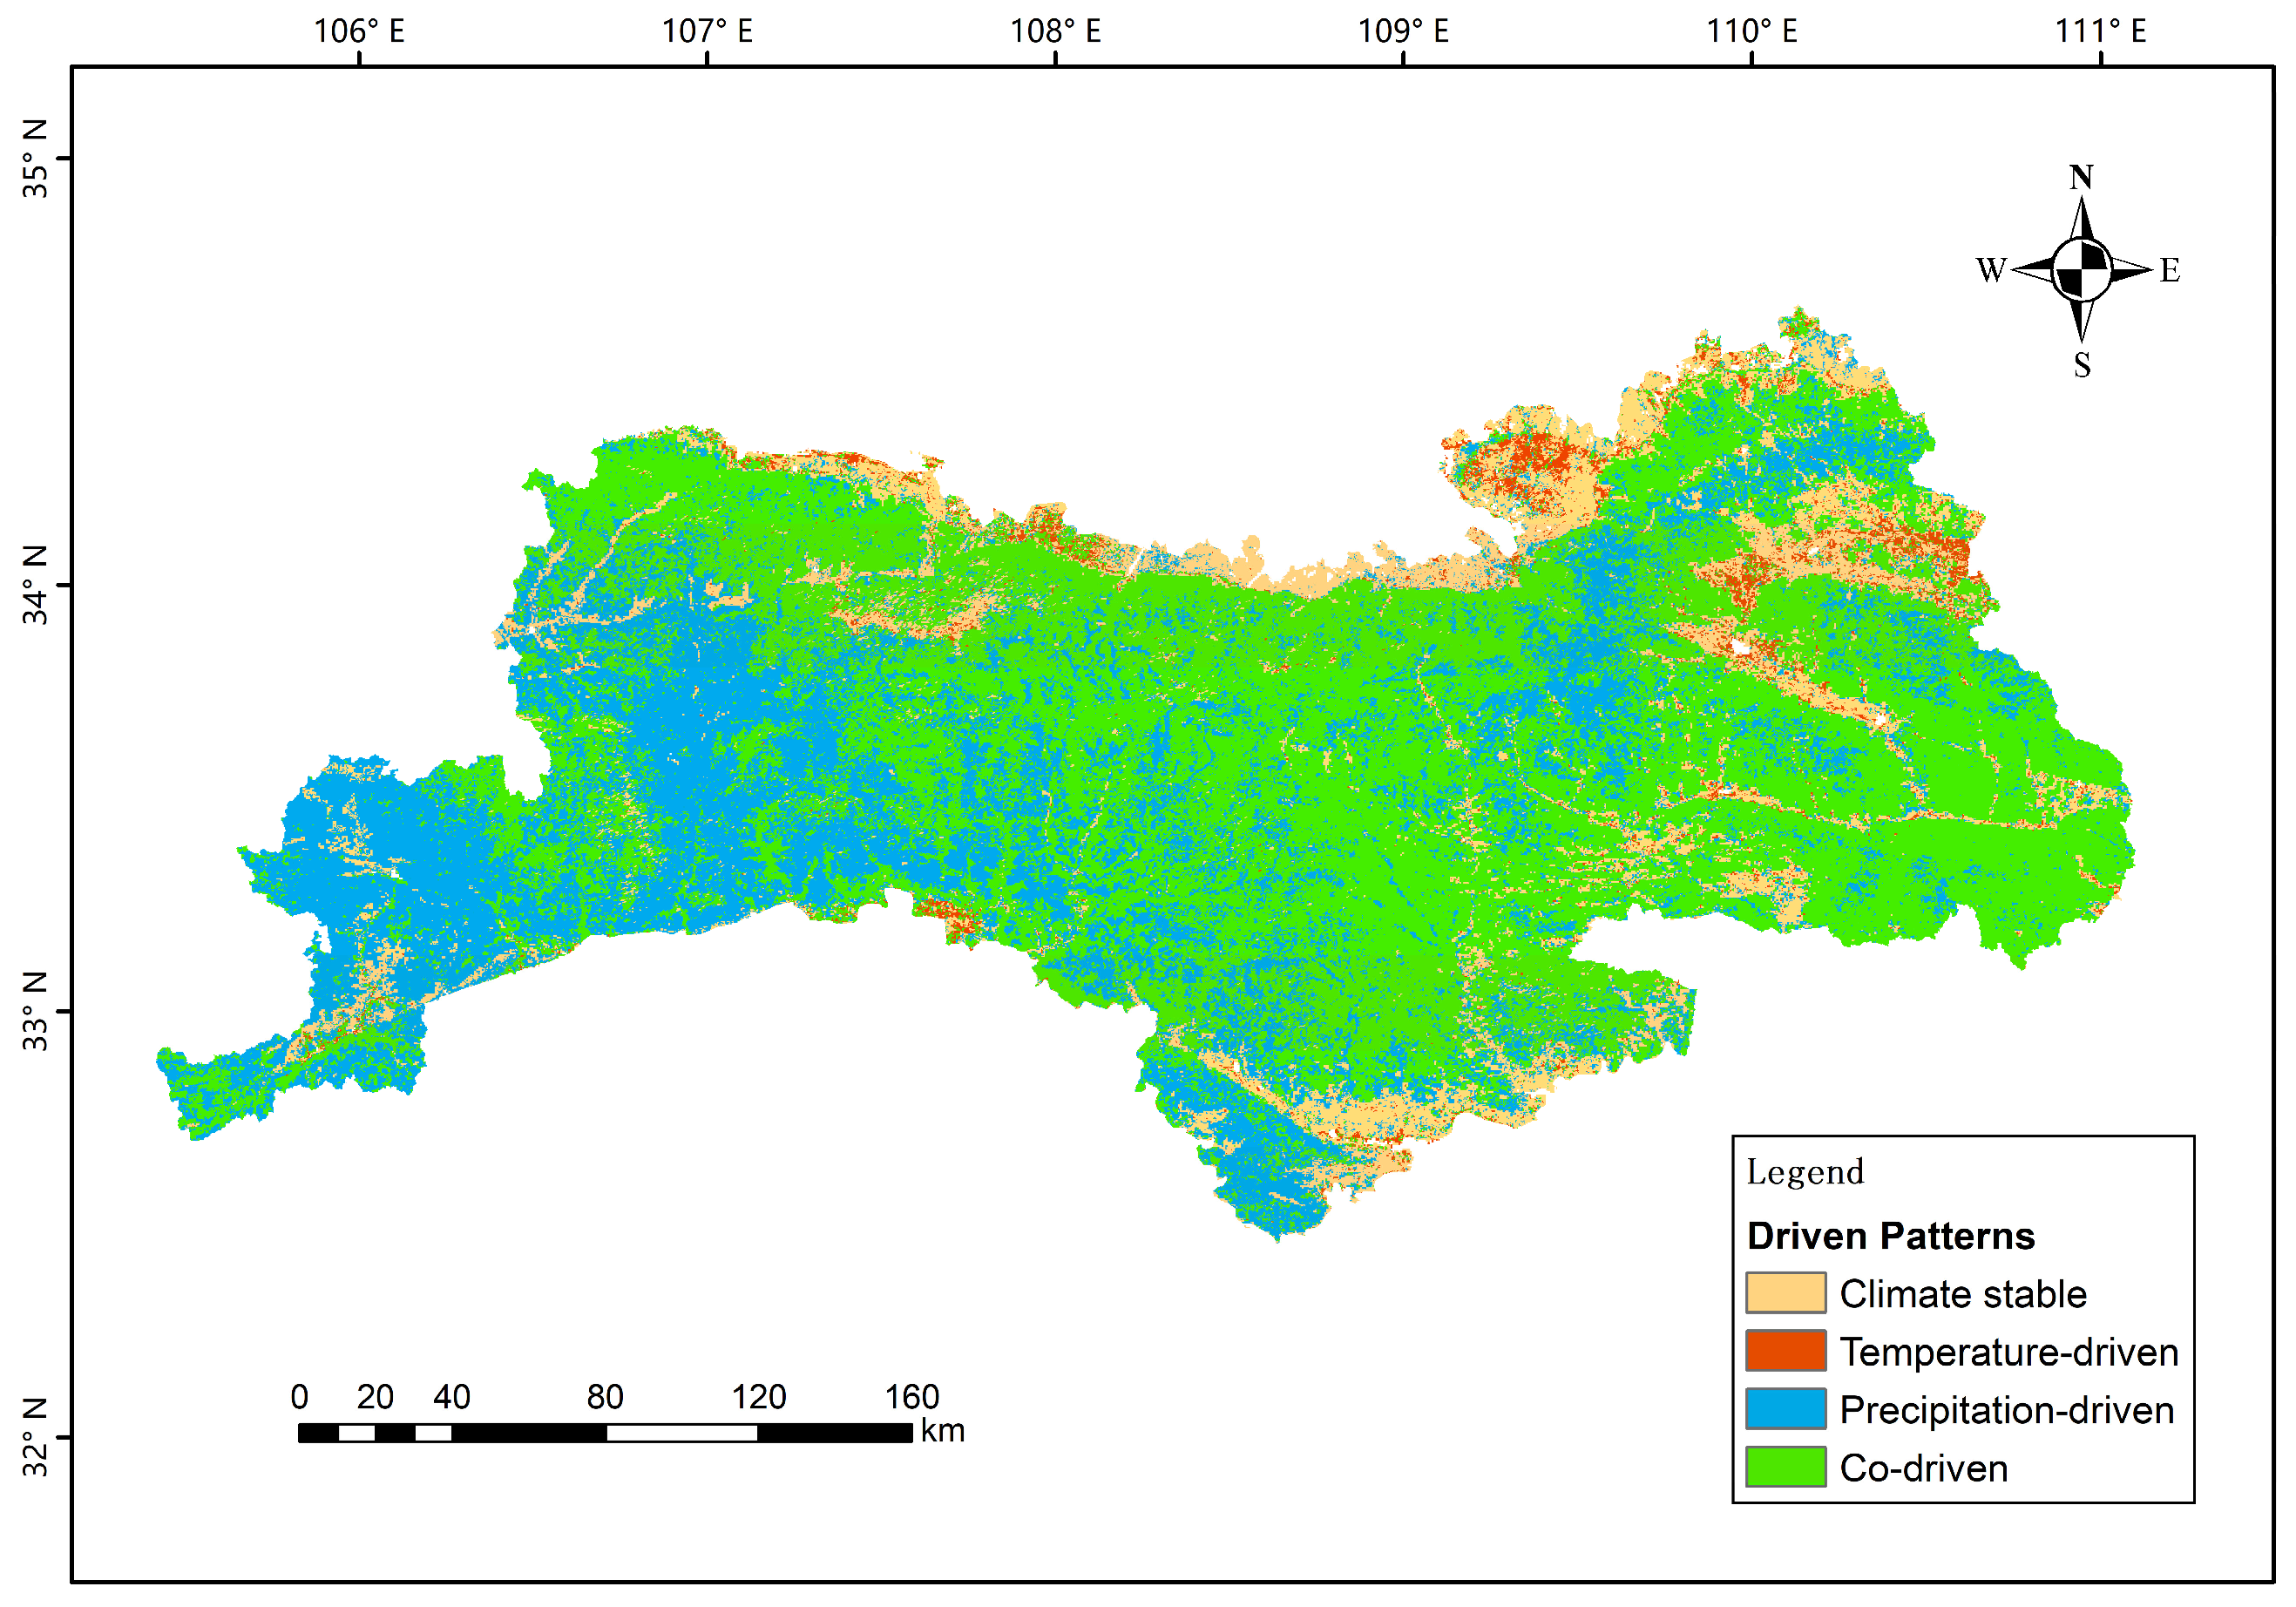
Vegetation is inherently sensitive to climate change. To highlight the role of climatic factors in the subsequent ecological risk zoning and its adjustment, the threshold for the climate-driven patterns is set where the absolute value of the partial correlation coefficient is greater than 0.5, which separates low and moderate correlation. Thus, four climate-driven patterns were categorized in this study to further reveal the climate-driven pattern of vegetation dynamics. If and only if one meteorological factor (temperature or precipitation) is correlated with vegetation ecological quality, the climate-driven pattern is termed temperature-driven or precipitation-driven. If both temperature and precipitation are correlated with vegetation ecological quality, it is termed co-driven; otherwise, it is termed climate-stable (Table 3).
Table 3.
Classification of climate-driven patterns.
The spatial distribution of the four climate-driven patterns was identified (Figure 10). The temperature-driven zones (2.3%) were concentrated in low-elevation river valleys, where vegetation growth is mainly promoted by improved thermal conditions. Precipitation-driven zones (31.2%) dominated high-elevation mountainous areas, where water availability is a key factor limiting the ecological quality of vegetation. The co-driven zones (54.2%) were located in the mid-elevation transition zone, where synergistic effects of temperature and precipitation work together to regulate vegetation dynamics. Finally, climate-stable zones (12.3%) were scattered across the altitudinal gradient, with vegetation changes dominated by non-climatic factors or insensitive to climate change responses. Overall, vegetation ecological quality in most regions is driven by both temperature and precipitation, with precipitation exerting a significantly greater influence than temperature.
Figure 10.
Spatial distribution of climate-driven patterns.
4. Adaptive Planning and Control Measures
4.1. Ecological Risk Zoning
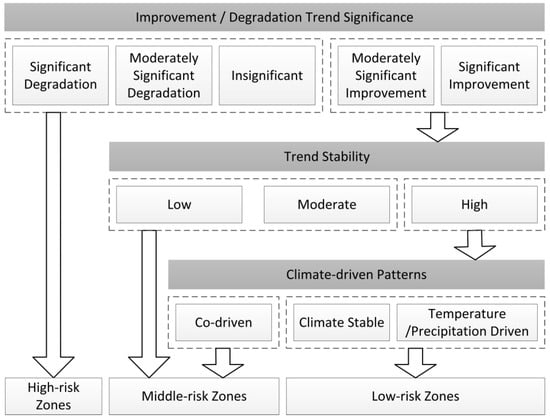
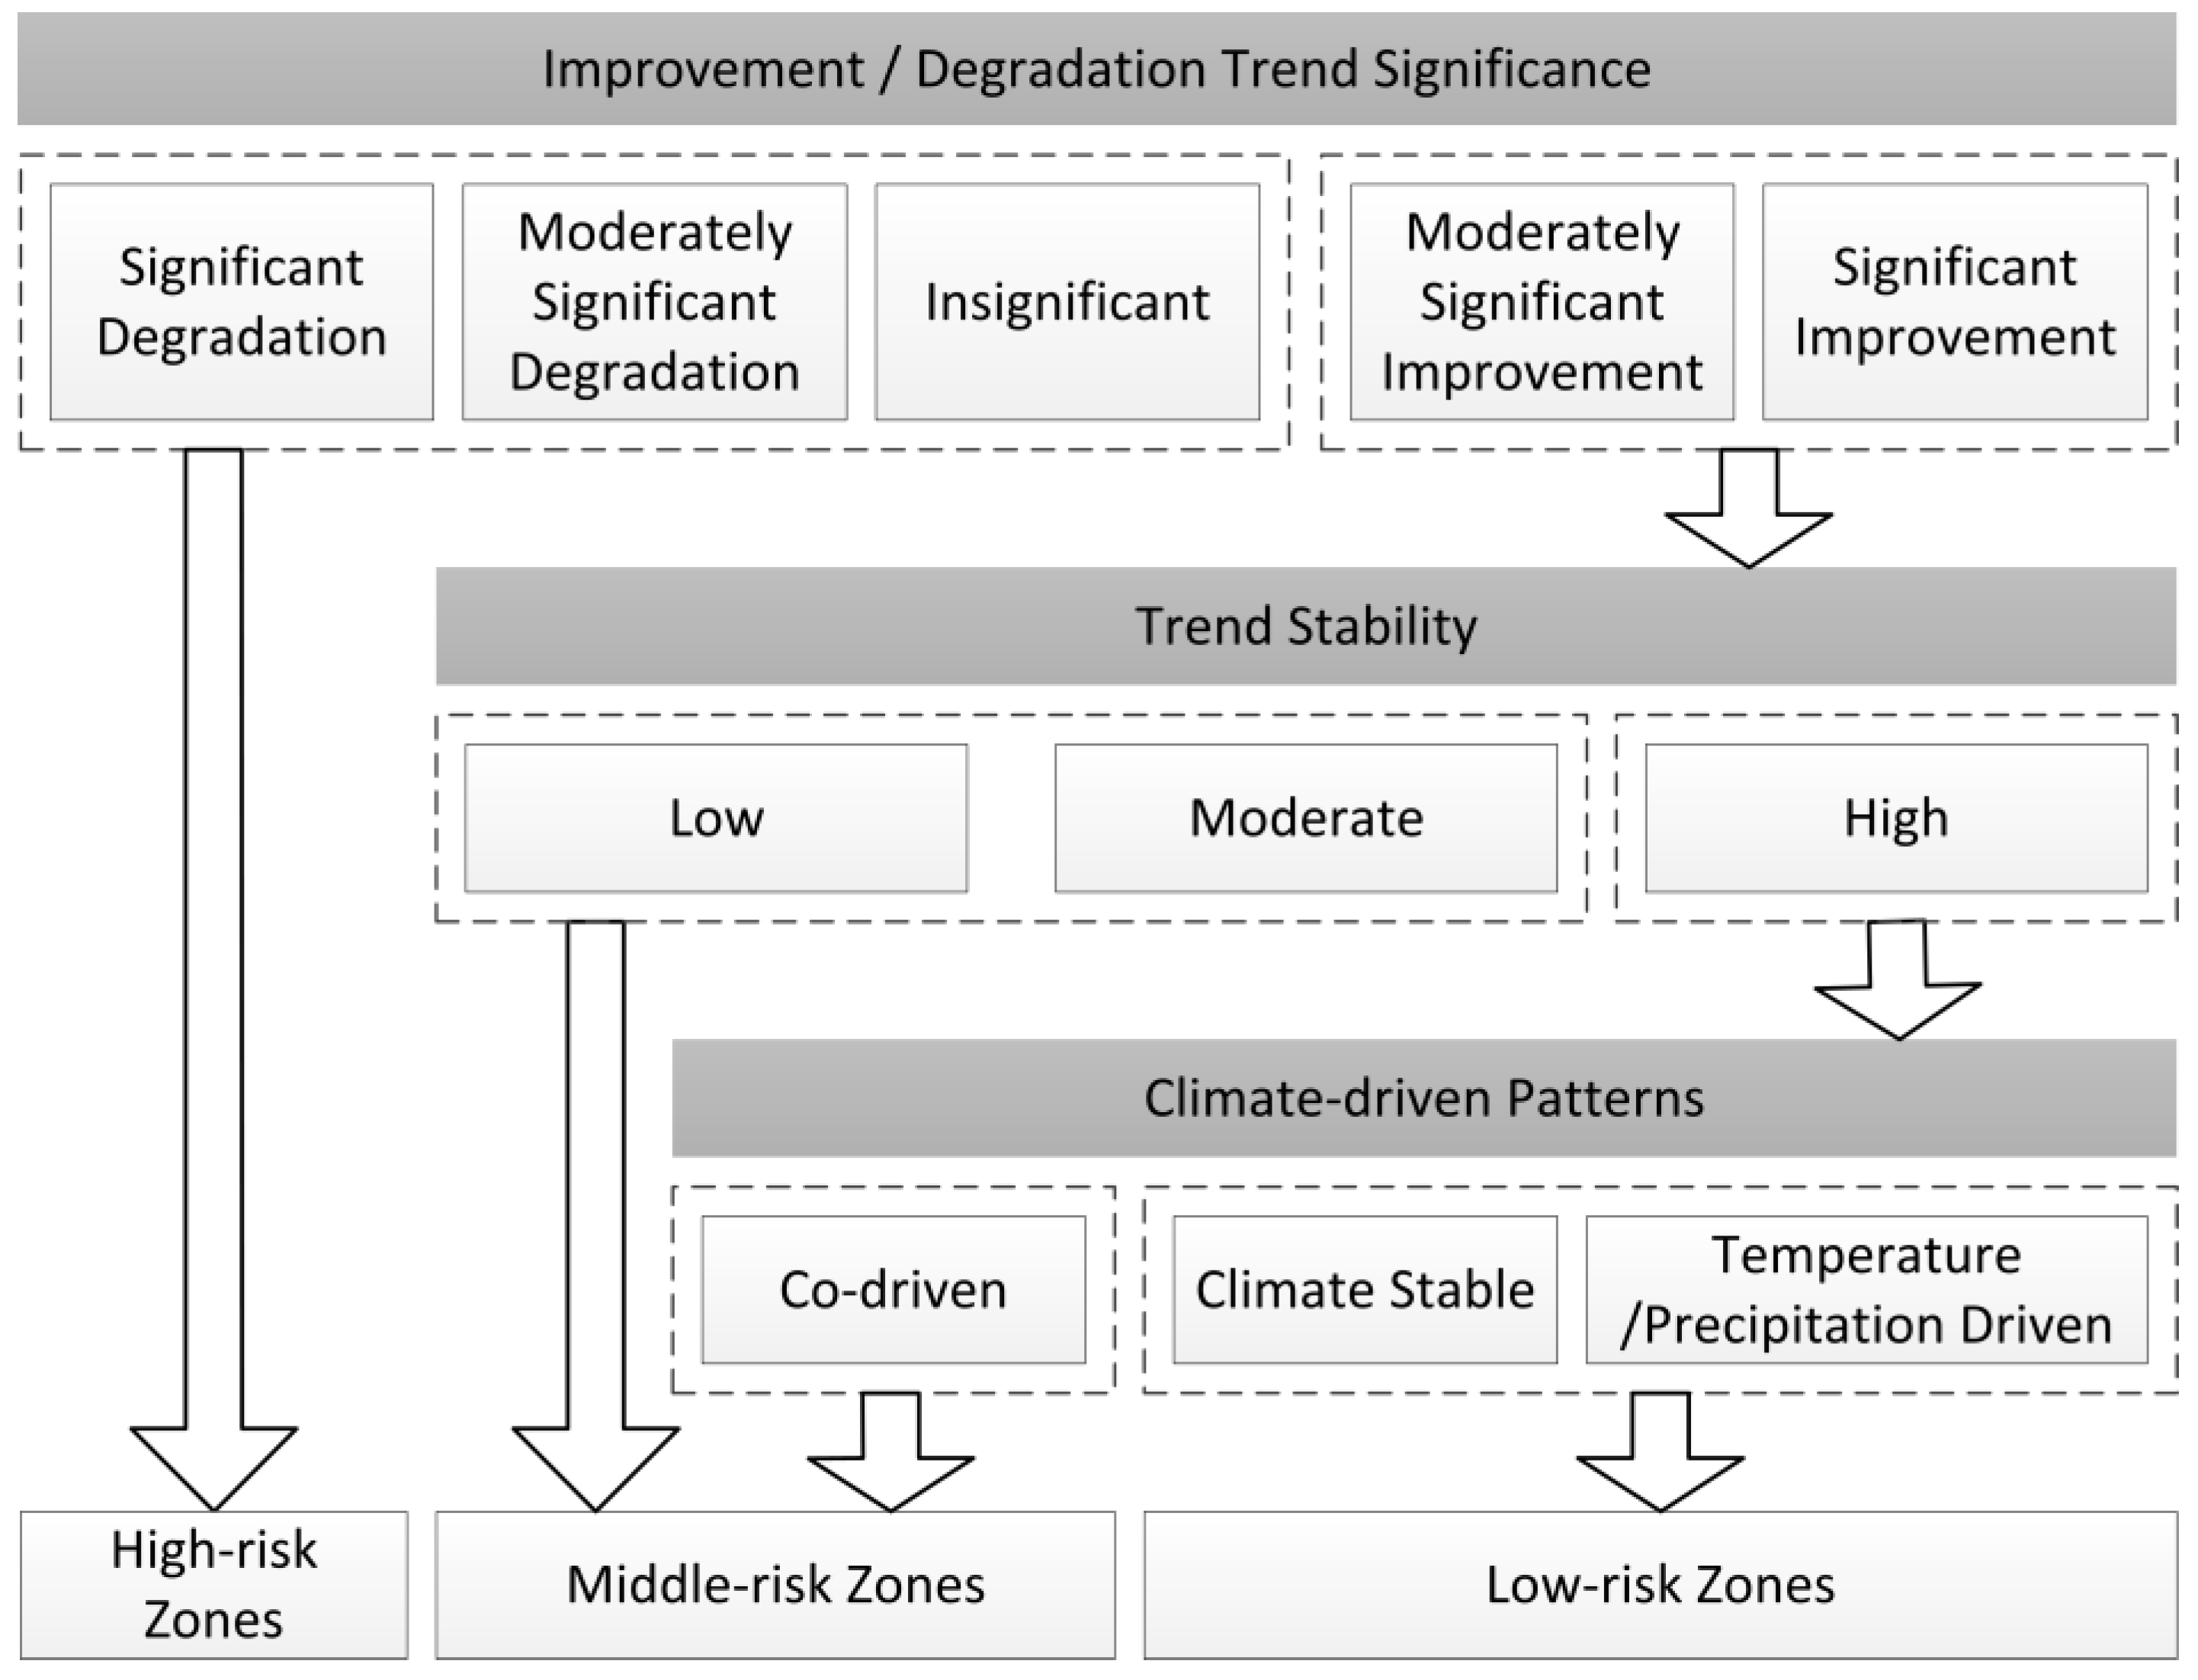
Integrating the trend of vegetation change, ecosystem stability and climate-driven patterns, this paper spatially divided the Qinling Mountains in terms of ecological risk levels. Following a three-step ecological risk zoning process, each of the units were categorized into three levels of risk zones, namely high-risk zones, middle-risk zones and low-risk zones, as shown in Figure 11. First, we draw attention on the trend of improvement or degradation. Degrading areas as well as insignificant areas have high probability to experience other destructive ecological events, and therefore considered high-risk. Second, we take account on trend stability. even in improving areas, the low level of stability still poses a potential risk of degradation, thus classified as medium risk. Last but not least, the climate-driven patterns also have impacts on the ecological risk. In high stability improvement areas, single-factor driven and climate-stable patterns are easier to monitor and control, and therefore categorized as low-risk.
Figure 11.
Ecological risk zoning process.
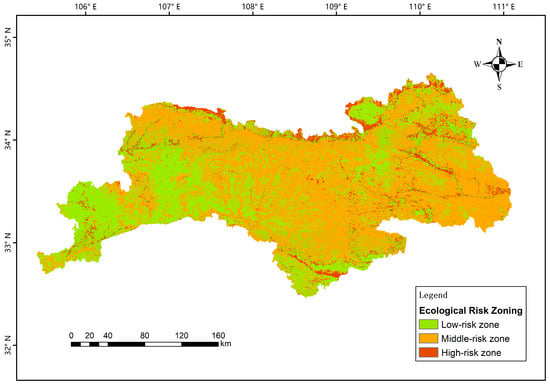
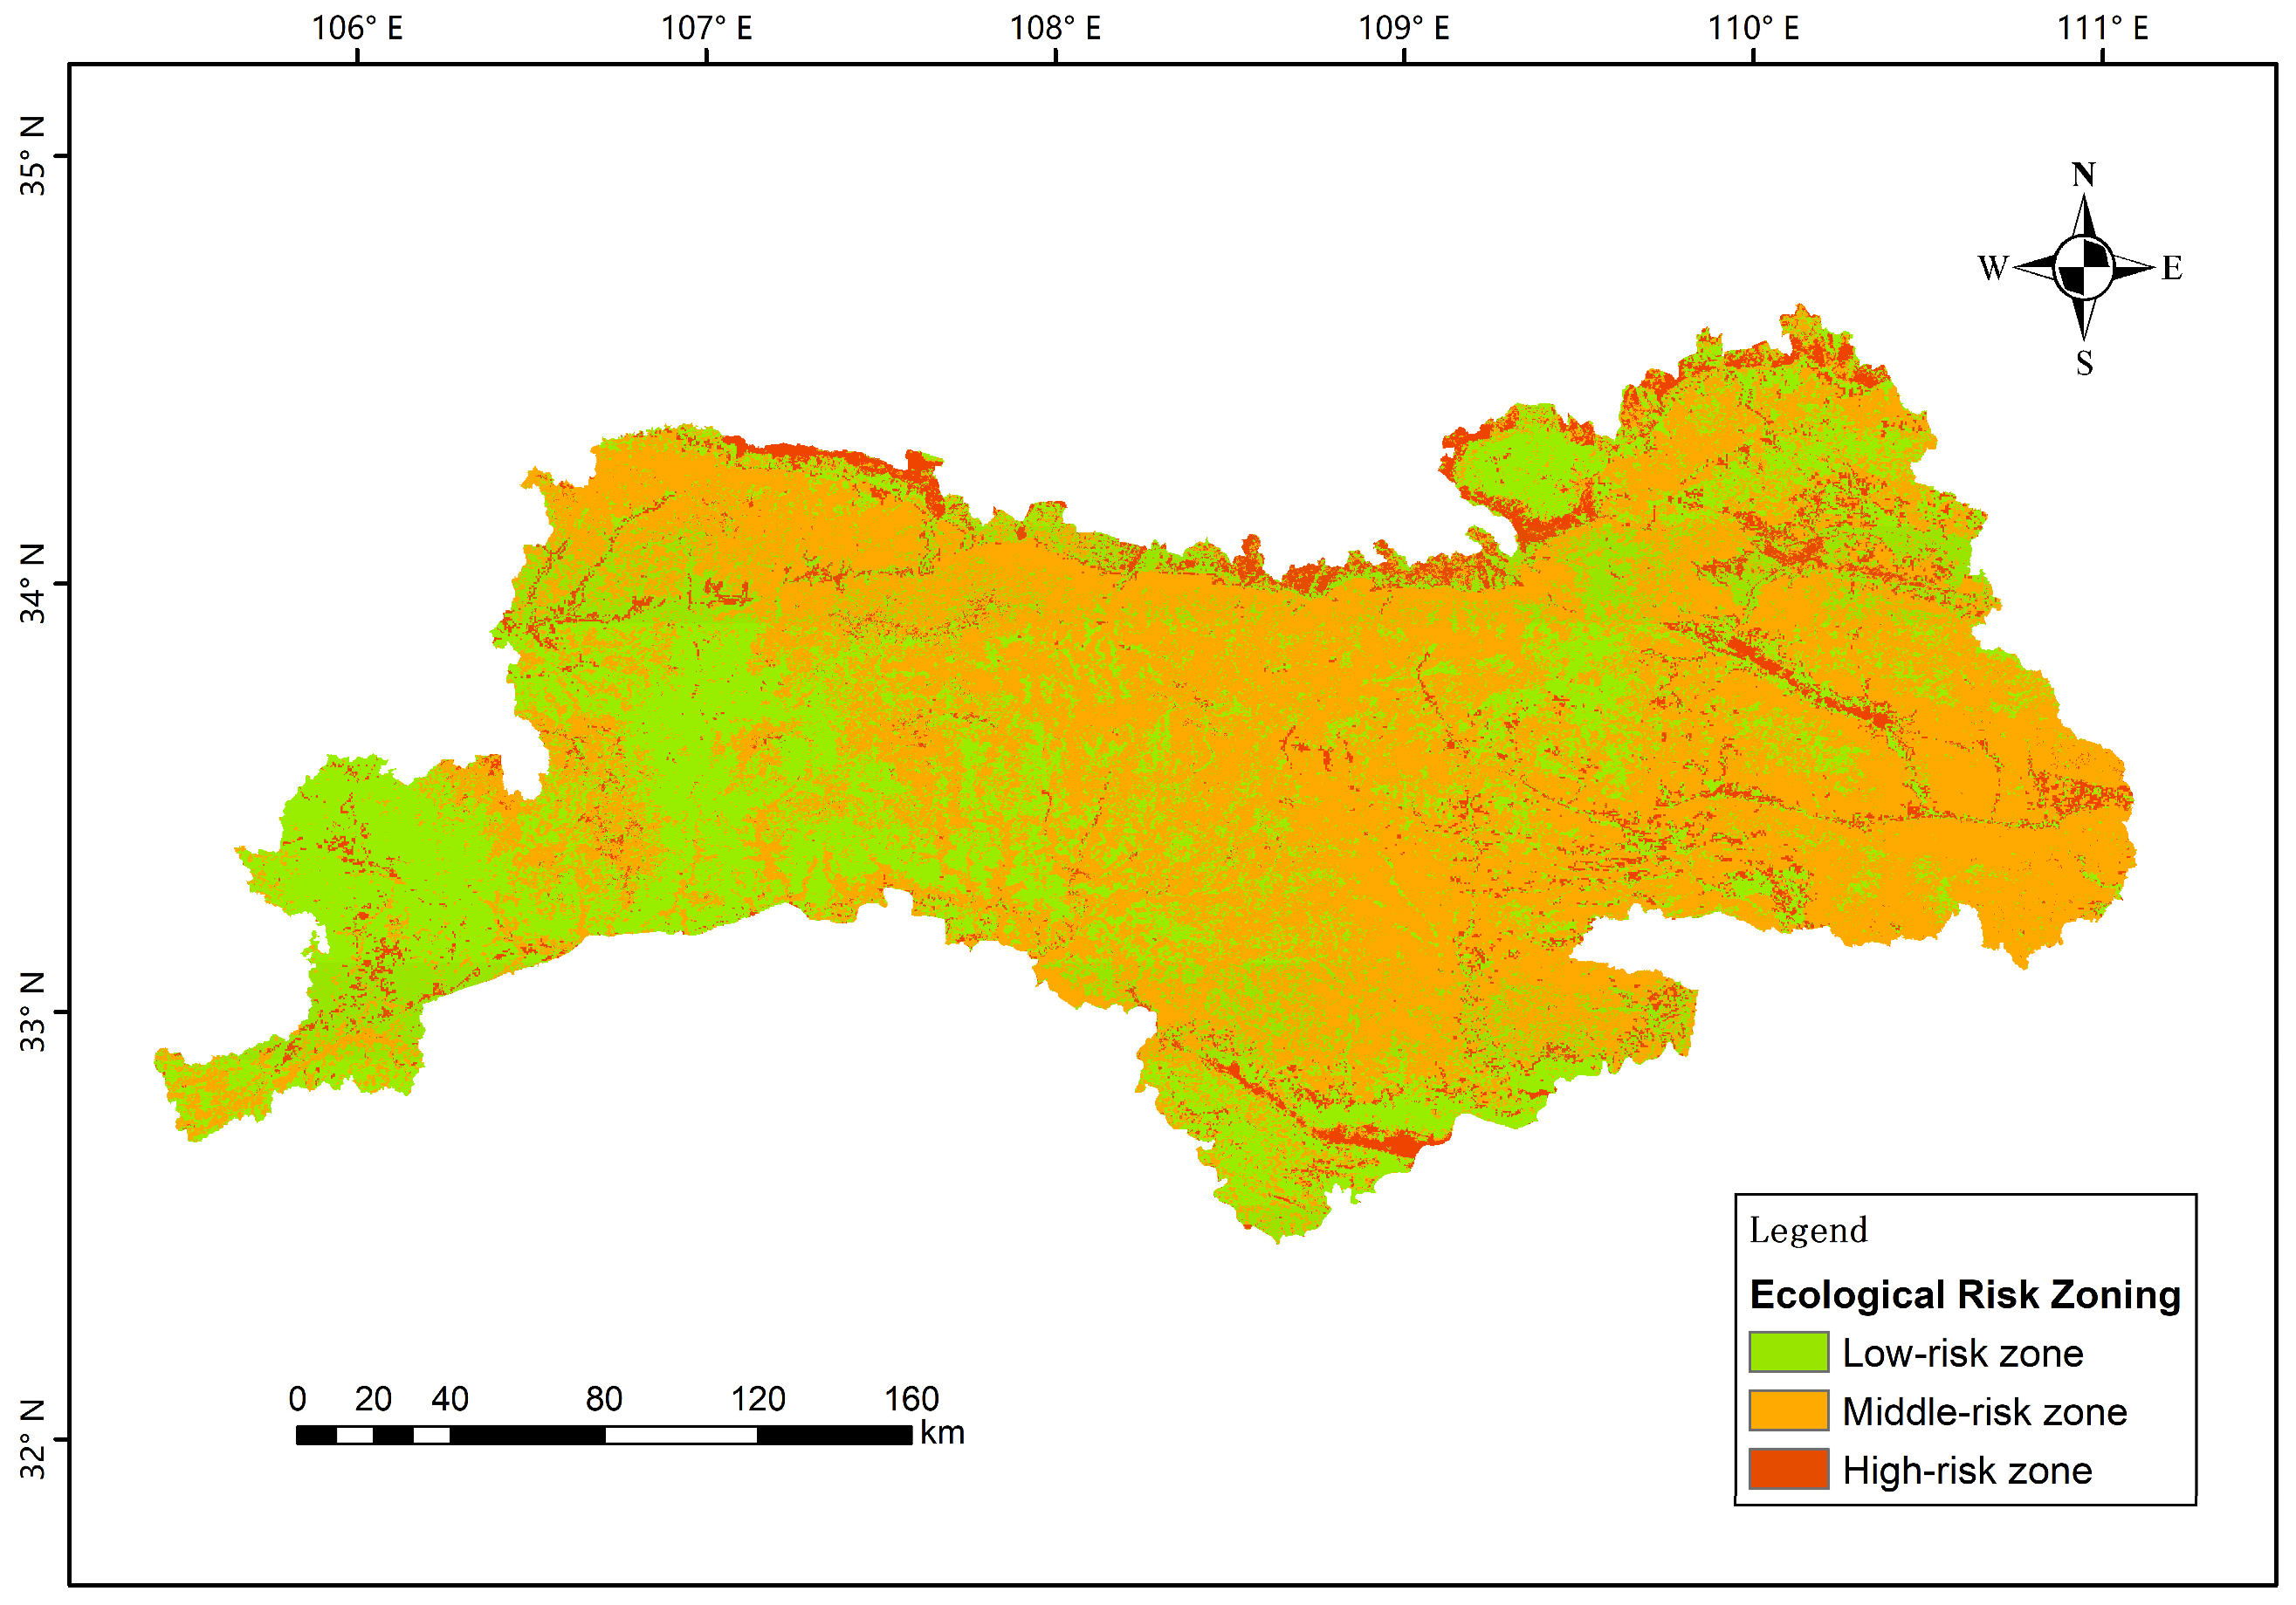
The distribution of three ecological risk zones is shown in Figure 12. Low-risk zones were mainly located in the low-elevation areas in the southwest and south, covering about 36.1%. Middle-risk zones were widely located in the low- and medium-elevation areas and largely covers the Qinling mountain ridge line and the low-elevation areas in the central and east, accounting for 56.9%. High-risk zones were strip-shaped located in the northern edge, especially the urban–rural interface zones, with a proportion of merely 7.0%. Overall, the ecological risk pattern of the Qinling Mountains can be summarized as “mostly middle- and low-risk with sporadically high-risk”.
Figure 12.
Ecological risk zones in the Qinling Mountains.
4.2. Comparison with Existing Zoning Methods
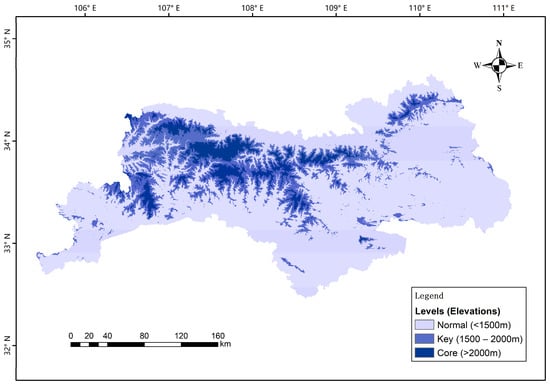
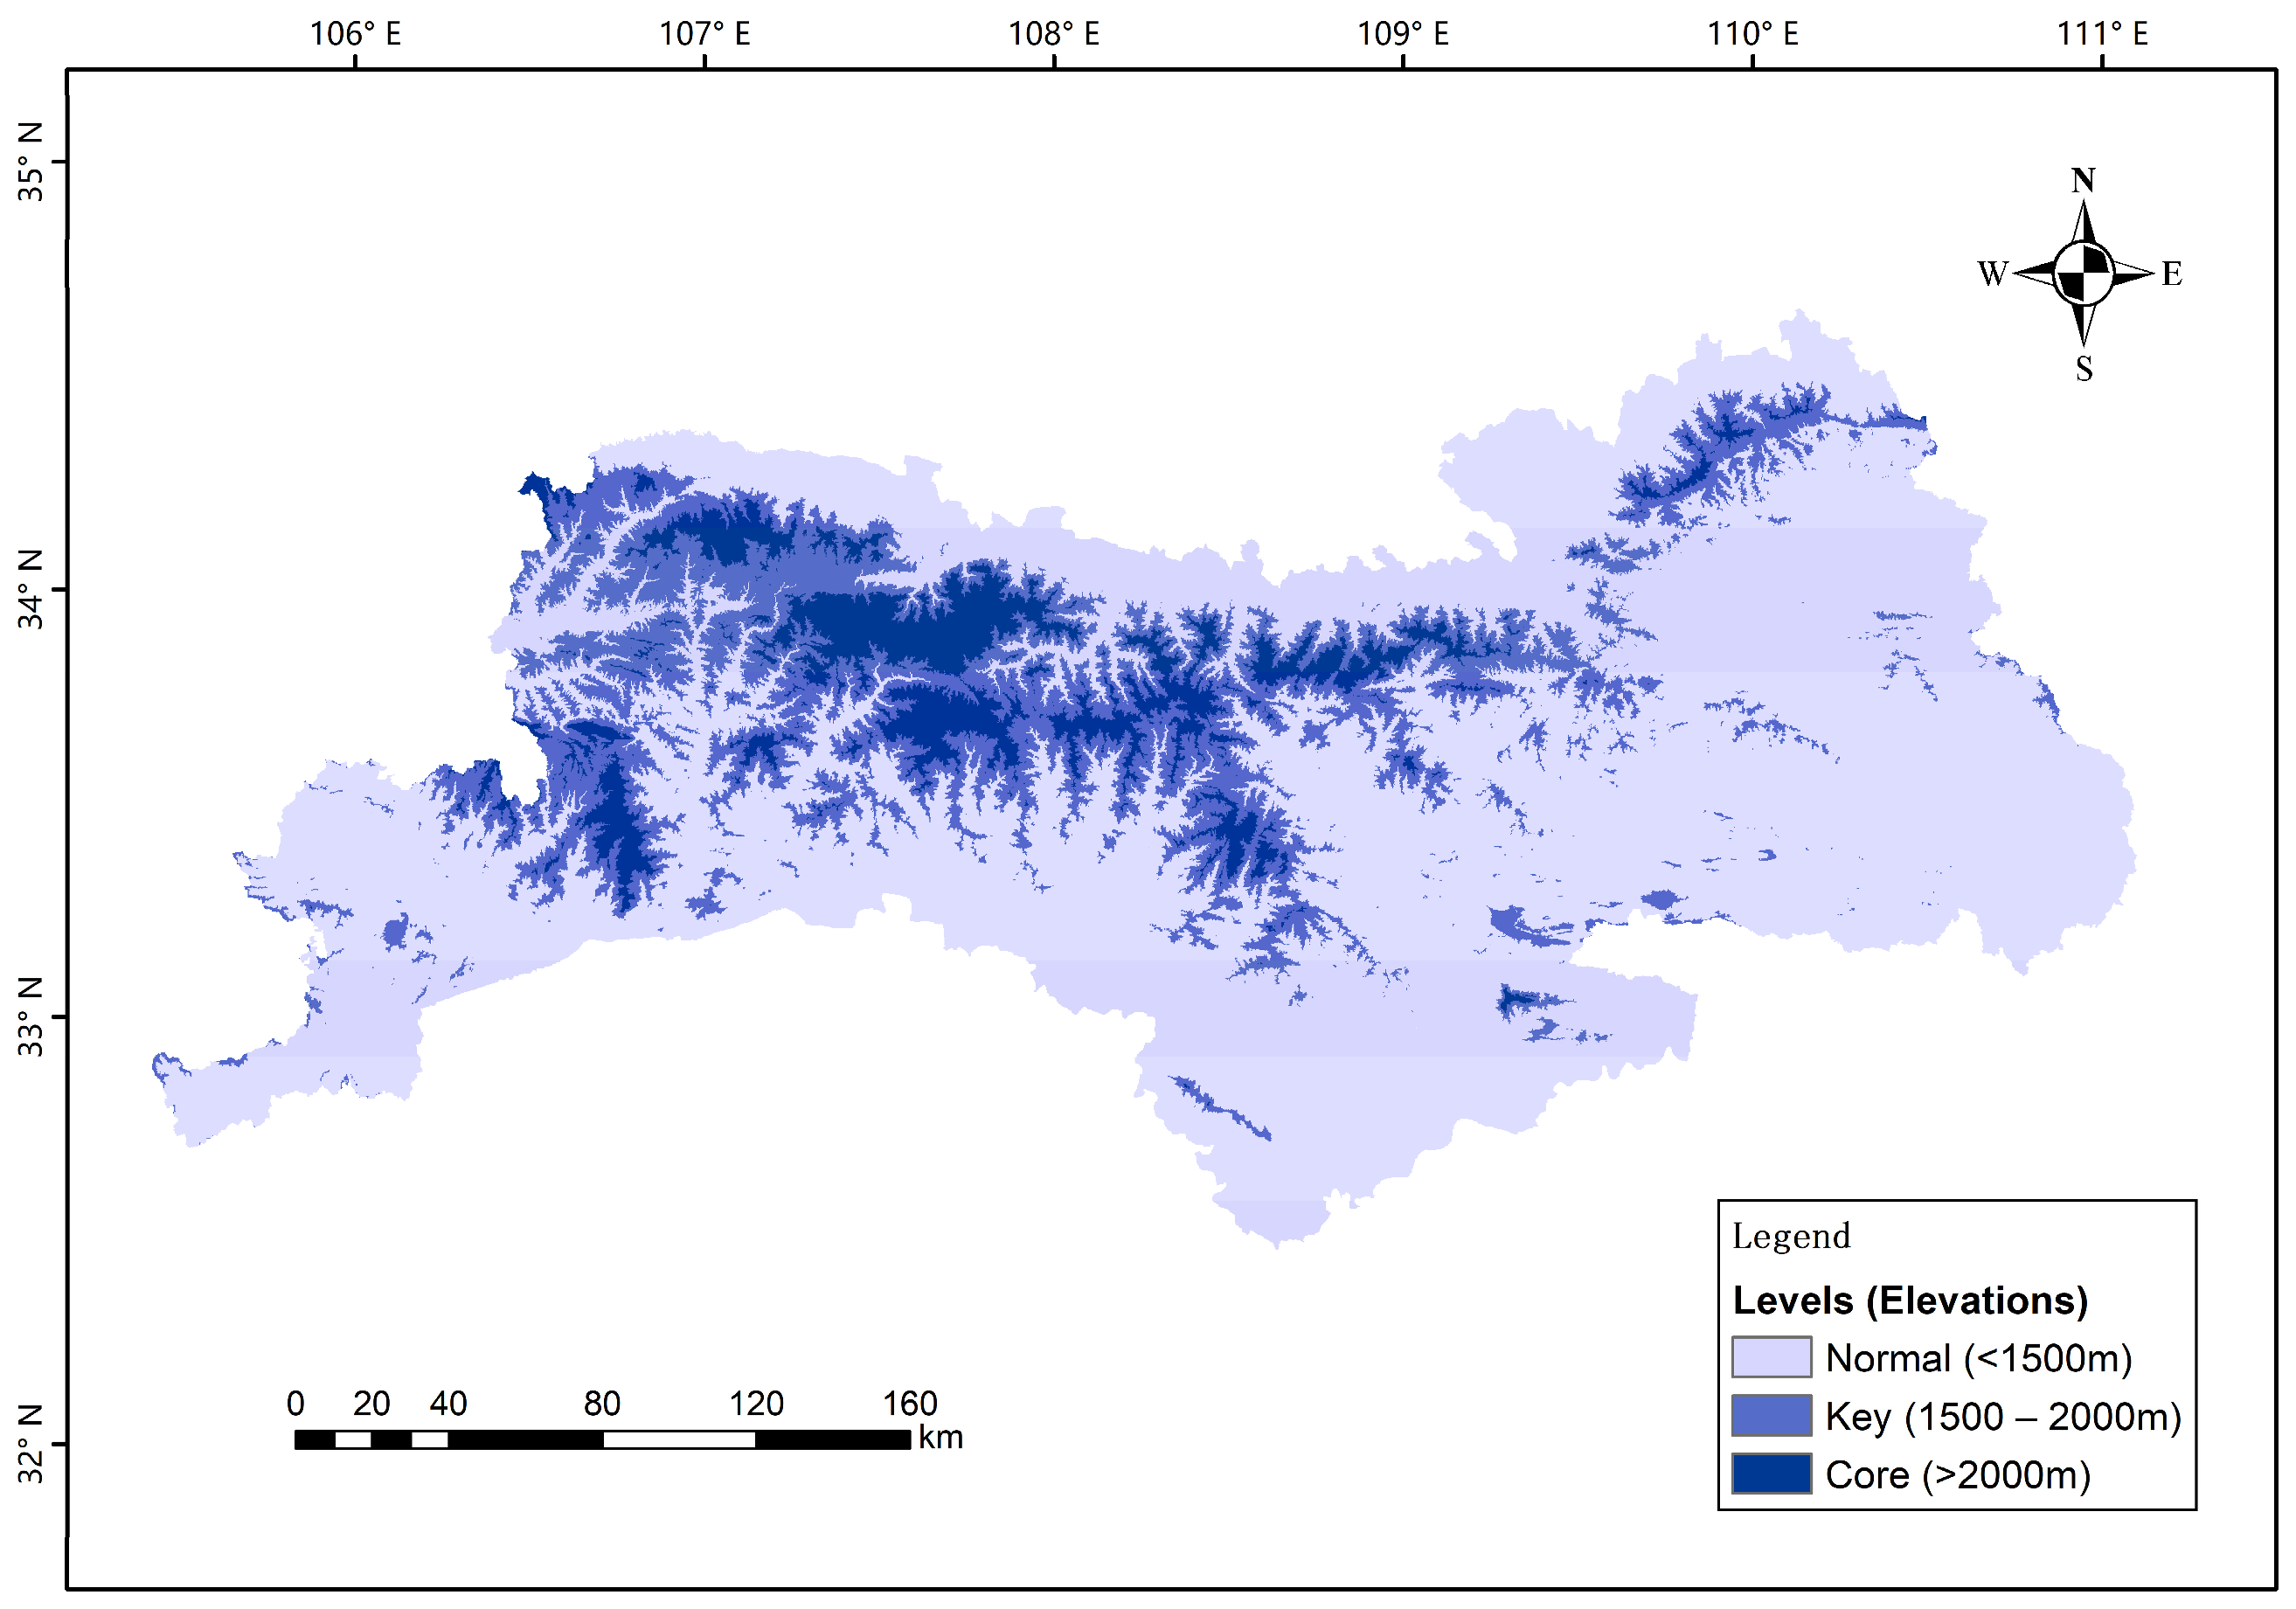
The distinct vertical band spectrum characteristics of the Qinling Mountains make elevation a fundamental basis for existing ecological protection zoning. For example, The Qinling Mountains Ecological Environment Protection Regulations of Shaanxi Province delineate three tiers of ecological conservation zones based on elevation thresholds of 1500 and 2000 m, as illustrated in Figure 13, where core protection zones are above 2000 m, normal protection zones below 1500 m and the rest are key protection zones.
Figure 13.
Zoning by elevation in the Qinling Mountains.
Comparing to Figure 12, there are several differences. First, the risk level is not consistent with the elevation. As is shown in Table 4, the proportions of the three risk zones are roughly similar across different elevation zones; even the high-risk zones are mainly located in low-elevation areas. This indicates that the practice of establishing ecological protection zones based on elevation may, to some extent, overlook medium-to-high risk factors in low-elevation areas. Second, although ecological risk zoning in this paper considered climate-driven as a primary factor, it also objectively reflects the intensity of human activities across different regions. This intensity generally shows a negative correlation with elevation, and therefore explains the variation in ecological risk zoning with respect to elevation. Third, beyond vegetation, ecological factors such as soil structure, biodiversity, and soil and water conservation also characterize ecological quality and exhibit vertical zonation patterns with altitude. However, their responses to climate change are not synchronized, and the patterns of interaction between them may be more complex. Incorporating these factors into ecological risk zoning would be helpful for scientific analysis and decision-making. Last but not least, the purpose of ecological risk zoning is to identify key spatial units for targeted management, thereby enabling precise and effective control measures. Therefore, it is essential to emphasize the scientific rigor and feasibility of assessment indicators.
Table 4.
Proportions of the area in each of the risk zones and elevations.
4.3. Control Measures
4.3.1. Low-Risk Zones: Maintain Natural State and Develop Ecological Service
Low-risk zones have high stability and strong dispersal potential. The core objective is to maintain the natural state and control large-scale anthropogenic development activities. In terms of planning articulation and policy support, it is recommended that the low-risk zone be positioned as an ecological service or ecological buffer area in the Territorial Spatial Planning. Through ecotourism, scientific research and education, eco-projects could expand public participation and enhancing public awareness of ecological conservation, which are essential for the sustainability of ecological conservation. Technologically, an early warning system and continuous data collection tools (e.g., remote sensing technology and meteorological prediction models) could also be set up to dynamically monitor the climate changes and ecological responses, so as to support potential risk identification, rapid response and decision-making.
4.3.2. Middle-Risk Zones: Restoring and Upgrading Ecological Resilience
Middle-risk zones have potential for ecological restoration and ecosystem enhancement. The core objective is to increase the resilience and recovery of ecosystems. Considering the transformation of mixed forests for single species or less resilient forest stands, adjusting forest structure would be helpful for the enhancement of diversity and stability, and therefore strengthen the ability to withstand climate change. At the level of Territorial Spatial Planning, such middle-risk areas should be mandatorily included in the ecological protection redline, where a white list can be used for human activities.
4.3.3. High-Risk Zones: Focusing on Governance to Curb the Spread of Degradation
High-risk zones have high ecological risk, species richness and highly fragile ecosystems. The core objective is to strictly control human intervention and strengthen ecological barriers. From the perspective of Territorial Spatial Planning, high-risk areas should be labeled as key ecological and environmental governance zones, with clear governance objectives and land-use attributes. Native ecological restoration and strictly prohibition on all unnecessary man-made activities should be strongly implemented. Technologically, a detailed emergency monitoring, managing and responding system should be developed for extreme weather events such as extreme droughts, high-temperature heatwaves and torrential rains.
In summary, the purpose of the control measures is to construct a multi-level, differentiated and precise ecological protection and adaptive management system. According to the principle of “Multi-planning Integration” in the Territorial Spatial Planning, this paper combines the long-term, large-scale driving responses of ecosystems to climate change and a fine-grained operational framework for the dynamic adjustment of ecological redlines.
5. Discussion
This study constructed a vegetation ecological quality index model, combining common vegetation indices like NDVI, VFC and NPP, which focuses on the diversity of vegetations. This model does not require complex data processing or calculations; it can assess vegetation ecological quality using only satellite imagery. Its simplicity and cross-scale comparability make it useful for government staffs from relevant departments such as forestry and meteorology to monitor and record, though it relies on closely related vegetation signals and not include factors such as soil, water, biodiversity, and human activities that influence vegetation. Moreover, the rescaling process among various datasets might also introduce error in the calculation on VEQI, and thus the validity of VEQI needs to be tested in different computational environments. Overall, the VEQI model still requires further development and validation.
Based on the results of trend and significance analysis, vegetation ecological quality is showing an upward trend across most areas, except for certain valleys and regions near urban peripheries. This distribution may be affected by local environmental heterogeneity or gradients of anthropogenic disturbance. Degradation areas were limited and spatially scattered and were mostly found in localized areas with high intensity of human activities or fragile ecology, such as the edge of river valleys, urban–rural junction areas and some sloping arable land periphery. In addition to dominant influence of climatic factors, the ecological conservation and restoration projects—which have garnered increasing attention in recent years—have also played a synergistic role in the consistent improvement in vegetation. However, the 96.2% improving trend with the 86.1% significant improvement still have a risk of being overstated. Spatial autocorrelation analysis as well as residual analysis may better at validating the results [38].
From the results of the correlation analysis, the two main climate factors—temperature and precipitation—have varied effects on vegetation. This is consistent with previous studies [7,8,9,10,11,12,13,14,15,16,17]. As for the temperature, the “heat-driven” growth pattern remains at lower elevations, while at higher elevations, further warming may exacerbate the water stress and reduce evapotranspiration, which may have an inhibitory effect on the growth of vegetation. As for the precipitation, despite the scattered heterogeneous response, it was still the key positive driver regulating the spatial and temporal changes in VEQI, and that the positive effect of its wetting trend was widespread and dominant. However, the correlation results may be overestimated as there are no separations between climate-driven and alternative mechanisms. For instance, the increase in NPP might also derive from CO2 fertilization rather than climate alone, which sequentially lead to the increase in VEQI. Additionally, due to the use of a fixed time series and annual averaged process, it is easy to overlook certain mutation sites in long-range order analysis. Considering the abrupt effects of the climate change, it is essential to incorporate methods for capturing such phenomenon—such as detrended fluctuation analysis—into future research.
Combining the two main climate factors, we have got four climate-driven patterns. In high-elevation mountainous areas, temperature was mainly negatively correlated, while precipitation was strongly positively correlated and widely covered; in middle- and low-elevation areas, the positive correlation of precipitation was much stronger than that of temperature, while there was a lagged response of precipitation; and in localized dry and hot valleys, the positive correlation of temperature was prominent and that of precipitation was weaker. The spatial variation in the driving force of climatic factors on the ecological quality of vegetation highlights the necessity of zonal management.
From the perspective of Territorial Spatial Planning, the ecological risk zoning method proposed in this paper takes account of the dynamic nature of climate-driven vegetation trends. Through annual monitoring and evaluation, spatial changes in different risk level zones could enhance the efficiency and precision of measures like plant species optimization, ecological corridor development, and disaster prevention and mitigation. Middle-risk zones serve as buffers against climate change, and the proportion of them that evolve into high-risk or low-risk zones can be a clear indicator for ecological conservation efforts. In contrast, low-risk areas possess greater carrying capacity. Beyond ecological restoration and functional enhancement, they can also provide the public with appropriate social and cultural services such as scientific research, education, and tourism, thereby increasing public participation and awareness.
Future research could be deepened as follows. (1) Constructing a multifactor integrated framework. Integrate multiple data such as land use, socio-economics, pollution, etc., specifically, the systematic conservation planning (SCP) theory is promising for obtaining a more comprehensive conclusion between climate–ecological studies and planning practice [39]. (2) Refining alternative approaches and methods. For example, the LPJ-GUESS model [40] and VIKOR-TOPSIS model [41] can be adopted to refine the framework proposed in this paper, thus improving validity and reliability. (3) Adaptive planning based on future scenario modeling. For instance, under the IPCC framework of shared socio-economic pathways, a framework for participatory scenario planning (PSP) could be proposed to create plausible development pathways [42,43]. (4) Strengthening multi-scale and cross-regional comparative studies. The micro-mechanisms of ecological processes are explored at finer scales (e.g., watersheds, slopes) and compared with other mountain ecosystems to reveal the universality and specificity of the climate–ecology-based planning of the Qinling Mountains.
6. Conclusions
Based on the long time series remote sensing data from 2000 to 2023, this study systematically reveals the spatial and temporal evolution of vegetation ecological quality in the Qinling Mountains under the background of climate change by comprehensively applying the Theil-Sen trend analysis, the Mann–Kendall test, the Hurst index, and the partial correlation analysis method.
The results showed that overall vegetation ecological quality in the Qinling Mountains showed a significant improvement trend and the ecosystem had a high degree of stability. Meanwhile, temperature and precipitation generally increased and were positively correlated with vegetation growth in most of the region, but there was significant spatial heterogeneity. These findings are consistent with previous studies. According to the results, four types of climate-driven pattern were extracted and a three-level ecological risk zoning method as well as corresponding control measures were proposed.
Still, there are several shortcomings: First, the VEQI model used in this study focusing on the vegetation itself, without other ecological factors such as soil or hydrological processes, or biodiversity, which may weaken the reliability. Second, the abrupt effects of climate on vegetation have not been fully explored and implemented on the risk zoning process. Third, apart from the temperature and precipitation, there are other climate-related factors. Future research could be deepened by integrating other ecological factors, adopting ecosystem process models and future scenario modeling methods, and operating multi-scale and cross-regional comparative studies.
Author Contributions
Conceptualization, Y.X. and Z.C.; methodology, Y.X., Z.C. and L.J.; software, L.J. and J.C.; validation, Y.X. and L.J.; formal analysis, Y.X.; investigation, Y.D.; resources, Y.D.; data curation, Z.C.; writing—original draft preparation, Z.C.; writing—review and editing, Z.C., Z.H., J.C., B.Z. and X.W.; visualization, Z.H., J.C. and X.W.; supervision, Y.X. and B.Z.; project administration, Y.X.; funding acquisition, Y.X., B.Z. and X.W. All authors have read and agreed to the published version of the manuscript.
Funding
This research was funded by the National Key Research and Development Program of China, grant number 2024YFE0105300; the Shaanxi Provincial Science and Technology Innovation Team, grant number 2024RS-CXTD-14; and the Shaanxi Province Key Research and Development Plan Project, grant number 2022GY-330.
Data Availability Statement
The data presented in this study are available on request from the corresponding author due to privacy restrictions of the geographical data.
Acknowledgments
The authors acknowledge the use of the following software tools in this study: ArcGIS v10.7 (https://www.arcgis.com), Python v3.12 (https://www.python.org/).
Conflicts of Interest
The authors declare no conflicts of interest.
Abbreviations
The following abbreviations are used in this manuscript:
| NDVI | Normalized Differentiation Vegetation Index |
| VFC | Vegetation Fraction Cover |
| NPP | Net Primary Productivity |
| VEQI | Vegetation Ecological Quality Index |
References
- Psistaki, K.; Tsantopoulos, G.; Paschalidou, A.K. An overview of the role of forests in climate change mitigation. Sustainability 2024, 16, 6089. [Google Scholar] [CrossRef] [Scilit]
- Li, S.; Wang, C.; Yan, J.; Liu, X. Variability of the event-based extreme precipitation in the south and north Qinling Mountains. Acta Geogr. Sin. 2020, 75, 989–1007. (In Chinese) [Google Scholar]
- Li, S.; Zhang, Y.; Wang, C.; Wang, T.; Yan, J. Coupling effects of climate change and ecological restoration on vegetation dynamics in the Qinling-Huaihe region. Prog. Geogr. 2021, 40, 1026–1036. (In Chinese) [Google Scholar] [CrossRef] [Scilit]
- Meng, Q.; Gao, X.; Bai, H.; Zhang, Y.; Wang, H. Temporal and spatial variations and trends of extreme precipitation in Qinling Mountains during the period 1960-2015. Res. Soil Water Conserv. 2019, 26, 171–178+183. (In Chinese) [Google Scholar]
- Ji, Y.; Zhou, G.; Wang, S.; Wang, L.; Zhou, M. Evolution characteristics and its driving forces analysis of vegetation ecological quality in Qinling Mountains region from 2000 to 2019. Chin. J. Plant Ecol. 2021, 45, 617–625. (In Chinese) [Google Scholar] [CrossRef] [Scilit]
- Cao, Y.; Qian, Y.; Sun, Y.; Qian, S.; Zhang, Y.; Yan, H. Spatial-temporal variations of forest vegetation and climatic driving force analysis in southwest China based on MODIS NDVI and climate data. Ecol. Environ. Sci. 2020, 29, 857–865. (In Chinese) [Google Scholar]
- Mehmood, K.; Anees, S.A.; Muhammad, S.; Albasher, G.; Shahzad, F.; Hussain, K.; Liu, Q.; Ayub, R.; Khan, W.R. Spatial and temporal vegetation dynamics from 2000 to 2023 in the Western Himalayan regions. Stoch. Environ. Res. Risk Assess. 2025, 39, 2309–2330. [Google Scholar] [CrossRef] [Scilit]
- Zhang, J.; Liu, Y.; Labat, D.; Zhang, J.; Xie, Z.; Guo, J. Topographic-mediated climate-NPP relationships in subtropical mountain heterogeneity units. Sci. Rep. 2025, 15, e27541. [Google Scholar] [CrossRef] [Scilit]
- Zeng, X.; Berdugo, M.; Saez-Sandino, T.; Tao, D.; Ren, T.; Zhou, G.; Liu, Y.; Terrer, C.; Reich, P.B.; Delgado-Baquerizo, M. Temperature thresholds induce abrupt shifts in biodiversity and ecosystem services in montane ecosystems worldwide. Proc. Natl. Acad. Sci. USA 2025, 122, e2413981122. [Google Scholar] [CrossRef] [Scilit] [PubMed]
- Jin, L.; Li, X.; Qu, J.; Yang, X. Temporal and spatial variation characteristics of NDVI and climatic factors in Qinling Mountains and response of NDVI to climate. J. Gansu Sci. 2022, 34, 65–72. (In Chinese) [Google Scholar]
- Wang, B.; Xu, G.; Li, P.; Li, Z.; Zhang, Y.; Cheng, Y.; Jia, L.; Zhang, J. Vegetation dynamics and their relationships with climatic factors in the Qinling Mountains of China. Ecol. Indic. 2020, 108, e105719. [Google Scholar] [CrossRef] [Scilit]
- Qi, G.; Bai, H.; Zhao, T.; Meng, Q.; Zhang, S. Sensitivity and areal differentiation of vegetation responses to hydrothermal dynamics on the northern and southern slopes of the Qinling Mountains in Shaanxi province. J. Geogr. Sci. 2021, 31, 785–801. [Google Scholar] [CrossRef] [Scilit]
- Wang, S.; Gao, M.; Li, Z.; Ma, J.; Peng, J. How do driving factors affect vegetation coverage change in the Shaanxi region of the Qinling mountains? Remote Sens. 2023, 16, 160. [Google Scholar] [CrossRef] [Scilit]
- Li, C.; Jin, Z.; Feng, L.; Jiang, C.; Peng, J. Impacts of natural and anthropogenic factors on ecosystem health in the basin-Mountain transition region: A study based on a risk-process-value assessment framework. Ecol. Indic. 2025, 176, e113623. [Google Scholar] [CrossRef] [Scilit]
- Ren, Z.; Tian, Z.; Wei, H.; Liu, Y.; Yu, Y. Spatiotemporal evolution and driving mechanisms of vegetation in the Yellow River Basin, China during 2000–2020. Ecol. Indic. 2022, 138, e108832. [Google Scholar] [CrossRef] [Scilit]
- Yu, H.; Hu, X.; Yao, L. Vegetation restoration reduces landscape ecological risk in the Loess Plateau. Geogr. Sustain. 2025, 6, 31–44. [Google Scholar] [CrossRef] [Scilit]
- Liu, W.; Chen, S.; Han, D.; Liu, J.; Zheng, P.; Huang, X.; Zhao, R. Spatiotemporal Dynamics and Driving Mechanisms of Vegetation Net Primary Productivity in the Giant Panda National Park Under the Context of Ecological Conservation. Land 2025, 14, 2394. [Google Scholar] [CrossRef] [Scilit]
- Zhang, L.; Liu, X.; Li, X.; Ma, J. Spatiotemporal evolution and climate-driven mechanisms of forest-grassland ecosystem quality in the Hua Jialing ecological barrier zone, Loess Plateau. Environ. Res. Commun. 2026, 8, e021002. [Google Scholar] [CrossRef] [Scilit]
- Wu, N.; Wang, S.; Wu, X.; Dong, W.; Huang, F.; Wang, H. Eco-environmental quality assessment of transition region between Qinling Mountains and Huanghuai Plain using Remote Sensing Ecological Index. Geocarto Int. 2025, 40, e2462480. [Google Scholar] [CrossRef] [Scilit]
- Cui, L.; Chen, Y.; Yuan, Y.; Luo, Y.; Huang, S.; Li, G. Comprehensive evaluation system for vegetation ecological quality: A case study of Sichuan ecological protection redline areas. Front. Plant Sci. 2023, 14, e1178485. [Google Scholar] [CrossRef] [Scilit]
- Tao, J.; Zhang, J.; Yang, L.; Ma, X.; Li, A. Conceptual evolution and methodological innovation of national park zoning at home and abroad. Natl. Parks 2025, 3, 30–39, (In Chinese and English). [Google Scholar]
- Zhai, W.; Ma, N. A management zoning method of biodiversity reserve. J. Northwest Univ. Nat. Sci. Ed. 1999, 29, 429–432. (In Chinese) [Google Scholar]
- Zhou, S.; Guo, Q. Strategies for harmonized development between communities and Wolong nature reserve. For. Inventory Plan. 2003, 28, 43–45. (In Chinese) [Google Scholar]
- Huyan, J.; Xiao, J.; Yu, B.; Xu, W. Research progress in function zoning of nature reserves in China. Acta Ecol. Sin. 2014, 34, 6391–6396. (In Chinese) [Google Scholar] [CrossRef] [Scilit]
- Liang, S. Technical study on the zoning of functional areas of nature reserves. For. Surv. Des. 2007, 28, 99–102. (In Chinese) [Google Scholar]
- Zhang, N.; Wu, C. An innovative research on practical problems and zoning modes of nature reserve. Landsc. Archit. 2014, 21, 126–131. (In Chinese) [Google Scholar]
- He, S.; Su, Y.; Min, Q. Boundary, zoning, and land use management of the Chinese national parks: Learning from nature reserves and scenic areas. Acta Ecol. Sin. 2019, 39, 1318–1329. (In Chinese) [Google Scholar]
- Zhu, Z.; Yao, L.; Wan, Y.; Xue, L.; Li, Q.; Xu, B.; Xu, X.; Yue, B. Delineation of territorial space ecological restoration zoning based on the characteristics of ‘source-flow-sink’ of ecosystem services: A case study of Xi’an City, Shaanxi Province, China. Chin. J. Appl. Ecol. 2026, 37, 243–252. (In Chinese) [Google Scholar]
- Qiao, B.; Cao, X.; Sun, W.; Gao, Y.; Chen, Q.; Yu, H.; Wang, Z.; Wang, N.; Cheng, H.; Wang, Y.; et al. Ecological zoning identification and optimization strategies based on ecosystem service value and landscape ecological risk: Taking Qinghai area of Qilian Mountain National Park as an example. Acta Ecol. Sin. 2023, 43, 986–1004. (In Chinese) [Google Scholar] [CrossRef] [Scilit]
- Pu, M.; Zhao, Y.; Ni, Z.; Huang, Z.; Peng, W.; Zhou, Y.; Liu, J.; Gong, Y. Spatial-temporal evolution and driving forces of NDVI in China’s giant panda national park. Int. J. Environ. Res. Public Health 2022, 19, 6722. [Google Scholar] [CrossRef] [Scilit] [PubMed]
- Zhang, J.; Gu, Y.; Shen, J.; Zhang, M.; Cong, M.; Sun, Y.; He, J.; Yang, L. Analysis of spatiotemporal changes and driving factors of ecological environment quality in the yellow river basin. Environ. Sci. 2025, 46, 956–971. (In Chinese) [Google Scholar]
- Jin, K.; Wang, F.; Han, J.; Shi, S.; Ding, W. Contribution of climatic change and human activities to vegetation NDVI change over China during 1982–2015. Acta Geogr. Sin. 2020, 75, 961–974. (In Chinese) [Google Scholar]
- Peng, S. 1-km Monthly Mean Temperature Dataset for China (1901–2024); National Tibetan Plateau/Third Pole Environment Data Center: Beijing, China, 2025. [Google Scholar]
- Peng, S. 1-km Monthly Precipitation Dataset for China (1901–2024); National Tibetan Plateau/Third Pole Environment Data Center: Beijing, China, 2025. [Google Scholar]
- Yang, H.; Xu, H. Assessing fractional vegetation cover changes and ecological quality of the Wuyi Mountain National Nature Reserve based on remote sensing spatial information. Chin. J. Appl. Ecol. 2020, 31, 187–196. (In Chinese) [Google Scholar]
- Wang, Z.; Bai, T.; Xu, D.; Kang, J.; Shi, J.; Fang, H.; Nie, C.; Zhang, Z.; Yan, P.; Wang, D. Temporal and Spatial Changes in Vegetation Ecological Quality and Driving Mechanism in Kökyar Project Area from 2000 to 2021. Sustainability 2022, 14, 7668. [Google Scholar] [CrossRef] [Scilit]
- Chen, M.; Lin, Z.; Peng, S.; Zhang, R.; Zhu, J.; Pan, X.; Jiao, Y. Altitudinal differentiation of agricultural drought mechanisms in mountains: From climate-vegetation coupling to human co-dominance. Ecol. Indic. 2025, 179, e114174. [Google Scholar] [CrossRef] [Scilit]
- Tian, M.; Zhou, J.; Jia, B.; Lou, S.; Wu, H. Impact of Three Gorges Reservoir Water Impoundment on Vegetation–Climate Response Relationship. Remote Sens. 2020, 12, 2860. [Google Scholar] [CrossRef] [Scilit]
- Yao, L.; Yue, B.; Pan, W.; Zhu, Z. A framework for identifying multiscenario priorities based on SCP theory to promote the implementation of municipal territorial ecological conservation planning policy in China. Ecol. Indic. 2023, 155, e111057. [Google Scholar] [CrossRef] [Scilit]
- Emmett, K.; Renwick, K.; Poulter, B. Adapting a dynamic vegetation model for regional biomass, plant biogeography, and fire modeling in the Greater Yellowstone Ecosystem: Evaluating LPJ-GUESS-LMfireCF. Ecol. Model. 2021, 440, 109417. [Google Scholar] [CrossRef] [Scilit]
- Shi, T.; Liu, Y.; Zhu, X.; Jin, Y.; Zhao, H.; Zhang, Y.; Zhang, Y. Construction and evaluation model of ecological environment carrying capacity indicators of Xiong’an new area from the perspective of development planning. Ecol. Indic. 2025, 179, e114266. [Google Scholar] [CrossRef] [Scilit]
- Li, C.; Cai, R.; Yan, X. Assessment of the Future Changes in the Socio-Economic Vulnerability of China’s Coastal Areas. Sustainability 2023, 15, 5794. [Google Scholar] [CrossRef] [Scilit]
- Rodriguez, T.; Reu, B.; Bolivar-Santamaria, S.; Cortes-Aguilar, A.; Buendia, C. A framework for participatory scenario planning to guide transitions towards sustainability in mountain social-ecological systems: A case study from the Colombian Andes. Land Use Policy 2023, 132, 106817. [Google Scholar] [CrossRef] [Scilit]

Disclaimer/Publisher’s Note: The statements, opinions and data contained in all publications are solely those of the individual author(s) and contributor(s) and not of MDPI and/or the editor(s). MDPI and/or the editor(s) disclaim responsibility for any injury to people or property resulting from any ideas, methods, instructions or products referred to in the content. |
© 2026 by the authors. Licensee MDPI, Basel, Switzerland. This article is an open access article distributed under the terms and conditions of the Creative Commons Attribution (CC BY) license.