Abstract
Demographic growth, changes in diet, and reliance on first-generation biofuels are increasing the human demand for agricultural products, thereby enhancing the human pressure on global freshwater resources. Recent research on the food-water nexus has highlighted how some major agricultural regions of the world lack the water resources required to sustain current growth trends in crop production. To meet the increasing need for agricultural commodities with limited water resources, the water use efficiency of the agricultural sector must be improved. In this regard, recent work indicates that the often overlooked strategy of changing the crop distribution within presently cultivated areas offers promise. Here we investigate the extent to which water in the United States could be saved while improving yields simply by replacing the existing crops with more suitable ones. We propose crop replacement criteria that achieve this goal while preserving crop diversity, economic value, nitrogen fixation, and food protein production. We find that in the United States, these criteria would greatly improve calorie (+46%) and protein (+34%) production and economic value (+208%), with 5% water savings with respect to the present crop distribution. Interestingly, greater water savings could be achieved in water-stressed agricultural regions of the US such as California (56% water savings), and other western states.
1. Introduction
The increasing demand for agricultural commodities resulting from demographic growth, economic development, urbanization, and the use of first-generation biofuels is placing an unprecedented pressure on global water resources (e.g., [1,2,3,4]). With many areas around the world facing chronic water stress because of excessive withdrawals from surface and groundwater bodies [4], there is a widespread concern that in the next few decades, hydrologic conditions will severely limit food production [5]. These concerns arise after decades of sustained increase in global crop production afforded by the technological innovations of the industrial and green revolutions, such as modern machinery, industrial fertilizers, irrigation pumps, and new cultivars (e.g., [6,7]). Water and land availability remain major constraints on agricultural production and there is an urgent need for solutions that moderate the use of these natural resources to meet future food demand [8,9].
Recent research has highlighted how water savings may be achieved through food waste reduction [10] and reliance on approaches that reduce unproductive water losses [5,11,12]. Likewise, “land sparing” through agricultural intensification is often invoked as a preferred path to food security because it prevents deforestation, land use change, habitat destruction, and biodiversity losses that would otherwise result from agricultural expansion [13,14,15]. The intensification of agriculture, however, is often achieved through yield gap closure, which typically entails the use of fertilizers, irrigation, and other technology to increase crop yields (e.g., [16]). Unfortunately, in many regions of the world, irrigation cannot be enhanced because the local water resources are already under stress, and any further water withdrawal would compete with other economic activities or environmental flows [17]. Other approaches to agricultural intensification do not necessarily aim at yield gap closure but use multiple growing seasons (“harvest gap closure”) in regions with suitable climate conditions to increase the annually harvested cropland [18].
In this study we investigate an alternative strategy to increase agricultural yields, while reconciling the often competing needs of water saving and land sparing. We propose that crop production can be enhanced and water use efficiency improved by changing the distribution of crops within the presently cultivated land. This approach is based on the consideration that the current crop distribution is sub-optimal in that it does not use land and water in the most efficient way. We consider a policy-relevant, national-scale analysis to investigate to what extent it is possible to save water while improving yields by simply replacing the existing set of crops with a more suitable one. While doing so, we ensure that the crop replacement “rules” we propose do not achieve improved gains and reduced water losses at the expense of environmental, dietary, or economic outcomes. Specifically, we consider crop replacement scenarios that do not reduce crop diversity (i.e., with minimal replacement of multiple crops with monocultures), protein production (i.e., protein-rich crops such as soy beans are not replaced), or income (i.e., the economic value of the new crop scenario is not lower than the pre-existing one). We apply this analysis to the United States of America, a major producer of agricultural commodities [19] both for domestic consumption and the export market [20,21,22,23], and a major consumer of water resources for crop production [3,24,25].
2. Materials and Methods
2.1. Data
We consider 11 major food crops—groundnut, maize, potato, rapeseed, rice, sorghum, soybean, sugar beet, sugarcane, sunflower, and wheat. These crops account for 86% of US crop production and 87% of the country’s harvested area [19]. Spatially distributed (1/12° or ~10 km resolution), crop-specific information on yields (tonne·ha−1), actual evapotranspiration (mm·year−1), cultivated area (ha), and agro-ecological suitability were taken from the Food and Agriculture Organization of the United Nations (FAO) Global Agro-ecological Zones (GAEZ) database [26]. For actual evapotranspiration maps, we selected the 1961–1990 GAEZ baseline scenario under irrigation with “intermediate input” from synthetic fertilizers, pesticides/herbicides and mechanization [26]. Agro-ecological suitability—represented as a percentage—describes the biophysical constraints (e.g., soil, terrain, temperature and precipitation regimes) that may limit a farmer from realizing the maximum attainable yield of a crop. Average per capita calorie (2728 kcal·capita−1·day−1) and protein (75 g·capita−1·day−1) demand were global averages for the year 2000 [19]. Data on national gross domestic product (GDP) were taken from the World Bank’s Global Development Indicators database [27].
2.2. Current Production and Water Demand
Current (circa year 2000) production was calculated for each crop and each pixel as the product of yield (tonne·ha−1) and harvested area (ha). Crop yields were converted to kcal·ha−1, kg·protein·ha−1, and USD·ha−1 using global values from the FAO’s FAOSTAT database [19] (Table 1). For each crop, all pixels with a harvested area at or below the fifth percentile were not considered. Following Tuninetti et al. [28], the current water demand of each crop in each pixel was calculated as the product of actual evapotranspiration (mm·year−1), harvested area (ha), and a correction factor of 10 that converts the units for evapotranspiration to m3·ha−1·year−1.

Table 1.
Crop-specific conversion factors for calories, protein, and price.
2.3. Interpolating Yields and Evapotranspiration
Maps of current crop yields and actual evapotransporation (ETa) were interpolated using a spline algorithm with maximum smoothing. Each interpolated crop-specific map was then masked with a cultivated area mask—to consider only those areas where at least one of the 11 crops is currently grown—and a buffering mask—25/12° or ~250 km from where the crop is currently cultivated—to ensure that our analysis considered only those interpolated areas with similar climate and soil characteristics. A comparison of current yield and evapotranspiration maps with interpolated maps showed good agreement (Table 2).
Table 2.
Difference between original and interpolated values for paired pixels for yield and ETa.
Of course, even if climate and soil conditions are suitable, certain crops may not currently be grown in a given area for a host of other reasons (e.g., lack of indigenous knowledge, infrastructural constraints, dietary preferences, etc.). However, at the distances we consider, there are likely minimal obstacles preventing the transfer of knowledge and technology from locations where a crop is currently grown. Given the limitations of available datasets, our analysis does not capture fine-scale biophysical heterogeneity or distinguish between crop water demand met through precipitation or irrigation. Thus while these considerations were beyond the scope of this study, they should be kept in mind when considering the approach and findings presented here.
2.4. Minimizing Water Demand
We developed a set of criteria to minimize the water footprint of crop production through the redistribution of cropping patterns. Because a single pixel can contain harvested areas for multiple crops, we assessed each harvested area within each pixel separately, starting with the largest harvested area. First, the water demand of a harvested area within a pixel should decrease. Second, calorie and protein production should not decrease from current amounts. And third, the value of crop production should not decrease from current levels. Expressed together, the three criteria form the multi-conditional statement:
where w is the crop water footprint, p is the crop protein yield, k is the crop calorie yield, v is the crop value, and the subscripts r and c represent the potential replacement crop and the current crop, respectively. The values of w, p, k and v in replacement and in current crops are calculated using the interpolated yields for the pixel. If all three criteria were met, the current crop in the harvested area of interest was replaced by the crop that minimizes the water demand. Also, the replacement crop could not be further considered for other harvested areas within the pixel, thereby preventing a transition to monoculture. If at least one of the three conditions were not met, we then repeated the assessment of the three criteria (Equation (1)) using the crop with the next lowest actual evapotranspiration value for the pixel, and so on through all 11 crops. If no potential replacement crop met all three criteria for the harvested area, then the current crop was maintained.
3. Results
We found that redistributing crops within the United States would have important effects on calorie (+46%) and protein (+34%) production while also greatly enhancing economic value (+208%). In addition, the country as a whole can realize a modest water savings of 19 km3 H2O·year−1 (5%) by redistributing crops within currently cultivated lands. Our findings therefore showed a large potential for improvement in terms of food security and economic development of the agricultural sector (Figure 1).
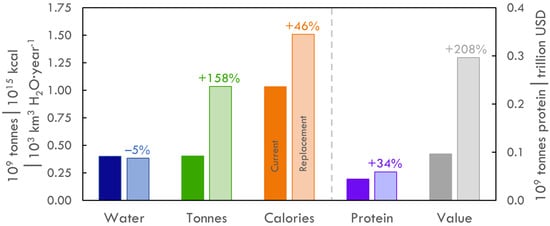
Figure 1.
Benefits of optimized crop distribution in terms of water use, production, and economic values.
Despite only modest improvements at the national scale, our results showed that certain water-scarce agricultural regions have the potential to achieve substantial reductions in water use by optimizing cropping patterns (Figure 2). Among the most notable of these is California, where our approach reduced the state’s consumptive water use by 56% for the crops considered in this study. Sugar beet and wheat in particular were the main crops that were replaced, while multiple other crops took their place. The state also saw a 29% increase in calorie production, a 54% increase in protein production, and a 32% increase in agricultural value. It is important to note that, while the crops used in this analysis are not among the most water-intensive crops grown in California (e.g., almonds, alfalfa), the large reduction in the water footprint is encouraging for this water-stressed area.
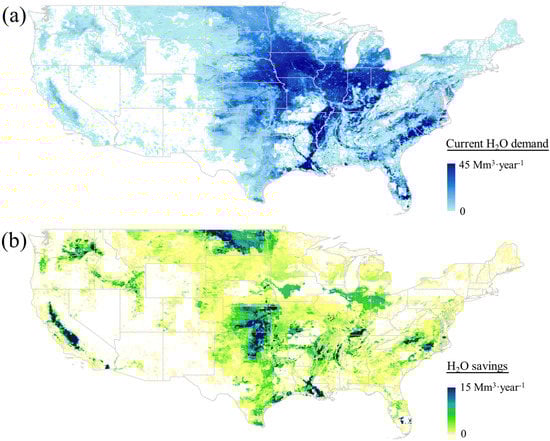
Figure 2.
Reduction in consumptive water use from redistributing crops. (a) Current water demand for major crops in the United States and (b) potential water savings from optimizing crop distributions.
Substantial improvements in water demand also occurred in numerous other western states: Arizona, Idaho, Montana, Nevada, Oregon, Utah, and Washington. In general, these states also saw marked decreases in wheat and sugar beet production. Thus, crop replacement appears to have had the largest effect (by percentage) in many of the areas that rely heavily on irrigation for food production. Interestingly, though many other states did not realize large changes in water use, protein production and agricultural value more than doubled in 14 and 32 states, respectively, as a result of redistributing crops (Table 3). This could have important implications for local nutrition and farmer income security.
Table 3.
Percent change in water demand, production, and economic value by state.
In examining individual crops, the largest overall increases in production occurred for groundnuts, maize, and potatoes. Rice and soybeans also experienced increases. Conversely, sorghum and wheat underwent substantial reductions (Figure 3), as well as rapeseed, sugar beet, sugar cane, and sunflower to a lesser extent. In general, these transitions represent higher nutrient content and profitability as well as generally less water-intensive crops. The differences in the relative importance of certain crops for certain metrics also highlights that—due to difference in nutritional content, water footprint, and value—the places with the large reductions in water demand were not necessarily the same areas where the production or value most increased.
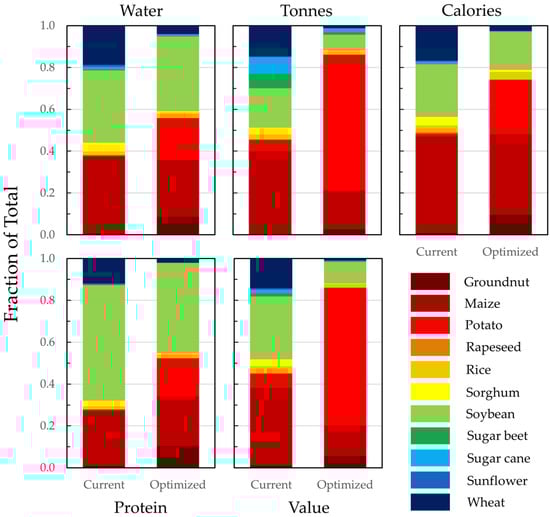
Figure 3.
Relative contribution of crops to water demand, production, and economic value under current and optimized scenarios.
4. Discussion and Conclusions
Previous studies have highlighted the possible existence of strong inefficiencies in water use by agriculture. In some countries (e.g., Morocco), crop redistribution can realize water savings while improving the economic value of agricultural products [29]. This study shows how in the US, water resources and arable land could be used more efficiently if, in some areas, the existing crops (or crop mixtures) were replaced with more suitable cultures. Major improvements in crop yield, food production, and economic value of agricultural commodities could be achieved by reshaping the current distribution of crops. While the replacement scenarios proposed in this study are expected to lead to an overall modest reduction in water usage (≈5%), locally, the water savings could be substantial, particularly in some drought-prone regions (e.g., California). This also highlights that an approach seeking to minimize consumptive water use may not be necessary in places with relatively abundant freshwater resources. Despite the small water savings, the great increase in agricultural yields would still correspond to a much more efficient use of water and land and demonstrates the benefits of considering multiple dimensions of food production in tandem.
The proposed approach could serve as an alternative to standard agricultural intensification strategies aimed at yield gap closure through investments in modern technology. Unlike gap closure methods, the crop replacement scenarios investigated in this study would not increase the pressure on the water system. On the contrary, these scenarios would entail a reduction in the use of freshwater resources per unit of food produced.
The decision about what type of crops farmers and agribusiness corporations choose to plant is the result of a number of economic, cultural, nutritional, and agronomic factors that are not accounted for in our crop replacement criteria. In our analysis we do try to preserve crop diversity, improve economic value, and maintain crops that may improve soil nutrient levels by performing nitrogen fixation. However, other factors such as the impact of alternative crop scenarios on diets, employment, environmental quality, cost of agricultural inputs, time of transition, and required expertise are difficult to assess and are likely to strongly affect the feasibility of some of these crop replacements. Nevertheless, the great increase in production rates and economic value found in this study suggests that in the US, the current system of production has relatively large margins of improvement in water and land use efficiency. New policies, incentives, water pricing schemes, and other institutional arrangements, however, would need to be developed and implemented in order to attain at least part of the gains shown by the calculations reported in this study.
Acknowledgments
Support for this research was provided through The Nature Conservancy’s NatureNet Science fellowship.
Author Contributions
Kyle Frankel Davis conceived and designed the research; Kyle Frankel Davis and Antonio Seveso performed the data analyses; Kyle Frankel Davis, Paolo D’Odorico and Maria Cristina Rulli wrote the paper.
Conflicts of Interest
The authors declare no conflict of interest.
References
- Falkenmark, M.; Rockstrom, J. Balancing Water for Humans and Nature: The New Approach in Ecohydrology; Earthscan: London, UK, 2004. [Google Scholar]
- Konar, M.; Dalin, C.; Hanasaki, N.; Rinaldo, A.; Rodriguez-Iturbe, I. Temporal dynamics of blue and green virtual water trade networks. Water Resour. Res. 2012, 48. [Google Scholar] [CrossRef]
- Carr, J.A.; D’Odorico, P.; Laio, F.; Ridolfi, L. On the temporal variability of the virtual water network. Geophys. Res. Lett. 2012, 39. [Google Scholar] [CrossRef]
- Mekonnen, M.M.; Hoekstra, A.Y. Four billion people facing severe water scarcity. Sci. Adv. 2016, 2, e1500323. [Google Scholar] [CrossRef] [PubMed]
- Falkenmark, M.; Rockström, J. The new blue and green water paradigm: Breaking new ground for water resources planning and management. J. Water Res. Plan. Manag. 2006, 132, 129–132. [Google Scholar] [CrossRef]
- Erisman, J.W.; Sutton, M.A.; Galloway, J.; Klimont, Z.; Winiwarter, W. How a century of ammonia synthesis changed the world. Nat. Geosci. 2008, 1, 636–639. [Google Scholar] [CrossRef]
- D’Odorico, P.; Rulli, M.C. The fourth food revolution. Nat. Geosci. 2013, 6, 417–418. [Google Scholar] [CrossRef]
- Tilman, D.; Balzer, C.; Hill, J.; Befort, B.L. Global food demand and the sustainable intensification of agriculture. Proc. Natl. Acad. Sci. USA 2011, 108, 20260–20264. [Google Scholar] [CrossRef] [PubMed]
- Davis, K.F.; Gephart, J.A.; Emery, K.A.; Leach, A.M.; Galloway, J.N.; D’Odorico, P. Meeting future food demand with current agricultural resources: Required changes in dietary trends and production efficiencies. Glob. Environ. Chang. 2016, 39, 125–132. [Google Scholar] [CrossRef]
- Kummu, M.; De Moel, H.; Porkka, M.; Siebert, S.; Varis, O.; Ward, P. Lost food, wasted resources: Global food supply chain losses and their impacts on freshwater, cropland, and fertiliser use. Sci. Total Environ. 2012, 438, 477–489. [Google Scholar] [CrossRef] [PubMed]
- Jägermeyr, J.; Gerten, D.; Schaphoff, S.; Heinke, J.; Lucht, W.; Rockström, J. Integrated crop water management might sustainably halve the global food gap. Environ. Res. Lett. 2016, 11. [Google Scholar] [CrossRef]
- MacDonald, G.K.; D’Odorico, P.; Seekell, D.A. Pathways to sustainable intensification through crop water management. Environ. Res. Lett. 2016, 11. [Google Scholar] [CrossRef]
- Godfray, H.C.J.; Beddington, J.R.; Crute, I.R.; Haddad, L.; Lawrence, D.; Muir, J.F.; Pretty, J.; Robinson, S.; Thomas, S.M.; Toulmin, C. Food security: The challenge of feeding 9 billion people. Science 2010, 327, 812–818. [Google Scholar] [CrossRef] [PubMed]
- Naylor, R. Expanding the boundaries of agricultural development. Food Secur. 2011, 3, 233–251. [Google Scholar] [CrossRef]
- Foley, J.A.; Ramankutty, N.; Brauman, K.A.; Cassidy, E.S.; Gerber, J.S.; Johnston, M.; Mueller, N.D.; O’Connell, C.; Ray, D.K.; West, P.C.; et al. Solutions for a cultivated planet. Nature 2011, 478, 337–342. [Google Scholar] [CrossRef] [PubMed]
- Mueller, N.D.; Gerber, J.S.; Johnston, M.; Ray, D.K.; Ramankutty, N.; Foley, J.A. Closing yield gaps through nutrient and water management. Nature 2012, 490, 254–257. [Google Scholar] [CrossRef] [PubMed]
- Davis, K.F.; Rulli, M.C.; Garrassino, F.; Seveso, A.; D’Odorico, P. Water limits to closing yield gaps. Adv. Water Resour. 2016, 99, 67–75. [Google Scholar] [CrossRef]
- Ray, D.K.; Foley, J.A. Increasing global crop harvest frequency: Recent trends and future directions. Environ. Res. Lett. 2013, 8. [Google Scholar] [CrossRef]
- Food and Agriculture Organization of the United Nations. FAOSTAT Database. FAO: Rome, Italy, 2016. Available online: http://www.fao.org/faostat/en/#home (accessed on 9 October 2016).
- Dalin, C.; Konar, M.; Hanasaki, N.; Rinaldo, A.; Rodriguez-Iturbe, I. Evolution of the global virtual water trade network. Proc. Natl. Acad. Sci. USA 2012, 109, 5989–5994. [Google Scholar] [CrossRef] [PubMed]
- Porkka, M.; Kummu, M.; Siebert, S.; Varis, O. From food insufficiency towards trade dependency: A historical analysis of global food availability. PLoS ONE 2013, 8, e82714. [Google Scholar] [CrossRef] [PubMed]
- D’Odorico, P.; Carr, J.A.; Laio, F.; Ridolfi, L.; Vandoni, S. Feeding humanity through global food trade. Earth Future 2014, 2, 458–469. [Google Scholar] [CrossRef]
- MacDonald, G.K.; Brauman, K.A.; Sun, S.; Carlson, K.M.; Cassidy, E.S.; Gerber, J.S.; West, P.C. Rethinking Agricultural Trade Relationships in an Era of Globalization. BioScience 2015, 65, 275–289. [Google Scholar] [CrossRef]
- Hoekstra, A.Y.; Mekonnen, M.M. The water footprint of humanity. Proc. Natl. Acad. Sci. USA 2012, 109, 3232–3237. [Google Scholar] [CrossRef] [PubMed]
- Carr, J.A.; D’Odorico, P.; Laio, F.; Ridolfi, L. Recent history and geography of virtual water trade. PLoS ONE 2013, 8, e55825. [Google Scholar] [CrossRef] [PubMed]
- International Institute for Applied Systems Analysis (IIASA); Food and Agriculture Organization of the United Nations (FAO). Global Agro-Ecological Zones (GAEZ v3.0); IIASA: Laxenburg, Austria; FAO: Rome, Italy, 2012. [Google Scholar]
- The World Bank. World Development Indicators Database; World Bank: Washington, DC, USA, 2016. [Google Scholar]
- Tuninetti, M.; Tamea, S.; D’Odorico, P.; Laio, F.; Ridolfi, L. Global sensitivity of high-resolution estimates of crop water footprint. Water Resour. Res. 2015, 51. [Google Scholar] [CrossRef]
- Schyns, J.F.; Hoekstra, A.Y. The Added Value of Water Footprint Assessment for National Water Policy: A Case Study for Morocco. PLoS ONE 2014, 9, e99705. [Google Scholar] [CrossRef] [PubMed]
© 2017 by the authors. Licensee MDPI, Basel, Switzerland. This article is an open access article distributed under the terms and conditions of the Creative Commons Attribution (CC BY) license ( http://creativecommons.org/licenses/by/4.0/).