


Abstract
This paper investigates the specific positioning accuracies and uncertainties associated with the measurement of acoustic leakage noise correlation (LNC) in underground pressurized water mains, treating them as acoustic waveguides. It begins by identifying three key intrinsic sources of measurement errors: (1) the speed of acoustic waves in the water mains as influenced by pipe material, wall thickness, modulus of elasticity, and bulk modulus; (2) the distance between the two accelerometers used for correlation; (3) the time delay from the point of leakage to the accelerometers. A mathematical uncertainty model was developed to compute sensitivity coefficients, enabling the propagation of measurement errors from these sources. This was validated through seven sets of full-scale experiments conducted at Q-Leak, a 25,000 sq. ft. test site in Hong Kong. This study ultimately quantified and assessed the contributions of individual error sources to the overall uncertainty, allowing for the prioritization of factors that have the most significant impact in various scenarios. The findings reveal that Young’s modulus and pipe wall thickness are the primary factors affecting measurements for both plastic and metal pipes. Additionally, a universal in-house program, “LNC uncertainty calculator,” was developed to provide insights into the buffer ranges for confirming suspected leak locations while considering constraints within the uncertainty budget. This research highlights the critical but often overlooked area of uncertainty modeling in leak detection for pressurized buried water mains, offering valuable insights intended to enhance operational strategies and maintenance practices within the industry. This research provides a robust framework for understanding the accuracy of leak detection. This means operators can better interpret the reliability of their measurements, leading to consistent decision-making across different situations and minimizing the risk of misidentifying the presence or absence of leakage. In addition, the insights gained from prioritizing factors that affect measurement accuracy allow engineers and operators to make informed decisions about where to focus their resources and efforts. This can lead to more effective maintenance strategies that are tailored to specific conditions, thereby optimizing operational efficiency.
1. Introduction
Water leakage in buried water mains is one of the biggest challenges for many countries worldwide. The consequences of leakage extend beyond the waste of valuable water resource loading to adverse impacts on the environment, such as soil erosion and corrosion of neighboring utilities. Today, the city’s underground environment presents a challenging task due to the presence of a complex ‘spaghetti-like’ network of underground utilities. Among these underground utility networks, pressurized water distribution networks, which are responsible for the distribution of fresh water, are arguably the most challenging type of utility in terms of management.
Acoustic leak detection (ALD) refers to a suite of technologies that utilize sound waves to detect leaks in pipes [1,2,3,4,5]. It involves utilizing various technologies to identify leaks in pipes through the detection of common acoustic signals. ALD encompasses several approaches, including acoustic waves in pipes, acoustic waves in soil and air, and acoustic waves in water [6]. These approaches can be characterized in three stages: identification, localization, and pinpointing for a standardized leak detection strategy.
1.1. Wave-Guided ALD
For the first stage, identification, noise logging involves the deployment of a sensor to the valve or surface of the pipe to monitor the acoustic responses of the water network during night flow (2–4 a.m.), where the water demand is the lowest, and the neighborhood is the quietest. Typically, leak noises have specific frequency ranges that produce high-frequency sounds not commonly found in traffic or hydraulic noise. By carrying out frequency analysis and amplitude thresholding, leak noise can be distinguished from background interference by setting a threshold amplitude value in the noise logger that is within a defined frequency range. If the noise exceeds this threshold, it could indicate a leak. In addition, the interference noises are usually more consistent and may not trigger the alarm as they remain below this threshold or fall outside the defined frequency range.
For the second stage, localization, which is the focus of this paper, leak noise correlation (LNC) involves using multiple sensors placed along a pipe to correlate noise created by a leak, allowing for more accurate leak detection and localization. Signals from transmitters are sent to the receiving unit, which computes the cross-correlation function of the two signals and estimates the suspected leak location.
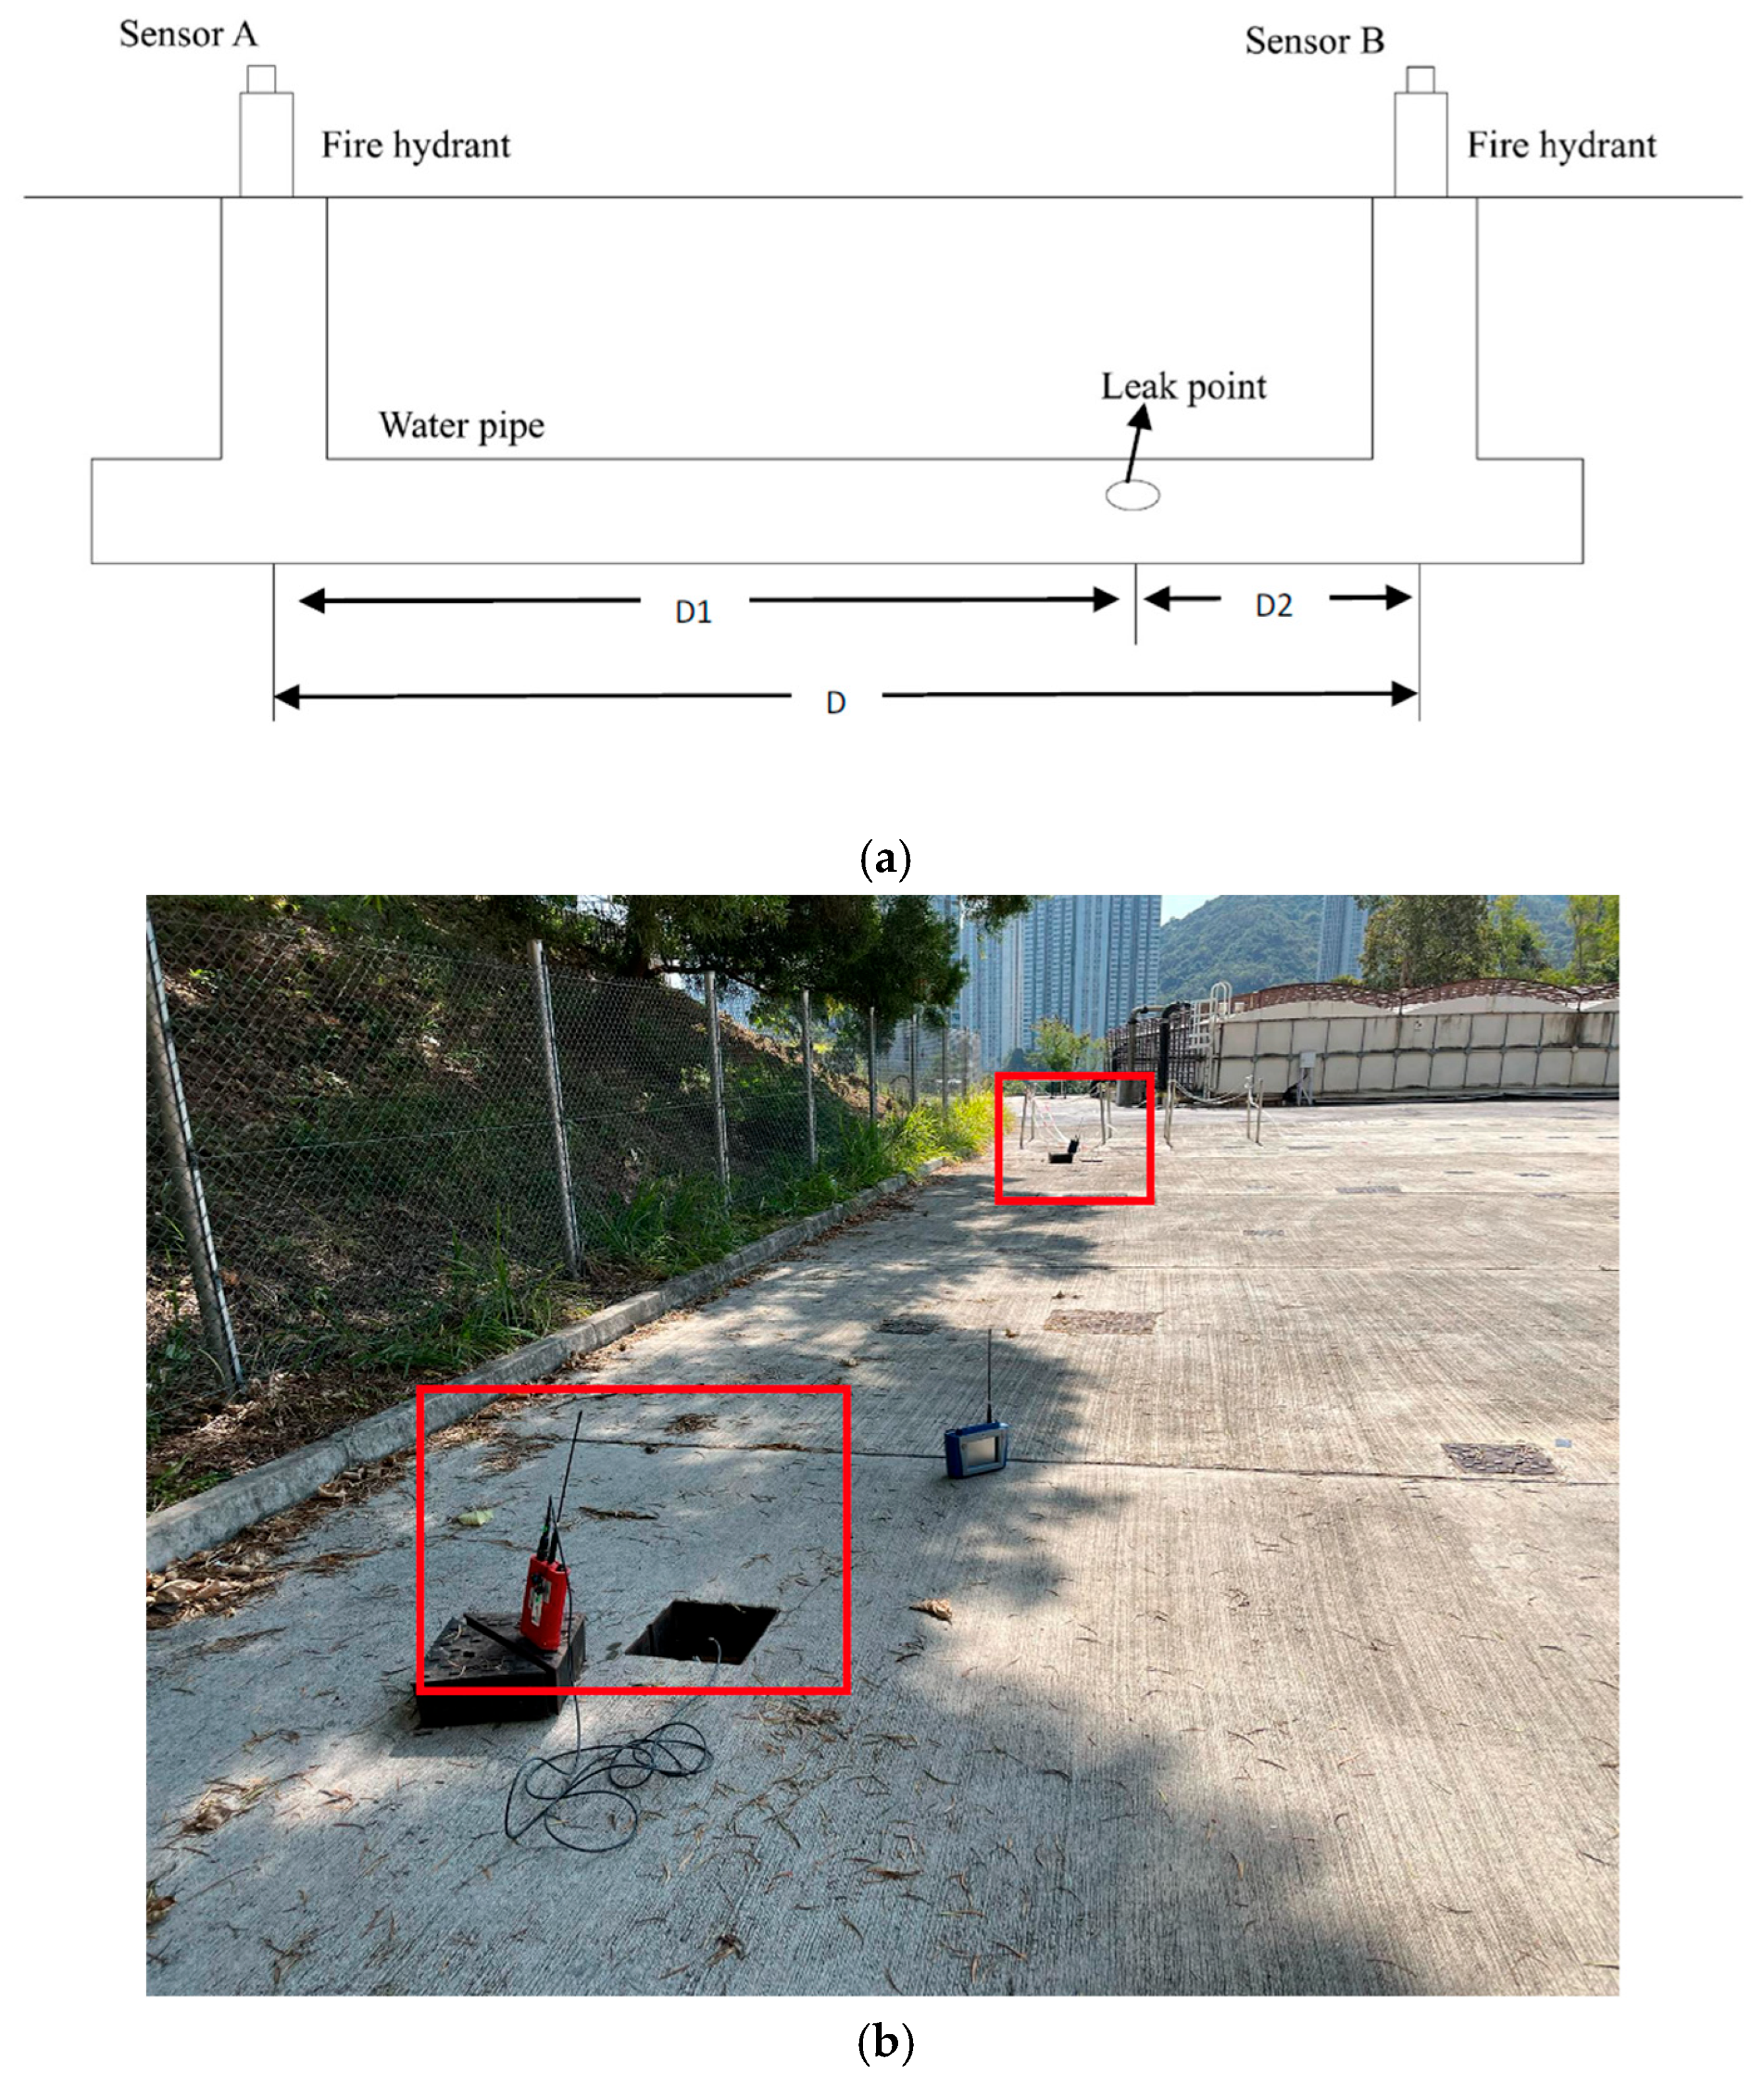
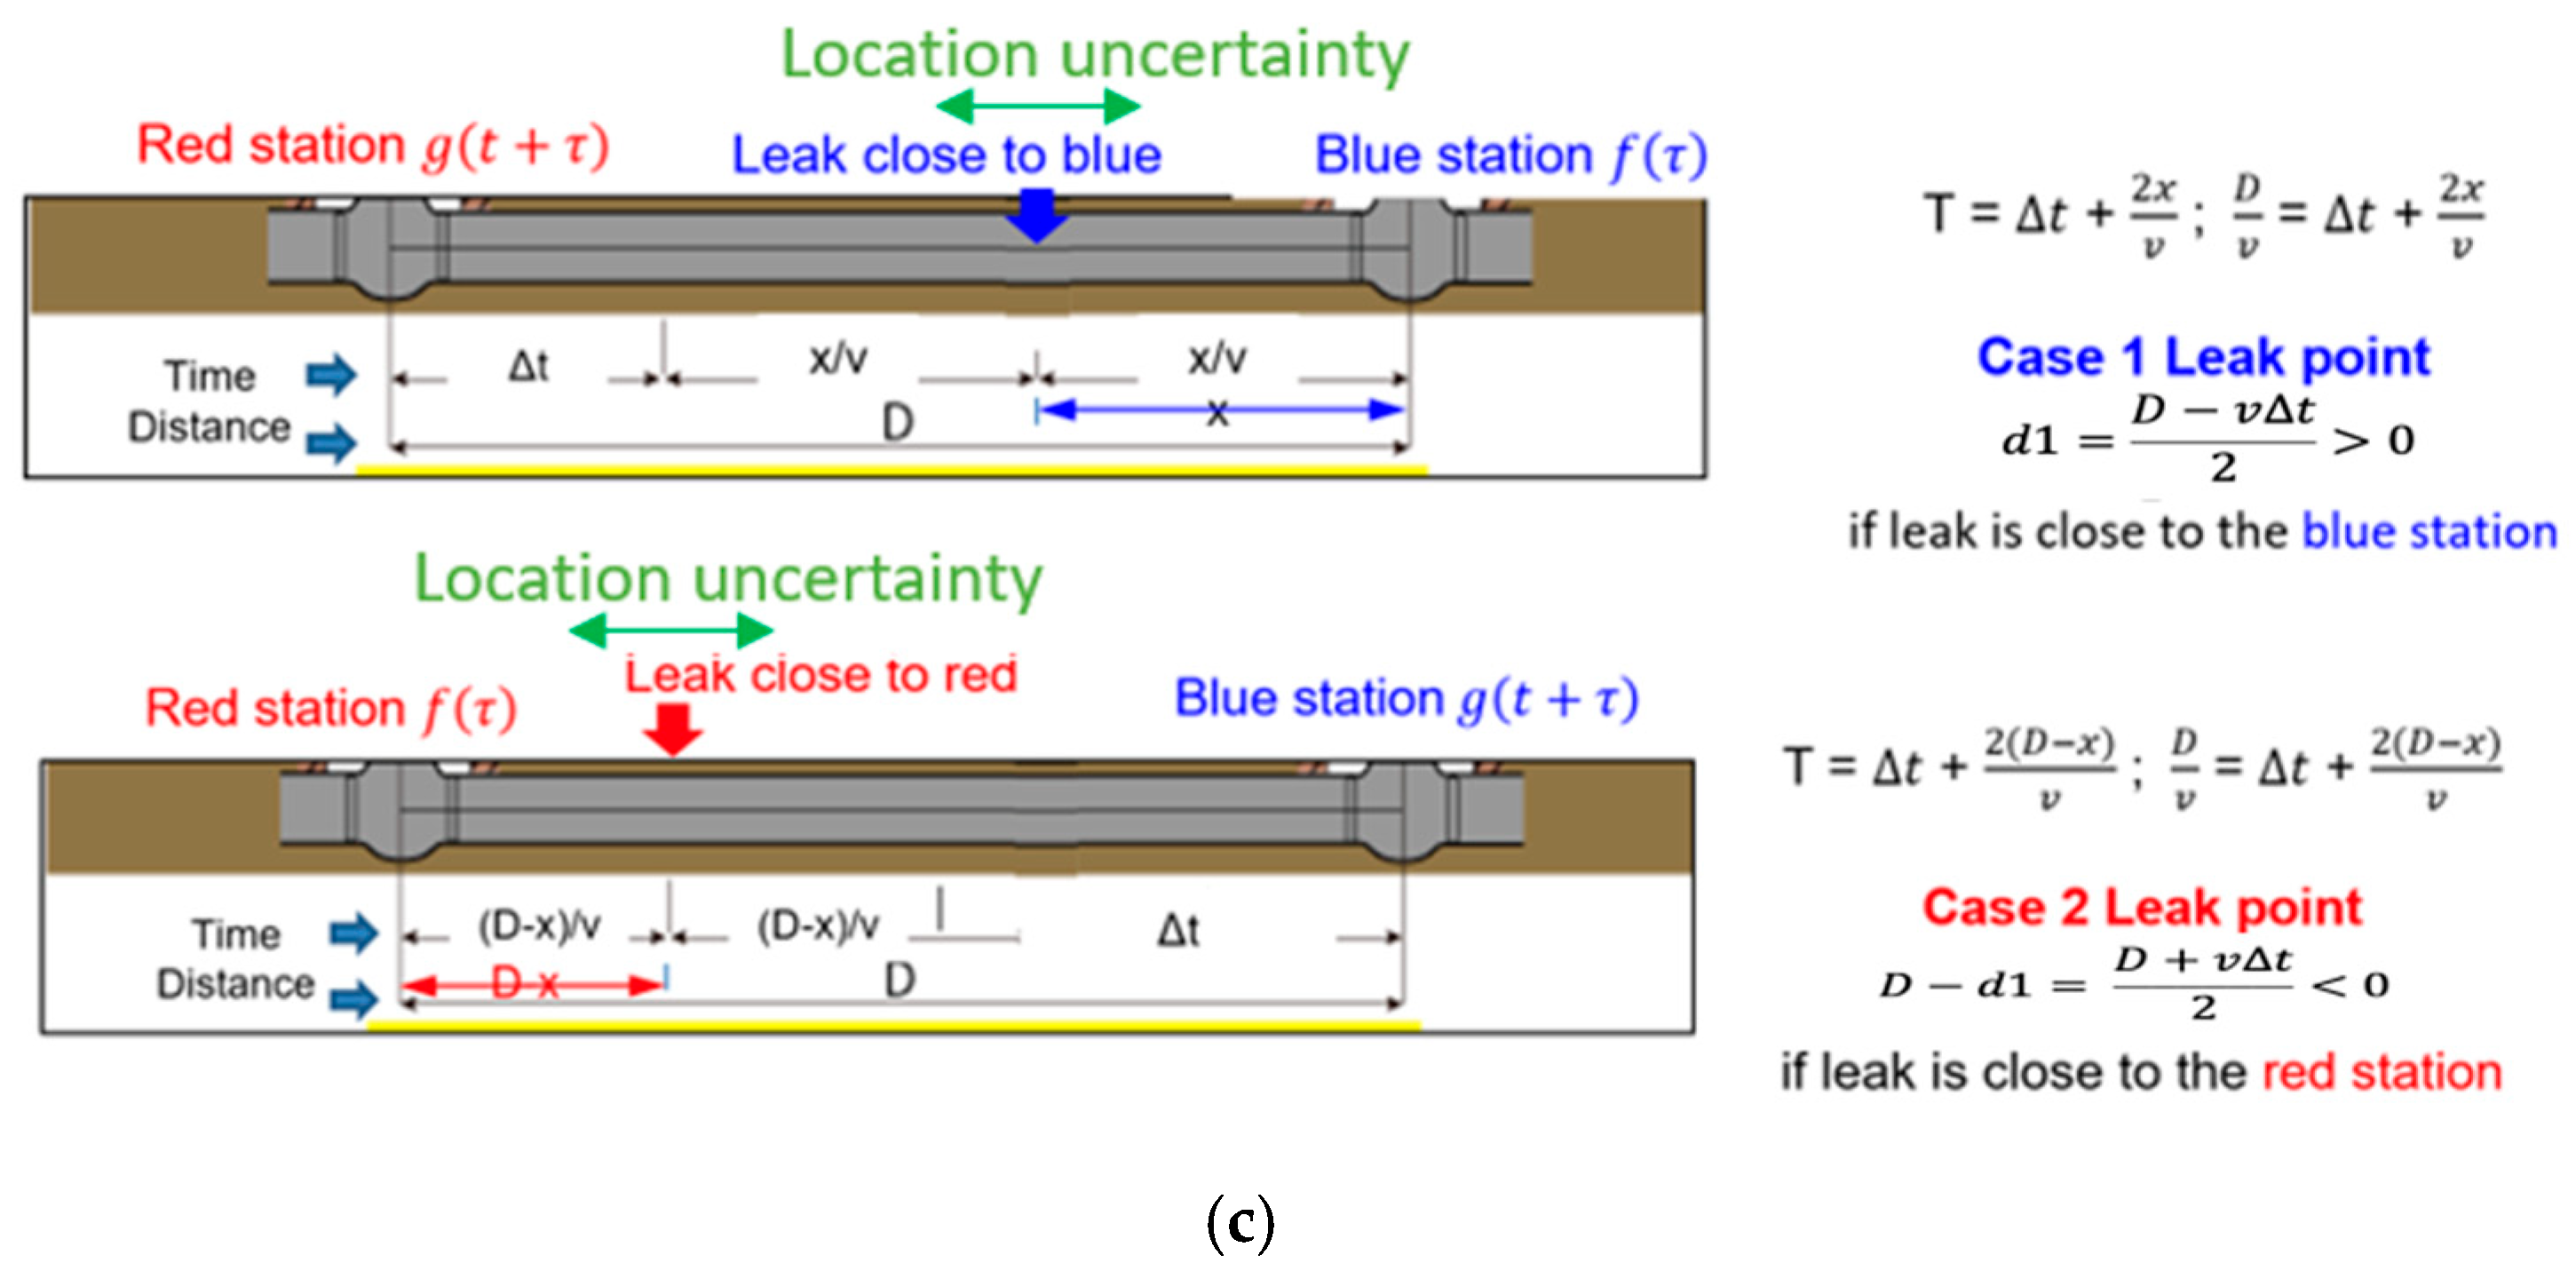
The fundamental function of LNC is to measure the time lag of the vibration of acoustic signals arriving at the accelerometers at outstations (e.g., valves) through the watermain as a waveguide [7]. If a leak is present, the leak sound yields an acoustic signal that generates leak noise, which propagates along the pipe as a waveguide. The time delay and vibrations between the two sensors are measured by the built-in correlator, and the location of the leak is determined based on the difference in noise arrival times [8]. The mechanism and setup of the LNC survey are illustrated in Figure 1a,b. The leak’s location can be computed using an algebraic relationship that involves the time delay, the total distance (d) between sensors, and the propagation wave speed (v). Figure 1c [9] demonstrates the leak’s location categorized into two scenarios, depending on whether it is closer to the accelerometer A or accelerometer B. Equation (1) calculates the leak’s position relative to the accelerometer B, while Equation (2) does the same for the accelerometer A. They are also used in this equation for error propagation.
where the following are defined:
- d1 = the distance between the leak point and the accelerometer;
- D = the total distance between two accelerometers;
- v = the wave speed expressed in Equation (3);
- ∆t = time delay.
The effectiveness of the LNC technology in detecting and locating leaks in pressurized water mains has been demonstrated in the past [10,11]. By providing accurate leak detection and location information, the LNC can help identify leakage locations for repair, minimize water loss, prevent damage to infrastructure, and reduce costs associated with repair and maintenance. Many researchers developed theoretical works on vibration and wave propagation in fluid-filled pipes [7,12,13]. Gao, Brennan [7] proposed a model (Equation (3)) to describe the behavior of velocity changes due to material properties and geometry.
where the following are defined:
- = Fluid wave speed;
- B = the fluid bulk modulus of elasticity;
- E = Young’s modulus of pipe wall material;
- a = the pipe radius;
- h = wall thickness.
Figure 1.
(a). Mechanism of the leak noise correlator. (b). Leak noise correlator setup in Q-Leak. (c). Equation of leak position estimation.
Previous studies focus on the acoustic leak detection method with various pipe materials and sizes, and use advanced signal processing techniques. Fantozzi, Di Chirico [10], Fuchs and Riehle [11], Liston and Liston [14] have successfully demonstrated the effectiveness of acoustic methods in metallic pipe detection to the industry. Afterwards, Hunaidi and Chu [15] expanded the study scope from metallic pipe to plastic pipe and investigated the leak signal pattern to identify the leak location with LNC. Gao and Brennan [7] and Gao and Brennan [16] established an analytical model of the cross-correlation function for wave propagation and investigated the effectiveness of the correlation technique using different acoustic/vibration sensors in buried plastic water pipes. Brennan and Gao [8] studied the effects of severe amplitude distortion of leak noise data due to either severe clipping or extreme quantization caused by instrumentation. Kafle and Fong [17] proposed a novel active method to overcome the lower SNR problem. In addition, Zeng and Cazzolato [18] have developed a novel acoustic leak detection method that does not require any preprocessing of the measured acoustic signal and accommodates the frequency-dependent characteristics of the leak signal. The majority of studies focus on the development of signal processing techniques and active methods for enhancing the signal strength. However, there are very few studies focusing on the accuracy and uncertainty of the acoustic measurement, especially LNC, probably because of the lack of ground truth of the actual leakage location and the small scale of measurement. Our work, based on a large data set from repetitive measurements, develops the uncertainty model that helps identify and account for the various factors that contribute to the overall uncertainty in the correlation results, in which it can provide comprehensive understanding of the reliability and accuracy of the result.
Carrying out an uncertainty calculation requires first identifying the mathematical model, Equations (1)–(3). Secondly, the influential parameters influence the accuracy of overall results in different case-development magnitudes [19]. We developed the classic uncertainty propagation method, which assumes the parameters in Equations (1)–(3) are independent. The application of the sensitivity coefficient calculation can help to identify the distribution or priority of the influenced parameter on the overall uncertainty. Those input variables include the distance between two accelerometers, pipe diameter, bulk modulus, pipe material, and pipe wall thickness.
Moreover, the confusion matrix is an effective tool for representing the measurement performance in terms of accuracy and precision. The accuracy describes the discrepancy between the measured value and the true value. The precision refers to the degree of repeatability and consistency in a set of measurements. An error can be generated from different sources and can be categorized into gross error, systematic error, and random error [20,21]. With reference to Lai and Lau [1] about the utility survey, the measurement result can be categorized into four regions in a confusion matrix, including the following: true positive (TP), denoted as hit, which correctly located water leakage; true negative (TN), denoted as safe, which correctly predicted no water leakage; false positive (FP), denoted as false alarm, which incorrectly located water leakage when there were none; false negative, denoted as miss, which incorrectly predicted no water leakage when there was actual leakage. In the meantime, the relationship between accuracy and precision can be demonstrated using the multiple measurement approach. The consequence can be classified as high accuracy with high precision, low accuracy with high precision, high accuracy with low precision, and low accuracy with low precision. This categorization approach will be adopted in Section 3 for the evaluation of the measurement accuracy and sensitivity.
1.2. Non-Wave-Guided ALD
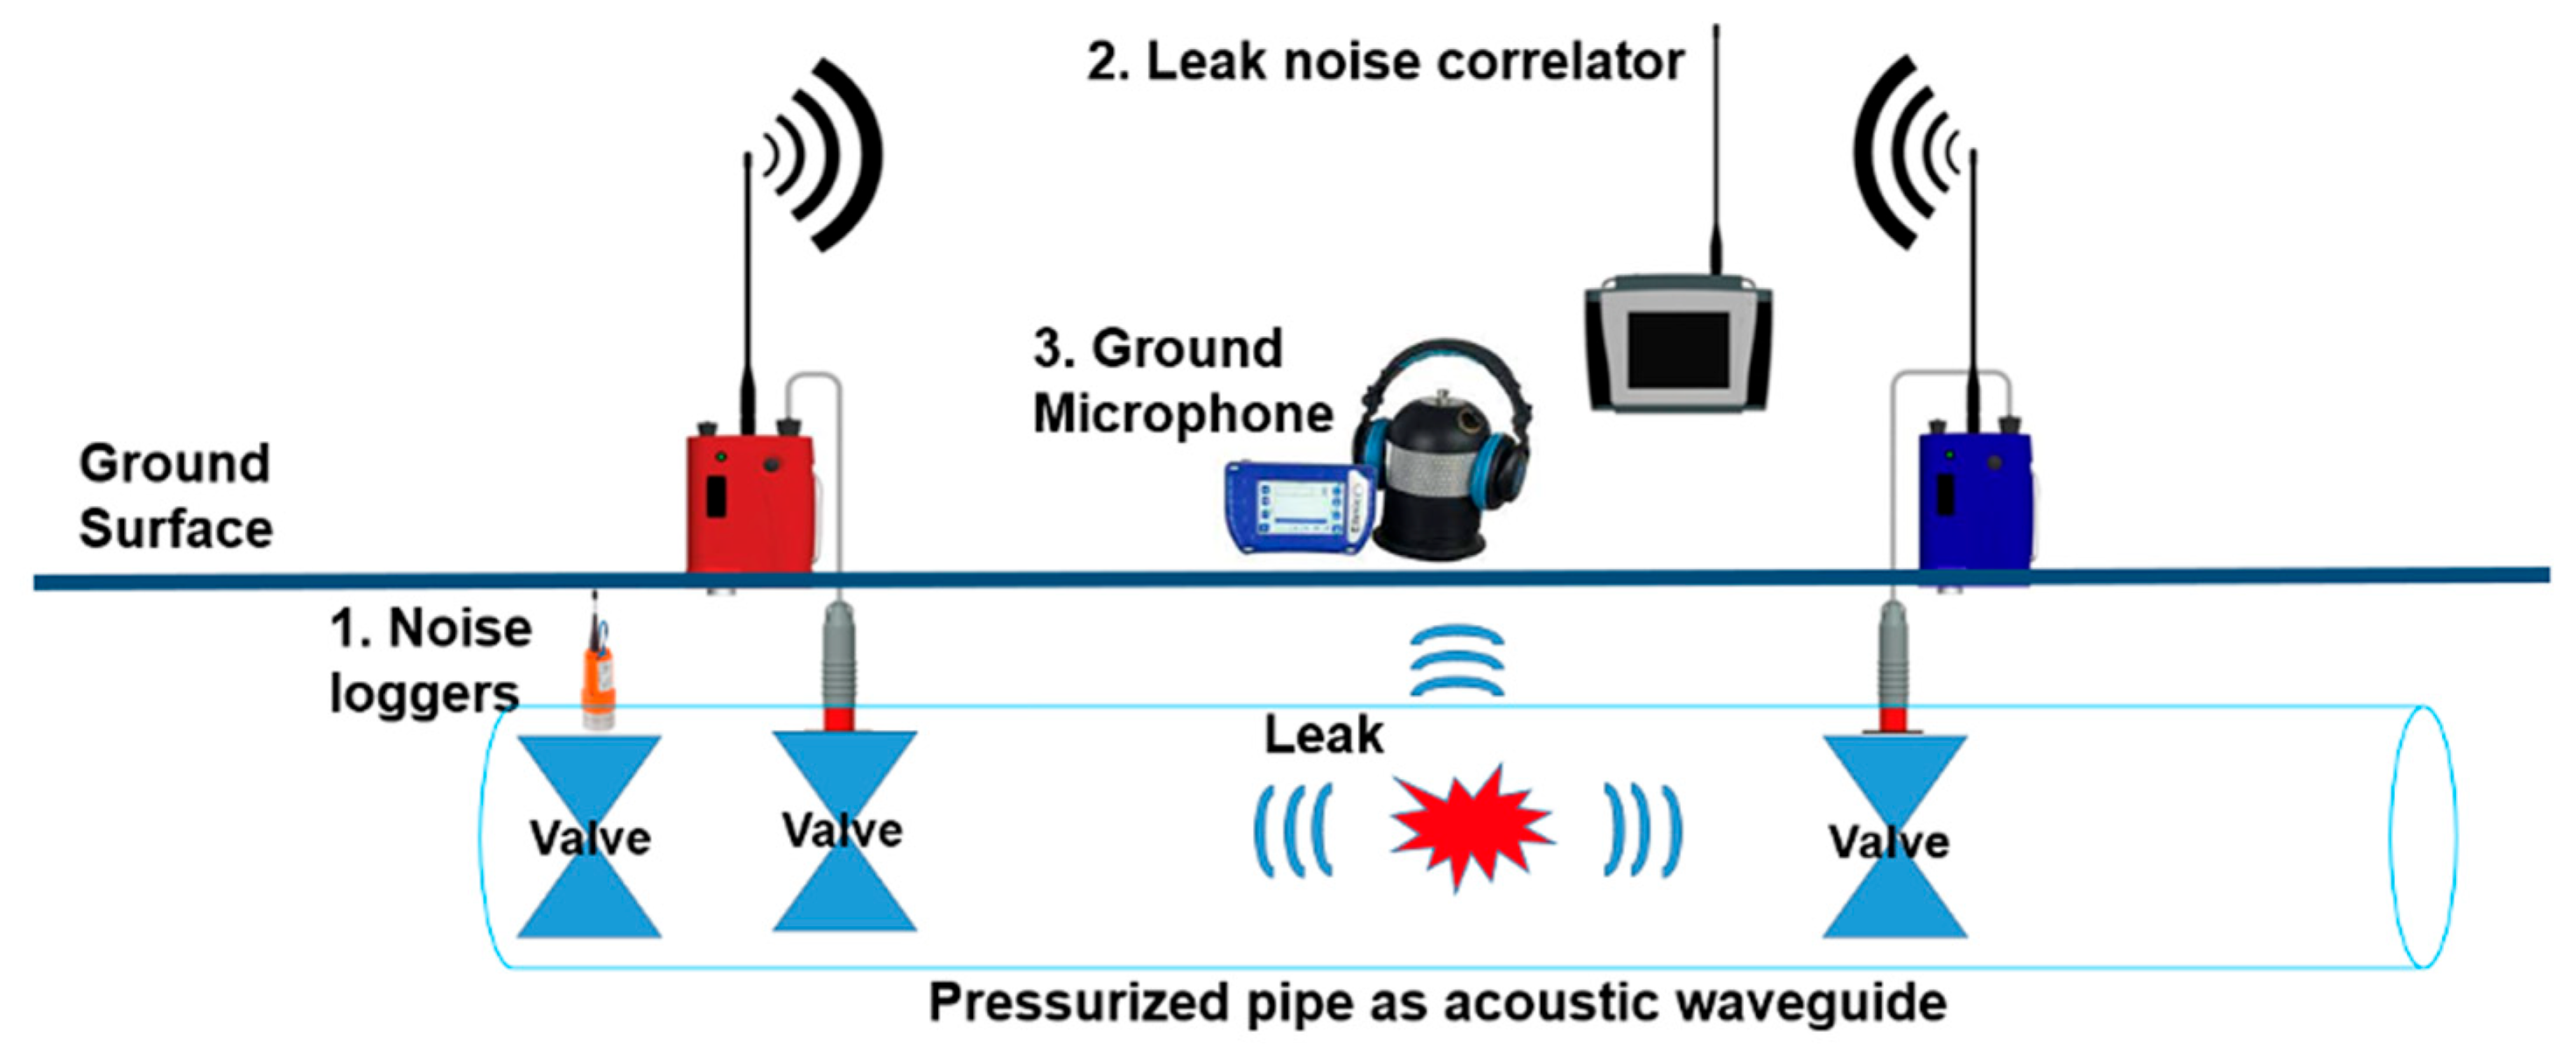
For the final stage, pinpointing, listening devices are handheld instruments used to pinpoint the location of a leak in a pipe by listening to the sound of escaping water from the water mains. Figure 2 illustrates the operation setup of the abovementioned technologies, including noise loggers, LNC, and ground microphones in real world scenario.
Figure 2.
Overview of ALD survey.
1.3. Workflow
The above-mentioned workflow is effective in detecting and pinpointing the leak from buried water mains. However, to date, there is no standard concerning the accuracy of ALD measurement, especially in the LNC survey. Although Land Surveying and Geo-Informatics (LSGI) of PolyU [22] specifies the LNC measurement result in ±1 m accuracy range with reliable surveyed pipe alignment (Table 1), the accuracy value is an expectation rather than a case-specific real measurement. The accuracy range could be influenced by various factors, including pipe materials, sizes, the distance between two accelerometers, and so forth. Therefore, this paper aims to develop an uncertainty model for leak detection in buried pressurized water mains using the LNC method in a well-controlled 250,000 sq.ft test site Q-leak in Hong Kong, and evaluate the uncertainty budget of LNC location errors to prioritize influence parameters. To ensure the actual location of leaks is known, the buried water mains have been thoroughly mapped and geo-referenced by laser scanning before backfill during the construction period of the Q-leak. Additionally, the flow pressure in Q-leak is 4 bar and is always constant. It means that with the ground-truth information available, the evaluation of accuracy and uncertainties could be well evaluated.
Table 1.
Recommended accuracy and quality levels of leak localization, locating, and pinpointing surveys using AE methods [22].
This paper has developed an uncertainty model and prioritized the influence factors for LNC measurement. The proposed method can lead to understanding and quantifying the uncertainties associated with LNC measurement, which can understand its measurement errors and uncertainties of the survey results by taking associated measures. Engineers or operators can better interpret the reliability of their measurements, leading to consistent decision-making across different situations and minimizing the risk of misidentifying the presence or absence of leakage.
2. Methodology of the Wave-Guided ALD
2.1. Experiment Site
In 2021, the Tsing Yi Q-Leak underground water mains leak detection training center (Q-leak), designed by the project team of this paper, unveiled a state-of-the-art 1:1 field experiment facility, providing a controllable environment for ALD experiments in pressurized buried water mains. The Q-Leak facility encompasses 344 m of pressurized water mains, including mild steel, ductile iron, galvanized iron, and high-density polyethylene, specifically designed to simulate real-life situations and provide a platform for on-site practices in leak detection of underground water mains and how the four constraints affect LNC measurement accuracy. The leak tee connected to gate valves when open, acoustic stress that initiates leak points, where the leak noise is distributed along the pressurized water main network as a waveguide. The water discharged from the leak points is released to a pipe drainage network connecting a pump sump to a water tank for toilet flushing in the Tsing Yi community.
In addition, the facility features a variety of pipe diameters ranging from 50 mm to 600 mm, constructed from both metallic and plastic materials, and is embedded in six different types of pavements. The mix-and-match scenarios further enhanced the site’s versatility and applicability to different real-world scenarios. One of the most significant advantages of the Q-Leak facility is its quiet environment, isolated from the noise of traffic and urban water, thereby simulating the best 2–4 am quiet night flow, which is crucial for acoustic leak detection.
2.2. Data Acquisition
This paper focuses on the uncertainty evaluation in LNC for leak localization in pressurized water mains. Figure 1 demonstrates a typical setup to implement LNC, wherein a pair of accelerometers, blue and red outstations, and a base unit are used. An outstation is connected with the accelerometer attached to the valve or surface feature (e.g., fire hydrants) of targeted water mains. The operation is to initiate at least two outstations into the water mains for capturing acoustic sound and calculating the time delay between two accelerometers. In this experiment, the LNC instrument “Touch Pro” was adopted. It is the latest model developed by the HWM-Water Limited from the United Kingdom.
For field operation, we captured sound files at two accelerometers for at least 3 min for a single correlation. The data acquisition was repeated at least 3 times to ensure robustness and reliability of the results. Throughout the process, it is essential to record a set of background noises as a control. This involves recording the sound data without opening any artificial leak point, serving as a baseline.
Q-Leak holds an accurate as-built record, including alignment information and the location of the artificial leak points. It provides the true answer of the ALD measurement, which allows us to calculate the accuracy and precision in the study. The experiment involved 7 sets of data, which cover various materials, diameters, and accelerometer distances. Moreover, the leak size is designed with 40 mm and a leak magnitude in the half-bore of the valve. The flow pressure remained at a constant 4 bar throughout the experiment. In addition, variations in pipe material and diameter can significantly impact fluid velocity, leading to increased uncertainty in wave speed determination. These uncertainties complicate the identification of influences, underscoring the need for further research in this area. To mitigate these complexities, the survey setup has been designed to maintain a consistent material and diameter, minimizing potential influences on wave speed measurements.
2.3. Data Processing
In this paper, the data processing stage has been divided into two parts. The first part employs a cross-correlation function to determine the estimated time delay and leak location. The second part utilizes an error propagation model and sensitivity coefficient function to quantify the uncertainty budget and prioritize the influential factors affecting each measurement. This workflow facilitates operators in evaluating the reliability and confidence of the LNC results, offering crucial insights for enhancing accuracy by identifying and mitigating influential factors.
2.3.1. Cross-Correlation Function
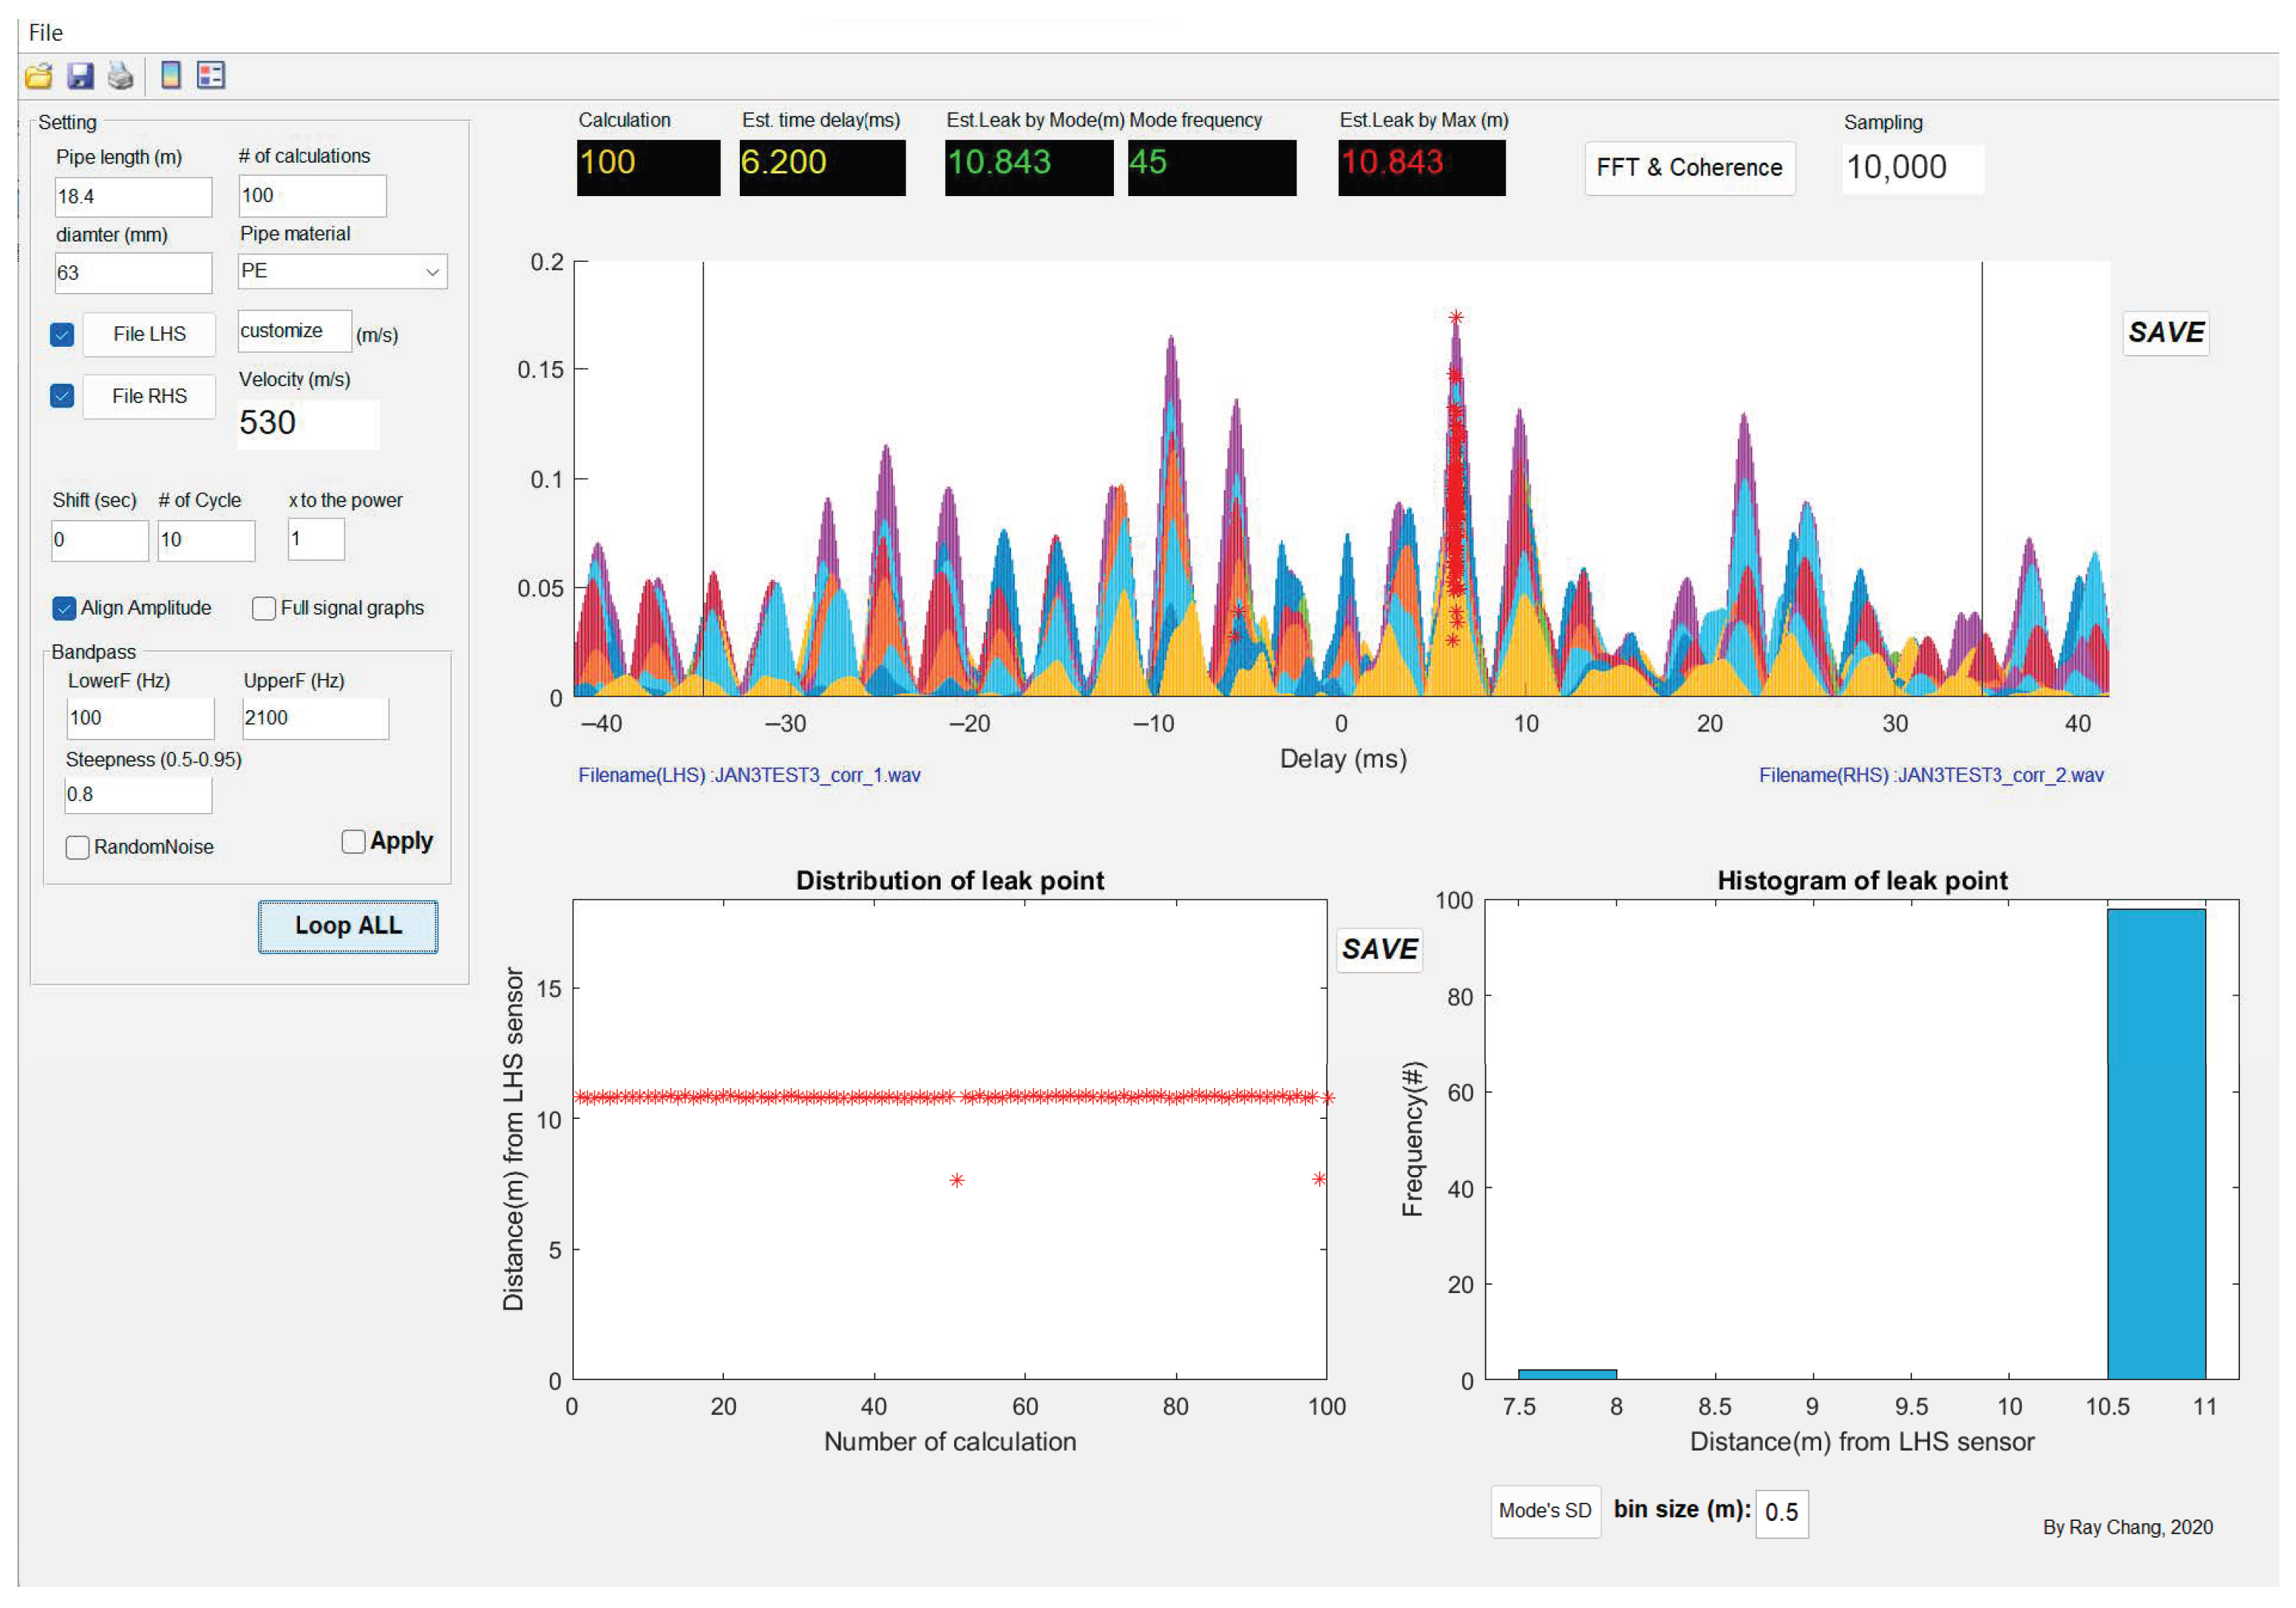
In common practice, the main unit of the LNC typically calculates estimated time delays and leak locations using cross-correlation functions. However, the algorithm within the main unit is based on one-time calculations, which can lead to inaccuracies influenced by factors such as poor surrounding environmental conditions. To address this challenge, a universal in-house program has been developed for all brands of LNC sound files (Figure 3). This program offers additional flexibility and advanced features for leak location calculations, tailored to meet specific requirements and environmental variables. These features include multiple calculation iterations, adjustable cycle counts, and customizable band-pass filter settings.
Figure 3.
Example of good condition indicating possible leakage.
In leak location estimation, the in-house program generated graphic information that displays the understanding and interpretation of the acoustic data. The bottom left box in Figure 3 represents the distribution of the leak signal. It shows the relationship between the distribution of leak points in terms of their distance from the left-hand signal (LHS) accelerometer and the number of calculations performed, thus allowing users to observe the spread and concentration of estimated leak locations. For the bottom right box, the histogram represents the distribution of the most correlated signals from the LHS and RHS accelerometers. Projecting a visible GUI enables the user to identify the trends and patterns for further analysis.
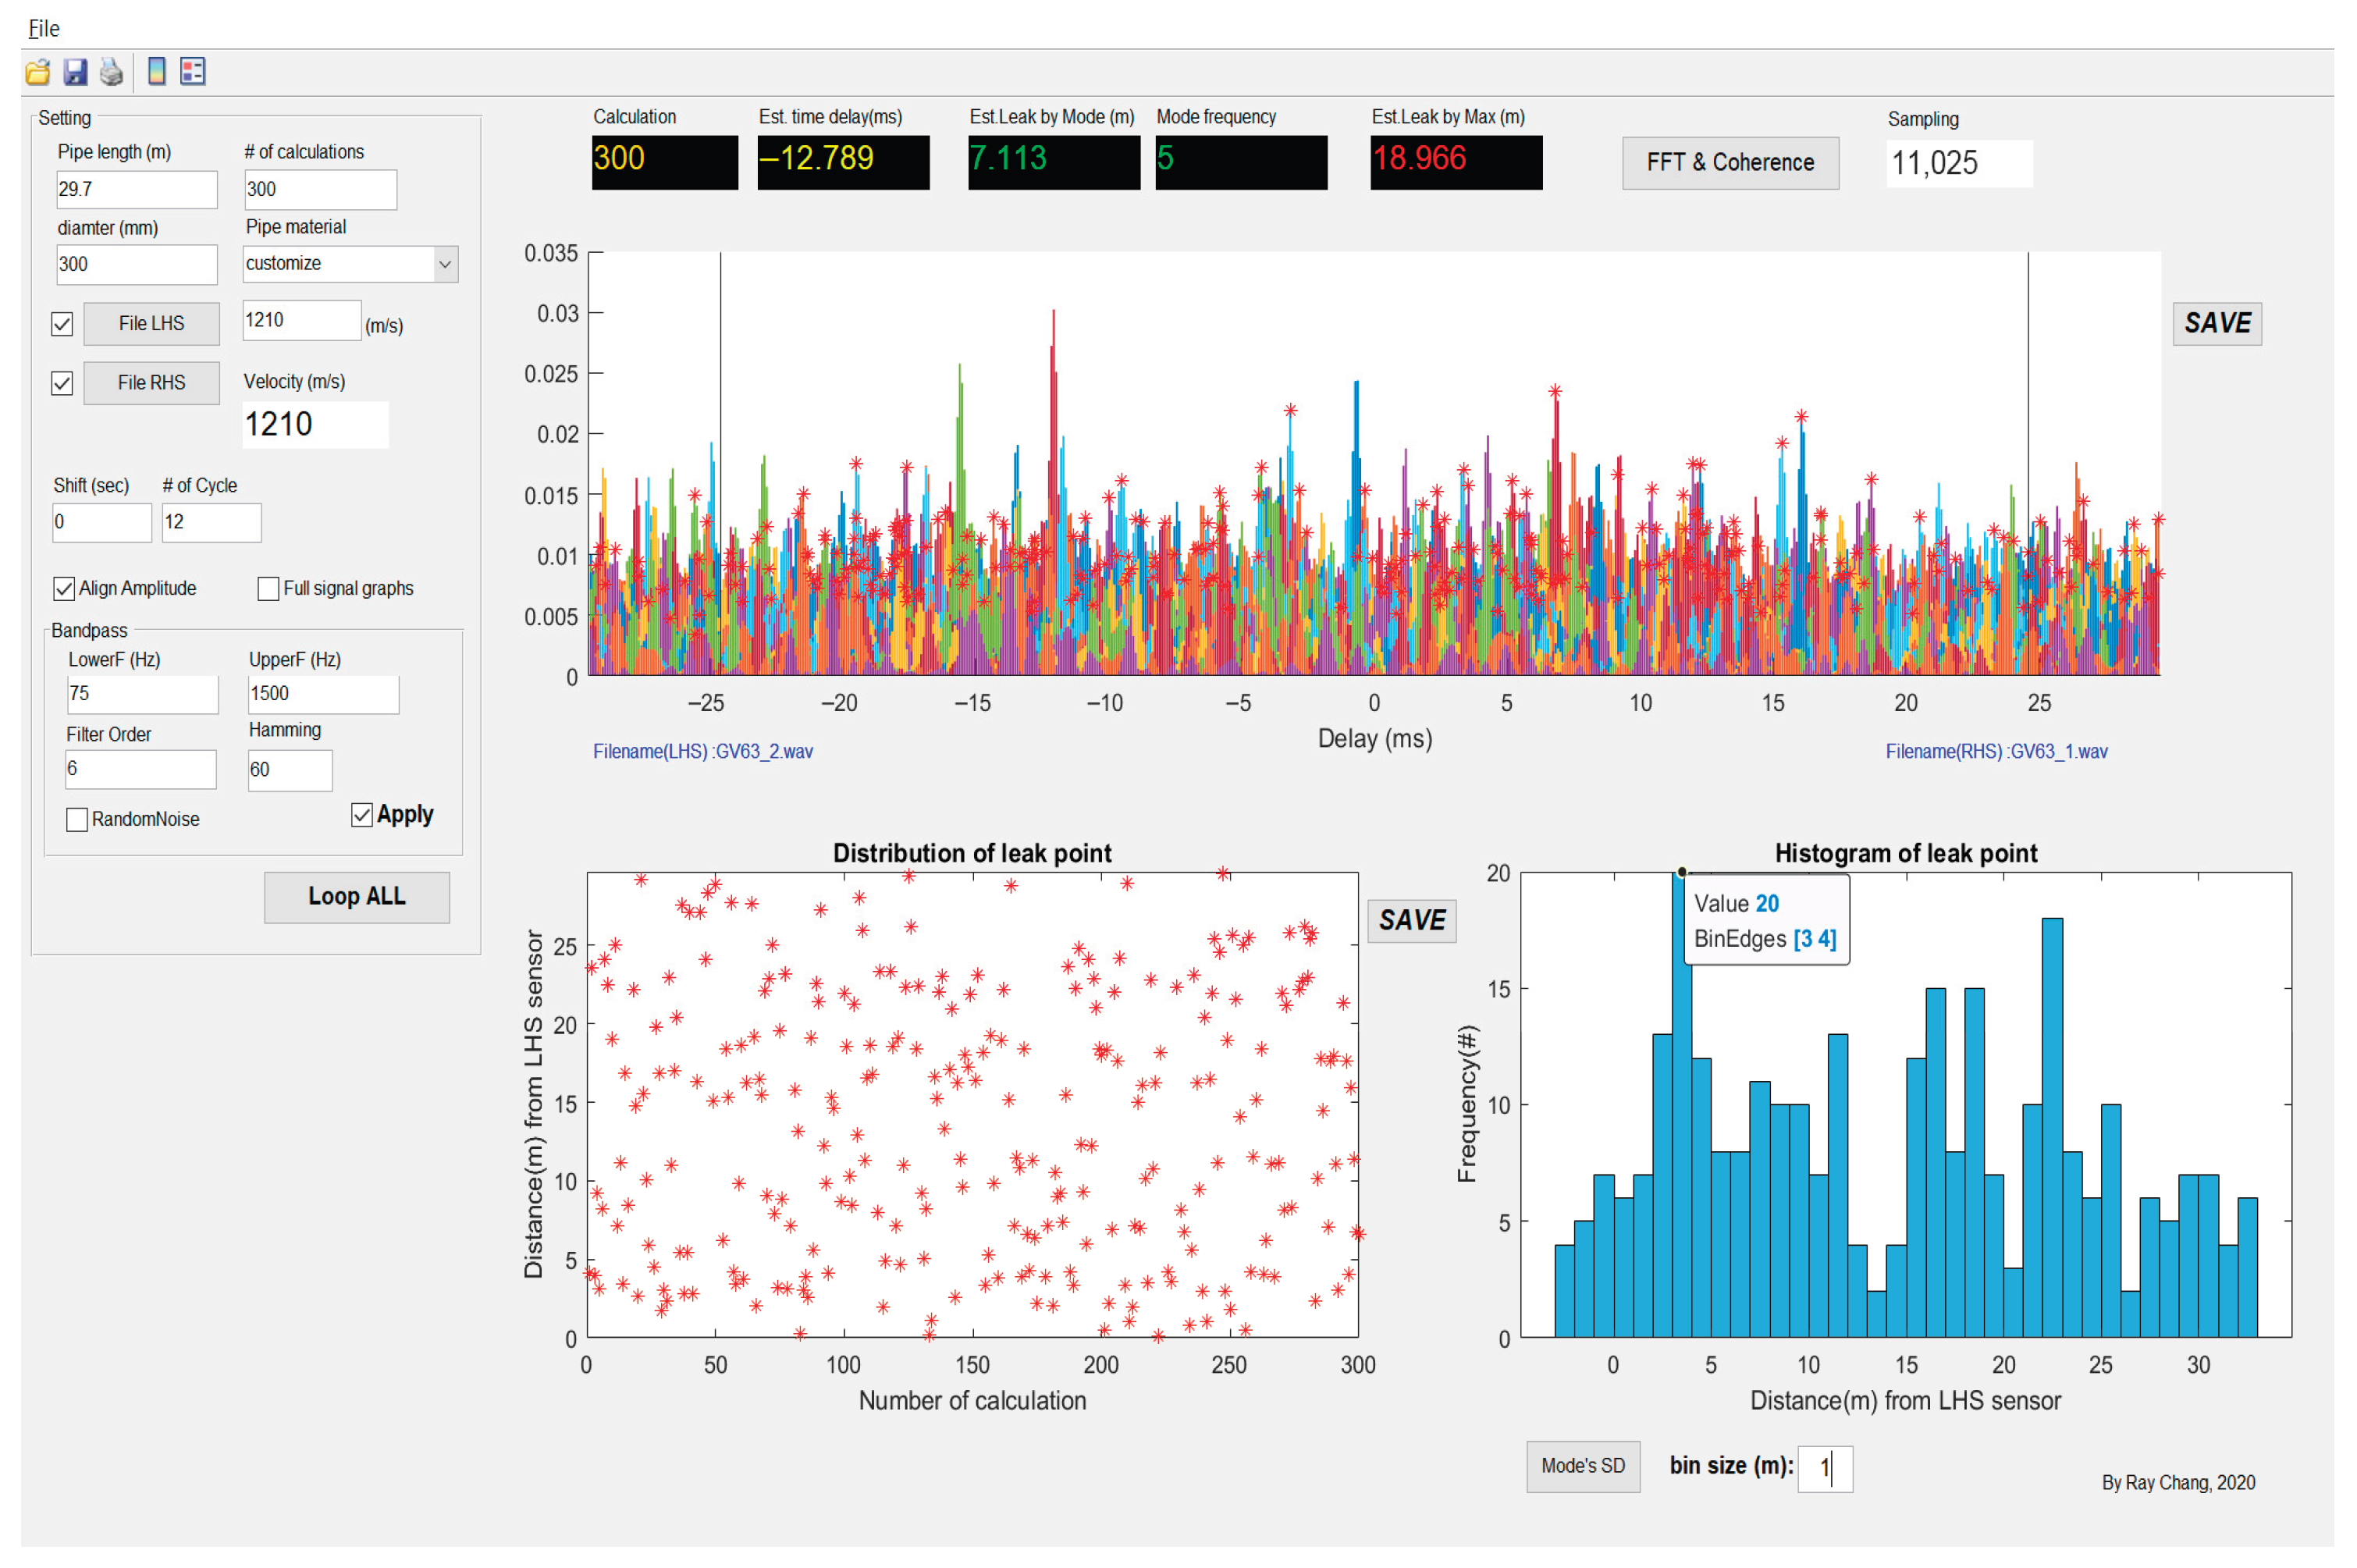
For example, in Figure 3, a consistent red dot appearing in the lower left box indicates that, during the 100 calculations, 98% of the estimated leak locations fell within 10.5 m to 11 m. This provides strong evidence and confidence in the accuracy and consistency of the measurement. On the contrary, in Figure 4, the red dot of the bottom left box indicates a random pattern. This randomness suggests a weak correlation between the acoustic data from the two accelerometers. In this case, no leakage could be identified.
Figure 4.
Example of unsatisfactory correlation indicating no leakage.
2.3.2. Uncertainty Propagation and Evaluation of Combined Uncertainties
To quantify the uncertainty of LNC measurement, the error propagation method will be considered. Before the calculation, all parameters from Equations (1)–(3) are assumed to be independent factors. Substituting all the cross-specific parameters, the uncertainty can be propagated and calculated by Equation (4) of the uncertainty of the distance between the first LNC accelerometer and the leak point.
where the following are defined:
- = uncertainty of distance between the first LNC accelerometer and the leak point;
- = 95% coverage factor;
- = partial derivative of distance between the first LNC accelerometer and the leak point;
- = partial derivative of wave speed;
- = uncertainty of wave speed (calculated by Equation (8));
- = partial derivative of time delay;
- = uncertainty of time delay, which is the standard deviation of the measurement;
- = partial derivative of the total distance between two o accelerometers;
- = uncertainty of the total distance between two accelerometers, which is the standard deviation of the measurement.
The following equations are the differentiation product of Equation (4) by differentiating Equation (1) and substituting with if a peak at the correlation graph can be identified.
Sensitivity coefficient of the distance between the leak point and the accelerometer A with respect to wave speed:
Sensitivity coefficient of the distance between the leak point and the accelerometer A with respect to time delay:
Sensitivity coefficient of the distance between the leak point with respect to the total distance between the two accelerometers:
The uncertainty of wave speed is separated for further calculation. Those factors are influencing the result of wave speed, which includes fluid velocity, pipe radius, bulk modulus, Young’s modulus, and pipe wall thickness.
Equation of the combined uncertainty of wave speed, where the following are defined:
- = uncertainty of wave speed;
- = 95% coverage factor;
- = partial derivative of wave speed;
- = partial derivative of fluid velocity;
- = uncertainty of fluid velocity;
- = partial derivative of pipe radius;
- = uncertainty of pipe radius;
- = partial derivative of bulk modulus;
- = uncertainty of bulk modulus;
- = partial derivative of Young’s modulus;
- = uncertainty of Young’s modulus;
- = partial derivative of pipe wall thickness;
- = uncertainty of pipe wall thickness.
The following equations are the differentiation product of Equation (4).
Sensitivity coefficient of wave speed with respect to fluid velocity:
Sensitivity coefficient of wave speed with respect to the pipe radius:
Sensitivity coefficient of wave speed with respect to the fluid bulk modulus of elasticity:
Sensitivity coefficient of wave speed with respect to the Young’s modulus of the pipe wall material:
Sensitivity coefficient of wave speed with respect to the wall thickness:
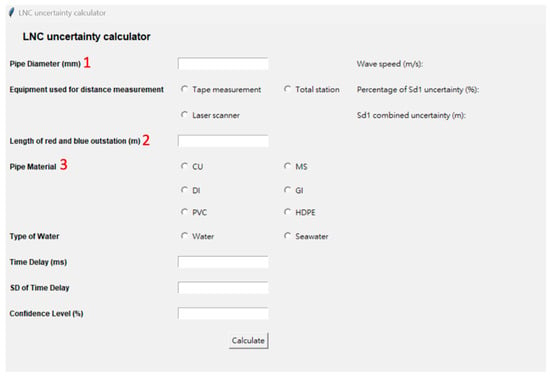
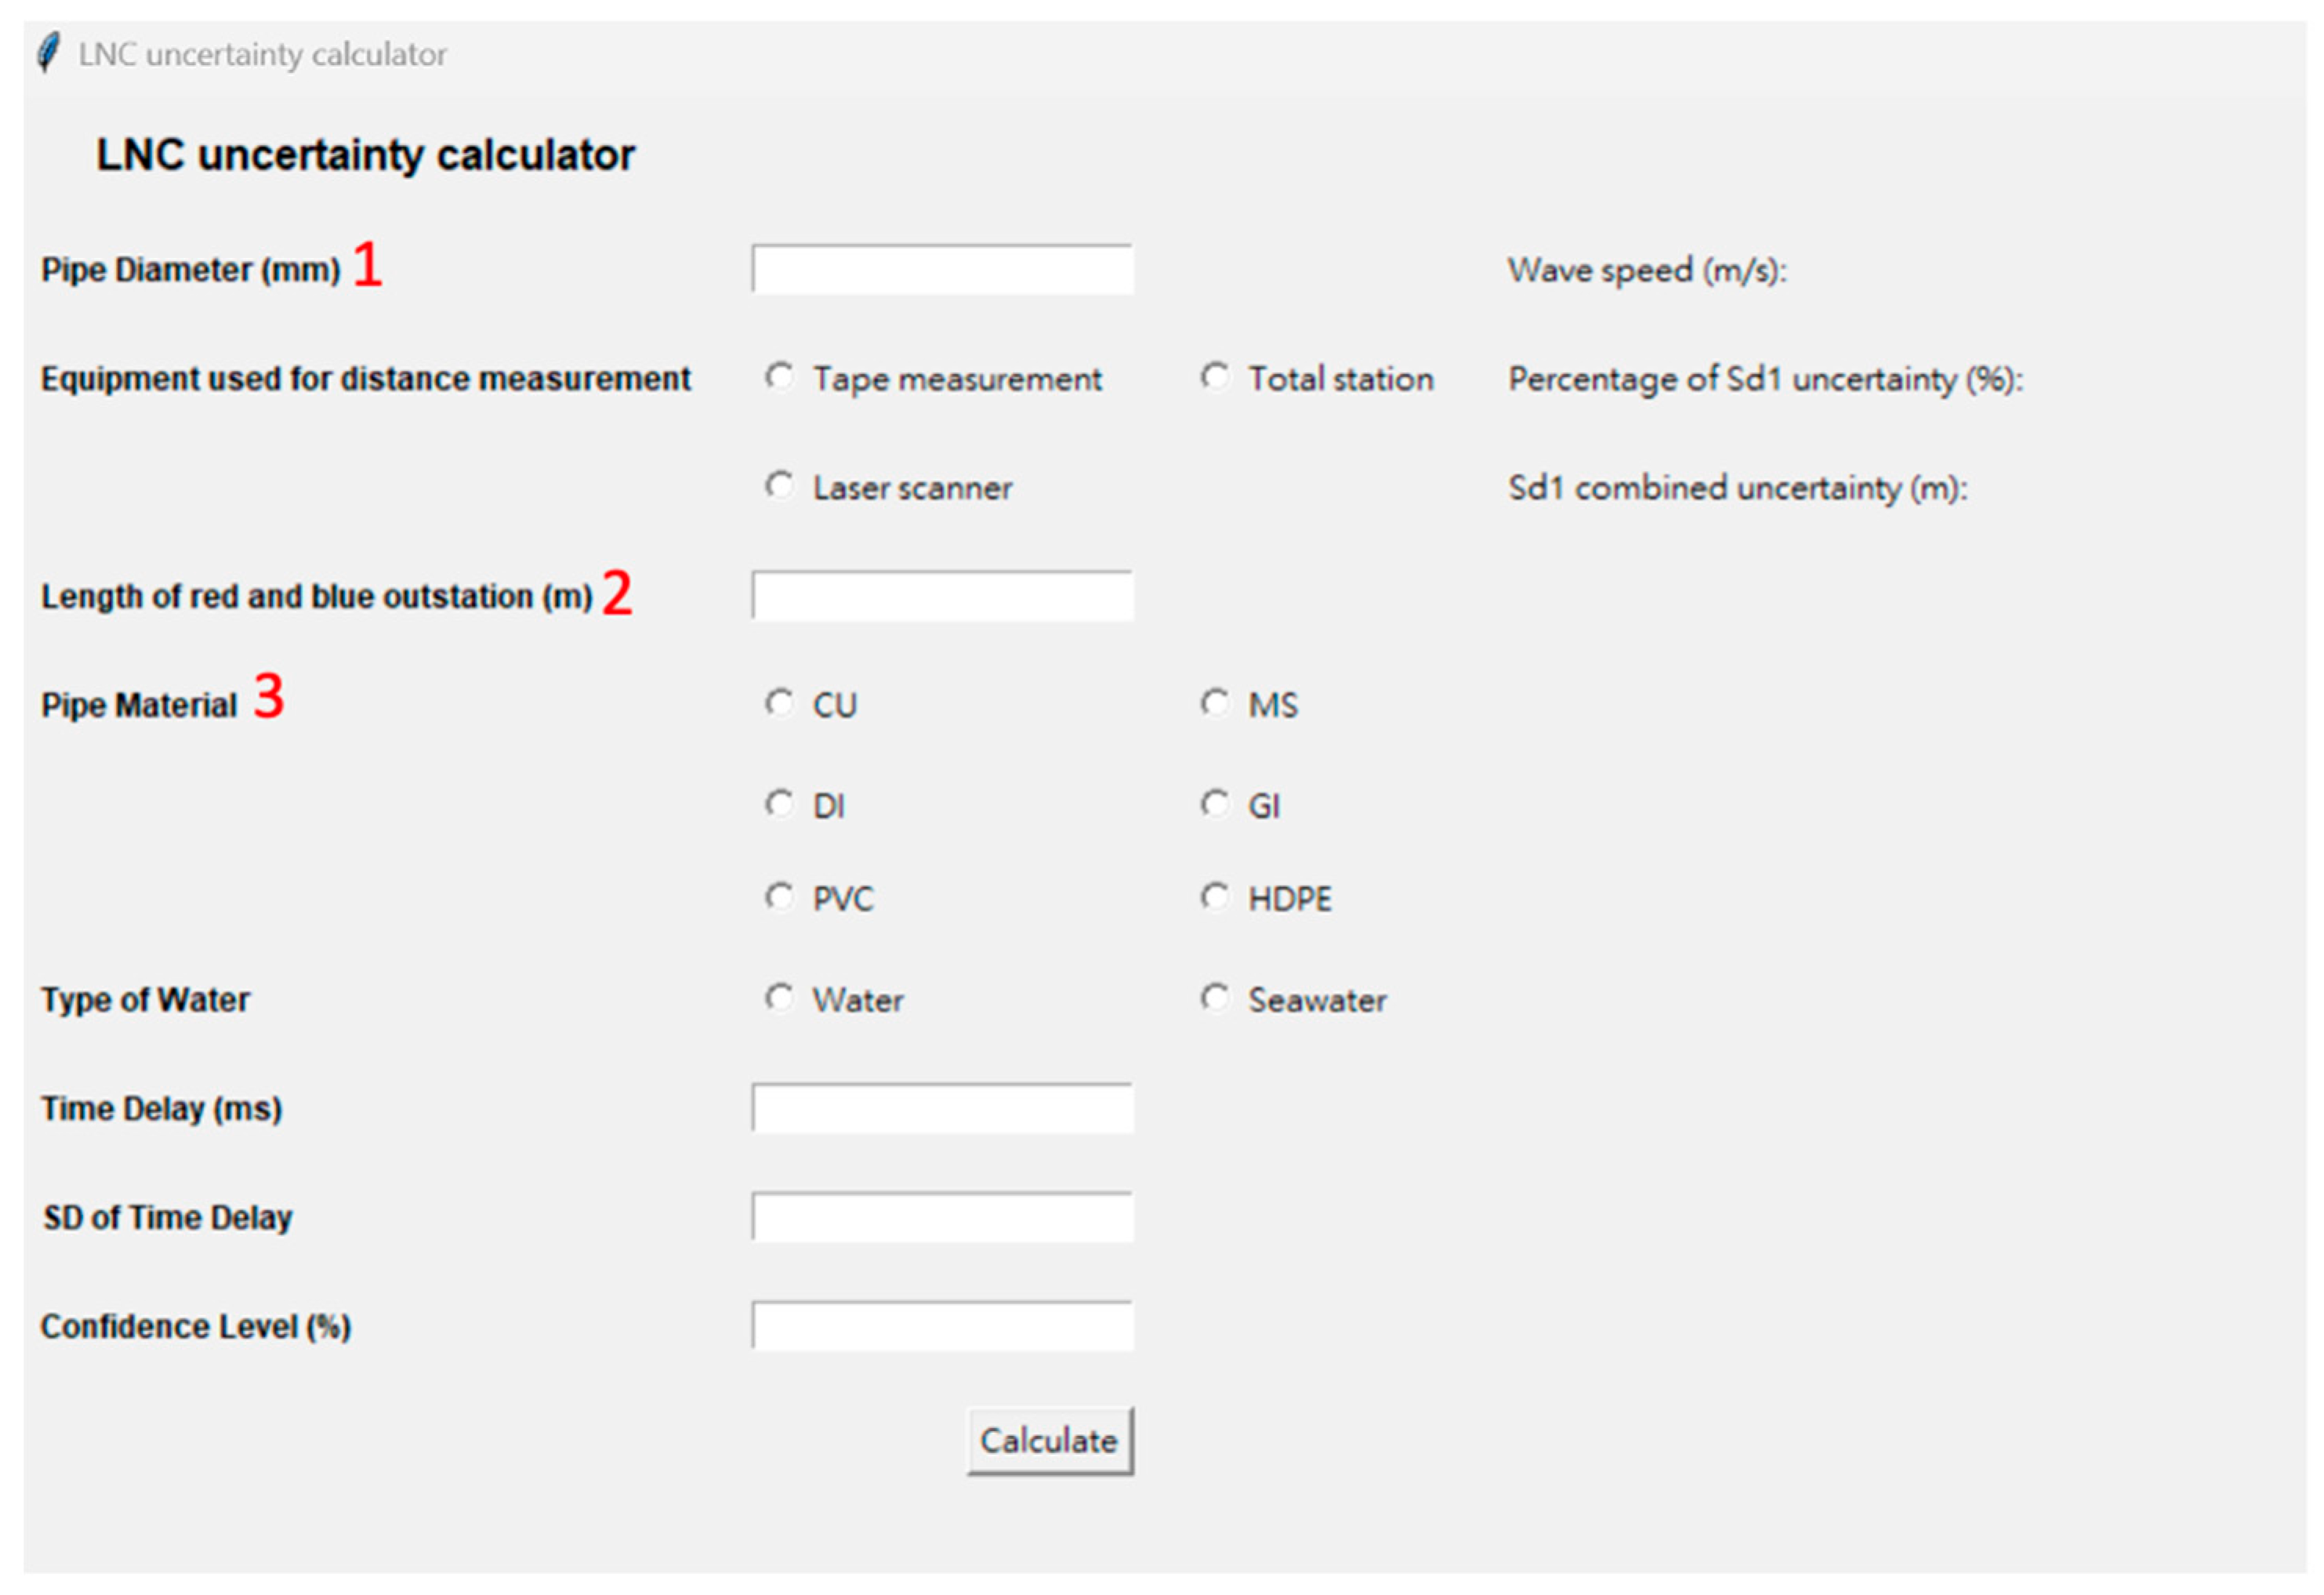
To accurately estimate the uncertainty associated with LNC measurement, several pieces of information are required for calculation, including pipe diameter, the distance between two accelerometers, pipe material, fresh or salt water, time delay, standard deviation of time delay, and confidence level of the measurement, which is defaulted to be 95% [25]. The 95% confidence level is frequently utilized in the Gaussian distribution as it provides a balance between a high degree of confidence in the results and a reasonable allowance for some degree of error. The interface of the uncertainty calculator is depicted in Figure 5.
Figure 5.
The graphical user interface of the uncertainty calculator. 1: Assume that there is no change in pipe diameter between two accelerometers. 2: Assume the no. of bends between two accelerometers is smaller than or equal to two and the bend angle is larger than or equal to 135°. 3: Assume that there is no change in pipe material between the two accelerometers.
2.3.3. Development of Uncertainty Calculator
For distance measurement between accelerometers at the outstations, tape measurement, total station, and laser scanner of exposed pipe, if any, were taken into account. Each method has its own measurement tolerance. For measurements conducted with a total station, the program follows the accuracy requirements outlined in the local Land surveying and engineering Board [26]. According to this reference, the accuracy requirement for water mains record surveys is ±50 mm for horizontal alignment. This tolerance is used to calculate the uncertainties associated with measurements taken using a total station. In the case of laser scanning surveys, the program adheres to LSGI [27]. This specification sets the accuracy requirement for laser scanning surveys at ±100 mm for horizontal alignment of exposed alignment. However, tape measurement lacks a defined industry standard for survey tolerance. As a result, the program does not assign a specific value for tape measurement in terms of uncertainty estimation.
For wave speed ‘v’ in Equation (3), there are three influential factors, namely pipe characteristics: (1) pipe wall thickness ‘h’, associated radius ‘a’, and material property; (2) Young modulus of pipe wall materials ‘E’ and fluid properties; (3) fluid bulk modulus of elasticity ‘B’. For (1), the standard table is referenced [28]. For (2), copper (CU), mild steel (MS), ductile iron (DI), galvanized iron (GI), polyvinyl chloride (PVC), and high-density polyethylene (HDPE) are considered. The selection of material is important as it determines the value of Young’s Modulus (E), which has a significant impact on the wave speed in Equation (3). The values of Young’s Modulus for the different materials were assumed to be 128 for CU, 210 for MS, 165 for DI, 200 for GI, 4 for PVC, and 1 for HDPE, as referenced by [29]. By knowing the pipe material, the corresponding Young’s Modulus is assigned. This precision facilitates accurate calculations of the wave speed, leading to a more refined estimation of uncertainties in the subsequent analysis.
For (3), the prior knowledge of fresh or salt water in the LNC measurement process plays an important role in determining the propagation of both the bulk modulus (B) and the wave speed (). With reference to [30], the bulk modulus of freshwater is 2.15 and seawater is 2.2 . For the wave speed, freshwater is 1480 (m/s), and seawater is 1520 (m/s). Table 2 summarizes the uncertainties of parameters.
Table 2.
Summary of uncertainties of parameters.
Sensitivity coefficients were computed for the assessment of the impact of uncertainties in input variables on the uncertainty of output variables by taking a partial derivative of the output variables with respect to each input variable [31]. A larger sensitivity coefficient signifies that even a slight alteration of the input variables will lead to a significant change in the output variable. Conversely, a smaller sensitivity coefficient indicates that variations in the input variable have a minor effect on the overall uncertainty. To estimate the uncertainty budget of the LNC measurement, the sensitivity coefficients were case-specific in every measurement.
3. Results and Discussion
3.1. Result Overview
Comprehensive information, including cross-correlation results and uncertainty ranges are presented in the summary table of each artificial leak point. The results are presented in four types, as follows: 1. highly accurate and highly precise measurement, 2. highly precise but not accurate measurement, 3. highly accurate but not precise measurement, and 4. not accurate and not precise measurement.
3.2. Highly Accurate and Highly Precise Measurement
3.2.1. Leak Point LP48 and LP4C
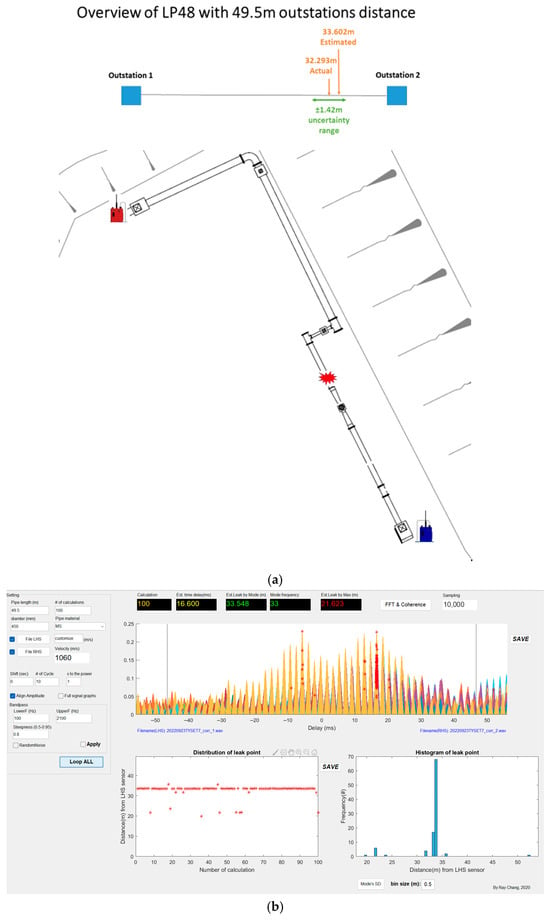
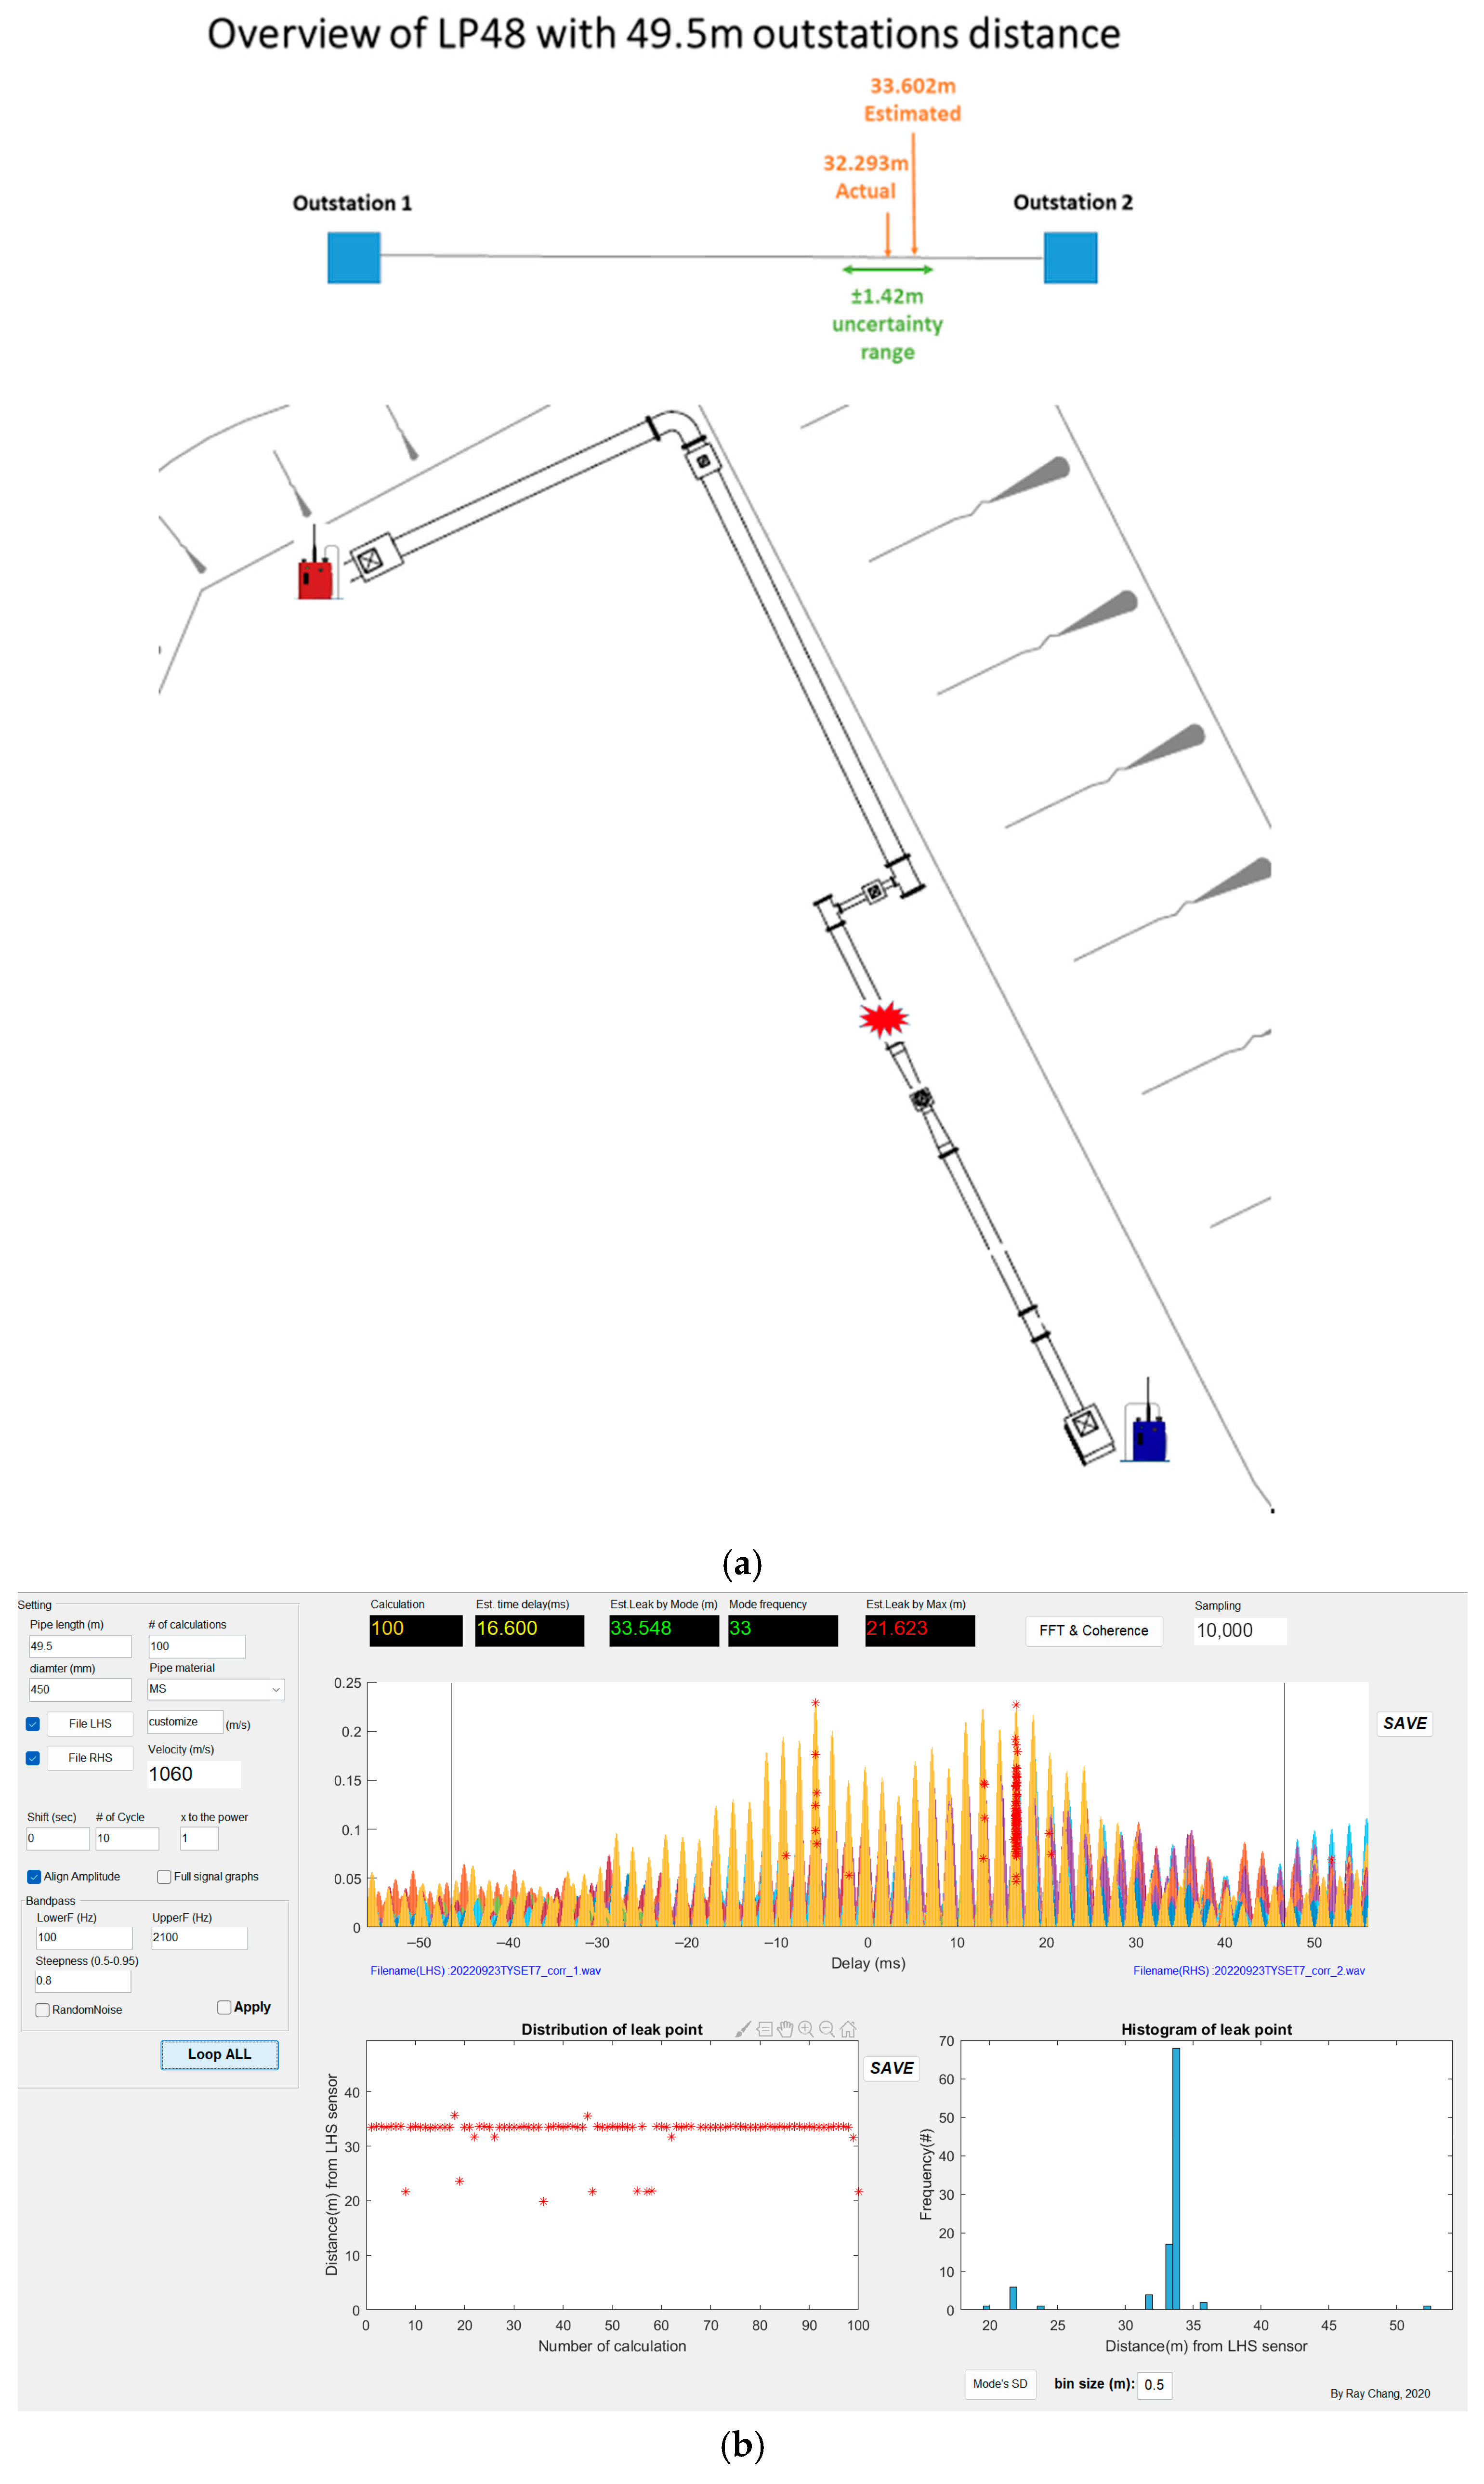
The artificial Leak Point 48 is connected to 450 mm mild steel water mains. The survey setup with a 49.5 m station distance is performing well in terms of the estimated time delay and estimated leak location. Both result in a stable status, which indicates a strong coherence between each accelerometer and a significant noise signal that can be distinguished in cross-correlation analysis. Comparing the results with the actual leak location provided, which is 32.293 m from accelerometer A to the leak, the average discrepancy was found to be −1.309 m. This discrepancy falls within the measurement uncertainty of ±1.42 m with 95% confidence level. Therefore, LP48 with 49.5 m accelerometers distance measurements demonstrates high accuracy and precision. The overview and correlation result is presented in Figure 6a,b.
Figure 6.
(a). Overview of LP48. (b). Cross-correlation result of LP48.
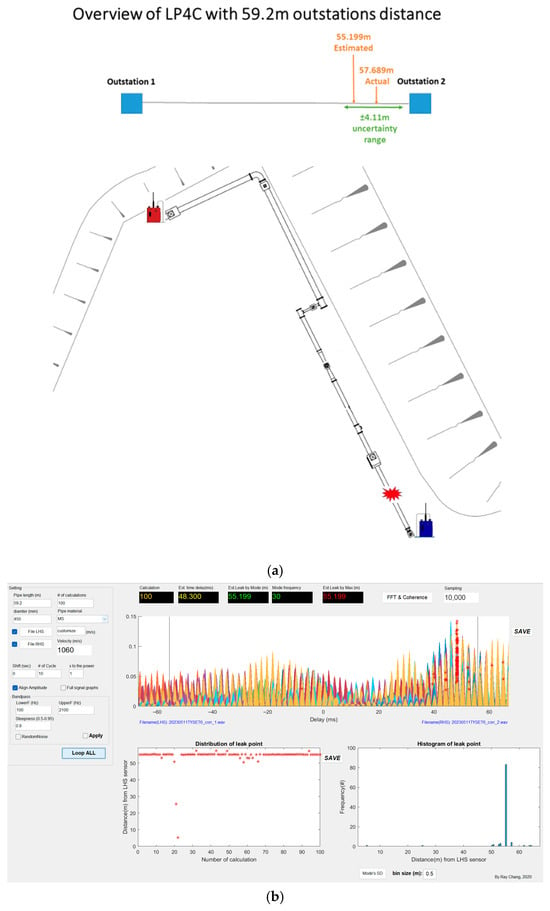
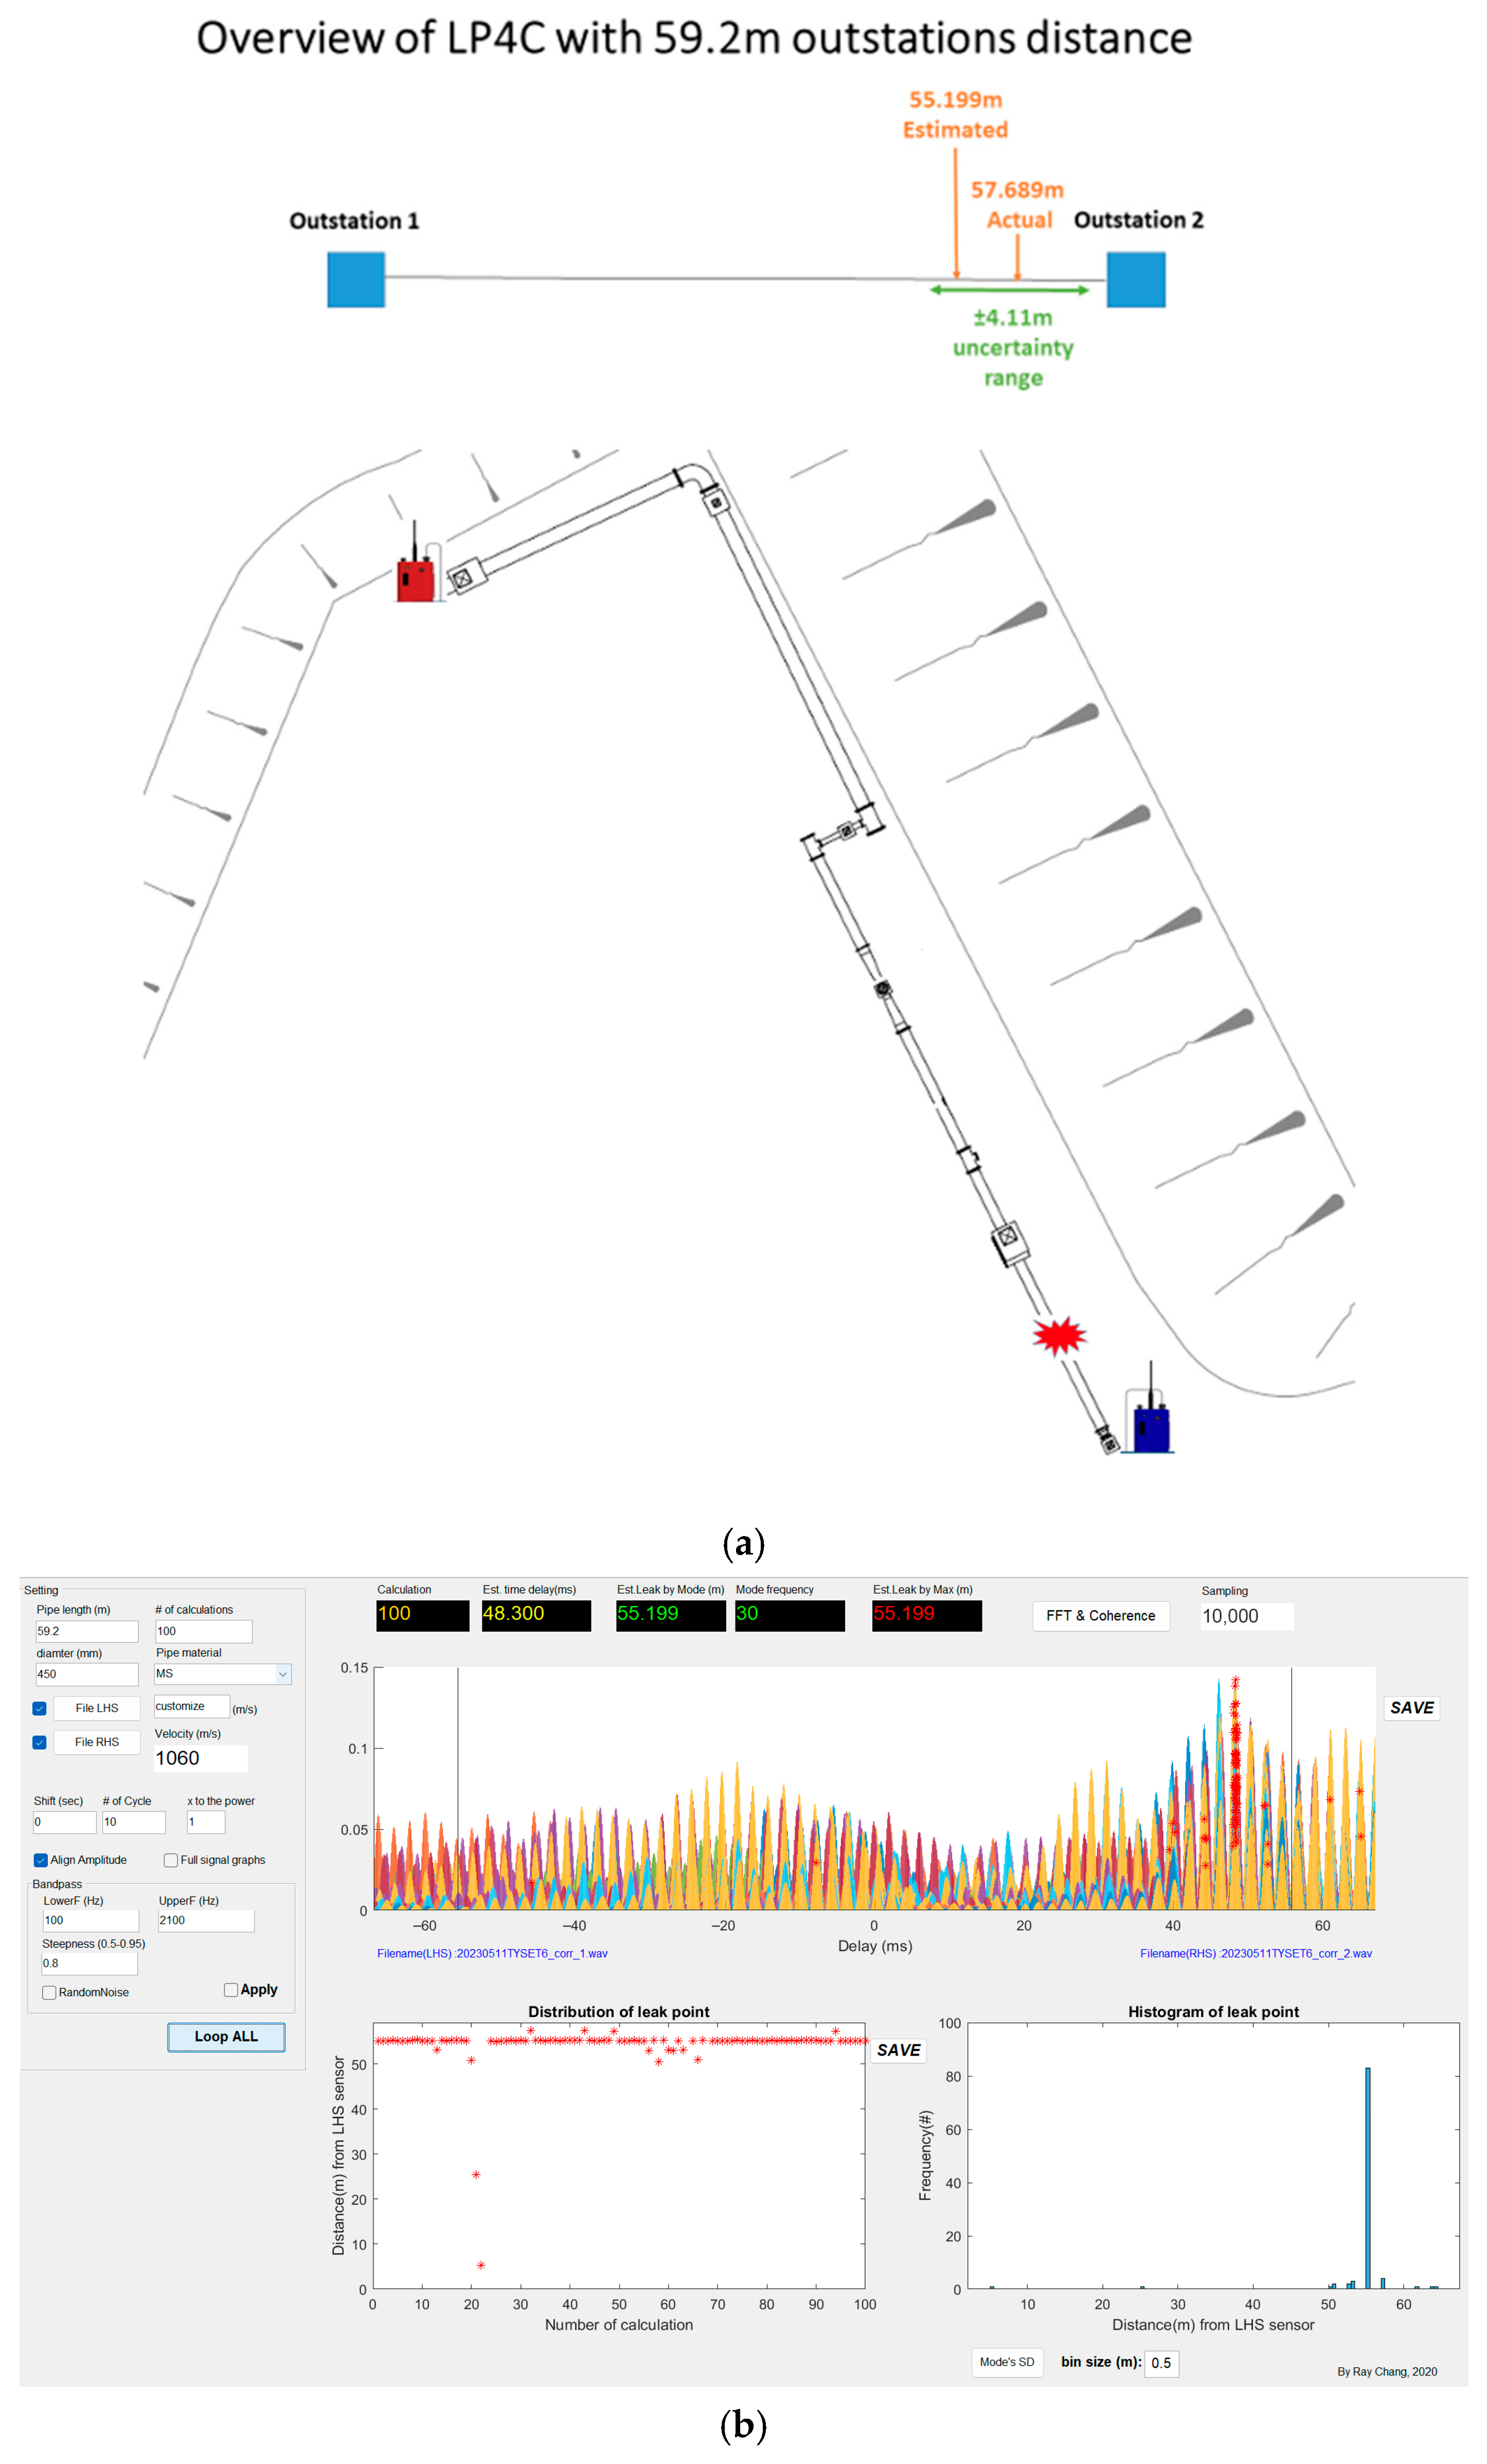
The second example is LP4C, which is also connected to 450 mm mild steel water mains. The station distance is 59.2 m with the same location. The overview and correlation results are presented in Figure 7a,b. The measurement result was performed with a stable and repeatable estimated time delay and estimated leak location in the cross-correlation function. The discrepancy between the actual leak and the estimated leak is 2.49 m, which falls within the measurement uncertainty of ±4.11 m with a 95% confidence level. In conclusion, the measurements of LP4C demonstrate high accuracy and precision.
Figure 7.
(a): Overview of LP4C. (b): Cross-correlation result of LP4C.
3.2.2. Leak Point LP5D
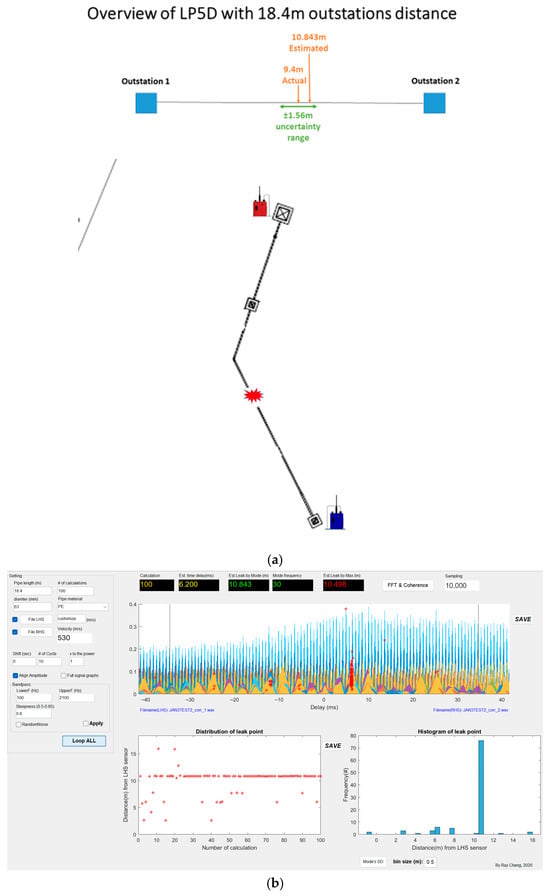
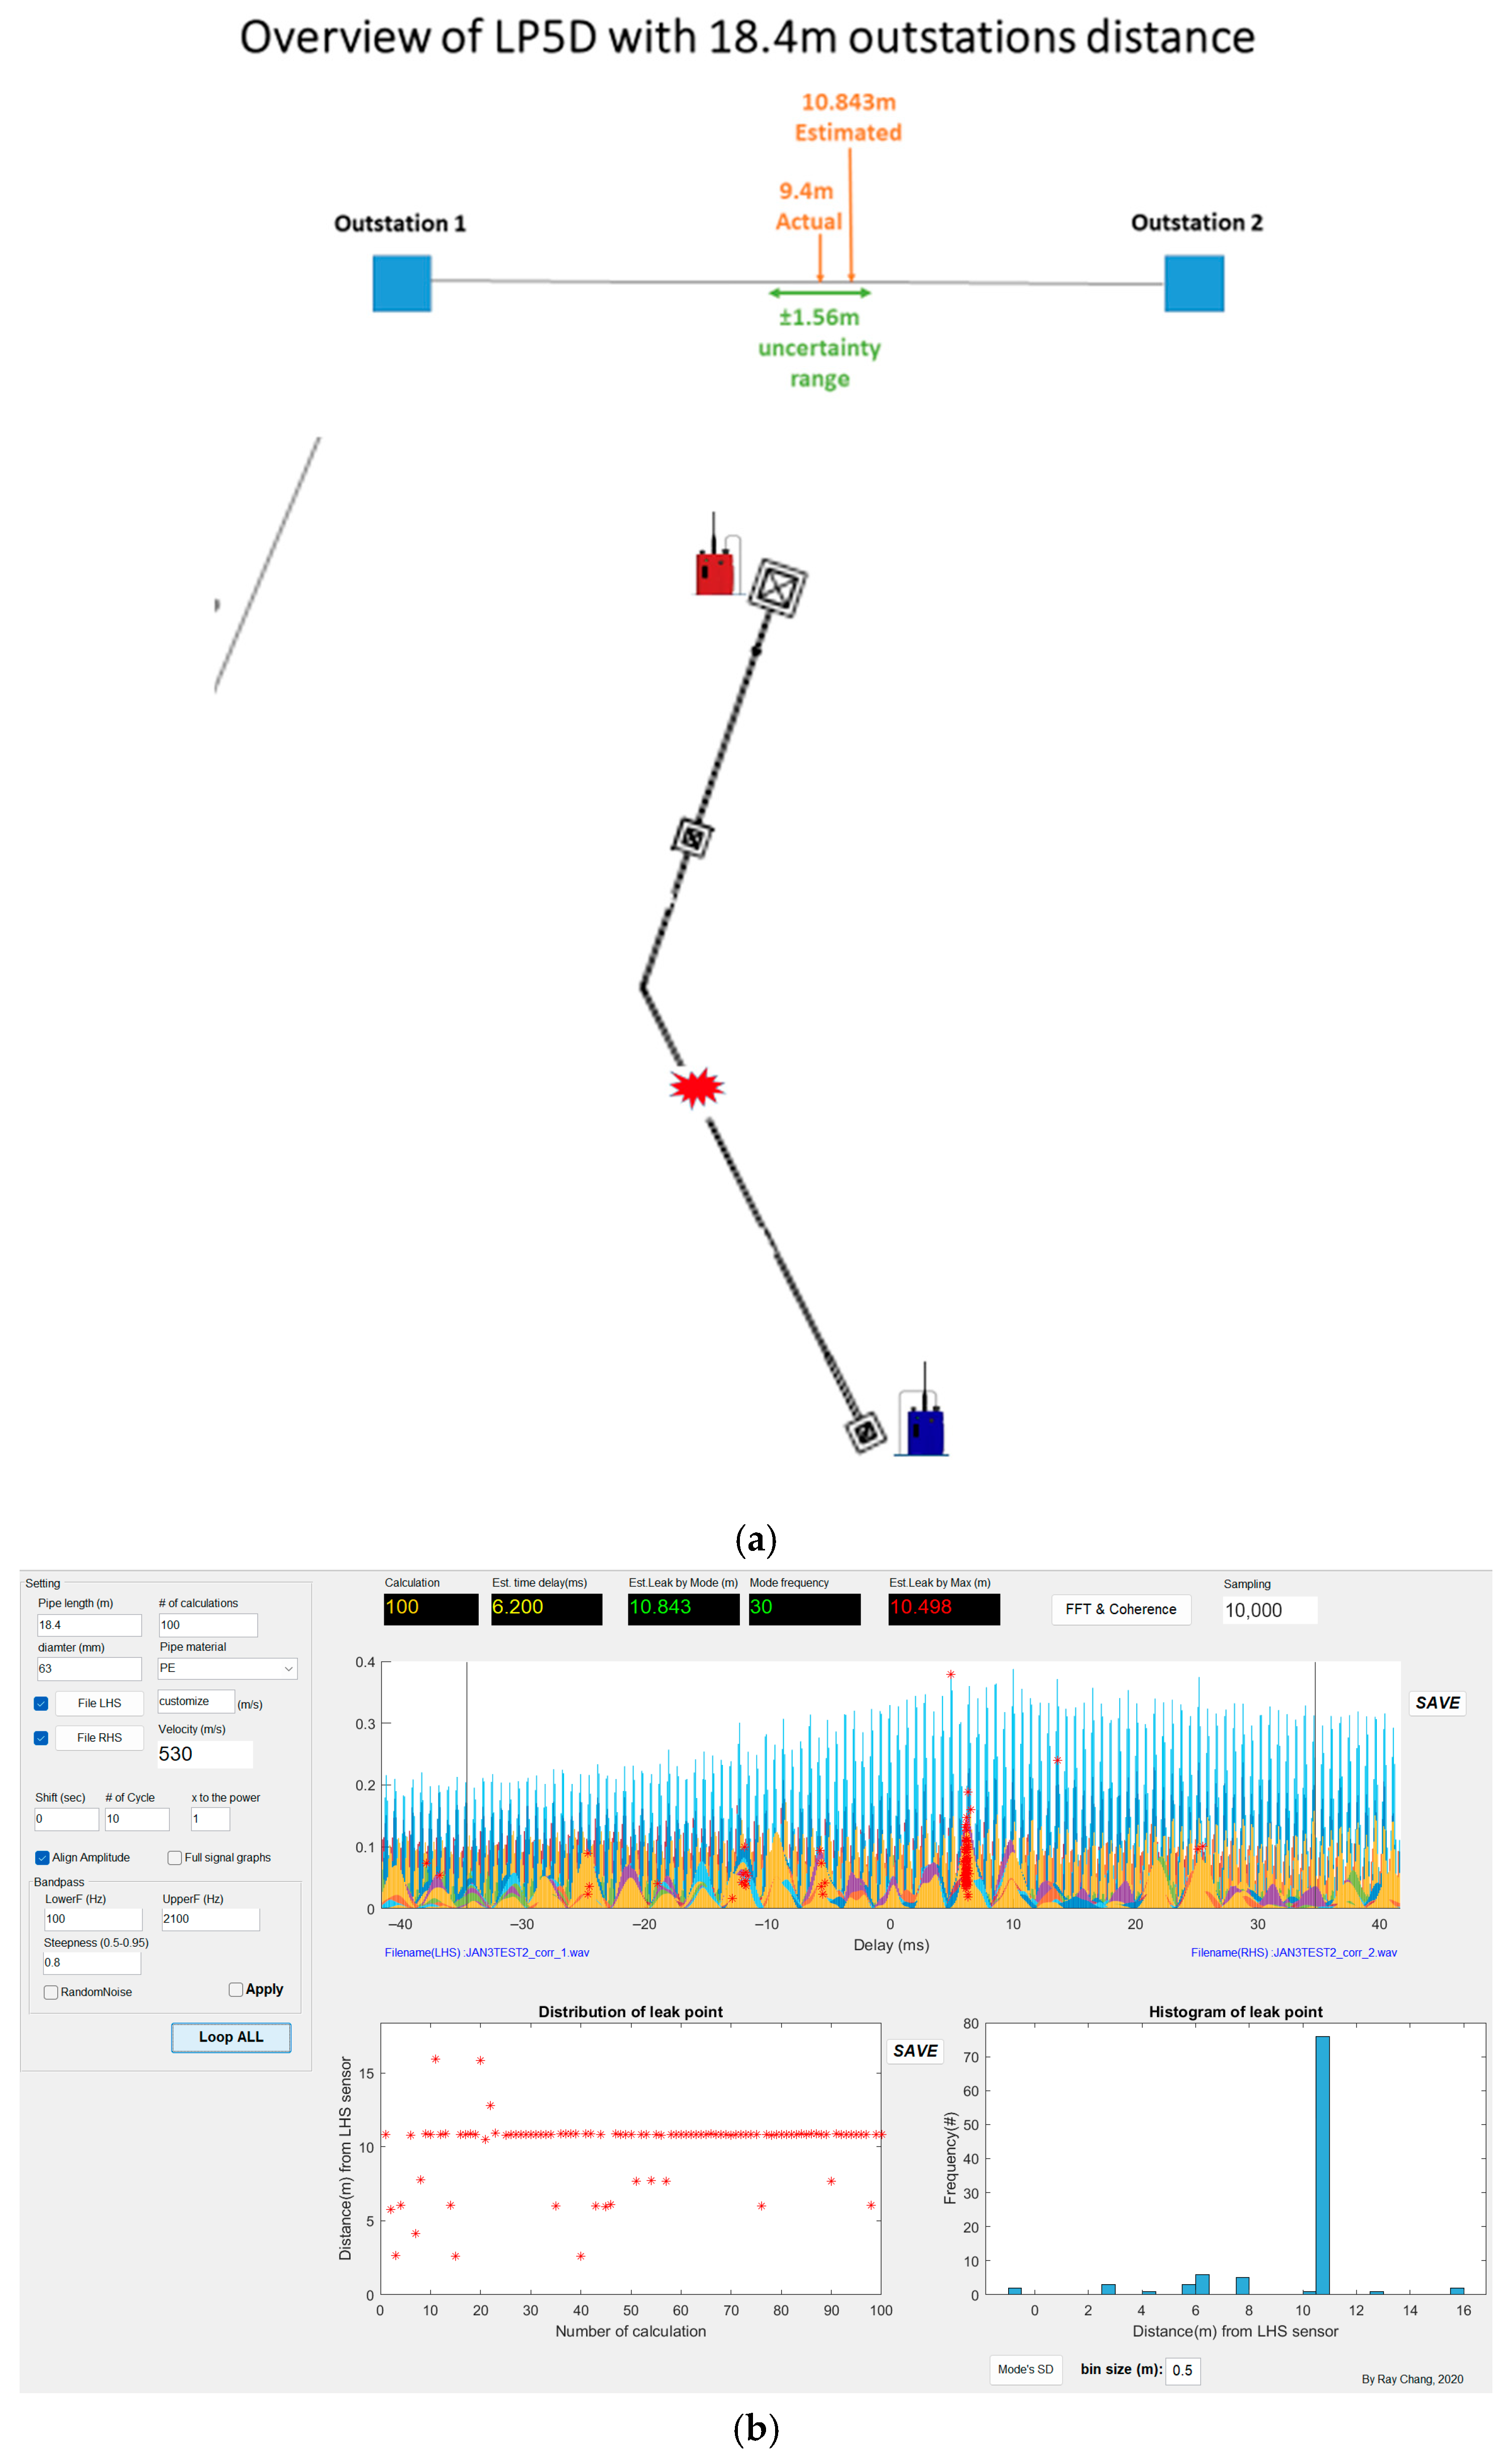
Another example is LP5D connected to an outside diameter of 63 mm high-density polyethylene, and the accelerometer location is unchanged, which is 18.4 m away. The overview and correlation results are presented in Figure 8a,b. In the cross-correlation function of this measurement, the estimated time delay and estimated leak are stable. The estimated leak falls into the range of measurement uncertainty ±1.56 m with a 95% confidence level. Therefore, the survey performance of LP5D is considered to have high accuracy and precision.
Figure 8.
(a): Overview of LP5D. (b): Cross-correlation result of LP5D.
3.3. Highly Precise but Not Accurate Measurement
3.3.1. Leak Point LP48 with 13.3 m Accelerometers Distance
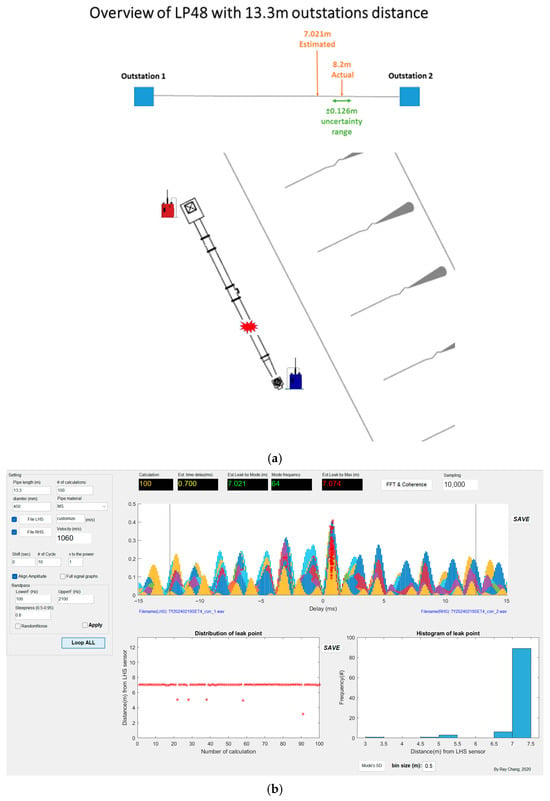
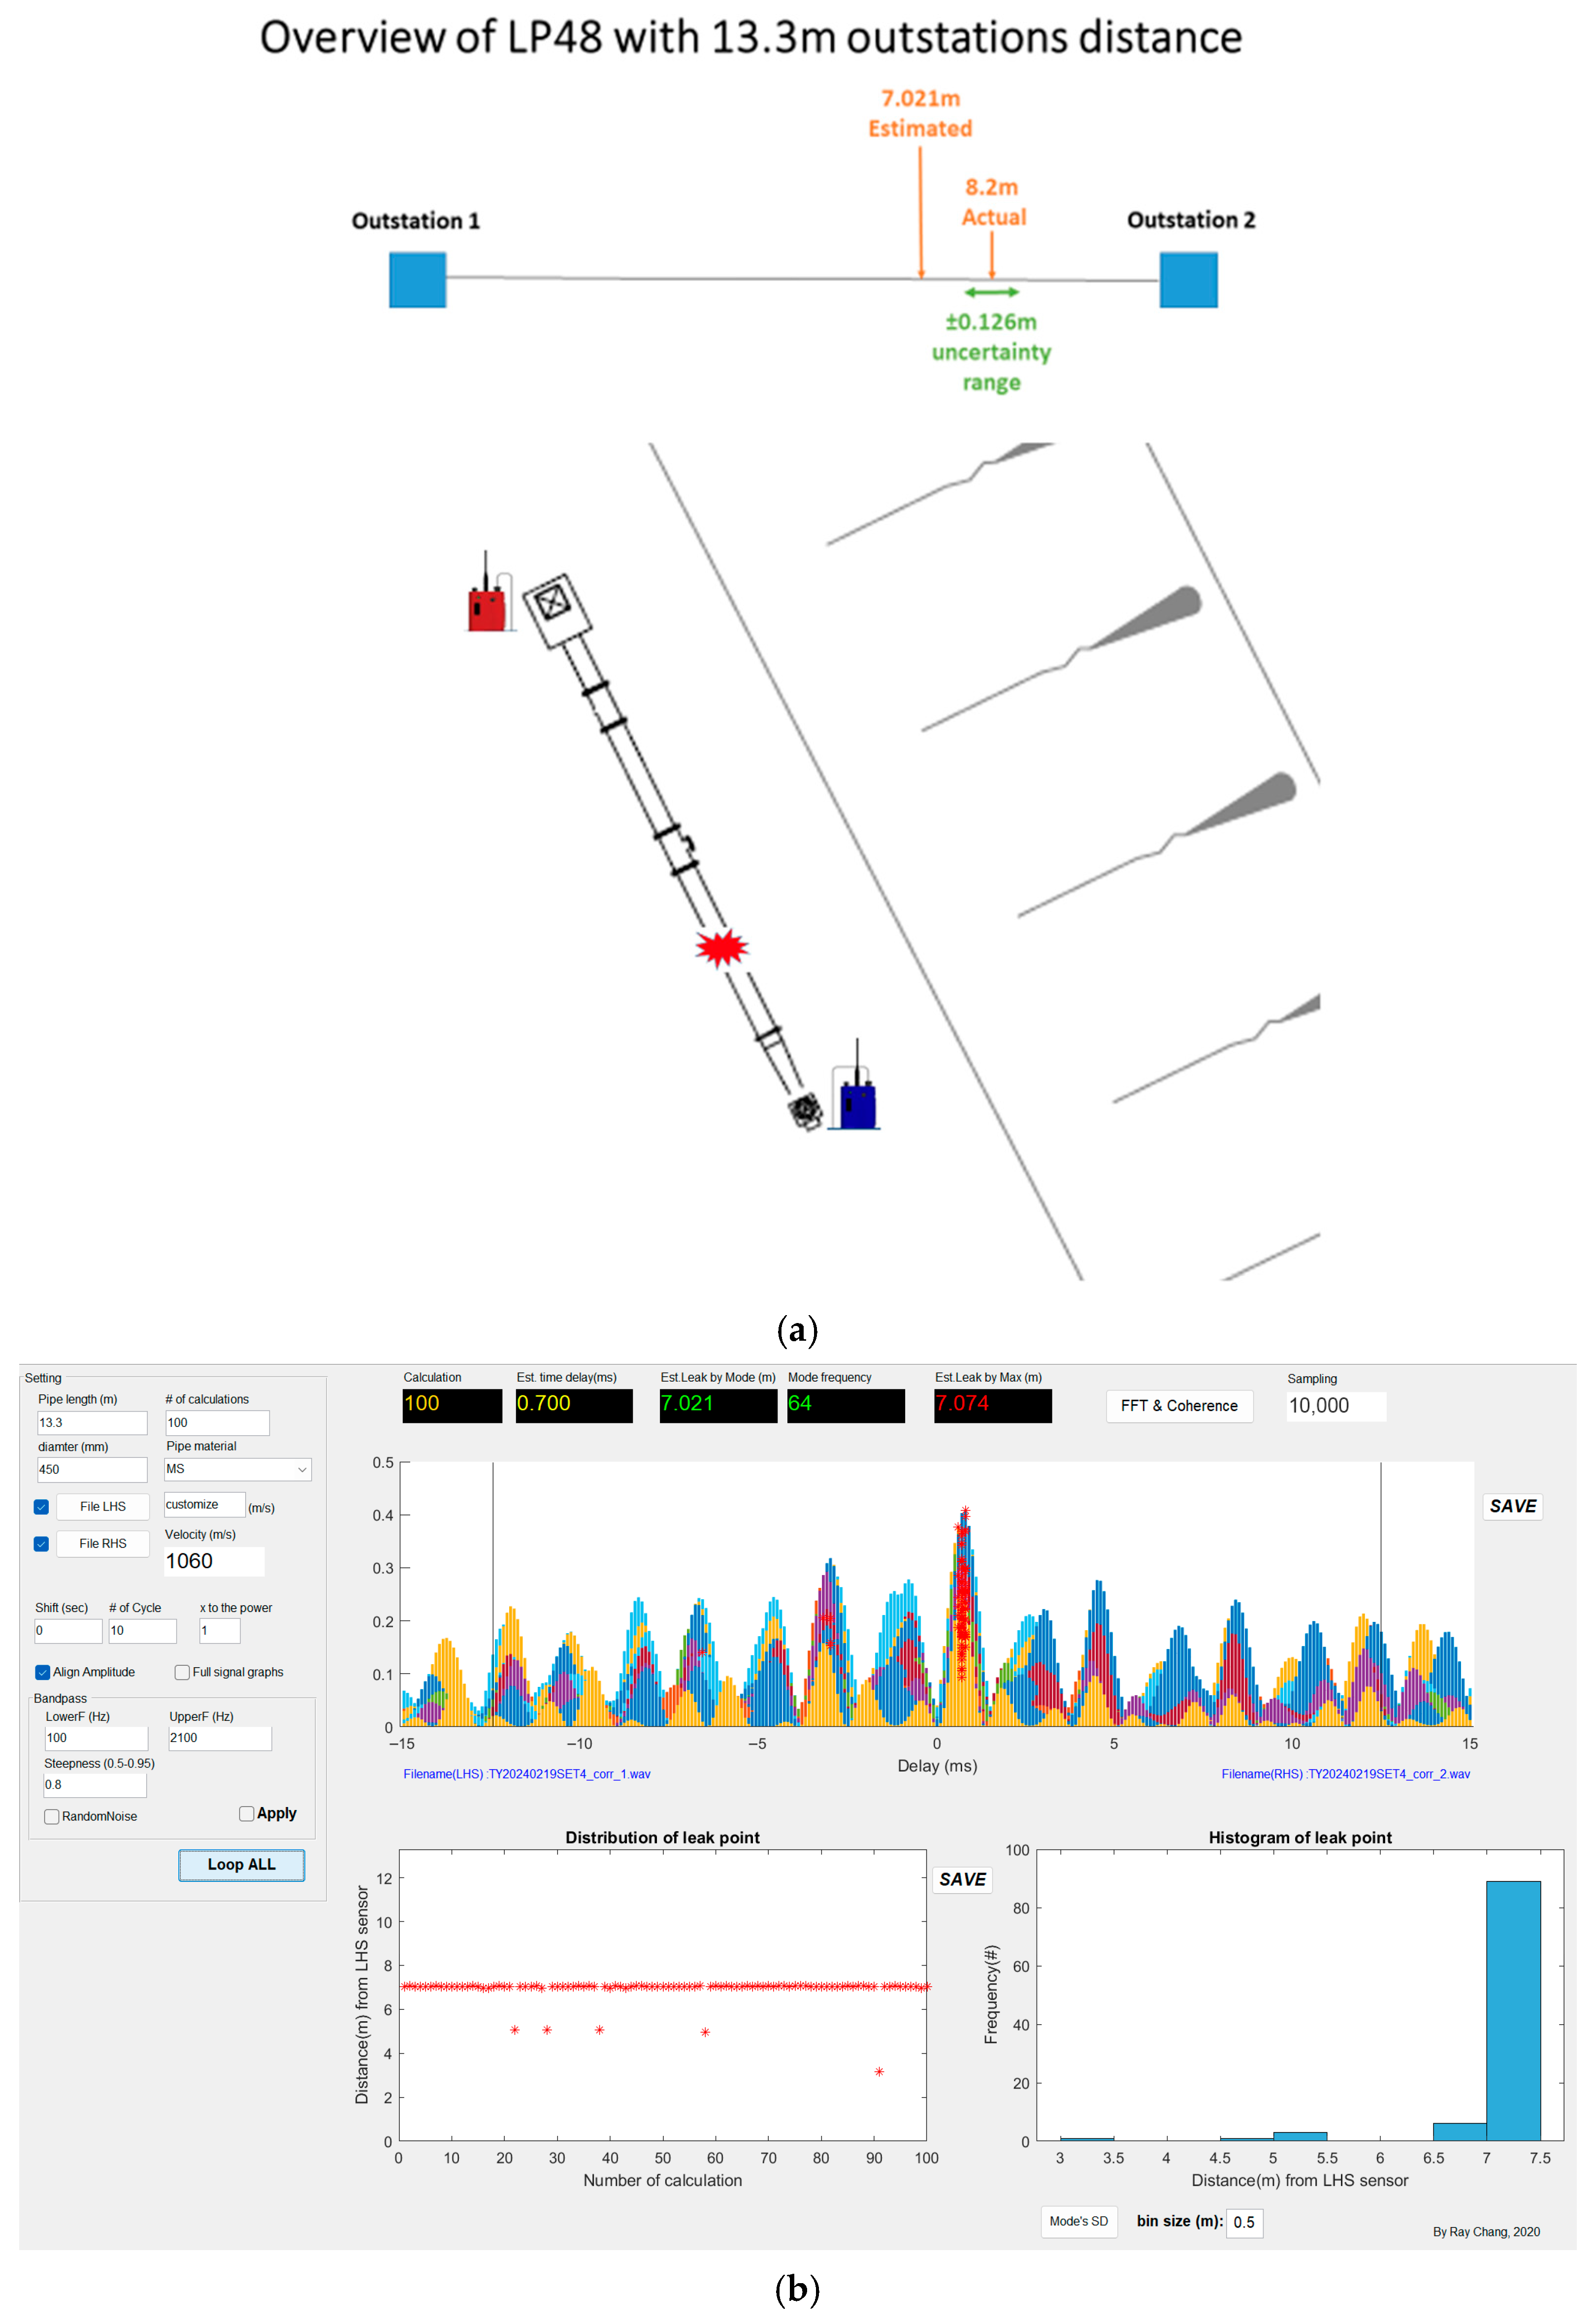
For the LP48 with a station distance of 13.3 m, although the result performed in stable status, it was observed that some of the measurements fell outside this range. The explanation of this result is presented in 3.3 uncertainty budget case 1. This indicates high precision but low accuracy in these measurements. Figure 9a,b presents the overview and correlation result of LP48 with a 13.3 m station distance.
Figure 9.
(a): Overview of LP48. (b): Cross-correlation result of LP48.
3.3.2. Leak Point LP53
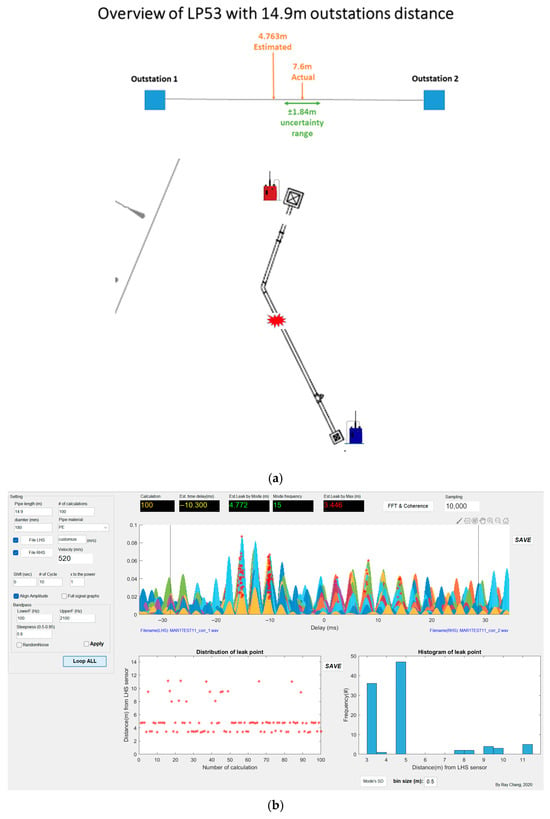
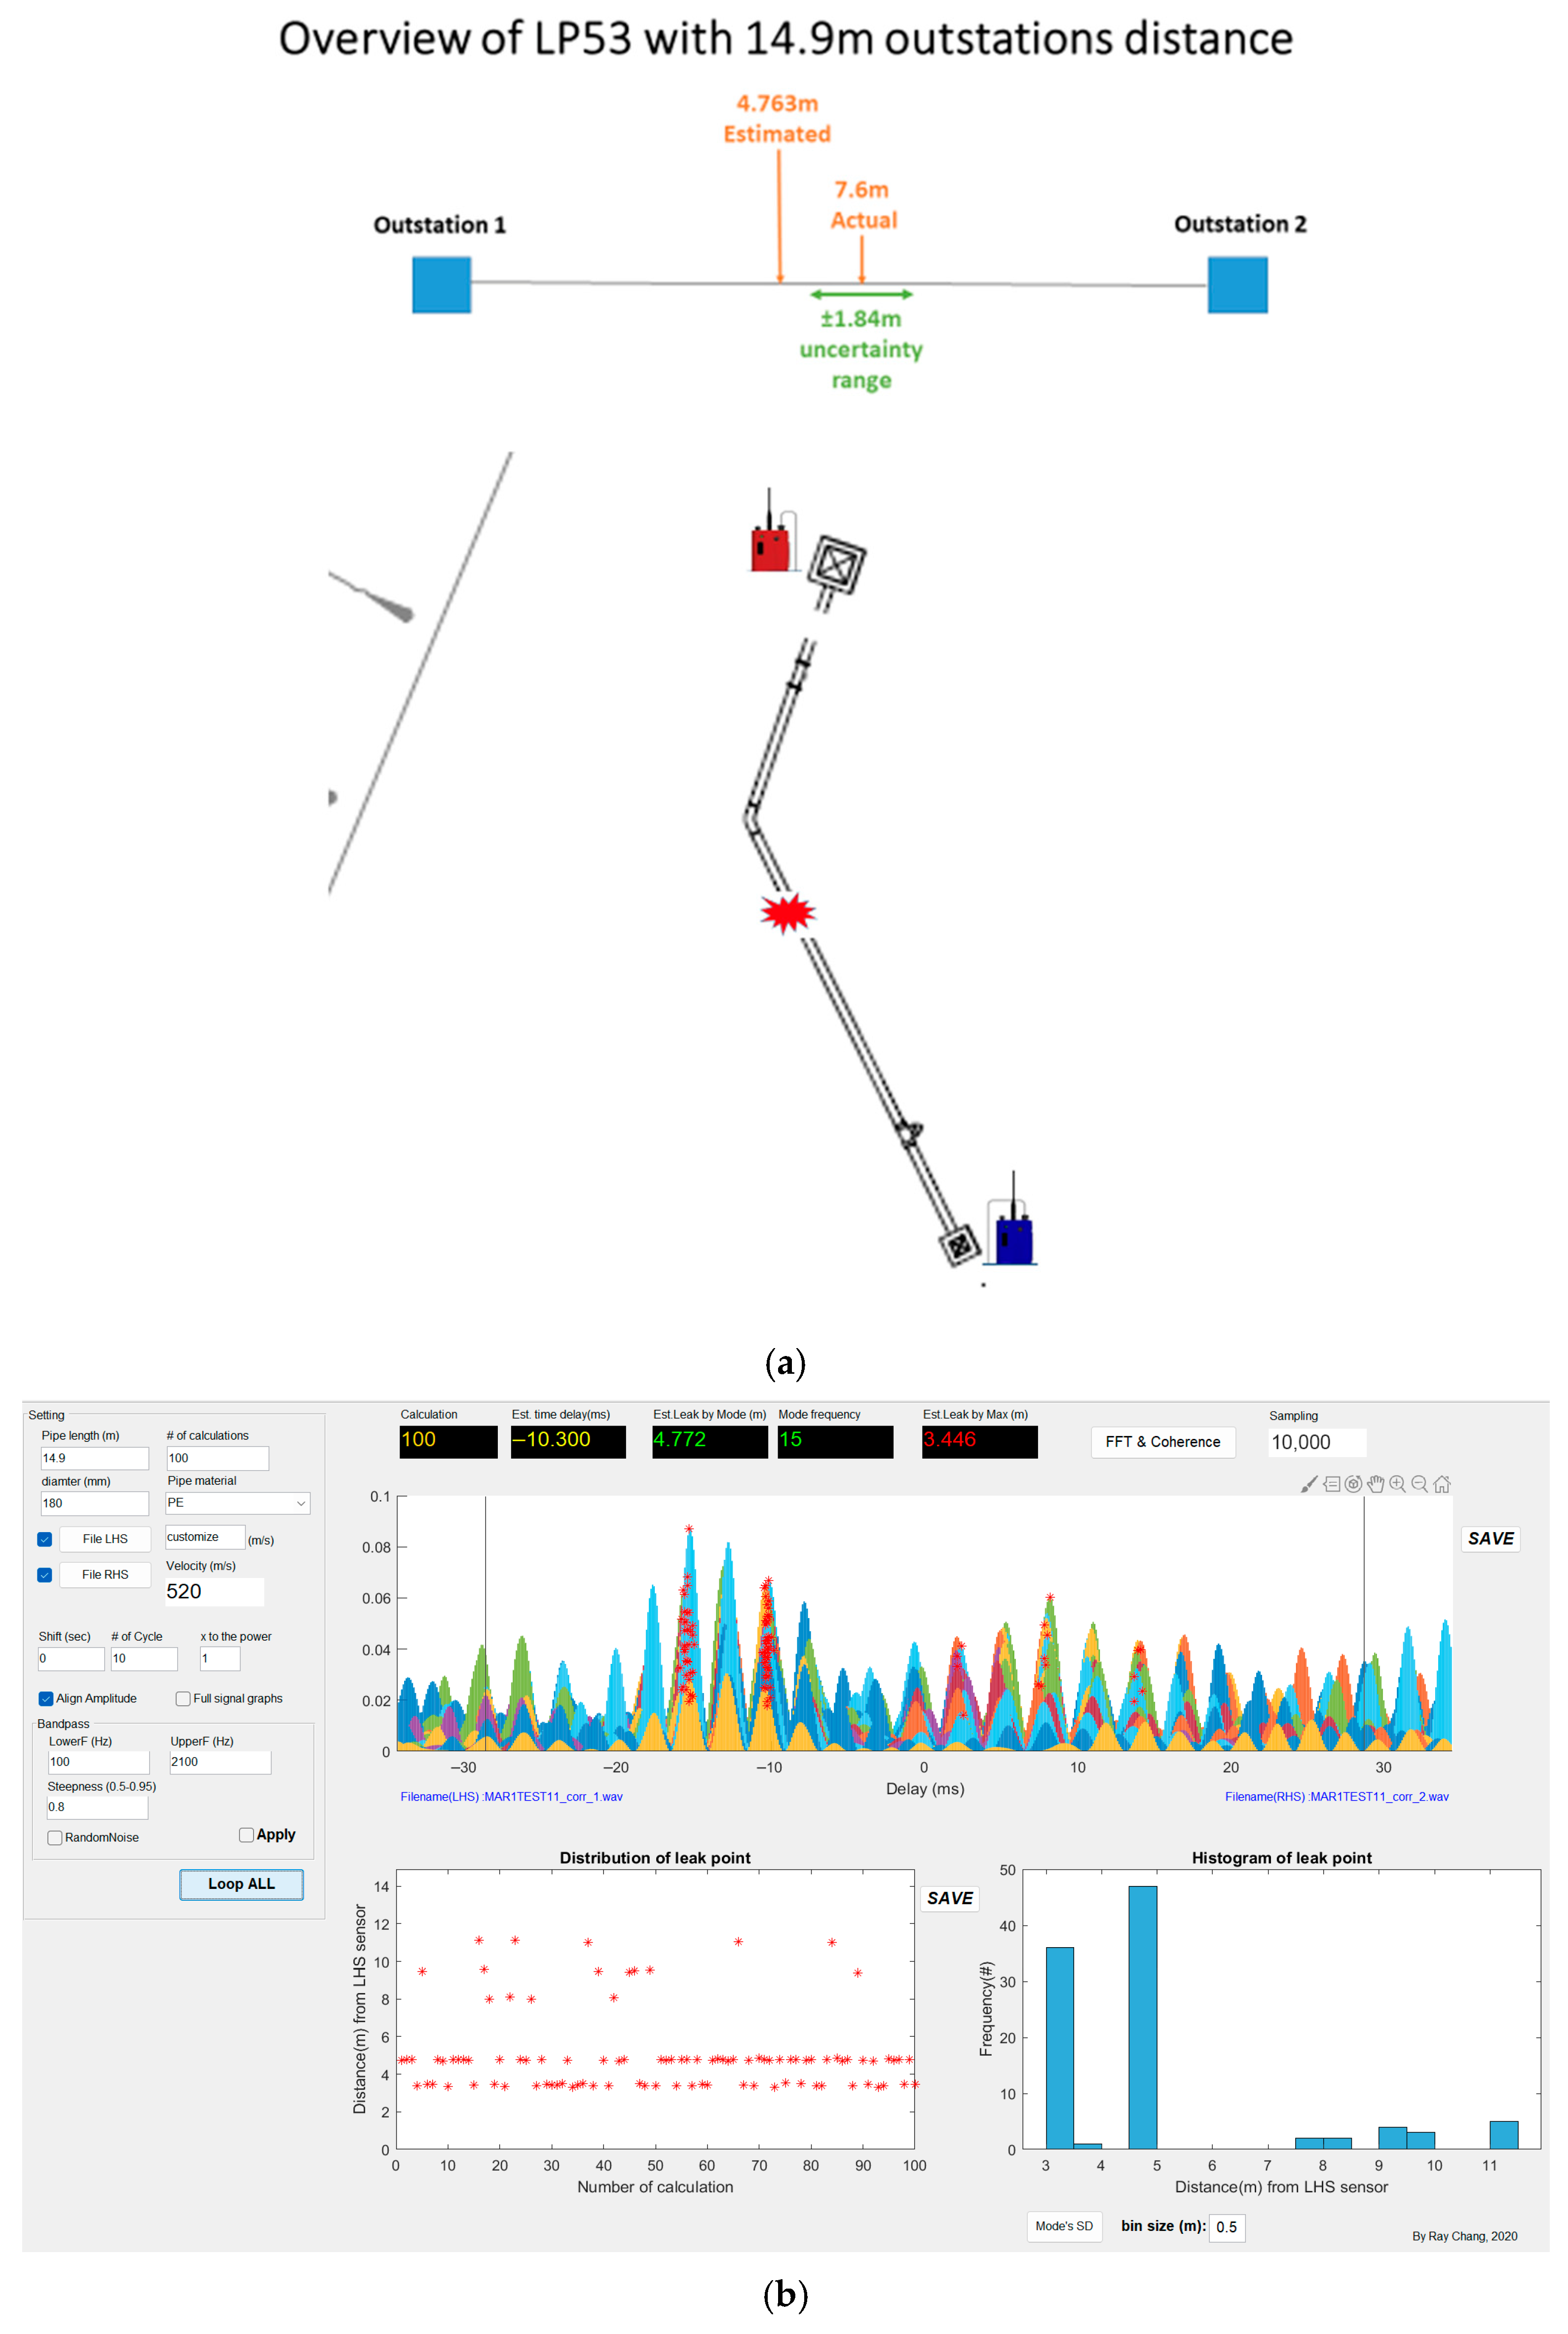
The LP53 is connected with an outside diameter of 180 mm of high-density polyethylene, with a 14.9 m station distance. Figure 10a,b presents the overview and correlation result of LP53. The performance of the acoustic signal is negative, although the estimated time delay and estimated leak are stable; the leak difference does not fall within the measurement uncertainty. Further explanation of this result is presented in 3.3 Uncertainty budget case 1. Thus, the result indicates high precision but low accuracy for this survey.
Figure 10.
(a): Overview of LP53. (b): Cross-correlation result of LP53.
3.4. Highly Accurate but Not Precise Measurement
Leak Point LP49
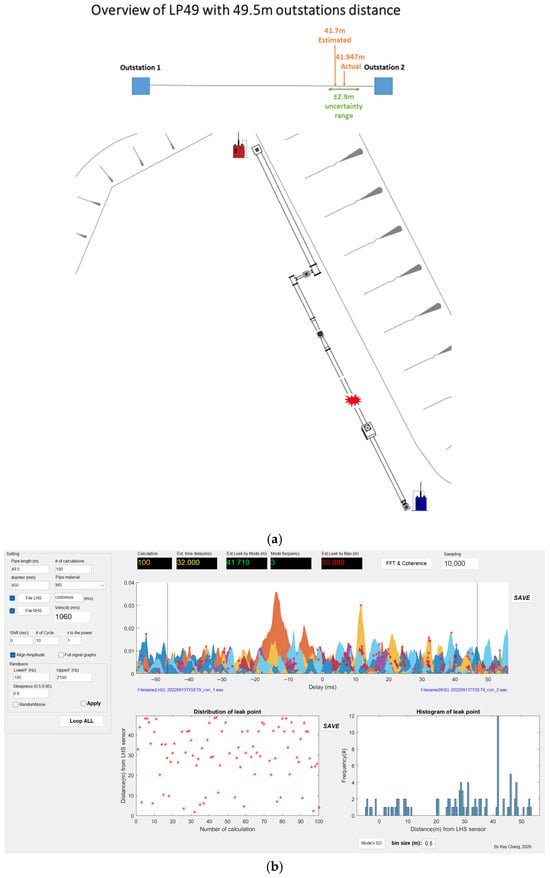
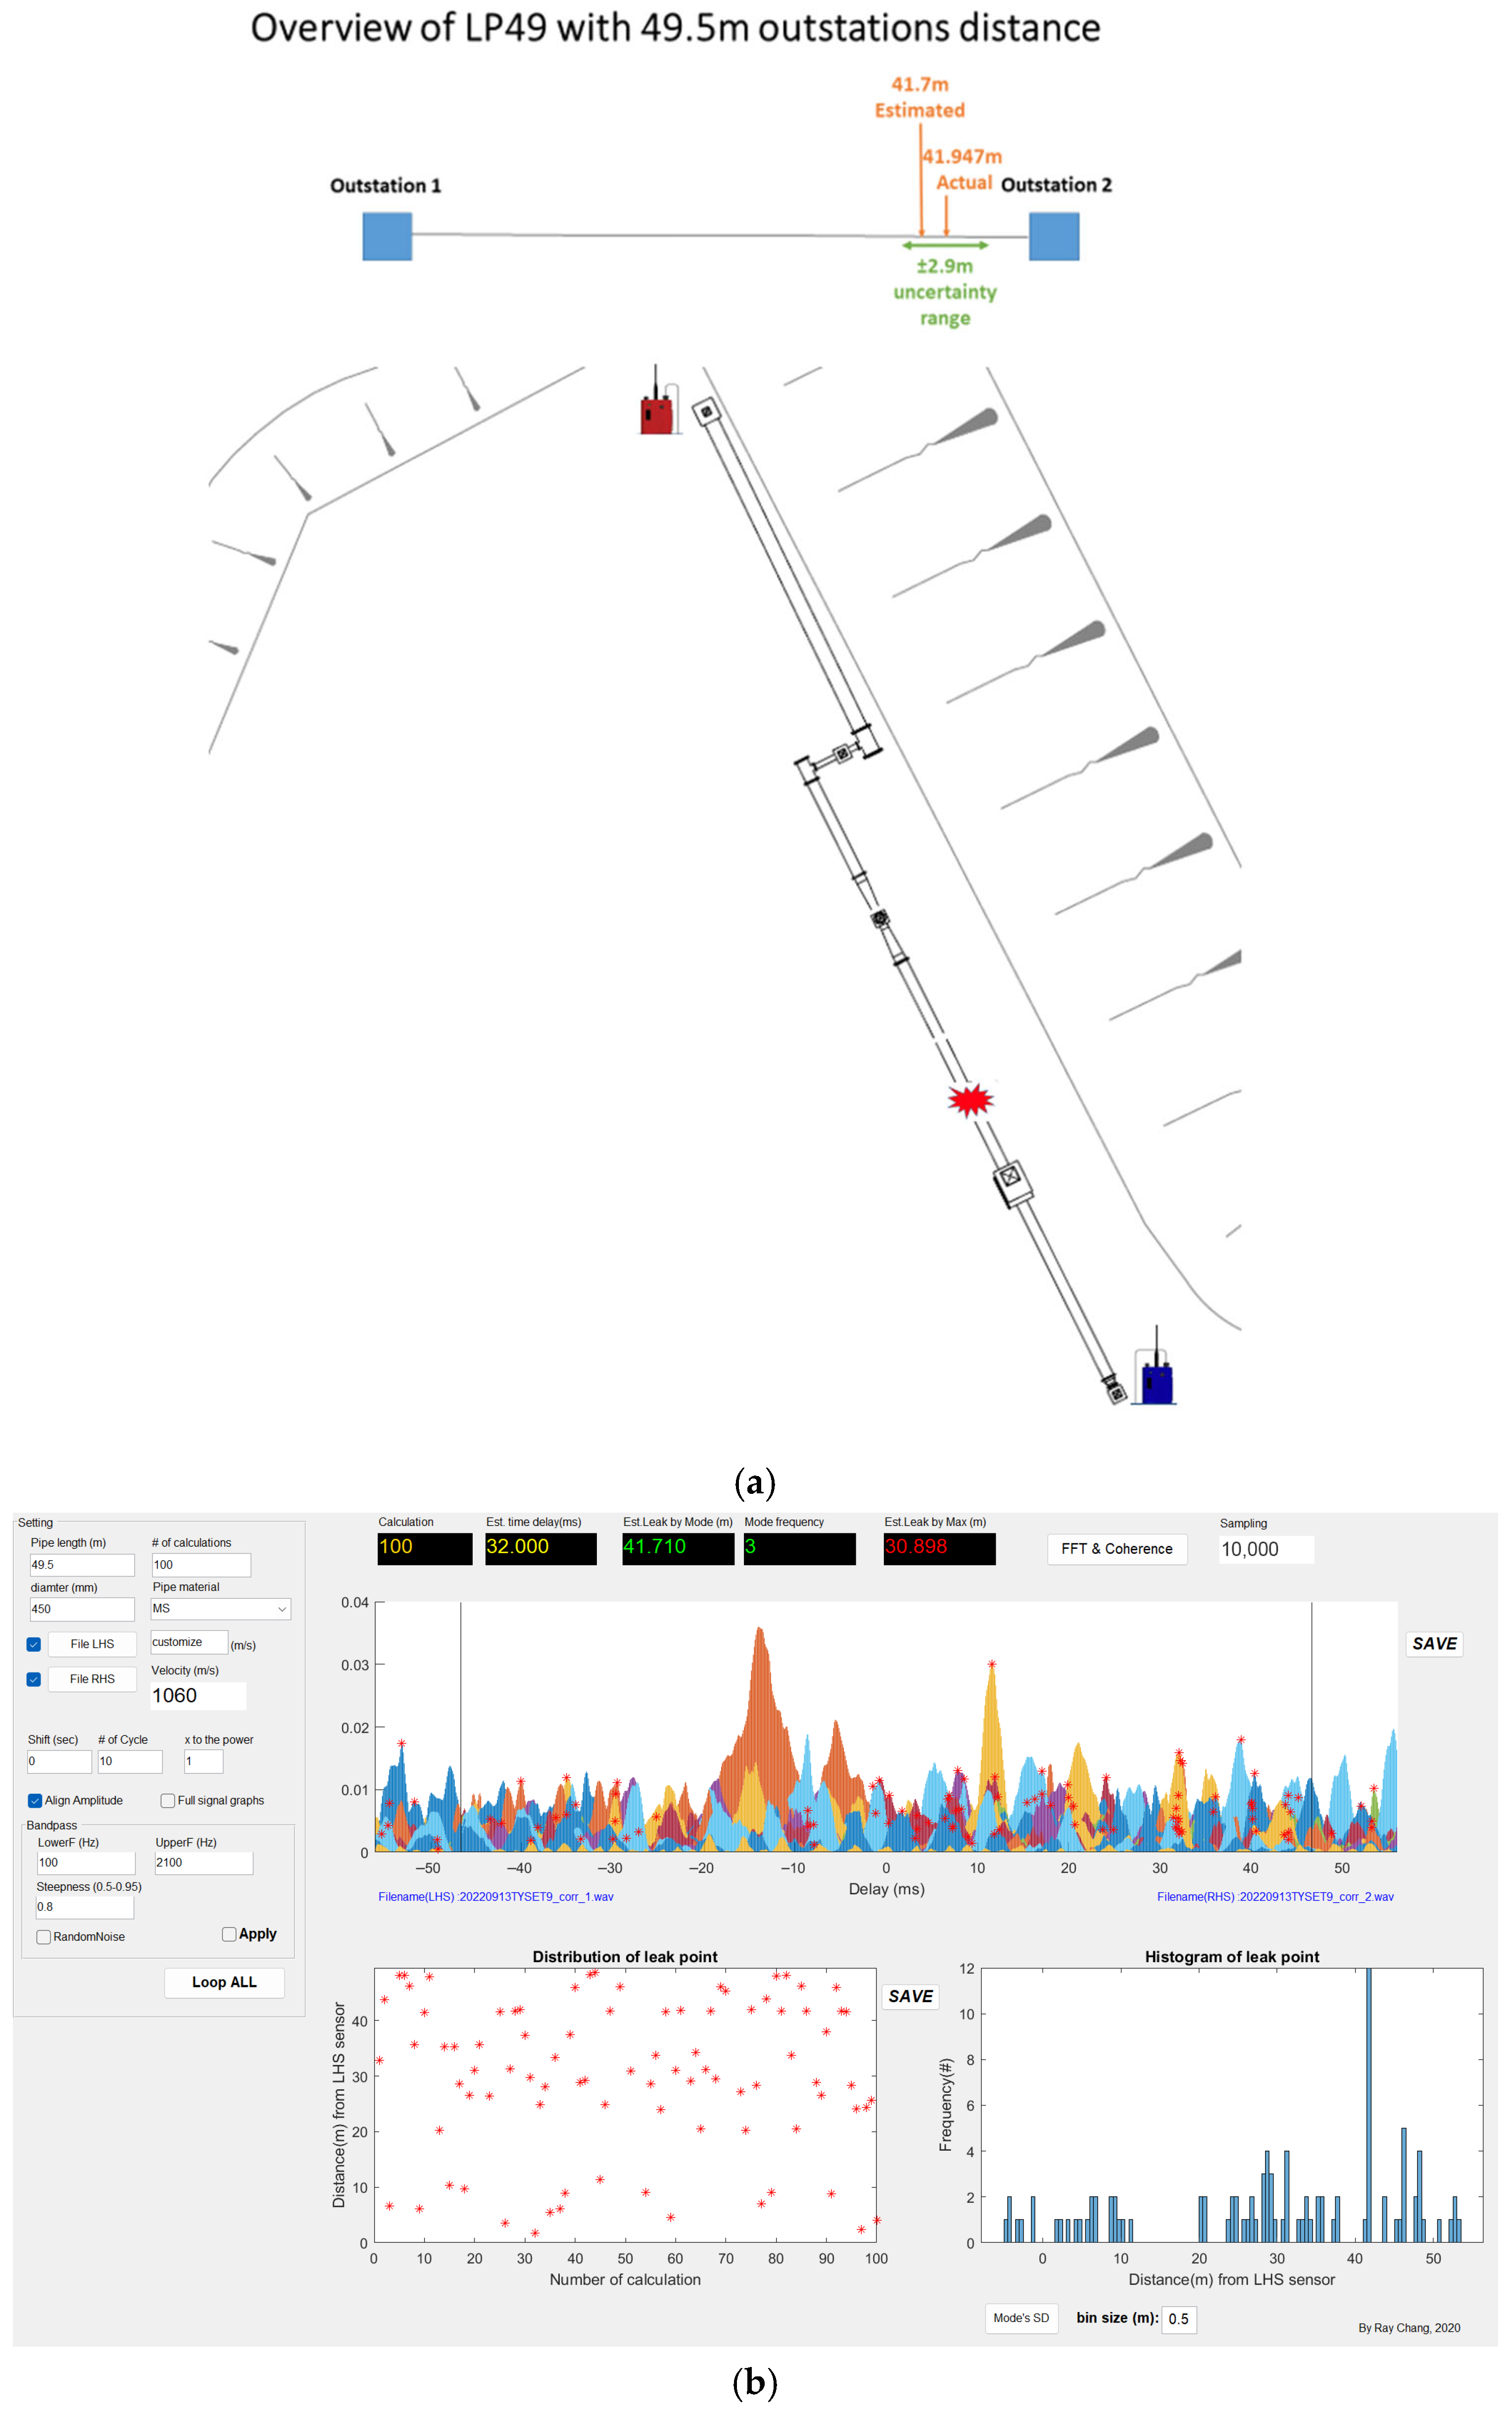
LP49 is connected to 450 mm mild steel water mains with a 49.5 m station distance. The overview and correlation results are presented in Figure 11a,b. Unlike previous correlation results, in a stable red line, the leak point distribution is displayed randomly. It indicates the measurement result performed with unstable and unrepeatable estimated time delay and estimated leak location in the cross-correlation function. However, the discrepancy between the actual leak and the best-estimated leak is 0.237 m, which falls within the measurement uncertainty of ±2.9 m with a 95% confidence level. As a conclusion, the measurements of LP49 demonstrate high accuracy but low precision.
Figure 11.
(a): Overview of LP49. (b): Cross-correlation result of LP49.
3.5. Not Accurate and Not Precise Measurement
Leak Point LP4A
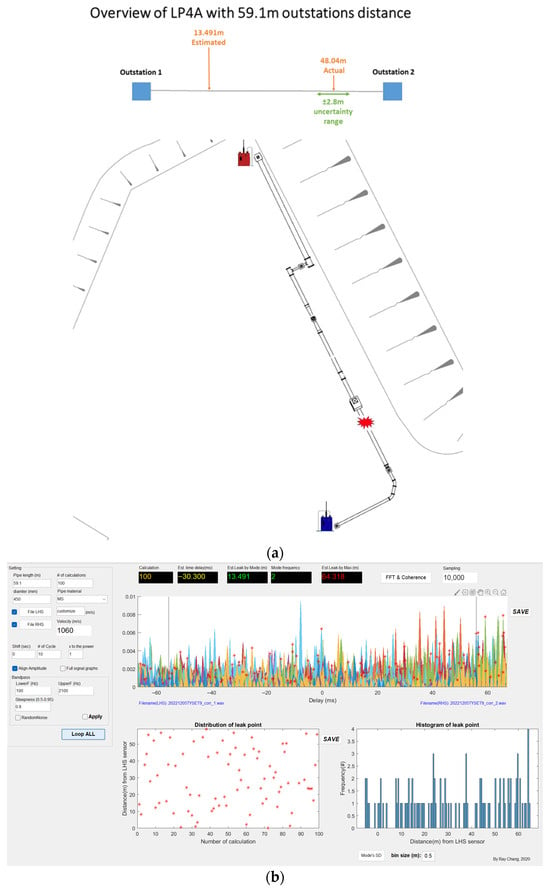
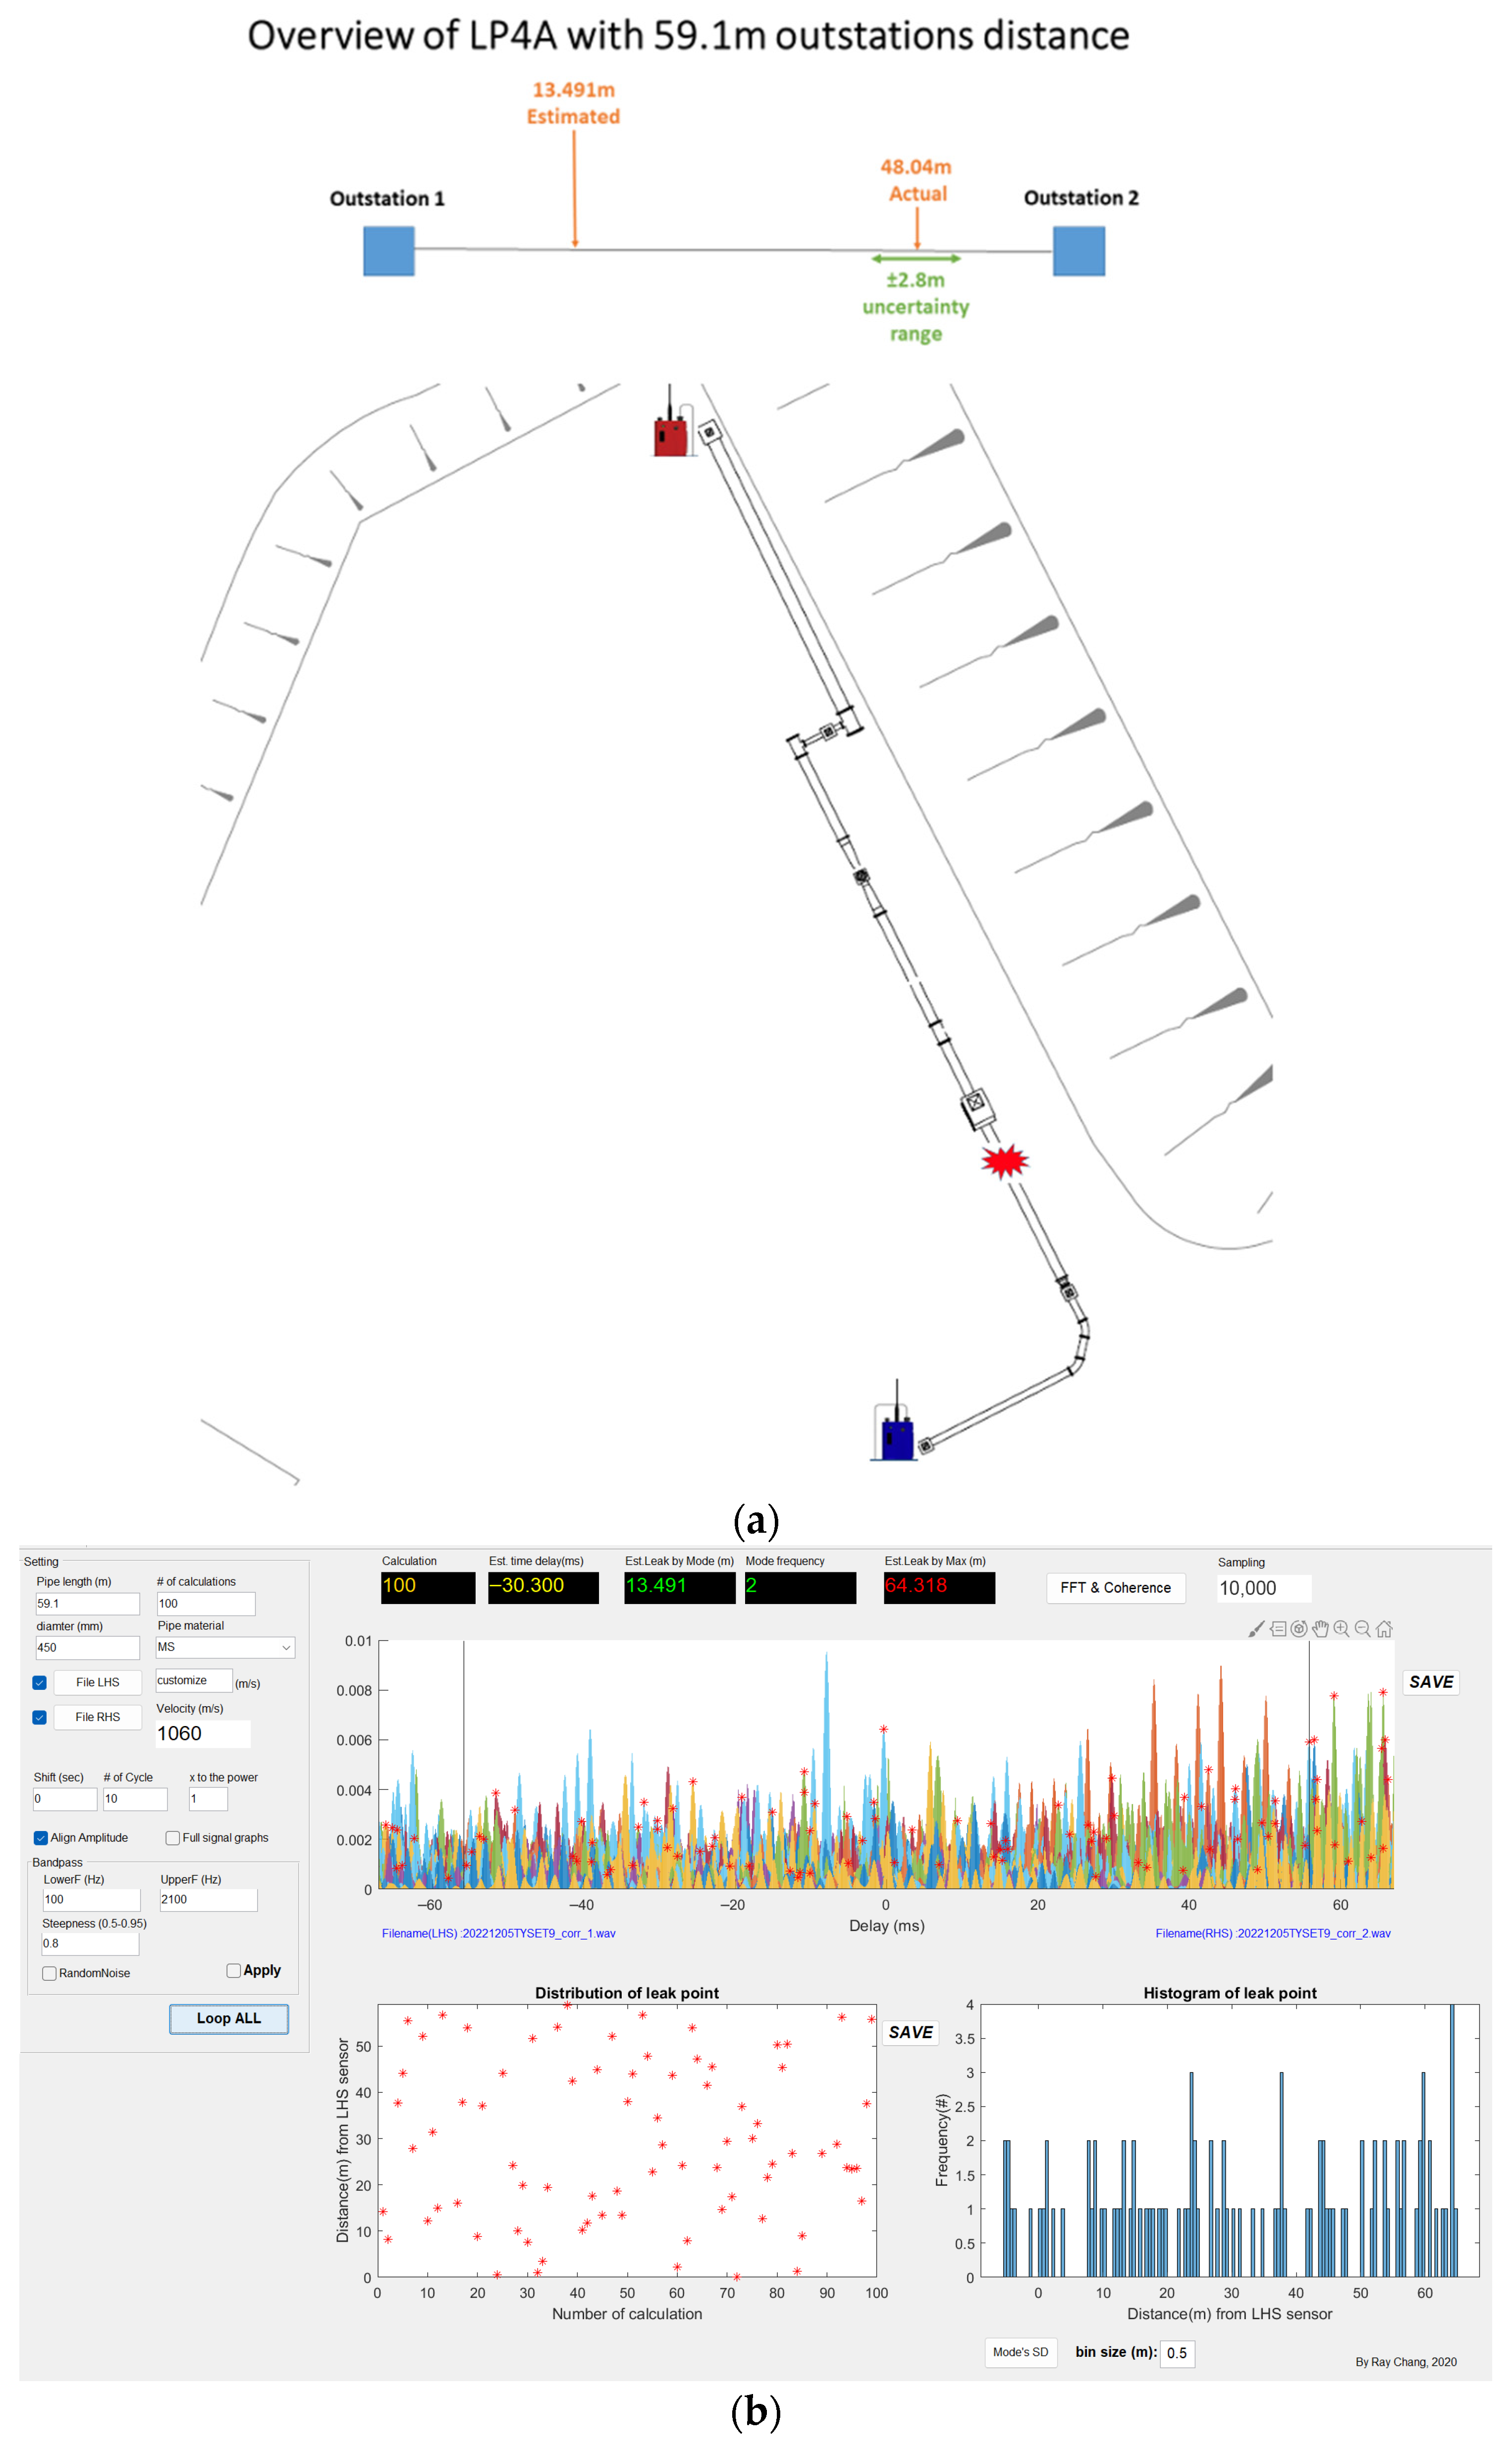
For the LNC survey on LP4A, which is connected with 450 mm mild steel water mains. The station distance is 59.1 m with a constant location. The overview and correlation results are presented in Figure 12a,b. In the same circumstance as LP49, the leak point distribution is displayed randomly. It indicates the measurement result performed with unstable and unrepeatable estimated time delay and estimated leak location in the cross-correlation function. The discrepancy between the actual leak and the estimated leak is over 30 m, which falls outside the measurement uncertainty of 2.8 m with a 95% confidence level. In conclusion, the measurements of LP4A demonstrate low accuracy and low precision.
Figure 12.
(a): Overview of LP4A. (b): Cross-correlation result of LP4A.
The confusion matrix result is presented in Table 3. A few factors could affect the accuracy and precision of the measurement, including background noise, pipe material and diameter, and the distance between two accelerometers. In this experiment, we noticed that the 20 m station distance is the minimum range for metal pipe leak detection.
Table 3.
Confusion matrix of the result.
3.6. Uncertainty Budget
The uncertainty budget analysis was conducted independently for leak location and wave speed equations. For the data cleaning aspect, the averaging method has been applied to ensure the data quality in this experiment. The classification criteria were determined based on different artificial leak points and the distances between two accelerometers. Consequently, a comprehensive evaluation involving 7 datasets was carried out during the uncertainty budget calculation stage, as outlined in Table 4, and summarized into two cases.
Table 4.
Averaged data of LNC survey.
Case 1: Wave speed as the overwhelming factor of the combined uncertainty budget.
The setups of sets 1, 3, 6, and 7 were connected to a metal pipe with a long-distance range of over 20 m between two accelerometers. The case 1 uncertainty budget of leak location is shown in Table 5. It reveals that over 98% of the uncertainty is attributed to the wave speed. Table 6 also shows the uncertainty budget of wave speed v in case 1. It indicates that more than 60% of the wave speed uncertainty arises from the pipe wall thickness, while nearly 25% of the uncertainty is caused by the Young’s modulus of the pipe wall material. These two parameters significantly dominate the uncertainty budget for this survey. This phenomenon is observed in data sets 1, 3, 6, and 7, which correspond to mild steel pipe with comparably long-distance range between two accelerometers.
Table 5.
Uncertainty budget of leak location in case 1.
Table 6.
Uncertainty budget of wave speed v in case 1.
Meanwhile, the survey setups of sets 4 and 5 involve plastic pipes and short distance ranges. Notably, the results indicate that the entire combined uncertainty of leak location (100%) in these cases is attributed to the wave speed. Furthermore, the internal uncertainty budget of the wave speed in these plastic pipe cases shows that the Young’s modulus of the pipe wall material accounts for over 90% of the total wave–speed uncertainty, while the remaining parameters (pipe wall thickness, pipe radius, bulk modulus, and fluid velocity) contribute negligibly after normalization.
In addition, there is 0% contribution on fluid wave speed, bulk modulus, and pipe radius in sets 4 and 5, which does not imply that the parameter has no mathematical effect. Instead, it reflects that its contribution is negligible relative to other dominant parameters after normalization of the uncertainty budget. The pipe radius is obtained from standard nominal pipe sizes. Therefore, its tolerance is small relative to the nominal value. The flow condition at the Q-Leak was maintained at a constant 4 bar with fresh water throughout the experiments. Therefore, its standard uncertainty was assumed negligible, leading to a 0% contribution after normalization.
This behaviour can be contrasted with the metal pipe case (e.g., set 1). For set 1 (mild steel pipe, 450 mm diameter, and 49.5 m outstation distance), substitution into Equations (9)–(13) yields the following wave–speed uncertainty contributions: fluid velocity = 10.29%, pipe radius = 0%, bulk modulus = 1.30%, Young’s modulus = 25.38%, and pipe wall thickness = 62.63%. In this metal pipe case, pipe wall thickness is the dominant contributor, followed by Young’s modulus, while diameter and bulk modulus remain minor contributors.
The difference between metal and plastic pipes is governed by Equation (3), where both Young’s modulus (E) and wall thickness (h) appear in the denominator term . Because they are inversely related to wave speed, small variations in these parameters significantly influence sensitivity. In metal pipes, where Young’s modulus is very large (e.g., ~210 for mild steel), the wave–speed sensitivity with respect to wall thickness becomes dominant; therefore, uncertainty in wall thickness produces the greatest contribution. Conversely, in plastic pipes, where Young’s modulus is much smaller (e.g., 1–4 ), the relative variability of E becomes comparatively large, making the wave–speed sensitivity highly responsive to changes in Young’s modulus. As a result, Young’s modulus overwhelmingly dominates the uncertainty budget in plastic pipe systems, while the contributions from other parameters become negligible after normalization.
Case 2: Station distance, wave speed, and time delay share the uncertainty budget.
Table 7 represents the uncertainty budget of set 2 with a shorter distance range, which is less than 20 m, with two accelerometers. It indicates that the combined uncertainty of distance occupies over 60% of the budget, while the rest of the uncertainty is time delay and wave speed, each approximately 20%. In addition, the uncertainty budget of wave speed v in Table 8 indicates a similar pattern with the metal pipe over a long-distance range. Pipe wall thickness is the largest uncertainty parameter for the wave speed.
Table 7.
Uncertainty budget of leak location in case 2.
Table 8.
Uncertainty budget of wave speed v in case 2.
4. Conclusions
In this work, we establish a rigorous mathematical uncertainty calculation model for the leakage position uncertainty measurement. Most of the measurements exhibited excellent performance, demonstrated by both high accuracy and precision, and high precision but low accuracy in various cases. These measurements demonstrated consistency and repeatability in terms of estimated time delays and leak locations; there was a systematic deviation from the actual leak location. The discrepancy between the measured leak location and the actual leak location suggests a bias or systematic error in the measurement process. This discrepancy could be attributed to various factors such as the connection status between the valve and accelerometer, environmental conditions, or limitations of the LNC technique itself.
The uncertainty budget analysis has been conducted, revealing that wave speed is the most influential parameter affecting the overall uncertainty budget. In particular, the pipe wall thickness plays a crucial role in determining the uncertainty associated with wave speed calculations, especially for metal pipes. Variations in pipe wall thickness can result in significant uncertainties in wave speed estimation. However, when considering plastic pipes, the Young’s modulus of the pipe wall material emerges as the primary contributor to uncertainty. It becomes the most significant parameter influencing the overall uncertainty budget for wave speed calculations in plastic pipe systems.
The assessment of uncertainty in acoustic leak detection, particularly in LNC surveys, represents a critical yet underexplored domain within the industry. This paper delves into the evaluation of uncertainty ranges and prioritization of key factors influencing measurement budgets across diverse scenarios. Through the application of an uncertainty calculator, operators are presented with a range of values that serve as a margin of error, aiding the validation of suspected leak locations and highlighting constraints by scrutinizing the uncertainty budget. This empowers operators to adapt measurement setups to optimize conditions for enhanced accuracy.
Furthermore, operators have the flexibility to customize confidence levels according to the survey site conditions. This tailored approach ensures that each measurement is appraised with a predetermined level of certainty, facilitating more accurate and well-informed decision-making processes. By leveraging these tools and methodologies, operators can elevate the reliability and precision of their assessments, thereby enabling more effective responses and solutions within the leak detection industry.
Author Contributions
Conceptualization, A.Y.-C.C. and W.W.-L.L.; methodology, A.Y.-C.C.; software, A.Y.-C.C.; validation, A.Y.-C.C., T.C.-W.L., and W.W.-L.L.; formal analysis, A.Y.-C.C.; data curation, A.Y.-C.C.; data collection, A.Y.-C.C. and T.C.-W.L.; writing—original draft preparation, A.Y.-C.C.; writing—review and editing, A.Y.-C.C.; visualization, A.Y.-C.C.; supervision, W.W.-L.L. All authors have read and agreed to the published version of the manuscript.
Funding
Study on Using In-pipe Robotic Technologies in Water Mains Inspection, Water Supplies Department of HKSAR Government.
Data Availability Statement
The data are unavailable due to privacy concerns.
Conflicts of Interest
The authors declare no conflicts of interest.
References
- Lai, W.W.-L.; Lau, T.C.-W.; Cheng, A.Y.-C.; Liu, P.K.-C.; Leung, J.W.-C. Outcome-Based blind tests for leakage diagnosis in underground watermains by acoustic technologies. Tunn. Undergr. Space Technol. 2023, 142, 105413. [Google Scholar] [CrossRef] [Scilit]
- Li, S.; Wen, Y.; Li, P.; Yang, J.; Dong, X.; Mu, Y. Leak location in gas pipelines using cross-time–frequency spectrum of leakage-induced acoustic vibrations. J. Sound Vib. 2014, 333, 3889–3903. [Google Scholar] [CrossRef] [Scilit]
- Li, Z.; Zhang, H.; Tan, D.; Chen, X.; Lei, H. A novel acoustic emission detection module for leakage recognition in a gas pipeline valve. Process Saf. Environ. Prot. 2017, 105, 32–40. [Google Scholar] [CrossRef] [Scilit]
- Liu, Z.; Li, S. A sound monitoring system for prevention of underground pipeline damage caused by construction. Autom. Constr. 2020, 113, 103125. [Google Scholar] [CrossRef] [Scilit]
- Murvay, P.-S.; Silea, I. A survey on gas leak detection and localization techniques. J. Loss Prev. Process Ind. 2012, 25, 966–973. [Google Scholar] [CrossRef] [Scilit]
- Hu, Z.; Tariq, S.; Zayed, T. A comprehensive review of acoustic based leak localization method in pressurized pipelines. Mech. Syst. Signal Process. 2021, 161, 107994. [Google Scholar] [CrossRef] [Scilit]
- Gao, Y.; Brennan, M.; Joseph, P.; Muggleton, J.; Hunaidi, O. A model of the correlation function of leak noise in buried plastic pipes. J. Sound Vib. 2004, 277, 133–148. [Google Scholar] [CrossRef] [Scilit]
- Brennan, M.J.; Gao, Y.; Ayala, P.; Almeida, F.; Joseph, P.; Paschoalini, A. Amplitude distortion of measured leak noise signals caused by instrumentation: Effects on leak detection in water pipes using the cross-correlation method. J. Sound Vib. 2019, 461, 114905. [Google Scholar] [CrossRef] [Scilit]
- Liu, Z.; Kleiner, Y. State of the art review of inspection technologies for condition assessment of water pipes. Measurement 2013, 46, 1–15. [Google Scholar] [CrossRef] [Scilit]
- Fantozzi, M.; Di Chirico, G.; Fontana, E.; Tonolini, F. Leak inspection on water pipelines by acoustic emission with cross-correlation method. In Proceedings of the Annual Conference Proceeding, American Water Works Association, Engineering and Operations, San Antonio, TX, USA, 6–10 June 1993. [Google Scholar]
- Fuchs, H.V.; Riehle, R. Ten years of experience with leak detection by acoustic signal analysis. Appl. Acoust. 1991, 33, 1–19. [Google Scholar] [CrossRef] [Scilit]
- Gao, Y.; Liu, Y.; Muggleton, J.M. Axisymmetric fluid-dominated wave in fluid-filled plastic pipes: Loading effects of surrounding elastic medium. Appl. Acoust. 2017, 116, 43–49. [Google Scholar] [CrossRef] [Scilit]
- Muggleton, J.M.; Brennan, M.; Pinnington, R.; Gao, Y. A novel sensor for measuring the acoustic pressure in buried plastic water pipes. J. Sound Vib. 2006, 295, 1085–1098. [Google Scholar] [CrossRef] [Scilit]
- Liston, D.A.; Liston, J.D. Leak detection techniques. J. N. Engl. Water Work. Assoc. JNEWA 1992, 106, 103–108. [Google Scholar]
- Hunaidi, O.; Chu, W.T. Acoustical characteristics of leak signals in plastic water distribution pipes. Appl. Acoust. 1999, 58, 235–254. [Google Scholar] [CrossRef] [Scilit]
- Gao, Y.; Brennan, M.; Joseph, P.; Muggleton, J.; Hunaidi, O. On the selection of acoustic/vibration sensors for leak detection in plastic water pipes. J. Sound Vib. 2005, 283, 927–941. [Google Scholar] [CrossRef] [Scilit]
- Kafle, M.D.; Fong, S.; Narasimhan, S. Active acoustic leak detection and localization in a plastic pipe using time delay estimation. Appl. Acoust. 2022, 187, 108482. [Google Scholar] [CrossRef] [Scilit]
- Zeng, W.; Cazzolato, B.; Lambert, M.; Stephens, M.; Gong, J. Coherenceogram for leak detection in water pipes. J. Sound Vib. 2022, 530, 116979. [Google Scholar] [CrossRef] [Scilit]
- Lindberg, V. Uncertainties and error propagation. In Manual on Uncertainties, Graphing and the Vernier Caliper, Part I; Rochester Institute of Technology: New York, NY, USA, 2000; Available online: http://www.rit.edu/uphysics/uncertinities/Uncertinitiespart2.html#addsub (accessed on 1 October 2025).
- Allchin, D. Error Types. Perspect. Sci. 2001, 9, 38–58. [Google Scholar] [CrossRef] [Scilit]
- Powell, C.J.; Seah, M.P. Precision, accuracy, and uncertainty in quantitative surface analyses by Auger-electron spectroscopy and x-ray photoelectron spectroscopy. J. Vac. Sci. Technol. A 1990, 8, 735–763. [Google Scholar] [CrossRef] [Scilit]
- PolyU/LSGI. NDTSID-UU-2.2_AE_Method_for_Leak_Detection_Version_1_PolyU_LSGI_2019.pdf. 2019. Available online: https://www.polyu.edu.hk/lsgi/uusspec/images/Publications/NDTSID-UU-2.2_AE_Method_for_Leak_Detection_Version_1_PolyU_LSGI_2019.pdf (accessed on 1 September 2025).
- PolyU/LSGI. NDTSID-UU-1.1_PCL_Verson_2_PolyU_LSGI_2025.pdf. 2025. Available online: https://www.polyu.edu.hk/lsgi/uusspec/images/Publications/NDTSID-UU-1.1_PCL_Version_2_PolyU_LSGI_2025.pdf (accessed on 1 September 2025).
- PolyU/LSGI. NDTSID-UU-1.2_GPR_Verson_2_PolyU_LSGI_2025.pdf. 2025. Available online: https://www.polyu.edu.hk/lsgi/uusspec/images/Publications/NDTSID-UU-1.2_GPR_Version_2_PolyU_LSGI_2025.pdf (accessed on 1 September 2025).
- Leblanc, T.; Sica, R.J.; van Gijsel, J.A.E.; Godin-Beekmann, S.; Haefele, A.; Trickl, T.; Payen, G.; Liberti, G. Proposed standardized definitions for vertical resolution and uncertainty in the NDACC lidar ozone and temperature algorithms—Part 2: Ozone DIAL uncertainty budget. Atmos. Meas. Tech. 2016, 9, 4051–4078. [Google Scholar] [CrossRef] [Scilit]
- Land and Engineering Survey Board. Engineering Survey Practice Guides for Works Projects; Land and Engineering Survey Board: Hong Kong, China, 2021. [Google Scholar]
- LSGI. NDTSID-UU-1.3_Laser_Scanning_Survey; The Hong Kong Polytechnic University: Hong Kong, China, 2020. [Google Scholar]
- Pipes—Nominal Wall Thickness. Engineering ToolBox. Available online: https://www.engineeringtoolbox.com/nominal-wall-thickness-pipe-d_1337.html (accessed on 1 September 2025).
- Young’s Modulus, Tensile Strength and Yield Strength Values for some Materials. Engineering Toolbox. Available online: https://www.engineeringtoolbox.com/young-modulus-d_417.html (accessed on 1 September 2025).
- Metals and Alloys—Bulk Modulus Elasticity. Available online: https://www.engineeringtoolbox.com/bulk-modulus-metals-d_1351.html (accessed on 1 September 2025).
- Hamby, D. A comparison of sensitivity analysis techniques. Health Phys. 1995, 68, 195–204. [Google Scholar] [CrossRef] [Scilit] [PubMed]

Disclaimer/Publisher’s Note: The statements, opinions and data contained in all publications are solely those of the individual author(s) and contributor(s) and not of MDPI and/or the editor(s). MDPI and/or the editor(s) disclaim responsibility for any injury to people or property resulting from any ideas, methods, instructions or products referred to in the content. |
© 2026 by the authors. Licensee MDPI, Basel, Switzerland. This article is an open access article distributed under the terms and conditions of the Creative Commons Attribution (CC BY) license.