Article

Coupling Response Mechanisms of Groundwater and Land Subsidence in the North China Plain Under Extreme Rainfall


College of Civil Engineering, Hefei University of Technology, Hefei 230009, China
*
Author to whom correspondence should be addressed.
Water 2026, 18(3), 357; https://doi.org/10.3390/w18030357
Submission received: 8 December 2025 / Revised: 15 January 2026 / Accepted: 28 January 2026 / Published: 30 January 2026
(This article belongs to the Section Hydrogeology)

Abstract

Against the backdrop of the increasing frequency of extreme hydrological events and persistent over-extraction of groundwater, the North China Plain (NCP) is facing significant land subsidence. This study systematically analyzed the surface subsidence response patterns and mechanisms of the NCP during extreme rainfall events by integrating Gravity Recovery and Climate Experiment (GRACE) data, Global Navigation Satellite System (GNSS) observations, environmental load models, well data, and precipitation records. The main findings are as follows: (1) From 2002 to 2020, the groundwater storage change (GWSC) in most of the study area declined at an average rate of trend about 5 cm/yr, while from 2021 to 2024, influenced by heavy rainfall recharge, GWSC recovered with a mean rate of trend about 7 cm/yr; (2) During the extreme rainfall event from 1 July to 31 August 2023, the environmental loading model effectively captured the vertical deformation caused by hydrological loading, showing general consistency with GNSS monitoring results in spatial distribution. Most GNSS stations experienced rapid subsidence during the event (GNSS: 5 mm, model: 2 mm), followed by a gradual rebound after the extreme rainfall, consistent with elastic theory; (3) The deformation at the TJBH station exhibited anomalies attributable to porous elastic effects; (4) Integrated well data confirmed that rainfall recharge primarily influences shallow groundwater. This study reveals the multiple mechanisms underlying extreme hydrological induced land subsidence in the NCP.

1. Introduction

The North China Plain (NCP), a crucial grain-producing region in China, has long faced severe water stress stemming from groundwater over-extraction for agricultural irrigation. The region’s socio-economic development has led to an excessive reliance on groundwater, resulting in widespread over-exploitation and subsequent large-scale land subsidence [1]. Land subsidence poses serious hazards, including damage to infrastructure, exacerbation of flood risks, and associated socio-economic losses [2]. Compounding these challenges, in recent years, against the backdrop of global warming, extreme hydrological events, including floods and droughts, have become markedly more frequent, exerting profound impacts on hydrological environments both globally and regionally, including in the NCP [3]. The impact of intense rainfall events on groundwater systems exhibits significant regional heterogeneity, primarily governed by local climatic- and hydrogeological conditions. In many arid and semi-arid regions worldwide (e.g., the interior of Australia), due to low soil permeability, thick vadose zones, or intense evaporation, high-intensity rainfall is largely converted into surface runoff or rapid flow, contributing minimally to effective groundwater recharge [4]. In contrast, in areas with favorable infiltration conditions, such as the NCP, extreme rainfall can effectively recharge aquifers, serving as an important source of regional groundwater replenishment [5,6,7]. However, extreme rainfall may also trigger considerable surface deformation [8]. The occurrence of such intense, short-duration rainfall events introduces new challenges for mechanism research and hazard assessment. Therefore, examining how extreme rainfall affects groundwater dynamics and land subsidence is of significant scientific importance.
With the advancement of technology, traditional ground deformation monitoring methods are increasingly being replaced by the Global Navigation Satellite System (GNSS). GNSS technology provides users with all-weather, real-time precise positioning, velocity, and timing information, making it one of the primary technical means for monitoring surface deformation [9,10,11]. Additionally, the vertical component of GNSS station coordinates is sensitive to deformation induced by hydrological loading, allowing for the investigation of short-term impacts of extreme rainfall events on surface displacement when integrated with hydrological models. Traditional hydrological monitoring methods rely mainly on meteorological and hydrological data, but the limited number and uneven distribution of hydrometeorological stations make it difficult for ground-based observations to reflect large-scale extreme hydrological events [12]. The Gravity Recovery and Climate Experiment (GRACE) satellite and its follow-on mission GRACE-FO were jointly developed by the National Aeronautics and Space Administration (NASA) and the German Aerospace Center (DLR) [13]. In contrast to conventional hydrological monitoring approaches, the GRACE satellites measure temporal variations in the Earth’s gravity field to derive changes in terrestrial water storage (TWSC) [14]. The TWSC is influenced by factors such as groundwater storage (GWS), soil moisture storage (SMS), snow water equivalent (SWE), and canopy water storage (CWS), which enables GRACE satellites to be widely applied in flood monitoring [10,15,16]. Moreover, other monitoring data—such as Interferometric synthetic aperture radar (InSAR), groundwater level measurements, and precipitation data—can be used for the quantitative analysis of groundwater storage changes (GWSC) and land subsidence [17,18].
The GRACE satellites, GNSS, and other multi-source data have been extensively employed in studies of GWSC and land subsidence. The study by Razeghi et al. in Australia’s Lachlan catchment demonstrates that, after correcting for multiple geophysical loading effects, GNSS-derived vertical displacement shows high consistency with groundwater level variations and effectively captures the impact of climate events such as droughts and floods on the groundwater system [19]. Tao et al. demonstrated the effectiveness of GNSS in monitoring short-term hydrological loading and explored the spatiotemporal evolution of surface deformation driven by hydrological signals [20]. Ojha et al. utilized InSAR, GRACE, and groundwater-level observation data to assess the recovery of aquifer systems following drought in multiple regions of the southwestern United States [21]. Zhang et al. investigated the factors influencing TWSC in the Yellow River Basin based on GNSS data [22]. Similarly, based on InSAR data, Song et al. investigated surface deformation caused by flooding in Nanchang. Their findings offer meaningful support for the structural monitoring of hydraulic engineering and the enhancement of disaster early warning systems [23]. In addition, Zhang et al. combined GRACE and GPS data to quantify groundwater storage variations during two drought episodes in California, demonstrating that groundwater depletion served as the dominant driver of observed surface subsidence [24].
In summary, previous studies have laid a foundation for understanding GWSC and land subsidence in the NCP. However, under the increasing frequency of extreme hydrological events, several critical questions remain to be further explored: (1) How do extreme rainfall events influence GWSC? (2) What are the mechanisms through which extreme rainfall affects land subsidence? (3) What are the recent dynamics of groundwater in the NCP in recent years? To address these questions, this article investigates the characteristics of GWSC and surface deformation triggered by extreme hydrological events (specifically rainfall) in the NCP, utilizing a multi-source data approach. Firstly, GWSC is calculated using GRACE satellite data, and, combined with precipitation data, the spatiotemporal evolution characteristics of these changes in the NCP are analyzed. Secondly, by integrating multi-source data, including environmental loading deformation data, GNSS vertical displacements, precipitation records, and groundwater well observations, and based on the theory of elastic load response, this research examines the patterns of surface deformation driven by hydrological signals during short-term extreme rainfall events. Concurrently, employing pore elasticity response theory, the article discusses and analyzes the land subsidence patterns at GNSS stations located above aquifers. Finally, by incorporating water resource statistics and related materials, the disaster effects caused by flood events are assessed. An in-depth investigation into the impact of extreme rainfall on GWSC and surface deformation in the NCP is of significant importance for improving subsidence monitoring and water resource management.

2. Study Area and Data

2.1. Study Area

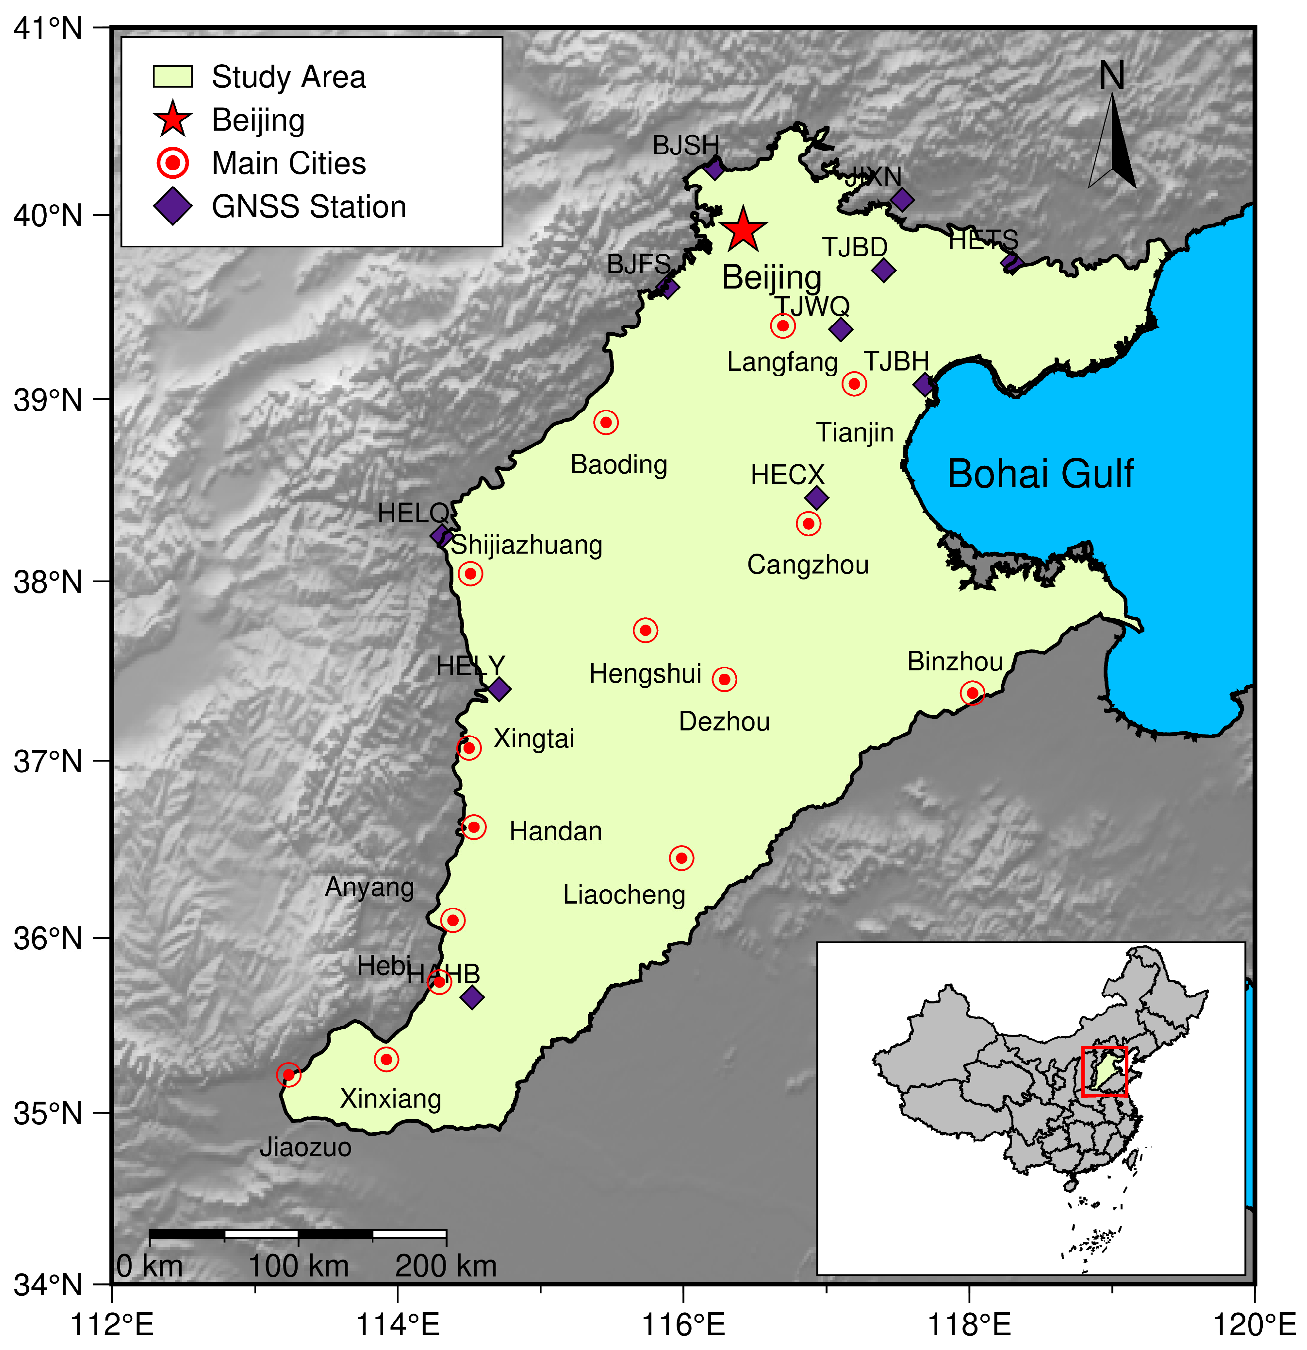
The North China Plain (NCP), located in northern China between 34° N~41° N and 113° E~120° E, is bounded by the Yellow River to the south, the Yan Mountains to the north, the Taihang Mountains to the west, and the Bohai Gulf to the east, as shown in Figure 1 [25]. It covers an area of approximately 185,640 km2 [26]. The NCP belongs to the subtropical monsoon climate on the eastern edge of the Eurasian continent. Summers are rainy, accounting for 70% of annual precipitation, while winters are dry, with significant interannual variability [27]. As one of China’s primary grain-producing regions, the NCP contains farmland constituting about 18.6% of the country’s total farmland area. Agricultural irrigation in the NCP predominantly relies on groundwater, with key irrigation periods occurring from July to September for corn and from March to mid-May as well as from October to mid-November for winter wheat [28]. Rapid socio-economic development and intensive agricultural irrigation have subjected the NCP to prolonged excessive groundwater extraction, resulting in a groundwater crisis and associated land subsidence issues. For details on groundwater permeability and related information, please refer to the supporting Text S1 [29,30].

2.2. Research Data Sources

The experimental data used in this article are shown in Table 1 and described in the following text.

2.2.1. GRACE Mascon Product

The launch of the GRACE gravity satellite in 2002 greatly advanced the field of Earth sciences. The traditional GRACE observation data is primarily given in the form of spherical harmonic coefficients, which require a series of preprocessing steps to obtain the corresponding physical quantities. In recent years, Mass Concentration (Mascon) products provided by the Center for Space Research (CSR), Jet Propulsion Laboratory (JPL), and Goddard Space Flight Center (GSFC) have eliminated the need for any post-processing [31]. However, due to monthly data gaps in the GRACE/GRACE-FO missions, many scholars have made significant efforts to address the missing-data phenomena [32,33,34]. This article selects the GRACE RL0603 CSR Mascon (https://icgem.gfz.de/home accessed on 12 December 2024) land equivalent water height (EWH) grid monthly product data from April 2002 to December 2024, published by CSR, to obtain the TWSC.

2.2.2. GLDAS Hydrological Model

Monthly data from the Global Land Data Assimilation System (GLDAS) GLDAS-2.1 NOAH (https://disc.gsfc.nasa.gov/datasets/GLDAS_NOAH025_M_2.1/summary?keywords=GLDAS accessed on 12 December 2024) is used to obtain surface water storage. GLDAS provides the SMS at depths of 0–200 cm, the SWE, and the CWS, which are used to track changes in surface water storage [35]. The temporal coverage and spatial resolution of the GLDAS data selected in this study are consistent with the GRACE data.

2.2.3. GNSS Data

Figure 1 shows the locations of GNSS stations provided by the National Earthquake Data Center (NEDC) (https://data.earthquake.cn/ accessed on 1 July 2023 to 31 August 2023 and 29 July 2010 to 26 July 2024). Eleven stations in the NCP region provided by the NEDC were used to analyze the movements related to the hydrological cycle, lasting from 1 July 2023 to 31 August 2023. The GNSS data have undergone high-precision processing and preprocessing using the GAMIT/GLOBK (version 10.40) software, resulting in time series data in the NEU (North–East–Up) coordinate system. The coordinates time series obtained from GNSS observations primarily include two types of non-tectonic crustal deformation effects. One is tidal deformation, and the other mainly includes Non-Tidal Atmospheric Loading (NTAL), Non-Tidal Oceanic Loading (NTOL), and Hydrological Loading (HYDL), which are variations in surface loads. To ensure data continuity, missing values in the GNSS vertical displacement time series were interpolated using the GNSS Missing Data Interpolation Software (GMIS, v. 1.0), and the data were subsequently smoothed with the Kriged Kalman Filter model [36]. Among these, the TJBD, TJBH, HAHB, HECX, and TJWQ are sediment stations, while the remaining stations are bedrock stations.

2.2.4. Environmental Loading Model Data

Currently, the environmental loading model data are provided by the International Mass Loading Service (IMLS) (https://massloading.smce.nasa.gov/massloading/#Download accessed on 31 August 2023) and GeoForschungsZentrum (GFZ) (https://rz-vm480.gfz.de/repository/) [20,37]. In addition, the model data provided by IMLS has a higher spatial resolution than GFZ. So the study selects the NTAL, NTOL, and HYDL data provided by IMLS and analyzes surface deformation patterns in combination with GNSS data. The NTAL and HYDL are calculated based on spherical harmonic transformation and load Lovelace numbers using the MERRA2 physical model [38,39]. The NTOL is derived using the MPIOM06 model based on Green’s function calculations.

2.2.5. Precipitation Data

The Global Precipitation Measurement (GPM) satellite uses a combination of multiple sensors, satellites, and algorithms, along with satellite networks and rain gauges, to retrieve high-precision rainfall data [40]. The spatial resolution of GPM data is 0.1° × 0.1° (covering the globe from 60° S to 60° N). This study selects the GPM 3IMERGM_07 product data (https://disc.gsfc.nasa.gov/datasets/GPM_3IMERGDF_07/summary?keywords=GPM accessed on 12 December 2024) for rainfall data.

2.2.6. Well Data

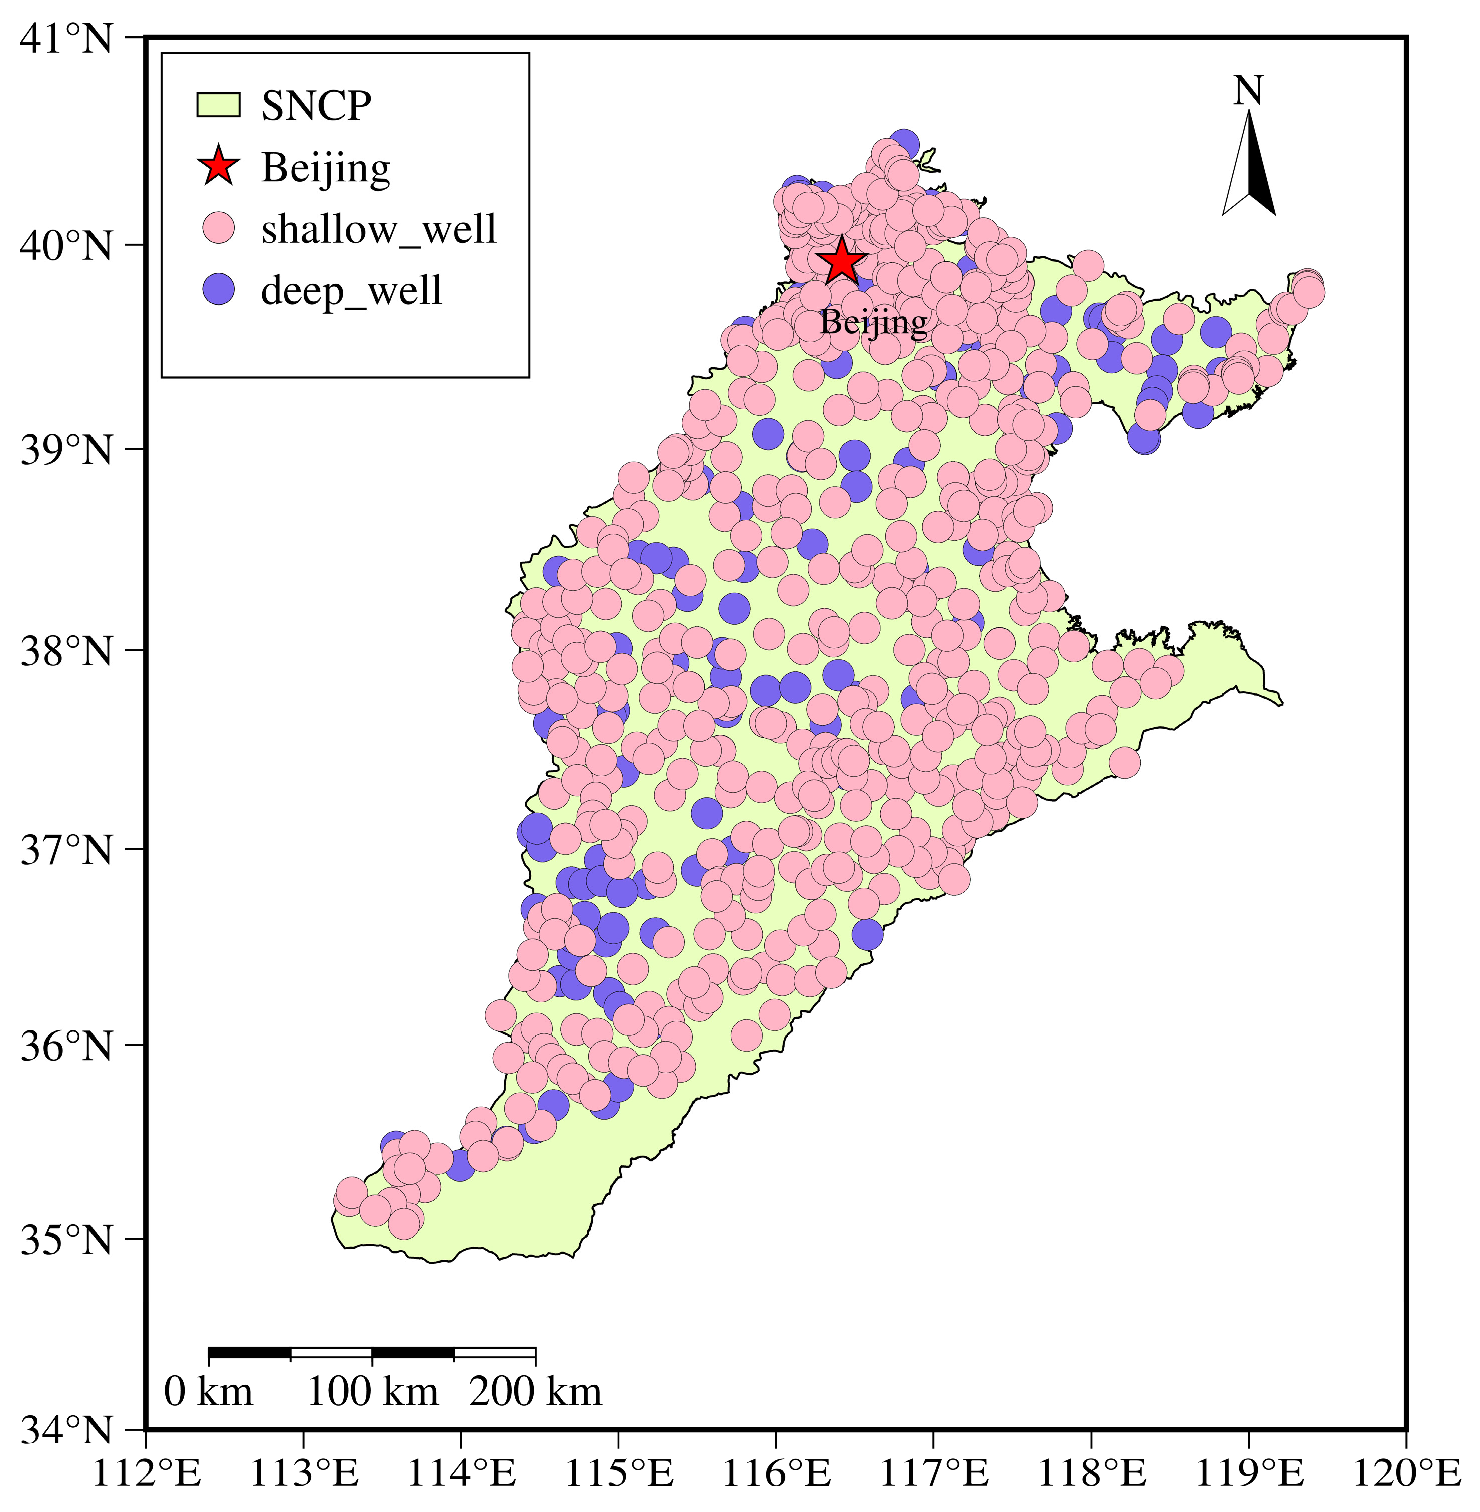
The groundwater well data, comprising a total of 1226 shallow and confined wells, were provided by the China Geological and Environmental Monitoring Institute. The data represent the depth to the water table, measured in meters (m). The daily data from 1 July 2023 to 31 August 2023 is shown, as indicated by the well locations in Figure 2.

3. Methods

3.1. Determining GWSC from GRACE Data

The CSR-released Mascon product provides the TWSC data in gridded format, including corrected grids. These data represent surface mass deviation anomalies relative to the baseline mean from January 2004 to December 2009 [41]. To analyze groundwater variations using GRACE satellite observations, GWSC is calculated based on the water balance equation [42]. The formula is as follows:
G W S C = T W S C − S M S C − S W E C − C W S C ,
where GWSC represents the groundwater storage anomaly; TWSC is derived from Mascon products; SMSC, SWEC, and CWSC represent changes in soil moisture storage (SMS), snow water equivalent (SWE), and canopy water storage (CWS), respectively, with data derived from GLDAS; all sections are expressed in terms of EWH, measured in centimeters.
Among these, the GLDAS model preprocessing aligns with GRACE by removing the gravity field mean values from January 2004 to December 2009. Furthermore, for missing months, Singular Spectrum Analysis (SSA) interpolation was employed to interpolate GWS data, yielding monthly GWSC across the NCP from April 2002 to December 2024 [34]. For the locations of missing values interpolated by SSA, please refer to the Supplementary Figure S2.

3.2. Disk Load Elastic Deformation

Due to the elastic structure of the Earth, large-scale mass migration can cause the Earth to undergo load deformation [11]. Green’s functions provide a theoretical framework to model the Earth’s elastic deformation in response to surface mass loads from water, snow, ice, and atmospheric sources [43]. This load-induced deformation comprises both horizontal and vertical components. Notably, the vertical displacement exhibits greater sensitivity to the loading, typically exceeding the horizontal component by a factor of 2 to 3 [44]. The principle of the Green’s function method for vertical displacement caused by loads is as follows [45].
When assuming a disk of uniform mass with angular radius α covers the ideal Earth’s surface, its mass is represented by the EWH h , a is the radius of the Earth, and ρ ω is the density of water. Then, the mass of the disk is
M = 2 π a 2 1 − cos α h ρ ω ,
The vertical load deformation generated by the mass disk can be described by the Green’s function:
S u p = ∑ n = 0 ∞ h n Γ n 4 π G a g 2 n + 1 P n cos θ ,
where P n is the Legendre polynomial; θ is the angle to the center of the disk; G is Newton’s gravitational constant; h n is the loading Love number, g is the gravitational acceleration; the derivation of the Γ n function is shown in Equations (4) and (5).
Γ n = 1 2 P n − 1 cos α − P n + 1 cos α     n > 0 ,
Γ n = 1 2 1 − cos α   ,
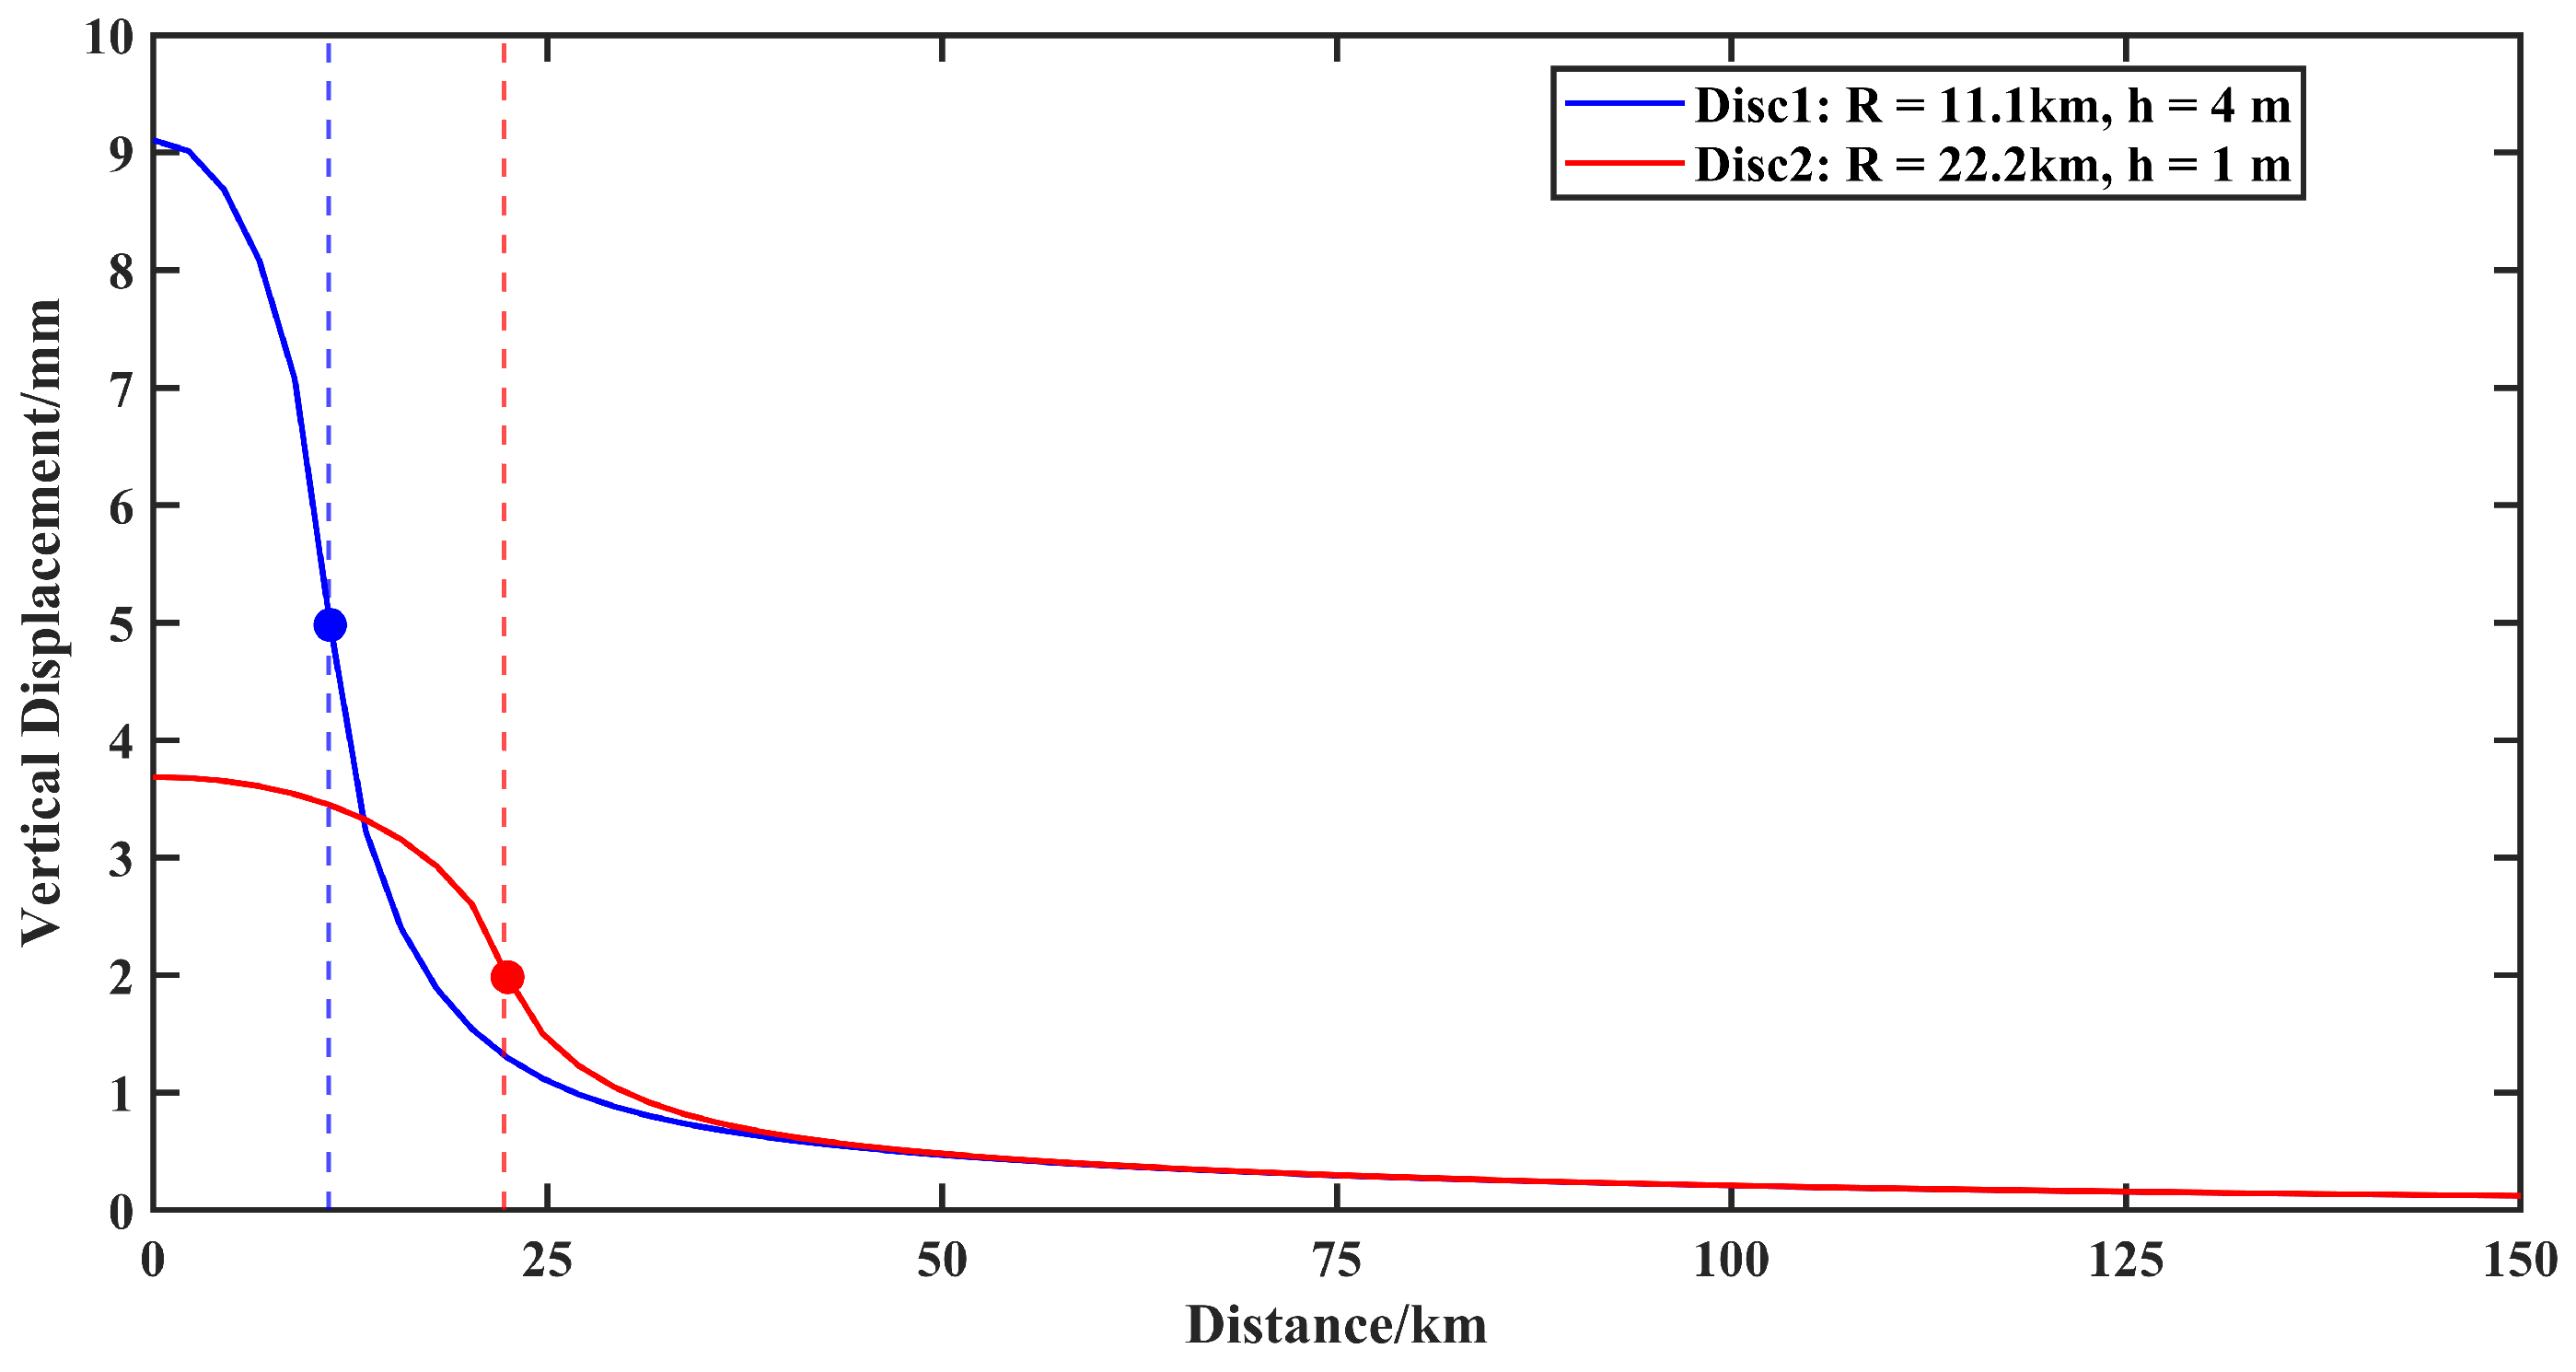
If disks of equal mass but varying radii and thicknesses were removed from the idealized Earth’s surface, the Earth would deform such that nearby points on its surface would move upward [46]. As shown in Figure 3, the near-field load response is pronounced when the two disks are placed on the ground surface. The maximum vertical displacement occurs at the disk centers, reaching peak values of 9.1 mm and 3.7 mm, respectively. The vertical displacement decreases rapidly with increasing distance from the disk center. When the distance from the disk center equals the disk radius (position marked by the circle in Figure 3), the load response is only half that at the center. Beyond this point, the rate of decrease slows as distance increases until the response essentially vanishes.
The TWSC result in crustal elastic loading, while GWSC leads to a porous elastic response from the aquifer top surface [47]. The former is used to describe the elastic deformation of the Earth caused by surface loading. However, porous elastic theory combines changes in porous elastic pressure within the aquifer system with corresponding surface deformation [48].
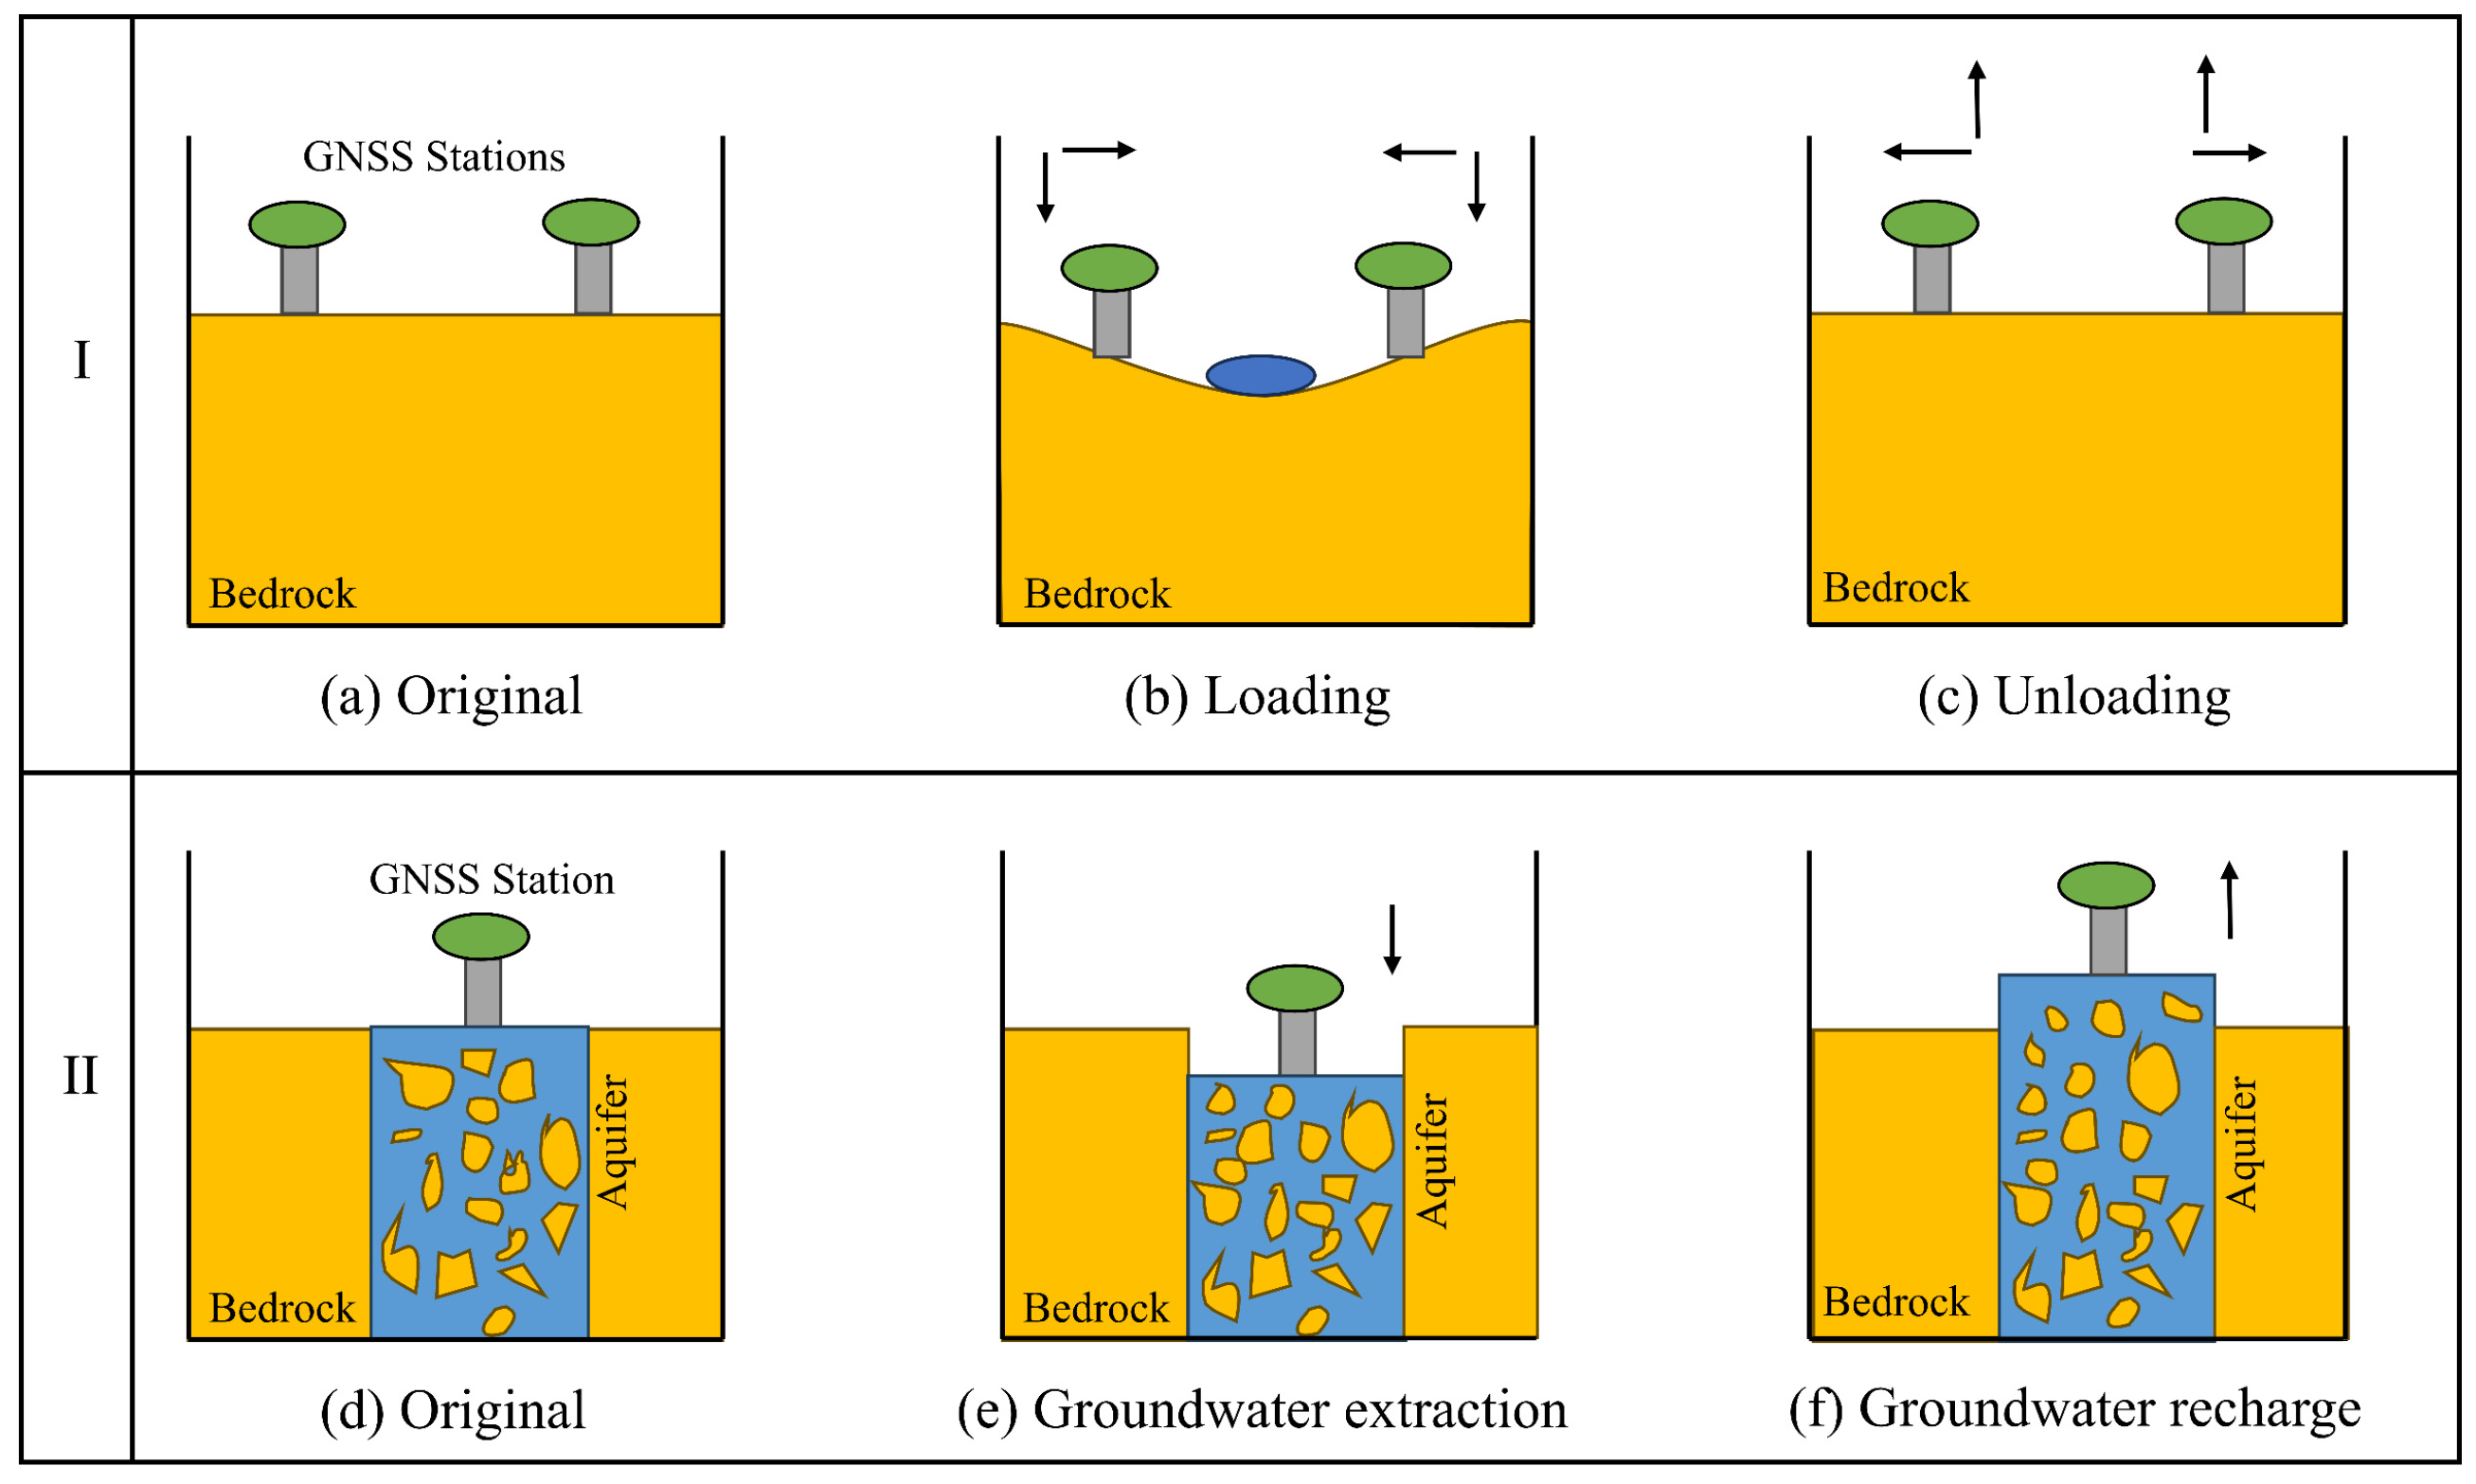
To examine the distinction between the two hydrological loading processes, the surface load responses at GNSS stations are depicted in Figure 4. The first scenario (Figure 4(I)a–c) corresponds to the elastic load response, where the GNSS station is located at the Earth’s surface under unloaded conditions (original state, Figure 4a). When surface loads such as atmospheric, oceanic, or hydrological loads are applied, the surface subsides and displaces toward the load (Figure 4b). Upon load removal, elastic rebound of the Earth causes uplift and displacement away from the load direction (Figure 4c). The second scenario illustrates the porous elastic response (Figure 4(II)d–f), with the GNSS station situated above an aquifer under initial conditions (original state, Figure 4d). In the case of groundwater storage changes, if an aquifer is experiencing water extraction (water pumping), pore pressure decreases and the aquifer will undergo compaction. The surface deformation response to compaction is subsidence (Figure 4e). In the case of aquifer recharge, pore pressure increases and the surface will uplift due to the corresponding expansion (Figure 4f).

4. Analysis and Discussion of Results

4.1. GWSC of NCP

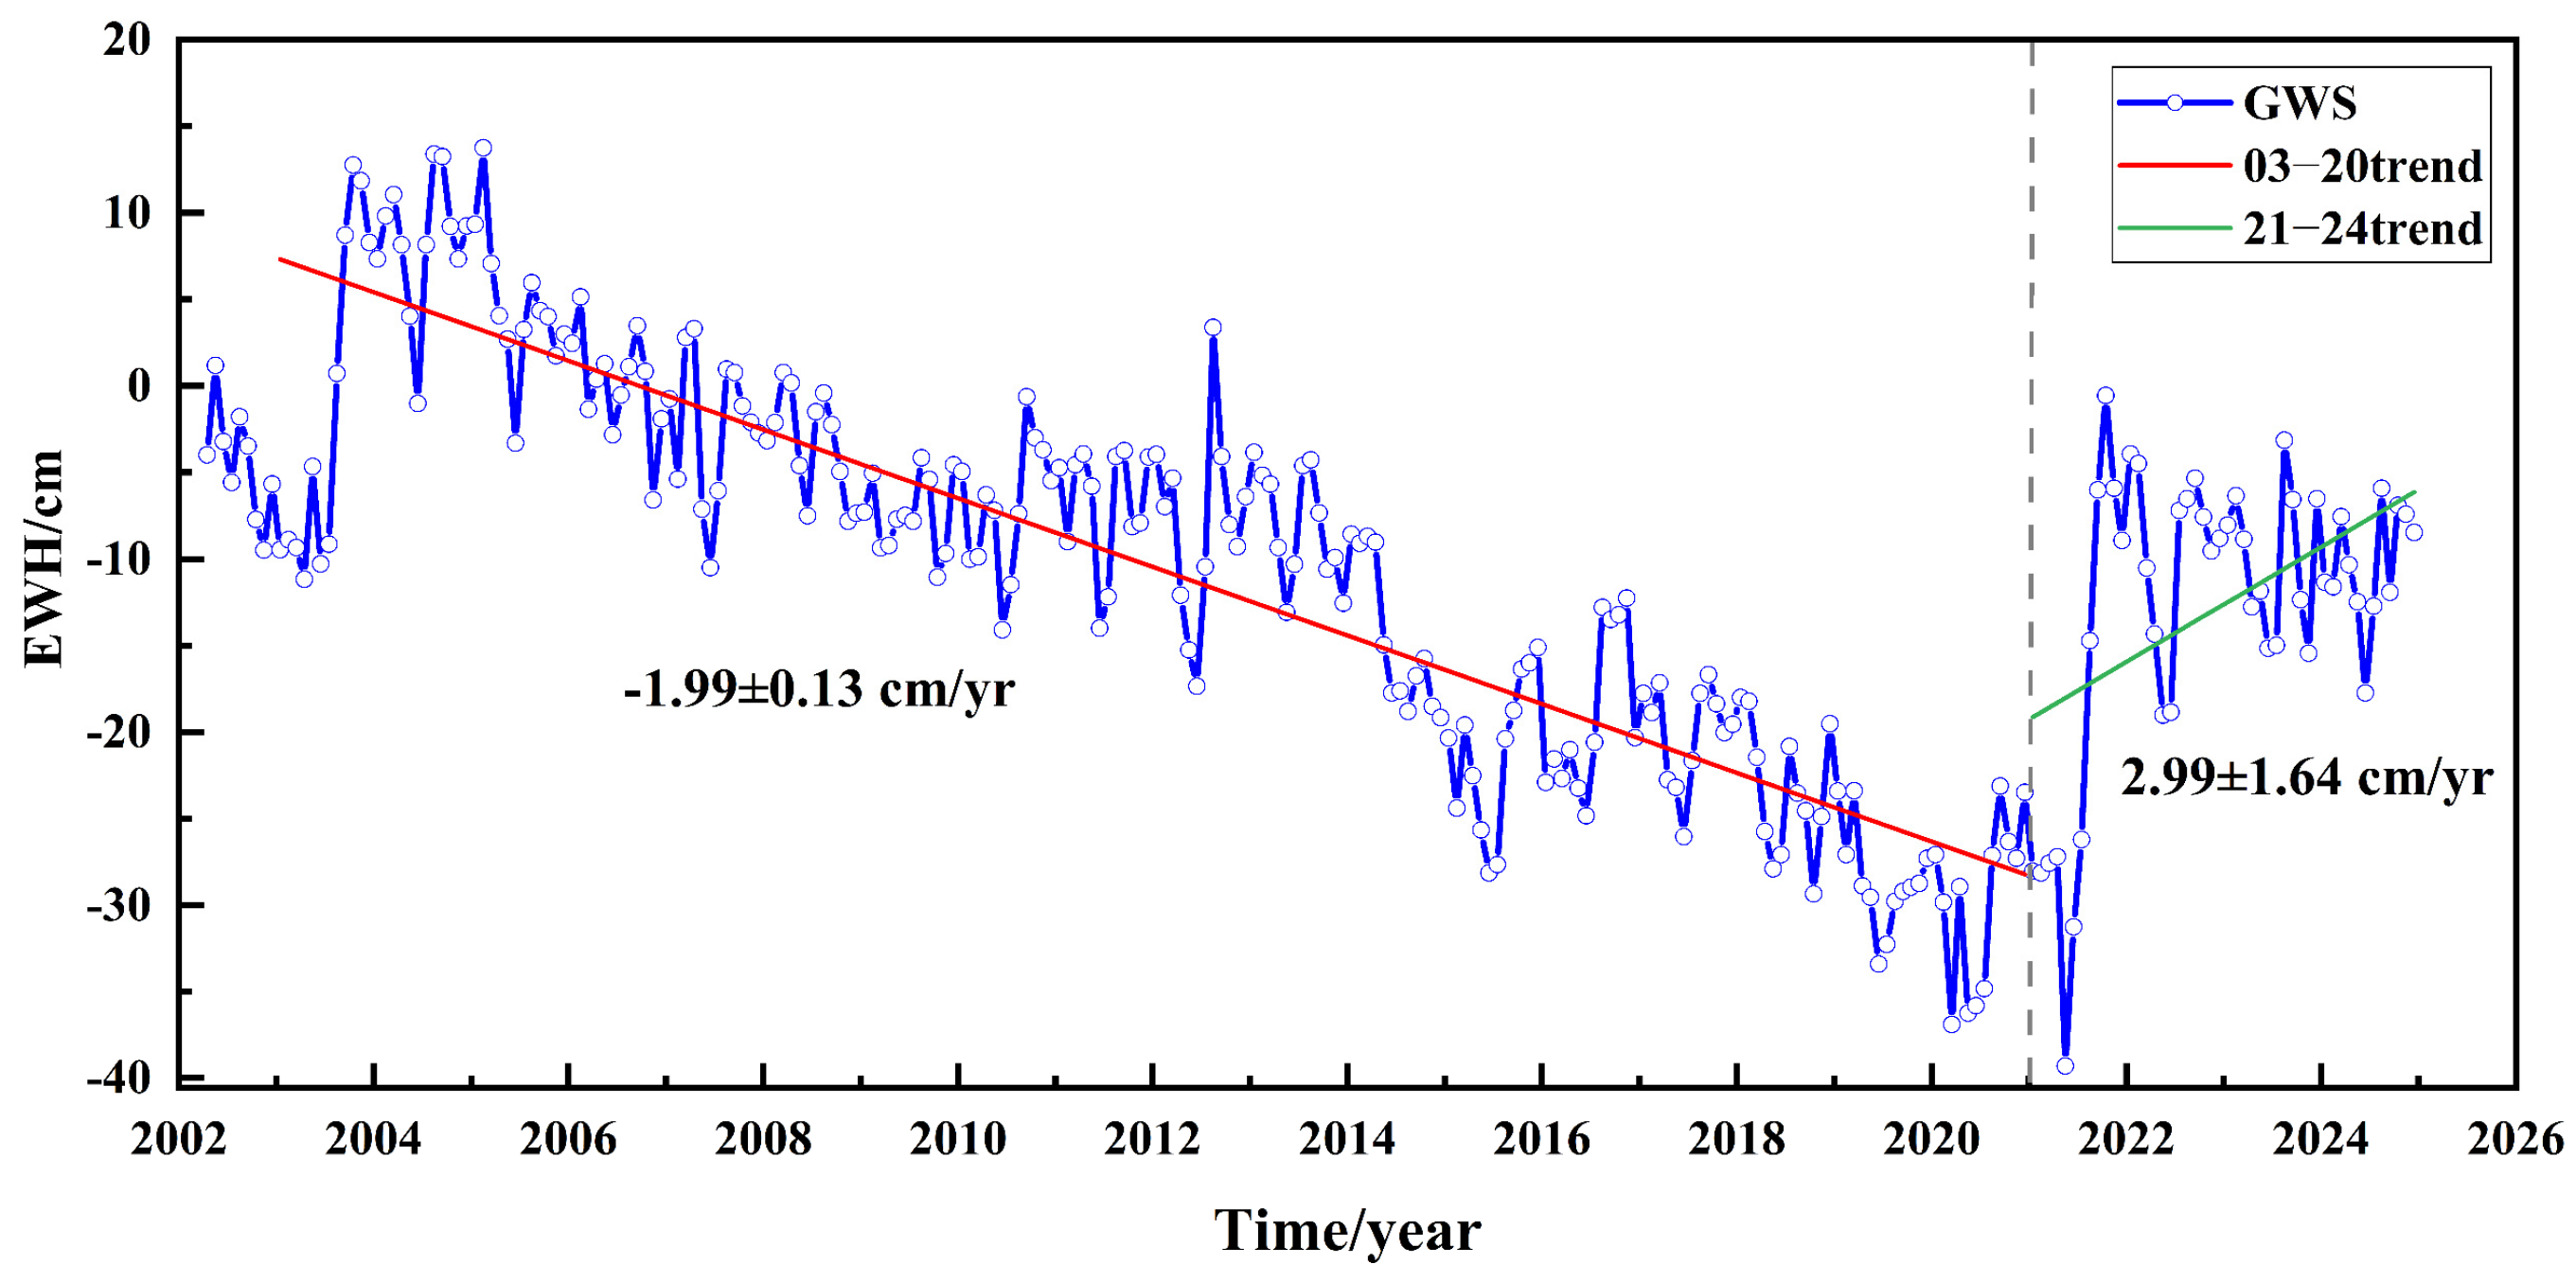
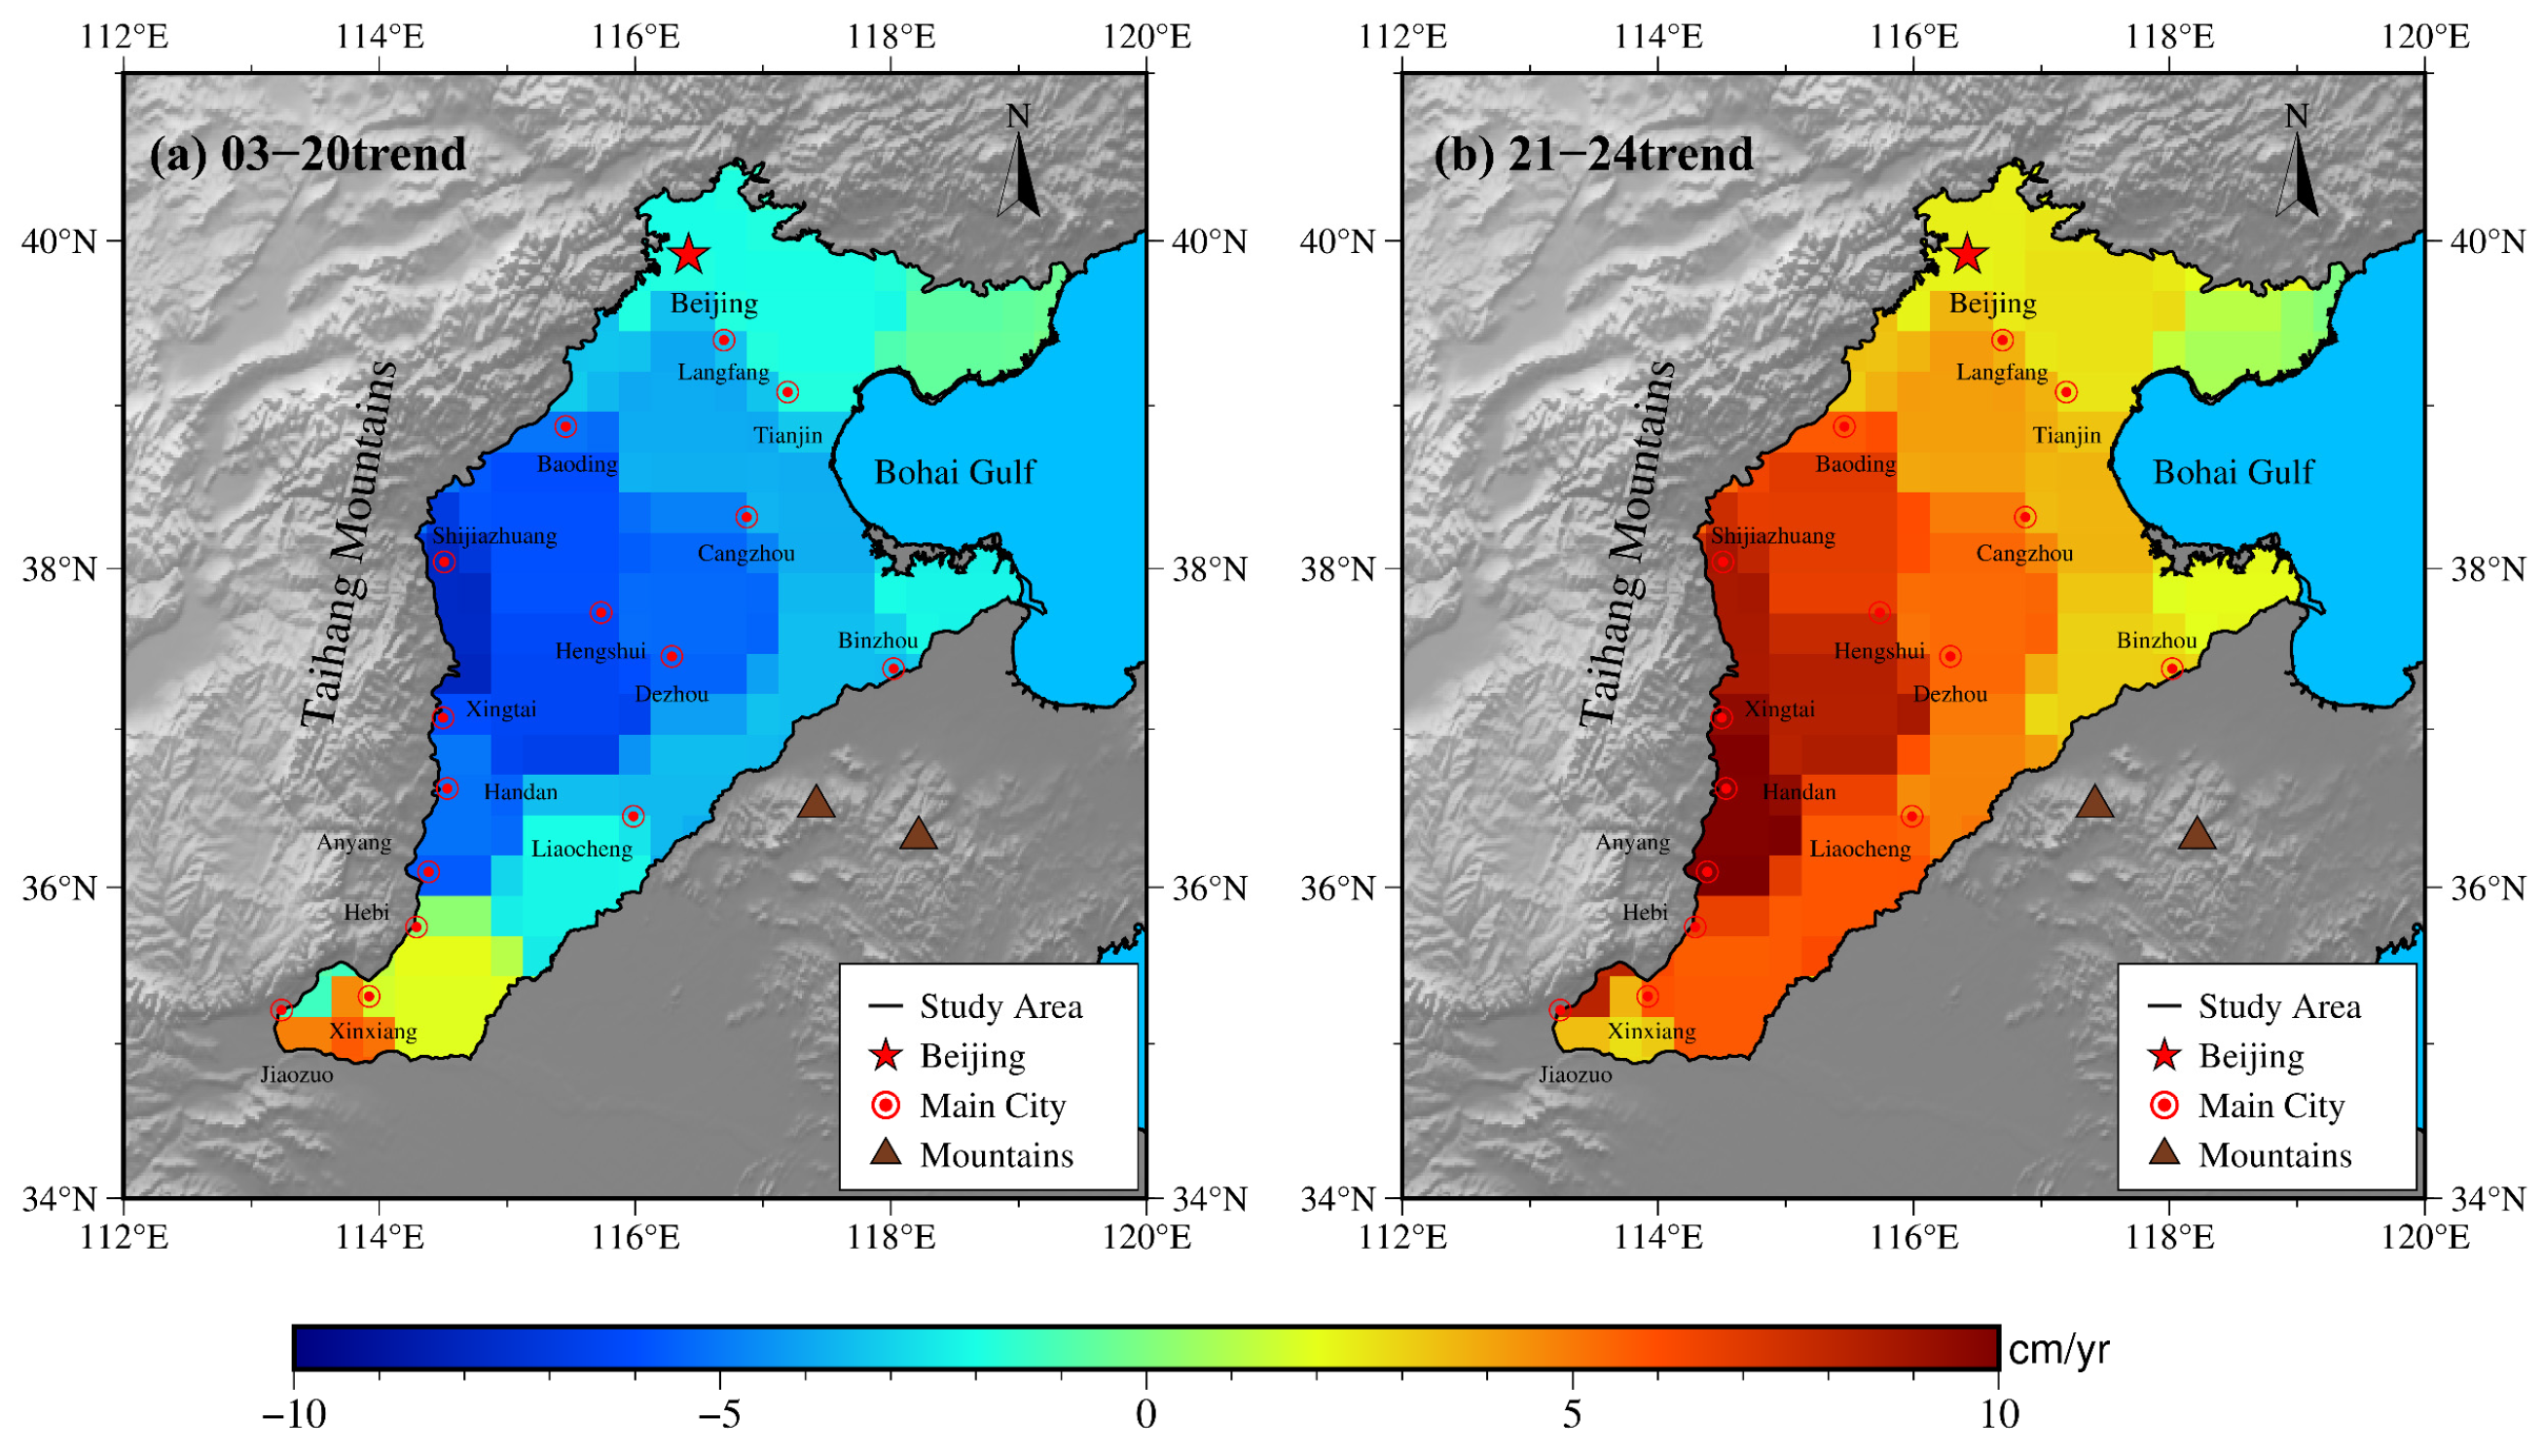
Figure 5 presents the time series of the GWSC in the NCP from April 2002 to December 2024. The long-term trend is characterized by two phases: 2003–2020 and 2021–2024. As can be observed from the figure, the GWSC in the NCP exhibited a significant long-term declining trend between 2003 and 2020. Following 2021, GWSC began to show a recovery trend. Based on the least squares fitting method, the linear trends were estimated as −1.99 ± 0.13 cm/yr for the period from January 2003 to December 2020, and 2.99 ± 1.64 cm/yr for the period from January 2021 to December 2024. Based on this analysis, we derived the spatiotemporal patterns of the GWSC across the NCP, as shown in Figure 6. The period from 2003 to 2024 in the NCP can be broadly divided into two phases. Phase I (2003–2020): the GWSC showed a continuous declining trend, reflecting sustained groundwater depletion. Most areas experienced a reduction rate of approximately 5 cm/yr (Figure 6a). Phase II (2021–2024): GWSC increased rapidly and then stabilized at a plateau, indicating notable groundwater recovery and a significant mitigation of water scarcity. Most areas are growing at a rate of approximately 7 cm/yr (Figure 6b). In addition, Figure 5 indicates that Groundwater Storage (GWS) also exhibited a significant upward trend during the period 2003–2004

4.2. Precipitation

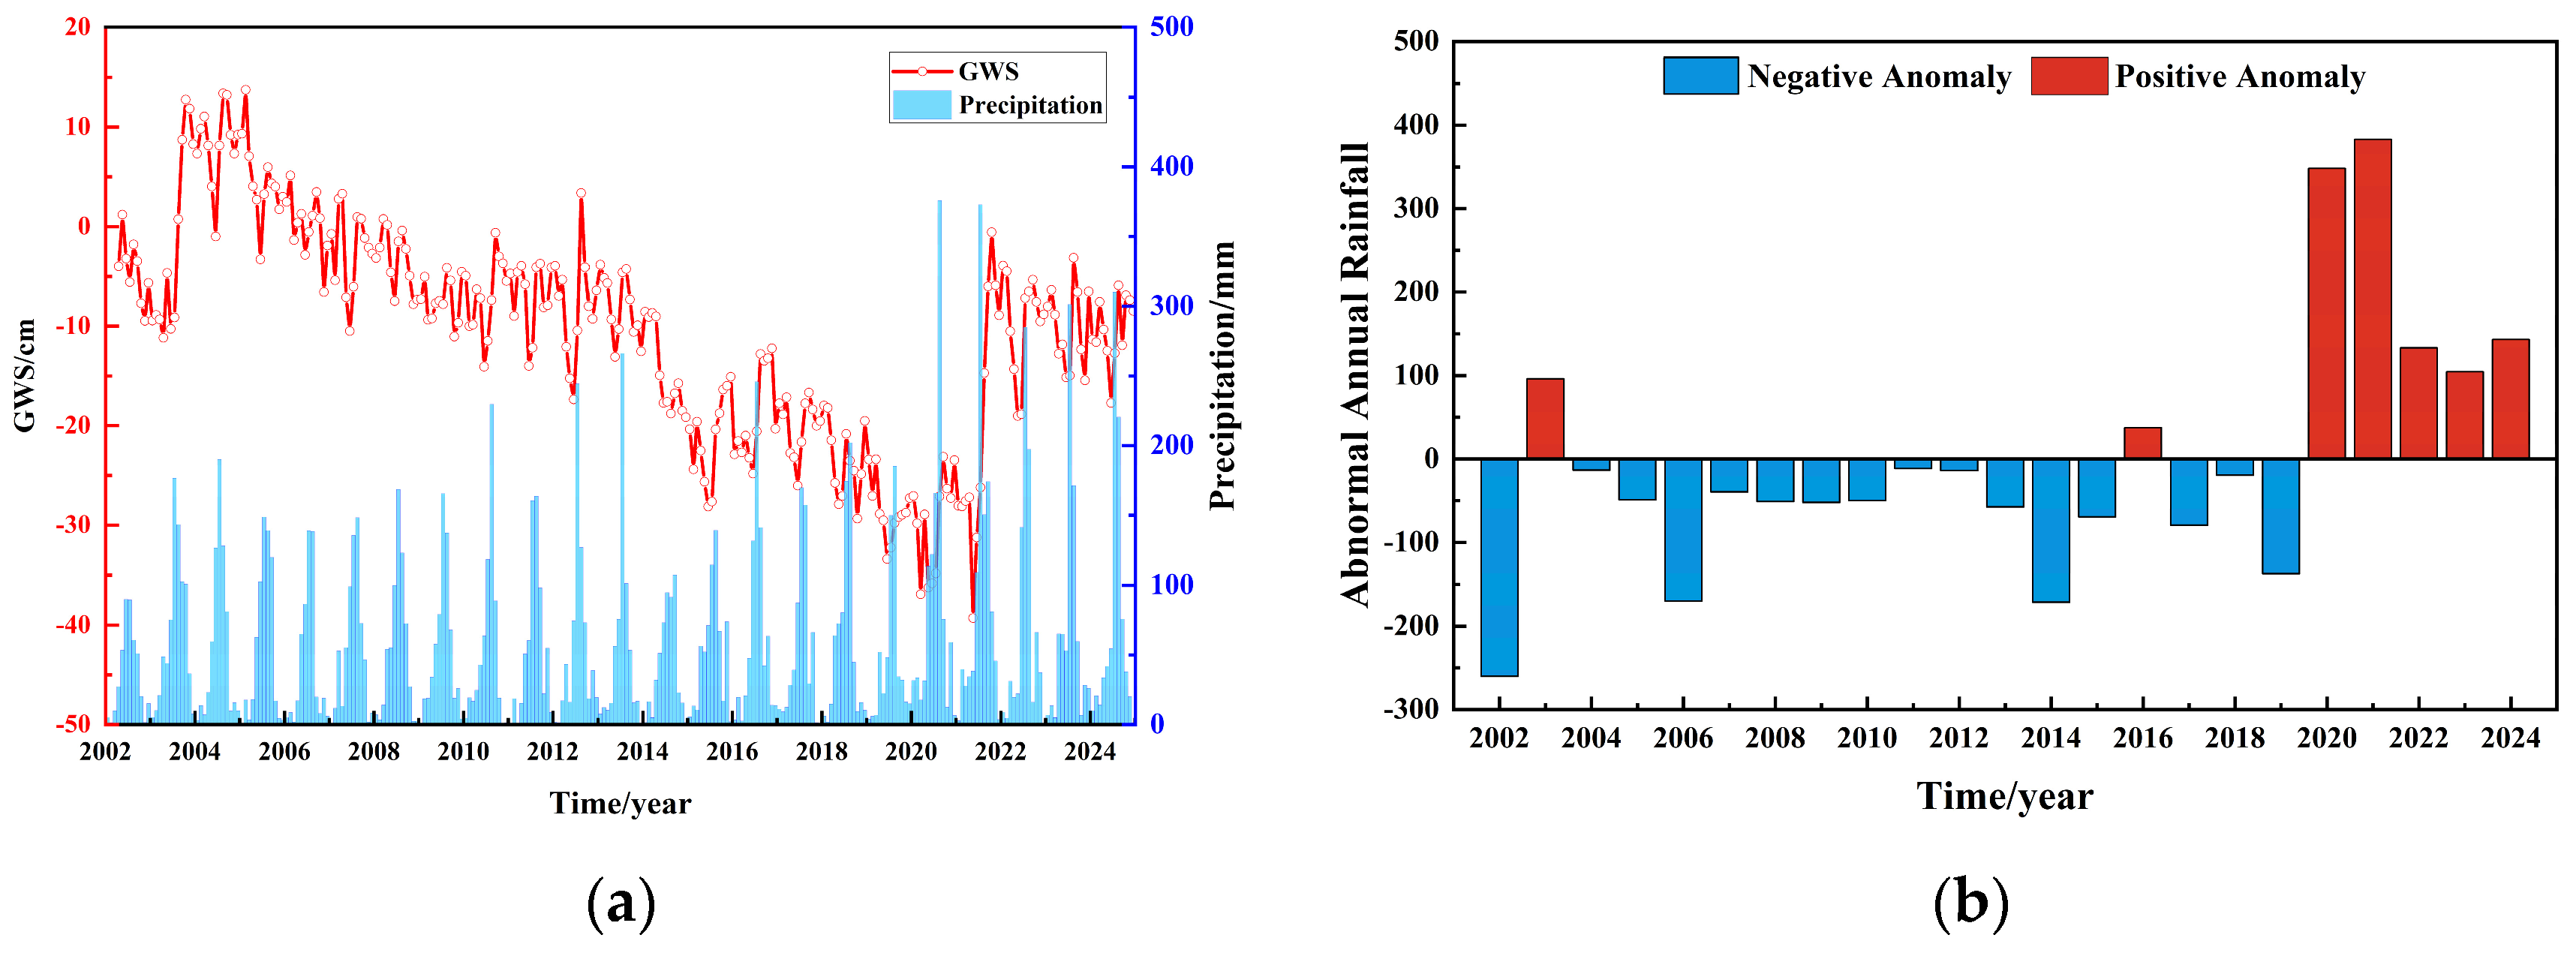
Figure 7a depicts the temporal pattern of monthly precipitation over the NCP during 2002–2024, characterized by concentrated heavy rainfall from July to September. For details on the selection of the extreme rainfall threshold, please refer to Supplementary Text S3. As shown in Figure 7, increased precipitation contributes to GWS, leading to a recovery trend in GWS. The heightened summer rainfall reduces reliance on groundwater for agricultural irrigation during the latter half of the year, thereby alleviating extraction pressure. Consequently, on an annual scale, the overall GWSC in the NCP exhibits a pattern of initial decline followed by recovery. In conjunction with Figure 7b, the notable increase in precipitation from 2020 to 2022, coupled with the lagged response of groundwater recharge to rainfall, resulted in an upward trend in GWSC from 2021 to 2023. While the total rainfall in 2003 was less than the cumulative rainfall from 2020 to 2024, it represented a significant increase compared to the very low precipitation in 2002. This substantial year-on-year rise in rainfall greatly contributed to groundwater recharge. Therefore, the turning point in GWSC observed in the NCP from 2003 to 2004, as shown in Figure 5, can be attributed primarily to this notable replenishment from the increased rainfall in 2003. Precipitation serves as a crucial natural source for groundwater recharge, a finding consistent with numerous scholarly studies [42,48,49]. The curve of monthly mean temperature over the NCP is provided as a reference in Supplementary Figure S4 [50].

4.3. Impact of Extreme Rainfall on Surface Deformation

4.3.1. Distribution of Rainfall

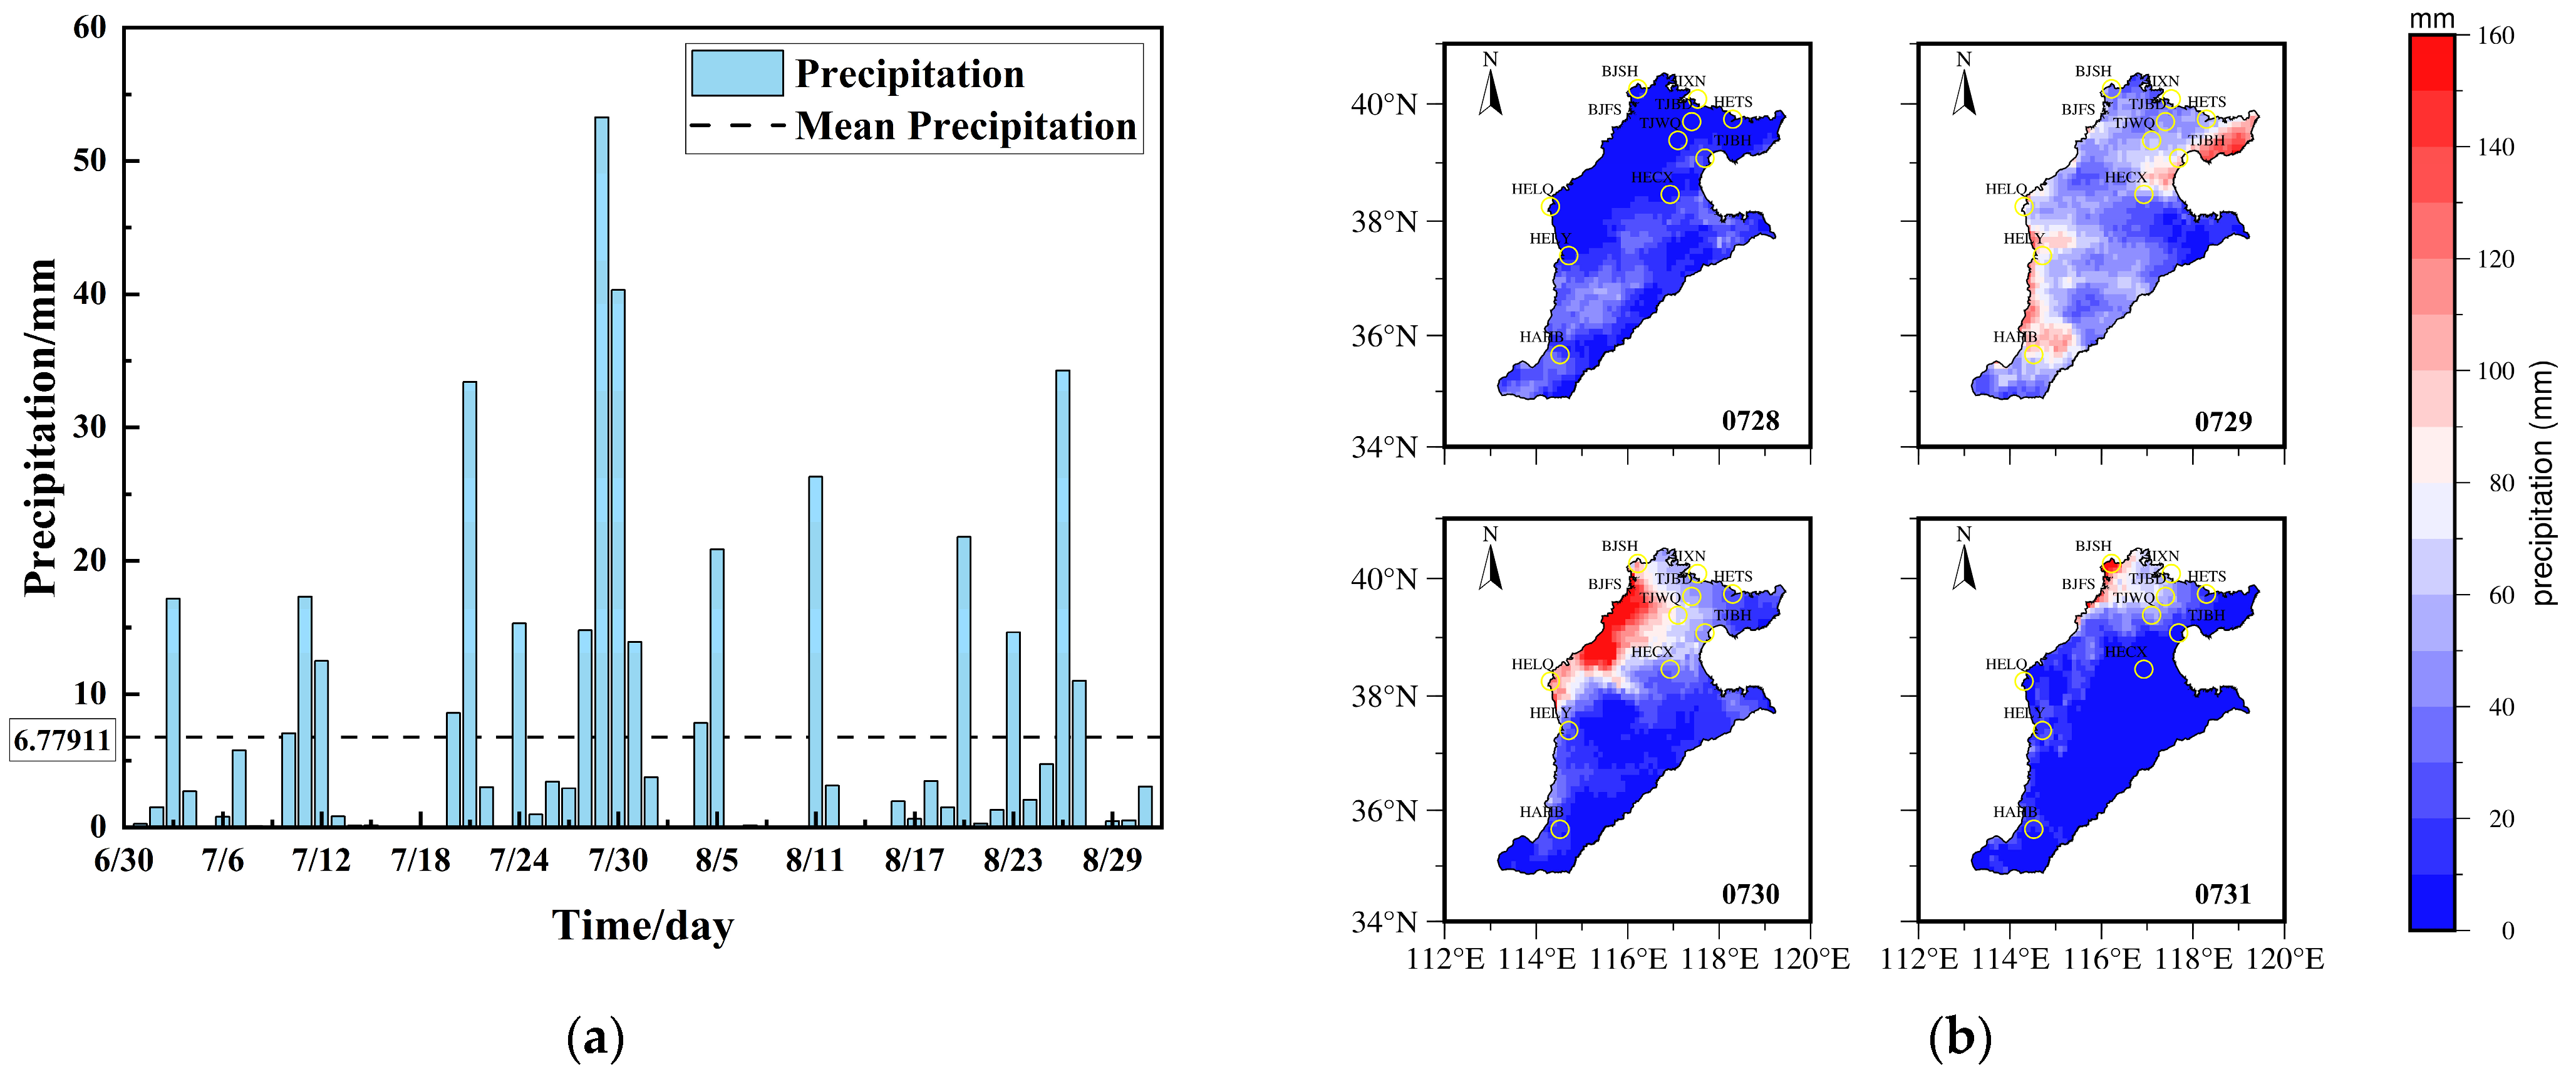
Due to the convergence of the subtropical high over the northwestern Pacific and Typhoons “Dussuri” (No. 5) and “Kanu” (No. 6) in 2023 precipitated an extreme rainstorm event in North China from 28 July to 3 August 2023 [7]. For the convenience of research, this study selected multi-source data from 1 July to 31 August 2023, for computational processing. Figure 8 is a distribution map of the average daily rainfall in the region during the period. The cumulative rainfall for each day from 01 July to 31 August 2023, in the NCP region is shown in Figure 8a. According to China Meteorological Standards, rainfall exceeding 50 mm in 24 h or 30 mm in 12 h is defined as a torrential rain. As can be seen from Figure 8a, the regionally averaged daily rainfall exceeded 50 mm on 29 July. Rainfall was primarily concentrated in the Piedmont Plain, with a single-day rainfall reaching as high as 160 mm on 30 July 2023.

4.3.2. Impact of NTAL and NTOL on Surface Deformation

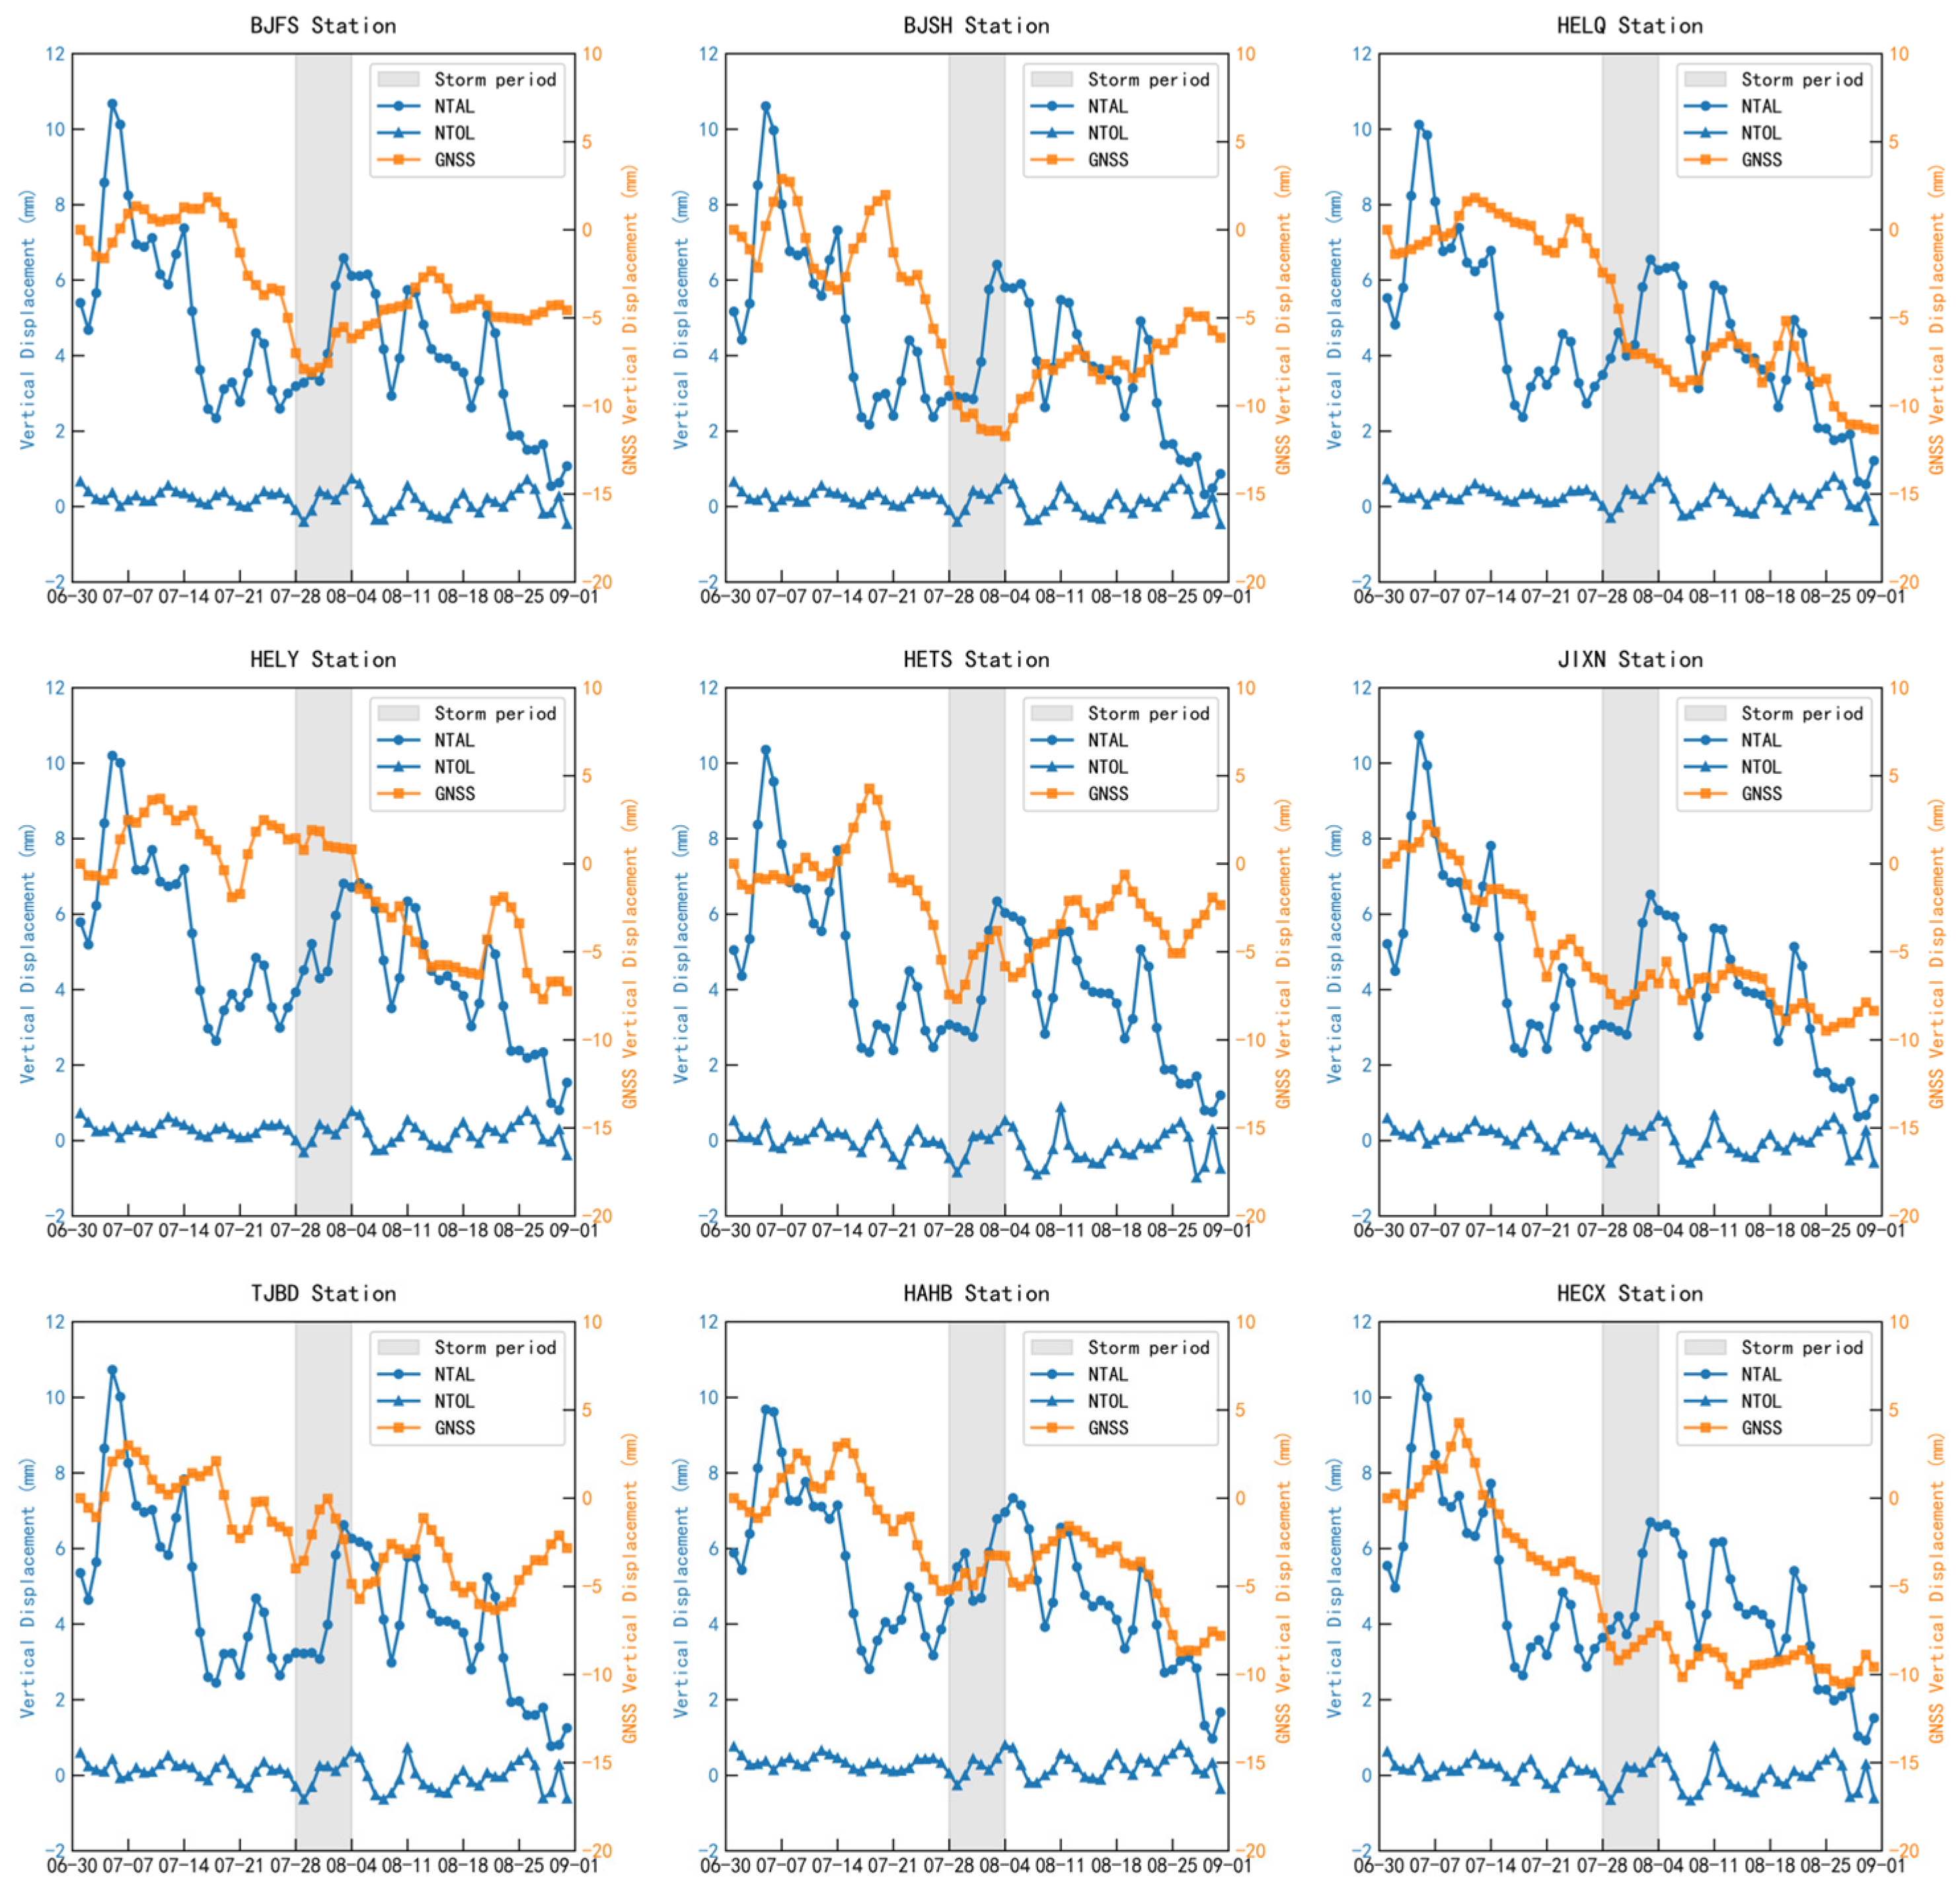
Based on the NTAL and NTOL models provided by the IMLS, the data were processed to generate vertical deformation maps, as shown in Figure 9. Figure 9 displays the results from nine GNSS stations (excluding station TJWQ due to severe data gaps; anomalous station TJBH will be discussed separately). The vertical displacements are referenced to the subsidence value recorded on 1 July 2023. The following observations can be made from Figure 9.
The blue curves in Figure 9 represent the vertical deformation maps for NTAL and NTOL, respectively, while the orange curve indicates the GNSS vertical deformation map. As the heavy rainfall arrived, NTAL peaked around 4 August, with the average deformation at each station increasing by approximately 4 mm compared to 28 August. After the heavy rainfall subsided, the surface load caused by NTAL began to gradually decrease. Around 10 August, surface deformation at each station returned to normal pre-rainfall levels. Subsequent fluctuations were also caused by rainfall, as shown in the rainfall distribution section below. Compared to NTAL, NTOL exhibited overall stability, with only a gradual increase during heavy rainfall, causing surface deformation within 1 mm. NTAL resulted in greater overall vertical displacement of the ground surface.

4.3.3. Impact of HYDL on Surface Deformation

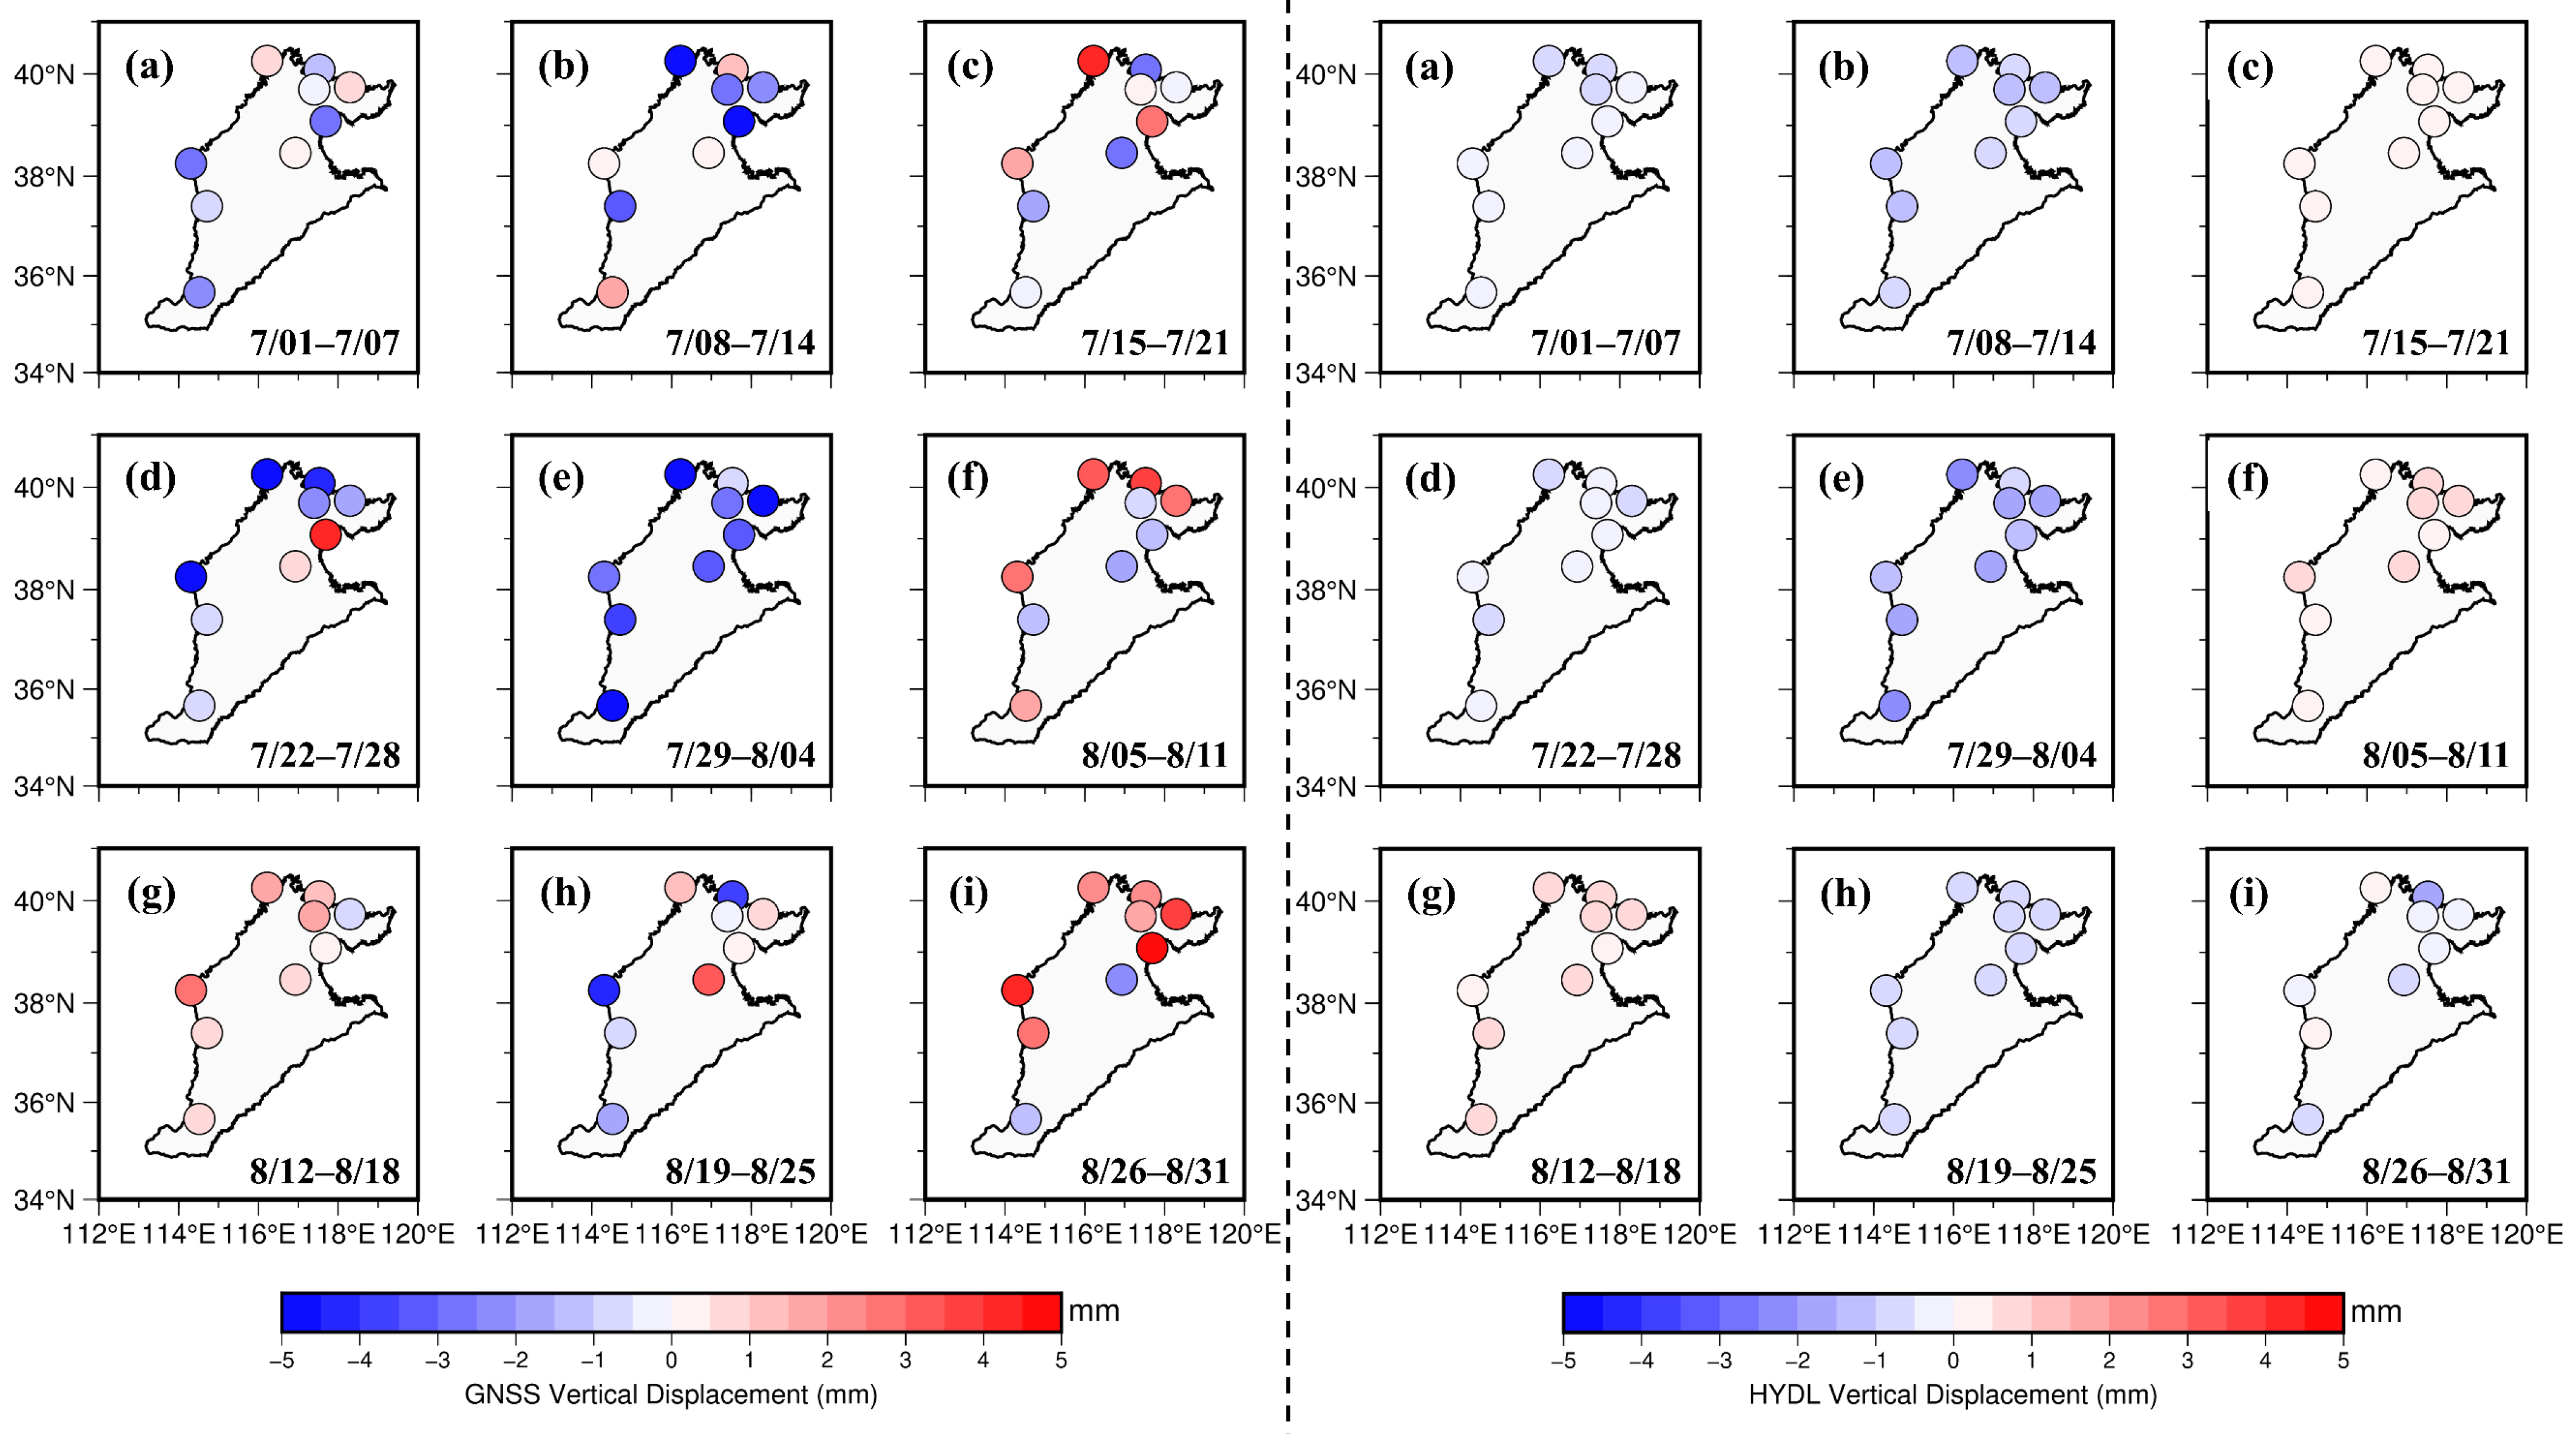
To investigate the deformation patterns driven by hydrological signals during extreme rainstorms on the NCP, the NTAL and NTOL signals were removed from GNSS vertical displacement data to extract deformation components attributable to HYDL. A 7-day cycle is divided into nine time segments, as shown in Figure 10, denoted by (a) to (i) (the TJBH station will be discussed separately later). Prior to July 28 (Figure 10a–d), most GNSS stations exhibited only minor changes in vertical deformation under the HYDL model. During the heavy rainfall period from July 28 to August 4 (Figure 10e), increased HYDL caused rapid subsidence at GNSS stations. Among the stations, such as BJSH, HETS, and HAHB, the responses are most pronounced. The vertical deformation estimated by the HYDL model was approximately 2 mm, while the HYDL deformation measured by GNSS was around 5 mm. As the heavy rainfall subsided (Figure 10f,g), surface water levels were replenished, and water levels at each station began to rise gradually. As shown in Figure 10, the vertical displacement deformation of the GNSS station during heavy rainfall exhibits an elastic response consistent with the elastic theory of disc loading.
Compared with the HYDL model provided by the IMLS agency, GNSS data generally show consistent trends. The average correlation coefficient across all monitoring stations is 0.60, with stations such as HELQ and HECX exhibiting particularly high coefficients of 0.85 and 0.89, respectively. This indicates that the vertical deformation caused by HYDL from the IMLS agency is fundamentally consistent with GNSS monitoring results. However, the model deformation values are significantly smaller than the GNSS observations. This is because short-term heavy rainfall primarily affects surface water, whereas GNSS provides deformation data reflecting both surface- and groundwater loads. The vertical deformation caused by the HYDL is larger and exhibits a longer deformation cycle [26,51]. GNSS is more effective at monitoring short-term hydrogeological deformation during heavy rainfall, offering valuable information for monitoring and forecasting disasters such as typhoon-induced flooding.

4.4. Impact of Extreme Rainfall on Groundwater

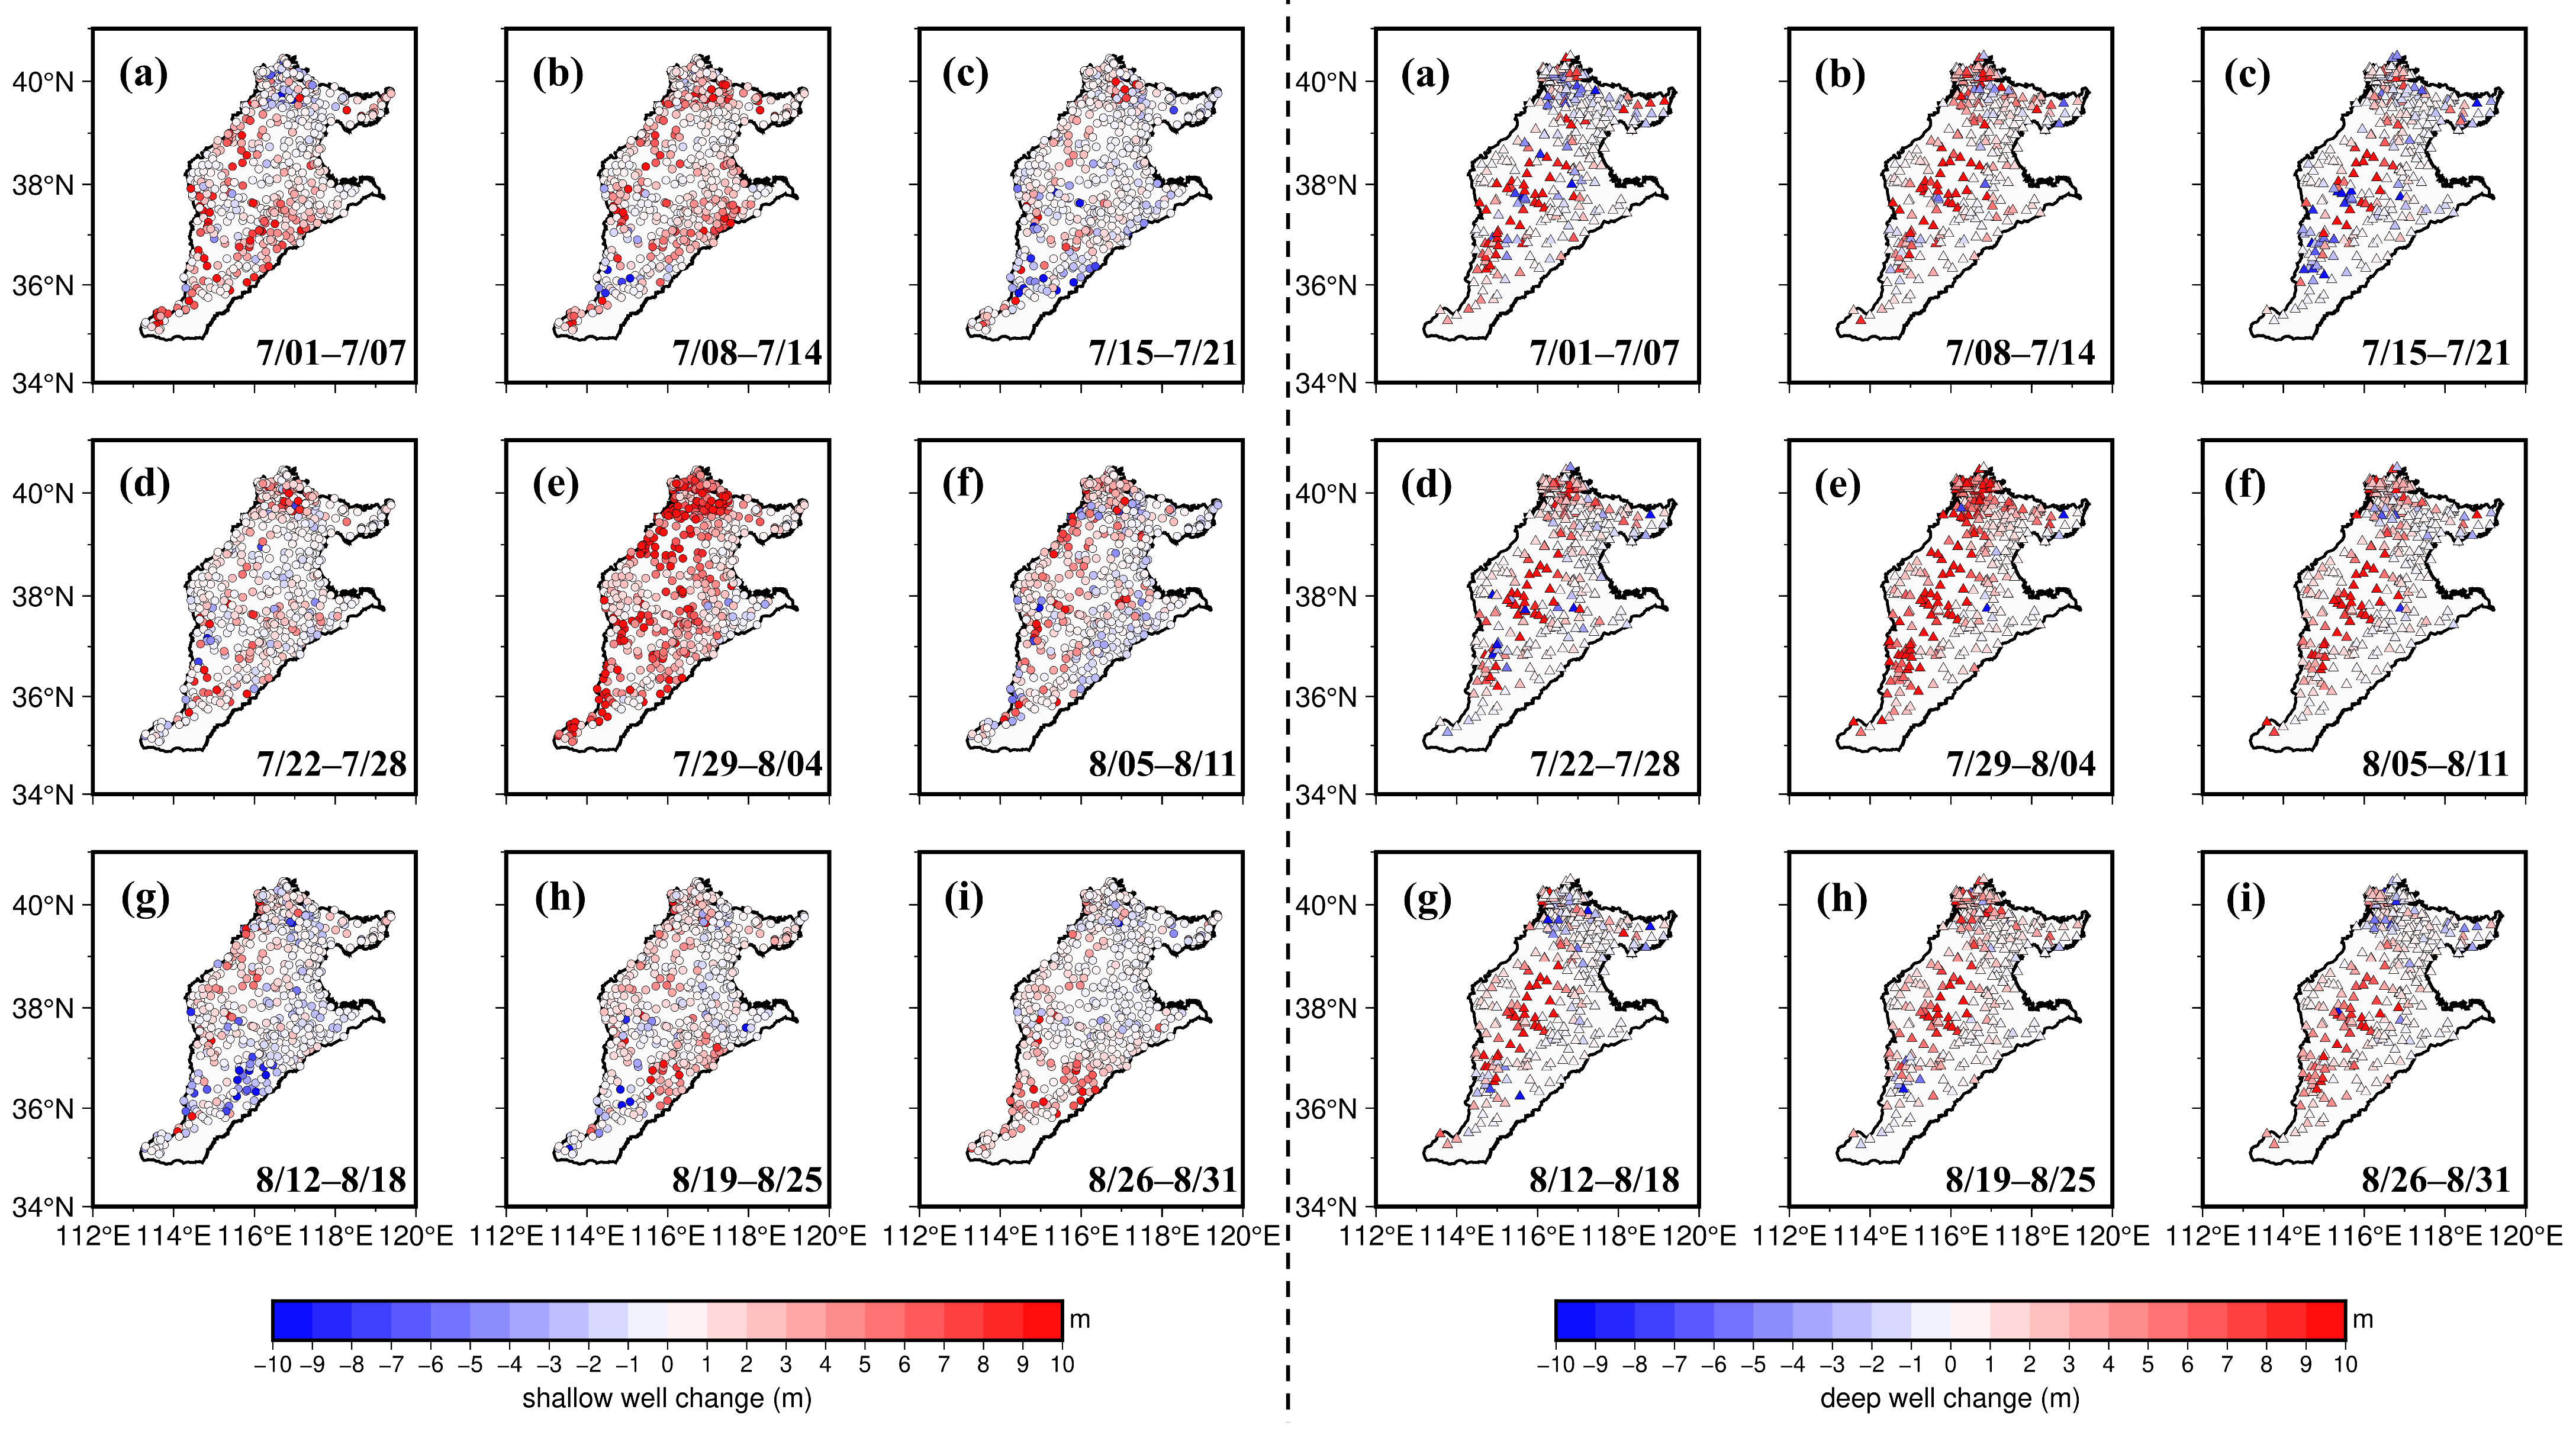
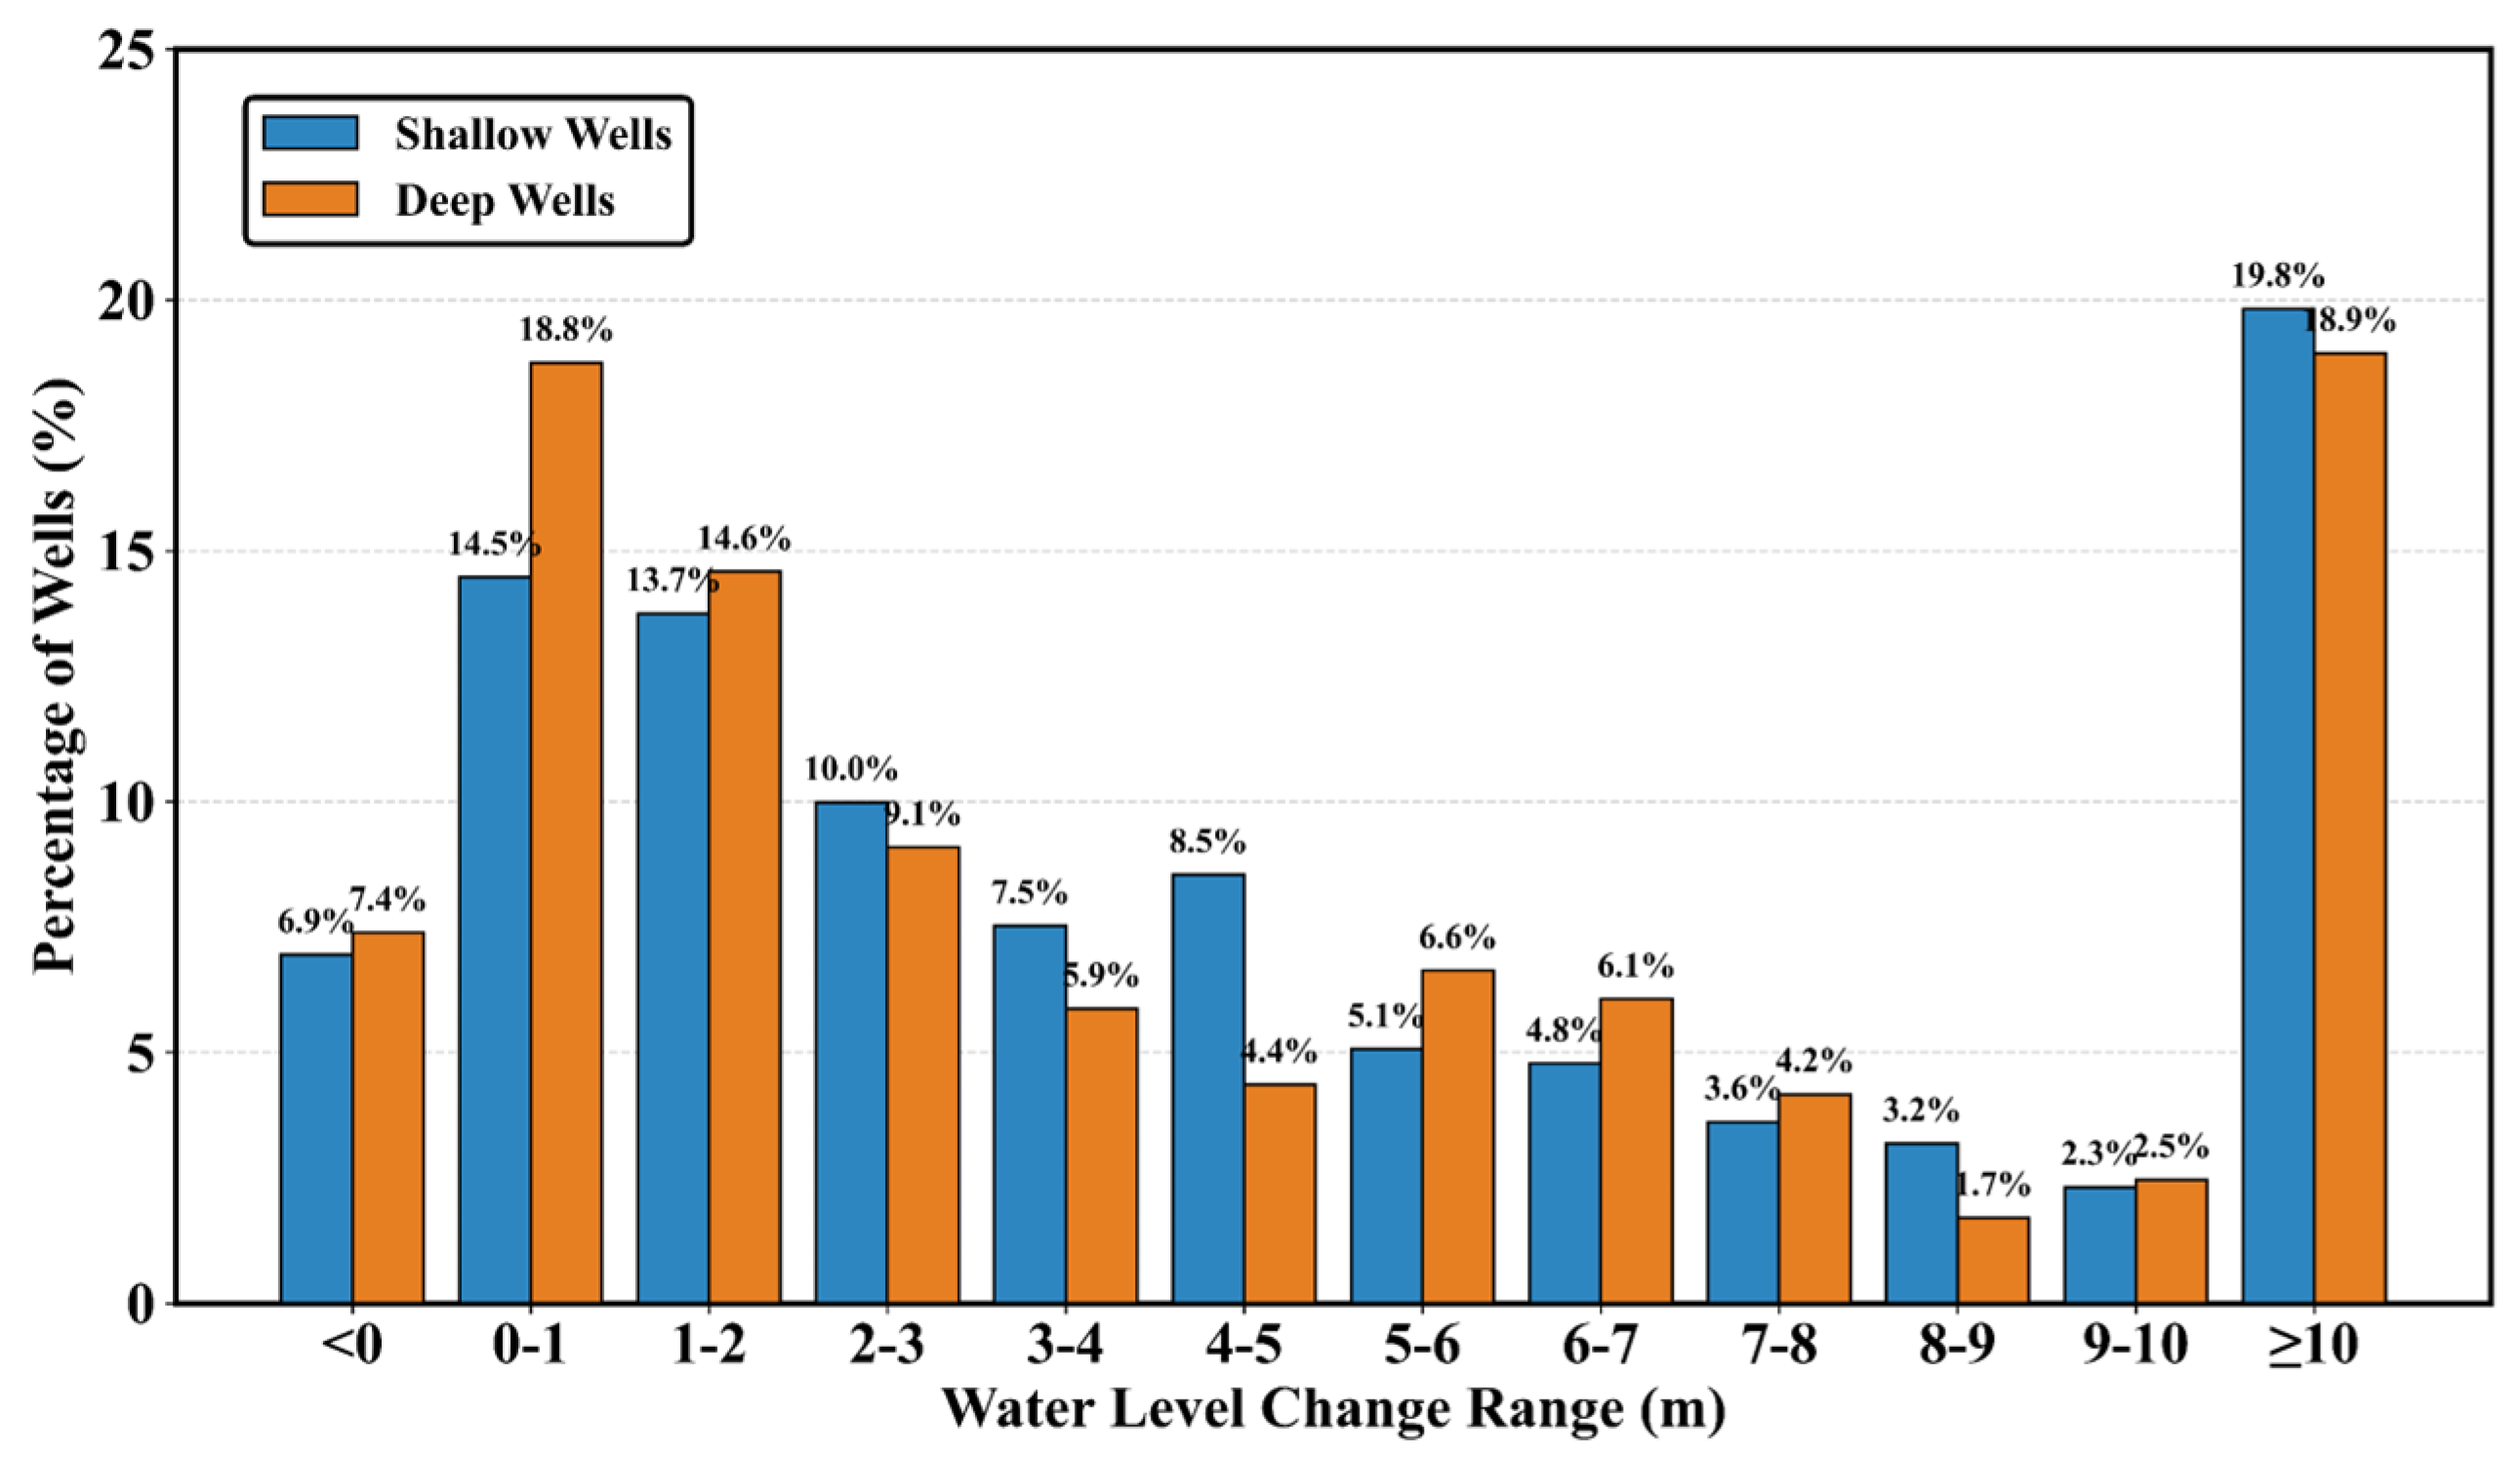
Changes in groundwater levels monitored by wells can be effectively used to analyze the impact of heavy rainfall on groundwater systems. As shown in Figure 11, which displays water-level variations across different time periods. It is evident from Figure 11e that most wells exhibit positive changes in water level, indicating effective recharge of aquifers after rainfall. In terms of monitoring units, the circles on the left represent shallow wells, while the triangles on the right represent deep wells. Among the monitored wells, 93% of shallow wells and 91.8% of deep wells recorded a rise in the water level (Figure 11e). During heavy rainfall, changes in shallow wells are more pronounced, whereas significant variations in deep wells are only observed in limited areas of the central part. Figure 12 depicts the water-level changes in shallow- and deep wells during the heavy rainfall event. A quantitative analysis of water-level changes reveals that 54.85% of shallow wells registered an increase of 4 m or more, compared to only 41.29% of deep wells. Conversely, nearly half (42.42%) of the deep-well data showed a modest rise between 0 and 3 m. This suggests that rainfall recharge has a more direct impact on shallow groundwater.
By integrating Figure 10 and Figure 11, it can also be observed that GNSS vertical displacements exhibit a certain lag in response compared to changes in well water levels. Extreme rainfall events significantly contribute to groundwater recharge. According to monitoring data from wells, some wells show a water-level rise of approximately 10 m, while others exhibit an increase of 2 m to 3 m. Only a very small number of wells experienced a decline in water level.

5. Discussion

5.1. Effects of Porous Elastic Deformation on GNSS Observations

The TJBH Station is located on sedimentary rock, with subsurface geology composed of sand and sand gravel deposits. Situated above an aquifer, it is more susceptible to porous elastic deformation. The Earth’s porous elastic response to groundwater changes opposes its elastic response [47,52]. According to porous elastic theory, a reduction in HYDL (e.g., due to pumping) leads to compaction of aquifer pores and subsequent surface subsidence. Conversely, an increase in HYDL raises pore water pressure, causing soil expansion and surface uplift. In the NCP, when an aquifer is recharged, the land surface rises during autumn and winter; during spring and summer, groundwater extraction compacts the aquifer sediments, resulting in surface subsidence.
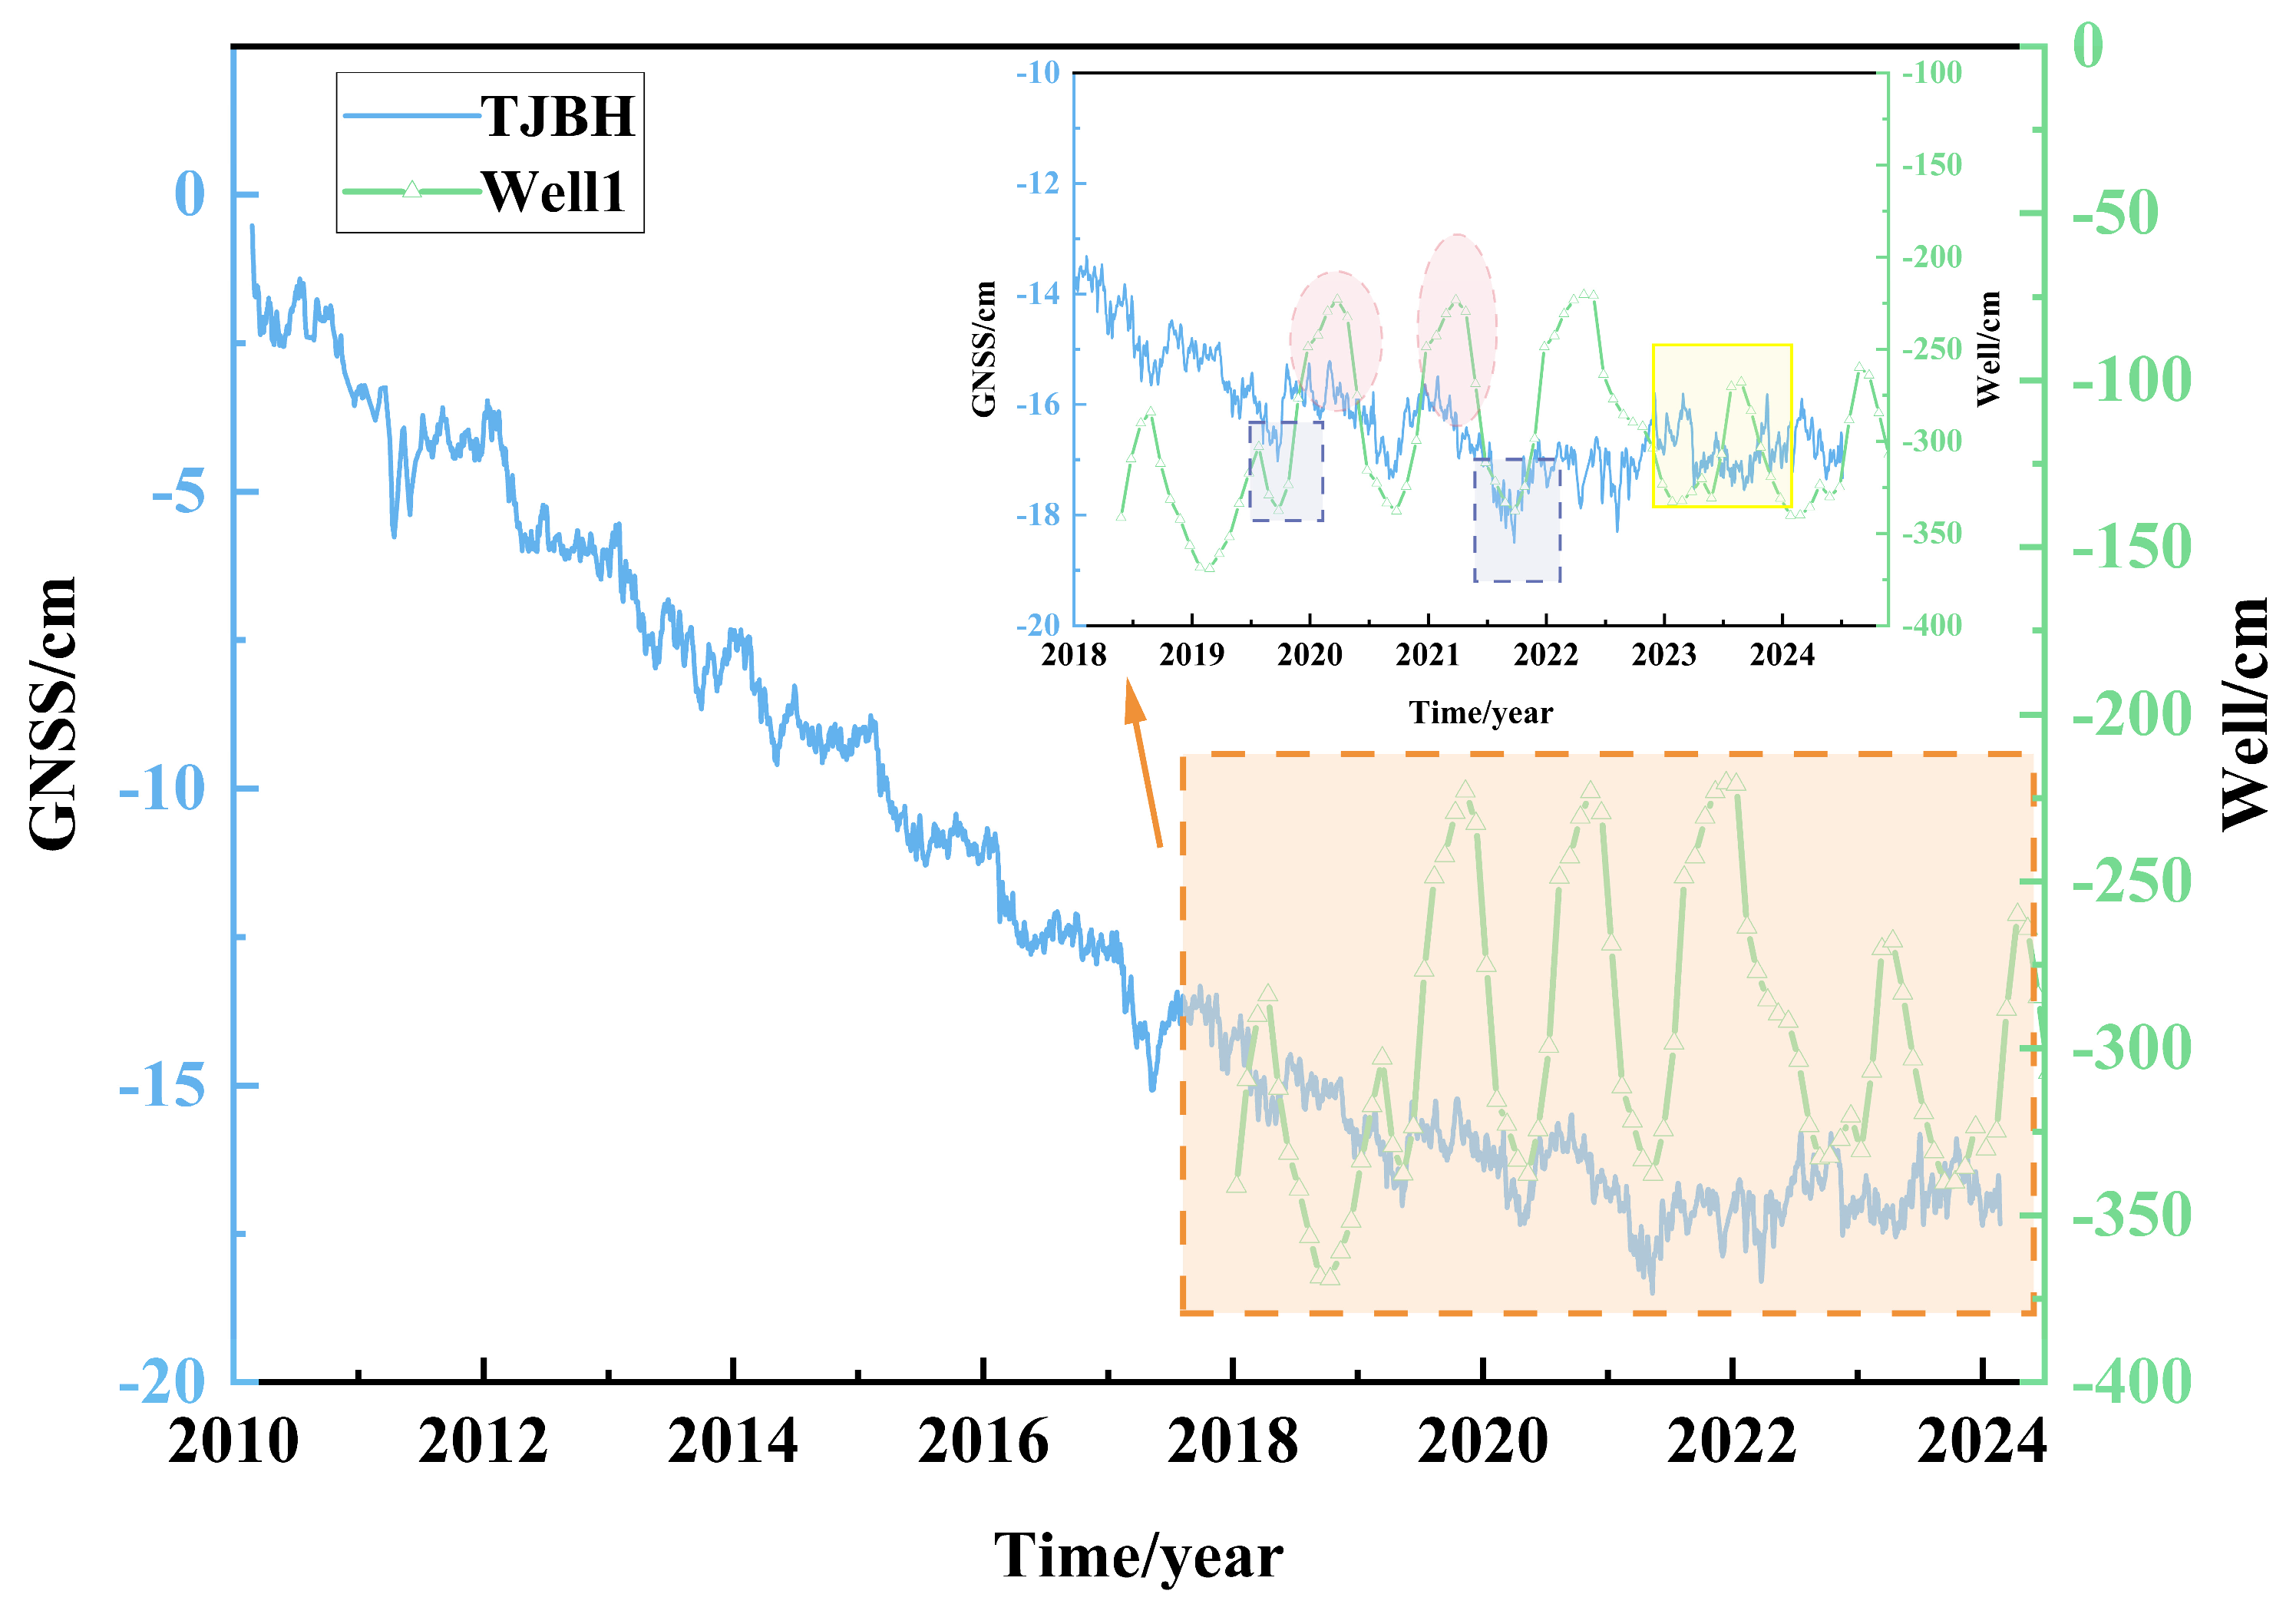
Taking the TJBH station as an example, a comparison was made between the groundwater level from a nearby shallow well and the GNSS time series, as shown in Figure 13. The vertical displacement at TJBH exhibits a long-term declining trend. Irrigation in the NCP predominantly occurs in spring and summer. In the magnified section (upper right corner of Figure 13), the blue rectangle indicates that during spring and summer, GNSS vertical displacement decreases (land subsidence), accompanied by declining water levels (consistent with Figure 4e). The red ellipse shows that during autumn and winter, GNSS vertical displacement increases (land uplift), accompanied by rising water levels (consistent with Figure 4f). The GNSS station above the aquifer reaches its maximum elevation at the end of winter.
This pattern does not hold for all periods, as the aquifer also exhibits an elastic response—though it is 10 to 100 times smaller than the porous elastic response. The subsidence observed at TJBH aligns with porous elastic theory. However, an exception is seen in the yellow rectangle in the enlarged view of Figure 13, where an extreme rainfall event in summer 2023 caused a notable rise in well water levels.
Monitoring data from the TJBH station show a cumulative subsidence of nearly 0.2 m between July 2010 and July 2024. Although a general downward trend is observed, temporary rebounds occurred in 2021 and 2023 due to rainfall recharge, resulting in intermittent uplift in recent years.

5.2. Regional Limitations of the Observed Seasonal Pattern

Additionally, the observed seasonal deformation pattern in the NCP (surface uplift in autumn/winter and subsidence in spring/summer) which reflects the Earth’s porous elastic response to groundwater changes, is subject to certain limitations. This pattern is conditioned by the local hydroclimatic regime (characterized by concentrated summer rainfall with delayed recharge effects) and the dominant influence of intensive groundwater extraction, thereby exhibiting a distinct region-specific character.

6. Conclusions

Extensive groundwater extraction in the NCP has led to widespread land subsidence. Both the elastic theory of disk loading and the porous elastic theory can explain this phenomenon. This study examines the mechanisms of land subsidence under extreme rainfall conditions, utilizing GNSS, GRACE, and well data to comprehensively analyze the causes of surface subsidence in the NCP from April 2002 to December 2024. The main conclusions are as follows:
(1) Based on the GRACE satellite Mascon product, the GWSC in the NCP were calculated. The results indicate a two-phase trend in GWSC. From 2003 to 2020, GWSC declined at an average rate of −1.99 ± 0.13 cm/yr, with most areas (e.g., Shijiazhuang and Hengshui) exhibiting a decreasing trend of approximately 5 cm/yr. In contrast, from 2021 to 2024, GWSC recovered at an average rate of 2.99 ± 1.64 cm/yr, and a recovery trend of about 7 cm/yr was observed in most areas (e.g., Xingtai and Handan). Correlation with precipitation data suggests that increased rainfall contributed to the recovery of groundwater levels.
(2) For short-term extreme rainfall, the period from 1 July to 31 August 2023, was selected. The results show that during heavy rainfall, NTAL caused significant vertical surface displacement, while NTOL remained relatively stable. Based on the elastic theory of disk loading, the pattern of hydrologically driven surface deformation during extreme rainfall was studied. The HYDL deformation observed by GNSS was about 5 mm, whereas the HYDL model predicted approximately 2 mm. During rainfall events, GNSS stations underwent rapid subsidence, followed by gradual rebound after the rain ended, consistent with elastic response theory.
(3) The sedimentary monitoring station (TJBH), situated above the aquifers, is particularly susceptible to porous elastic effects: pumping during spring and summer leads to surface subsidence, while groundwater recharge in autumn and winter causes surface uplift. GNSS is particularly effective in monitoring short-term HYDL deformation during heavy rainfall. The clear porous elastic response documented at the TJBH station indicates that adapting groundwater extraction schedules to seasonal recharge patterns could help modulate the rate of subsidence.
(4) Combining observational well data and rainfall records, it is shown that rainfall primarily affects shallow surface water. Some wells exhibited water-level rises of approximately 10 m during extreme rainfall events.
In summary, recognizing rainfall as a crucial recharge source for the NCP provides a scientific basis for optimizing groundwater model simulations. Concurrently, the potential land subsidence induced by such a recharge must be proactively evaluated to inform sound decision-making in water resource management.

Supplementary Materials

The following supporting information can be downloaded at: https://www.mdpi.com/article/10.3390/w18030357/s1, Figure S1: Geographical Location of the NCP Region. Figure S2: Singular spectrum analysis of the filled GRACE mascon for missing month data, with red and blue bars representing their uncertainties. Figure S3: Precipitation distribution in the NCP. Figure S4: Regional monthly mean temperature curve.

Author Contributions

Conceptualization, T.T. and Z.W.; methodology, T.T. and Z.W.; software, Z.W.; validation, Z.W., W.C. and X.Q.; formal analysis, Y.Z.; investigation, Z.W.; resources, T.T.; data curation, Z.W.; writing—original draft preparation, Z.W.; writing—review and editing, T.T. and Z.W.; visualization, Z.W.; supervision, S.L. and Z.L.; project administration, S.L. and Z.L.; funding acquisition, T.T. All authors have read and agreed to the published version of the manuscript.

Funding

This research was supported by the National Natural Science Foundation of China under Grant (42374048) and Anhui Provincial Natural Science Foundation under Grant (2308085MD125).

Data Availability Statement

The GRACE data were downloaded from the International Centre for Global Earth Models website (https://icgem.gfz.de/home accessed on 12 December 2024). The GLDAS data and precipitation data were obtained from the NASA Earth data portal (https://urs.earthdata.nasa.gov/ accessed on 12 December 2024). The GNSS data used in this study were provided by the National Earthquake Data Center (https://data.earthquake.cn/ 26 July 2024). The NTAL, NTOL, and HYDL were acquired from the International Mass Loading Service (http://massloading.net/ accessed on 31 August 2023). The well data is from the China Geo-logical Environment Monitoring Institute. The well data that support the findings of this study are available from the corresponding author upon reasonable request.

Acknowledgments

The experimental section of this study utilizes Python 3.12 and MATLAB R2023b for data processing, employing the SSA, GRACE_Matlab_Toolbox, GMIS, and diskload functions [34,36,53,54]. Figures and graphs were generated using Origin (2022b), Generic Mapping Tools (GMT 6.5.0), and MATLAB. Acknowledgement for the temperature data support from “National Earth System Science Data Center (https://www.geodata.cn accessed on 12 December 2024)”. Acknowledgement for the well data support from China Geo-logical Environment Monitoring Institute.

Conflicts of Interest

The authors declare no conflicts of interest.

Abbreviations

AbbreviationFull Form
NCPNorth China Plain
GRACEGravity Recovery and Climate Experiment
GNSSGlobal Navigation Satellite System
GLDASGlobal Land Data Assimilation System
GWSGroundwater storage
GWSC Groundwater storage changes
NTALNon-Tidal Atmospheric Loading
NTOLNon-Tidal Oceanic Loading
HYDLHydrological Loading
GPMGlobal Precipitation Measurement

References

  1. An, Y. Surface Deformation Monitoring and Groundwater Change Estimation Based on InSAR-GRACE Data. Master’s Thesis, Liaoning Technical University, Fuxin, China, 2024. (In Chinese) [Google Scholar] [CrossRef]
  2. Tang, W.; Yan, Z.; Wang, Y.; Xu, F.; Wu, X. Land subsidence caused by groundwater level recovery in Taiyuan City. Remote Sens. Nat. Resour. 2025, 37, 108–116. [Google Scholar]
  3. Seo, J.Y.; Lee, S.-I. Spatio-Temporal Groundwater Drought Monitoring Using Multi-Satellite Data Based on an Artificial Neural Network. Water 2019, 11, 1953. [Google Scholar] [CrossRef] [Scilit]
  4. Acworth, R.I.; Rau, G.C.; Cuthbert, M.O.; Leggett, K.; Andersen, M.S. Runoff and focused groundwater-recharge response to flooding rains in the arid zone of Australia. Hydrogeol. J. 2021, 29, 737–764. [Google Scholar] [CrossRef] [Scilit]
  5. Zheng, W.; Wang, S.; Sun, H.; Shen, Y.; Cao, J. Rainfall driven nitrate transport in runoff of hilly area by combining time-series monitoring of hydrochemistry and stable isotopes. J. Hydrol. 2025, 654, 132830. [Google Scholar] [CrossRef] [Scilit]
  6. Zheng, W.; Wang, S.; Tan, K.; Shen, Y.; Yang, L. Rainfall intensity affects the recharge mechanisms of groundwater in a headwater basin of the North China plain. Appl. Geochem. 2023, 155, 105742. [Google Scholar] [CrossRef] [Scilit]
  7. Tang, Y.; Xu, G.; Tang, G.; Zhang, W.; Min, A. Temporal and spatial distribution characteristics of hourly heavy rainfallof the “23.7” heavy rainstorm event in North China. Trans. Atmos. Sci. 2024, 47, 778–788. (In Chinese) [Google Scholar] [CrossRef]
  8. Mouyen, M.; Canitano, A.; Chao, B.F.; Hsu, Y.J.; Steer, P.; Longuevergne, L.; Boy, J.P. Typhoon-Induced Ground Deformation. Geopphys. Res. Lett. 2017, 44, 11004–11011. [Google Scholar] [CrossRef] [Scilit]
  9. Knappe, E.; Bendick, R.; Martens, H.R.; Argus, D.F.; Gardner, W.P. Downscaling Vertical GPS Observations to Derive Watershed-Scale Hydrologic Loading in the Northern Rockies. Water Resour. Res. 2019, 55, 391–401. [Google Scholar] [CrossRef] [Scilit]
  10. Shen, Y.; Zheng, W.; Zhu, H.; Yin, W.; Xu, A.; Pan, F.; Wang, Q.; Zhao, Y. Inverted Algorithm of Groundwater Storage Anomalies by Combining the GNSS, GRACE/GRACE-FO, and GLDAS: A Case Study in the North China Plain. Remote Sens. 2022, 14, 5683. [Google Scholar] [CrossRef] [Scilit]
  11. Zhu, H.; Chen, K.; Hu, S.; Liu, J.; Shi, H.; Wei, G.; Chai, H.; Li, J.; Wang, T. Using the Global Navigation Satellite System and Precipitation Data to Establish the Propagation Characteristics of Meteorological and Hydrological Drought in Yunnan, China. Water Resour. Res. 2023, 59, e2022WR033126. [Google Scholar] [CrossRef] [Scilit]
  12. Yao, C.; Shum, C.K.; Luo, Z.; Li, Q.; Lin, X.; Xu, C.; Zhang, Y.; Chen, J.; Huang, Q.; Chen, Y. An optimized hydrological drought index integrating GNSS displacement and satellite gravimetry data. J. Hydrol. 2022, 614, 128647. [Google Scholar] [CrossRef] [Scilit]
  13. Thomas, B.F.; Famiglietti, J.S.; Landerer, F.W.; Wiese, D.N.; Molotch, N.P.; Argus, D.F. GRACE Groundwater Drought Index: Evaluation of California Central Valley groundwater drought. Remote Sens. Environ. 2017, 198, 384–392. [Google Scholar] [CrossRef] [Scilit]
  14. Li, B.; Rodell, M.; Kumar, S.; Beaudoing, H.K.; Getirana, A.; Zaitchik, B.F.; de Goncalves, L.G.; Cossetin, C.; Bhanja, S.; Mukherjee, A.; et al. Global GRACE Data Assimilation for Groundwater and Drought Monitoring: Advances and Challenges. Water Resour. Res. 2019, 55, 7564–7586. [Google Scholar] [CrossRef] [Scilit]
  15. Xie, G.; Tao, T.; Ma, M.; Hu, S. Analysis of spatial and temporal variation of groundwater storage in Anhui Province using GRACE satellite. J. Hefei Univ. Technol. (Nat. Sci.) 2024, 47, 367–372+378. [Google Scholar]
  16. Long, D.; Shen, Y.; Sun, A.; Hong, Y.; Longuevergne, L.; Yang, Y.; Li, B.; Chen, L. Drought and flood monitoring for a large karst plateau in Southwest China using extended GRACE data. Remote Sens. Environ. 2014, 155, 145–160. [Google Scholar] [CrossRef] [Scilit]
  17. Wang, F.; Wang, Z.; Yang, H.; Di, D.; Zhao, Y.; Liang, Q. Utilizing GRACE-based groundwater drought index for drought characterization and teleconnection factors analysis in the North China Plain. J. Hydrol. 2020, 585, 124849. [Google Scholar] [CrossRef] [Scilit]
  18. Zheng, Y.; Peng, J.; Chen, X.; Huang, C.; Chen, P.; Li, S.; Su, Y. Spatial and Temporal Evolution of Ground Subsidence in the Beijing Plain Area Using Long Time Series Interferometry. IEEE J. Sel. Top. Appl. Earth Obs. Remote Sens. 2023, 16, 153–165. [Google Scholar] [CrossRef] [Scilit]
  19. Razeghi, M.; Tregoning, P.; Shirzaei, M.; Ghobadi-Far, K.; McClusky, S.; Renzullo, L. Characterization of Changes in Groundwater Storage in the Lachlan Catchment, Australia, Derived from Observations of Surface Deformation and Groundwater Level Data. J. Geophys. Res. Solid Earth 2022, 127, e2022JB024669. [Google Scholar] [CrossRef] [Scilit]
  20. Tao, T.; Dai, J.; Song, Z.; Li, S.; Qu, X.; Zhu, Y.; Li, Z.; Zhu, M. Spatial-Temporal Dynamic Evolution of Land Deformation Driven by Hydrological Signals around Chaohu Lake. Sensors 2024, 24, 1198. [Google Scholar] [CrossRef] [Scilit] [PubMed]
  21. Ojha, C.; Werth, S.; Shirzaei, M. Recovery of aquifer-systems in Southwest US following 2012–2015 drought: Evidence from InSAR, GRACE and groundwater level data. J. Hydrol. 2020, 587, 124943. [Google Scholar] [CrossRef] [Scilit]
  22. Zhang, W.; Lu, X. Inversion Method for Monitoring Daily Variations in Terrestrial Water Storage Changes in the Yellow River Basin Based on GNSS. Water 2024, 16, 1919. [Google Scholar] [CrossRef] [Scilit]
  23. Song, Y. Research on the Application of InSAR Technology in Flood Control Deformation Monitoring. Master’s Thesis, East China University of Technology, Nanchang, China, 2020. [Google Scholar] [CrossRef]
  24. Zhang, S.; Pang, X.; Liu, Z. Retrieve Groundwater Storage Variation in California Using GRACE and GPS. Prog. Geophys. 2021, 36, 1008–1016. [Google Scholar] [CrossRef]
  25. Yang, W.; Long, D.; Scanlon, B.R.; Burek, P.; Zhang, C.; Han, Z.; Butler, J.J., Jr.; Pan, Y.; Lei, X.; Wada, Y. Human Intervention Will Stabilize Groundwater Storage Across the North China Plain. Water Resour. Res. 2022, 58, e2021WR030884. [Google Scholar] [CrossRef] [Scilit]
  26. Liu, R.; Zou, R.; Li, J.; Zhang, C.; Zhao, B.; Zhang, Y. Vertical Displacements Driven by Groundwater Storage Changes in the North China Plain Detected by GPS Observations. Remote Sens. 2018, 10, 259. [Google Scholar] [CrossRef] [Scilit]
  27. Zhang, Z.; Fei, Y.; Chen, Z.; Zhao, Z.; Xie, Z.; Wang, Y. Investigation and Assessment of Sustainable Utilization of Groundwater Resources in the North China Plain; Geology Press: Beijing, China, 2009. [Google Scholar]
  28. Long, D.; Yan, L.; Bai, L.; Zhang, C.; Li, X.; Lei, H.; Yang, H.; Tian, F.; Zeng, C.; Meng, X.; et al. Generation of MODIS-like land surface temperatures under all-weather conditions based on a data fusion approach. Remote Sens. Environ. 2020, 246, 111863. [Google Scholar] [CrossRef] [Scilit]
  29. Li, Y. Characteristics and Impacting Factors of the Spatial-Temporal Variations of the Shallow Groundwater Depth in the North China Plain. Master’s Thesis, Henan Polytechnic University, Jiaozuo, China, 2022. (In Chinese) [Google Scholar]
  30. Yuan, Y.; Zhang, T.; Zhang, C.; Ma, R. Spatial variability of vertical permeability coefficient from the piedmont to the coastal area of North China Plain. South--North Water Transf. Water Sci. Technol. 2020, 18, 184–190. (In Chinese) [Google Scholar] [CrossRef]
  31. Zhang, L.; Sun, W. Progress and prospect of GRACE Mascon product and its application. Rev. Geophys. Planet. Phys. 2022, 53, 35–52. (In Chinese) [Google Scholar] [CrossRef]
  32. Mo, S.; Zhong, Y.; Forootan, E.; Mehrnegar, N.; Yin, X.; Wu, J.; Feng, W.; Shi, X. Bayesian convolutional neural networks for predicting the terrestrial water storage anomalies during GRACE and GRACE-FO gap. J. Hydrol. 2022, 604, 127244. [Google Scholar] [CrossRef] [Scilit]
  33. Yang, X.; You, W.; Tian, S.; Jiang, Z.; Wan, X. A Two-Step Linear Model to Fill the Data Gap Between GRACE and GRACE-FO Terrestrial Water Storage Anomalies. Water Resour. Res. 2023, 59, e2022WR034139. [Google Scholar] [CrossRef] [Scilit]
  34. Yi, S.; Sneeuw, N. Filling the Data Gaps Within GRACE Missions Using Singular Spectrum Analysis. J. Geophys. Res. Solid Earth 2021, 126, e2020JB021227. [Google Scholar] [CrossRef] [Scilit]
  35. Rodell, M.; Houser, P.R.; Jambor, U. The Global Land Data Assimilation System. Bull. Am. Meteorol. Soc. 2004, 85, 381–394. [Google Scholar] [CrossRef] [Scilit]
  36. Liu, N.; Dai, W.; Santerre, R.; Kuang, C. A MATLAB-based Kriged Kalman Filter software for interpolating missing data in GNSS coordinate time series. Gps Solut. 2017, 22, 25. [Google Scholar] [CrossRef] [Scilit]
  37. Dill, R.; Dobslaw, H. Numerical simulations of global-scale high-resolution hydrological crustal deformations. J. Geophys. Res. Solid Earth 2013, 118, 5008–5017. [Google Scholar] [CrossRef] [Scilit]
  38. Gelaro, R.; McCarty, W.; Suárez, M.J.; Todling, R.; Molod, A.; Takacs, L.; Randles, C.A.; Darmenov, A.; Bosilovich, M.G.; Reichle, R.; et al. The Modern-Era Retrospective Analysis for Research and Applications, Version 2 (MERRA-2). J. Clim. 2017, 30, 5419–5454. [Google Scholar] [CrossRef] [Scilit]
  39. Reichle, R.H.; Draper, C.S.; Liu, Q.; Girotto, M.; Mahanama, S.P.P.; Koster, R.D.; De Lannoy, G.J.M. Assessment of MERRA-2 Land Surface Hydrology Estimates. J. Clim. 2017, 30, 2937–2960. [Google Scholar] [CrossRef] [Scilit]
  40. Huffman, G.J.; Stocker, E.F.; Bolvin, D.T.; Nelkin, E.J.; Tan, J. GPM IMERG Final Precipitation L3 1 Day 0.1 Degree × 0.1 Degree V07. 2024. Available online: https://rda.ucar.edu/datasets/d734000/ (accessed on 12 December 2024).
  41. Bai, X. The Research on Spatiotemporal Characteristics of Groundwater Storage Change in Beijing-Tianjin-Hebei Region. Master’s Thesis, China University of Geosciences (Beijing), Beijing, China, 2021. (In Chinese) [Google Scholar] [CrossRef]
  42. Cao, J.; Xiao, Y.; Long, D.; Cui, Y.; Liu, M.; Zhang, J.; Wang, Y.; Hong, X.; Chen, K. Combined Gravity Satellite and Water Well Information to Monitor Groundwater Storage Changes in the North China Plain. Geom. Inf. Sci. Wuhan Univ. 2024, 49, 805–818. (In Chinese) [Google Scholar] [CrossRef]
  43. Longman, I.M. A Green’s function for determining the deformation of the Earth under surface mass loads: 2. Computations and numerical results. J. Geophy. Res. 1963, 68, 485–496. [Google Scholar] [CrossRef] [Scilit]
  44. Shen, Y.; Zheng, W.; Yin, W.; Xu, A.; Zhu, H.; Yang, S.; Su, K. Inverted Algorithm of Terrestrial Water-Storage Anomalies Based on Machine Learning Combined with Load Model and Its Application in Southwest China. Remote Sens. 2021, 13, 3358. [Google Scholar] [CrossRef] [Scilit]
  45. Wang, H.; Xiang, L.; Jia, L.; Jiang, L.; Wang, Z.; Hu, B.; Gao, P. Load Love numbers and Green’s functions for elastic Earth models PREM, iasp91, ak135, and modified models with refined crustal structure from Crust 2.0. Comput. Geosci. 2012, 49, 190–199. [Google Scholar] [CrossRef] [Scilit]
  46. Wahr, J.; Khan, S.A.; van Dam, T.; Liu, L.; van Angelen, J.H.; van den Broeke, M.R.; Meertens, C.M. The use of GPS horizontals for loading studies, with applications to northern California and southeast Greenland. J. Geophys. Res. Solid Earth 2013, 118, 1795–1806. [Google Scholar] [CrossRef] [Scilit]
  47. Argus, D.F.; Landerer, F.W.; Wiese, D.N.; Martens, H.R.; Fu, Y.; Famiglietti, J.S.; Thomas, B.F.; Farr, T.G.; Moore, A.W.; Watkins, M.M. Sustained Water Loss in California’s Mountain Ranges During Severe Drought from 2012 to 2015 Inferred From GPS. J. Geophys. Res. Solid Earth 2017, 122, 10559–10585. [Google Scholar] [CrossRef] [Scilit]
  48. Zhang, R.; Peng, Y.; Chao, N.; Ou, Q.; Chen, G.; Wang, Z.; Zhu, H.; Liu, B.; Zhang, Z. A rapid increase of groundwater in 2021 over the North China Plain from GPS and GRACE observations. Gps Solut. 2024, 29, 37. [Google Scholar] [CrossRef] [Scilit]
  49. Chen, J.L.; Wilson, C.R.; Tapley, B.D.; Scanlon, B.; Güntner, A. Long-term groundwater storage change in Victoria, Australia from satellite gravity and in situ observations. Glob. Planet. Change 2016, 139, 56–65. [Google Scholar] [CrossRef] [Scilit]
  50. Peng, S.; Ding, Y.; Liu, W.; Li, Z. 1 km monthly temperature and precipitation dataset for China from 1901 to 2017. Earth Syst. Sci. Data 2019, 11, 1931–1946. [Google Scholar] [CrossRef] [Scilit]
  51. Chew, C.C.; Small, E.E. Terrestrial water storage response to the 2012 drought estimated from GPS vertical position anomalies. Geopphys. Res. Lett. 2014, 41, 6145–6151. [Google Scholar] [CrossRef] [Scilit]
  52. Argus, D.F.; Fu, Y.; Landerer, F.W. Seasonal variation in total water storage in California inferred from GPS observations of vertical land motion. Geopphys. Res. Lett. 2014, 41, 1971–1980. [Google Scholar] [CrossRef] [Scilit]
  53. Bevis, M.; Melini, D.; Spada, G. On computing the geoelastic response to a disk load. Geophy. J. Int. 2016, 205, 1804–1812. [Google Scholar] [CrossRef] [Scilit]
  54. Feng, W. GRAMAT: A comprehensive Matlab toolbox for estimating global mass variations from GRACE satellite data. Earth Sci. Inform. 2019, 12, 389–404. [Google Scholar] [CrossRef] [Scilit]
Figure 1. Geographical location of the NCP region, include the main cities and GNSS stations.
Water 18 00357 g001
Figure 2. Locations of wells in the NCP include shallow wells and confined wells.
Water 18 00357 g002
Figure 3. Vertical displacement elastic response to disk loading. Diagram showing the relationship between vertical displacement deformation and distance for two disks of equal mass but differing radii and thicknesses.
Water 18 00357 g003
Figure 4. Surface load response of GNSS stations to two types of hydrological loading. Panel (I): Elastic loading response (a–c). Panel (II): Porous elastic loading response (d–f).
Water 18 00357 g004
Figure 5. Temporal variations in GWSC in the NCP.
Water 18 00357 g005
Figure 6. Spatial trends of GWSC in the NCP. (a) represents the change rate during the first phase (2003−2020); (b) represents the rate during the second phase (2021−2024).
Water 18 00357 g006
Figure 7. Precipitation distribution in the NCP. (a) displays GWSC and the monthly precipitation in the NCP from 2002 to 2024; (b) shows the annual precipitation anomalies, where negative values indicate results below the long-term average and positive values indicate results above the long-term average.
Water 18 00357 g007
Figure 8. Rainfall distribution over the NCP from July to August 2023. (a) Mean daily rainfall across the region; (b) Cumulative daily rainfall distribution in the NCP from 28 July to 31 July 2023.
Water 18 00357 g008
Figure 9. Vertical surface deformation map of the NCP based on NTAL, NTOL, and GNSS raw time series. The gray shaded area indicates the main study period of the heavy rainfall event.
Water 18 00357 g009
Figure 10. (a–i) The HYDL deformation from GNSS and the HYDL model for vertical surface deformation. The (left) panel shows the HYDL deformation from GNSS vertical displacement after removing NTAL and NTOL, while the (right) panel shows the deformation from the IMLS hydrological load model. (a–f) represent different time intervals.
Water 18 00357 g010
Figure 11. (a–i) Groundwater well variation, with circles indicating shallow-well locations and triangles indicating deep-well locations. The (left) side shows shallow-well variation, while the (right) side shows deep-well variation.
Water 18 00357 g011
Figure 12. Statistical chart of well water-level changes during the heavy rainfall event (29 July–4 August).
Water 18 00357 g012
Figure 13. Vertical displacement time series at the TJBH station and water–level changes in nearby well.
Water 18 00357 g013
Table 1. Dataset used in this experiment.
DataTime ResolutionSpatial ResolutionTime Span
GRACE/GRACE-FO Mascon1 m0.25° × 0.25°April 2002–December 2024
GLDAS1 m0.25° × 0.25°April 2002–December 2024
GNSS1 d-1 July 2023–31 August 2023
29 July 2010–26 July 2024
NTAL6 h2′ × 2′1 July 2023–31 August 2023
NTOL3 h2′ × 2′1 July 2023–31 August 2023
HYDL3 h2′ × 2′1 July 2023–31 August 2023
GPM1 d0.1° × 0.1°1 July 2023–31 August 2023
1 m0.1° × 0.1°January 2002–December 2024
Well1 d-1 July 2023–31 August 2023
Disclaimer/Publisher’s Note: The statements, opinions and data contained in all publications are solely those of the individual author(s) and contributor(s) and not of MDPI and/or the editor(s). MDPI and/or the editor(s) disclaim responsibility for any injury to people or property resulting from any ideas, methods, instructions or products referred to in the content.