Abstract
Accurate precipitation mapping is essential for effective disaster management; however, individual radar, satellite, and numerical weather prediction products often struggle in the topographically complex terrain of South Korea. This study proposes a high-resolution (~500 m) daily precipitation fusion framework that integrates Korea Meteorological Administration (KMA) radar, Global Precipitation Measurement (GPM) Integrated Multi-Satellite Retrievals for GPM (IMERG), and Local Data Assimilation and Prediction System (LDAPS) data. The framework employs a Random Forest model augmented with a monthly Empirical Cumulative Distribution Function (ECDF) correction. Auxiliary predictors are incorporated to enhance physical interpretability and stability, including terrain attributes to represent orographic effects, land-cover information to account for surface-related modulation of precipitation, and seasonal cyclic signals to capture regime-dependent variability. These predictors complement dynamic precipitation inputs and enable the model to effectively capture nonlinear spatiotemporal patterns, resulting in improved performance relative to individual radar, IMERG, and LDAPS products. Evaluation against Automated Synoptic Observing System (ASOS) observations yielded a correlation coefficient of 0.935 and a mean absolute error of 3.304 mm day−1 in a Leave-One-Year-Out (LOYO) validation for 2024. Regional analyses further indicate substantial performance gains in complex mountainous areas, including the Yeongdong–Yeongseo region, where the proposed framework markedly reduces estimation errors under challenging winter conditions. Overall, the results demonstrate the potential of the proposed fusion framework to provide robust, high-resolution precipitation estimates in regions characterized by strong topographic and seasonal heterogeneity, supporting applications related to hazard analysis and hydrometeorological assessment.
1. Introduction
Since the 20th century, global warming has been a major driver intensifying the global hydrological cycle [1]. This intensification has increased the frequency and magnitude of extreme precipitation events—such as floods and droughts—necessitating the development of accurate, high-quality precipitation datasets for effective water-resource management and disaster mitigation [2]. However, current precipitation observation methods possess inherent limitations, posing significant challenges in constructing an ideal dataset.
Traditional rain gauges provide high temporal resolution and accuracy but are subject to systematic errors (undercatch) caused by wind, evaporation, and varying hydrometeor types (e.g., snow). Furthermore, they represent only point observations with limited spatial representativeness [3,4]. To address these spatial limitations, gridded precipitation datasets have been developed [5].
Meteorological Radar retrieves precipitation occurrence, intensity, and microphysical characteristics using variables—such as reflectivity and differential reflectivity—derived from dual-polarization observations [6]. While Radar provides high-resolution local data, satellite-based products offer essential global continuity. Notably, the Global Precipitation Measurement (GPM) Integrated Multi-satellite Retrievals (IMERG) provides 0.1° grids at 30 min intervals, with numerous studies reporting significant performance improvements over its predecessors, the Tropical Rainfall Measuring Mission (TRMM) and the TRMM Multi-satellite Precipitation Analysis (TMPA) [7,8,9]. TMPA was originally developed by merging Passive Microwave (PMW) and Infrared (IR) data with gauge corrections [10]. Additionally, Numerical Weather Prediction (NWP) models estimate precipitation based on physical equations. In South Korea, the Local Data Assimilation and Prediction System (LDAPS), based on the UK Met Office Unified Model (UM), is widely used and has been extensively evaluated for precipitation forecasting [11].
Despite these advancements, limitations remain in accurately reproducing the spatiotemporal structure of precipitation in regions with complex topography and localized convection. For instance, while IMERG performs well globally, it exhibits errors in intensity and frequency over mountainous terrain [12]. Radar offers high spatial resolution, yet its accuracy is hindered by terrain blockage, beam overshooting, and uncertainties in Z–R (or Z–S) conversions [13,14]. Similarly, LDAPS often produces substantial errors in magnitude and location under strong convection–orography interactions, underscoring the need for region-specific correction and data fusion [10,15,16].
To improve local accuracy, statistical spatial interpolation—such as Kriging and Geographically Weighted Regression (GWR)—incorporates terrain variables as auxiliary predictors [17,18]. Furthermore, additional correction methods like quantile mapping and Cumulative Distribution Function (CDF) matching are used to correct frequency and intensity distortions [19]. However, these traditional methods often rely on assumptions of linearity or stationarity, struggling to represent the nonlinear interactions associated with complex terrain [20,21]. Consequently, machine-learning-based fusion methods, which integrate diverse sources (Radar, satellite, and NWP) and learn nonlinear relationships, have been increasingly adopted [22,23,24].
In South Korea, where topographic and climatic heterogeneity is substantial, previous approaches optimized for broad generalization have shown limited skill in capturing local precipitation patterns and extremes [25,26]. In particular, existing machine learning-based precipitation studies in South Korea have often relied on coarse-resolution inputs and simplified representations of terrain and regime-dependent variability, thereby limiting their ability to resolve fine-scale orographic gradients and precipitation structures across seasonal transitions. This research gap motivates the integration of Random Forest (RF)-based multisource fusion with monthly Empirical Cumulative Distribution Function (ECDF) correction. Accordingly, this study aims to develop and evaluate a high-resolution (~500 m) quantitative precipitation estimation (QPE) framework that combines an RF-based fusion model with ECDF correction to address the structural limitations of existing precipitation grids in complex topographic and seasonal environments.
2. Materials and Methods
2.1. Study Area
The study area encompasses the entire territory of South Korea, as illustrated in Figure 1. The region is characterized by complex terrain, with more than 70% of the landmass consisting of mountainous areas and a heterogeneous distribution of coastlines, inland ranges, and plains. These topographic features induce strong spatial variability in precipitation and increase the risk of flash floods driven by orographic rainfall [27]. According to the 1991–2020 climate normals from the Korea Meteorological Administration (KMA), the annual mean precipitation ranges approximately from 1200 to 1450 mm. Notably, the southern and eastern coasts, along with the mountainous regions, serve as heavy-rainfall zones where annual totals can exceed 2000 mm, leading to significant regional disparities [28].
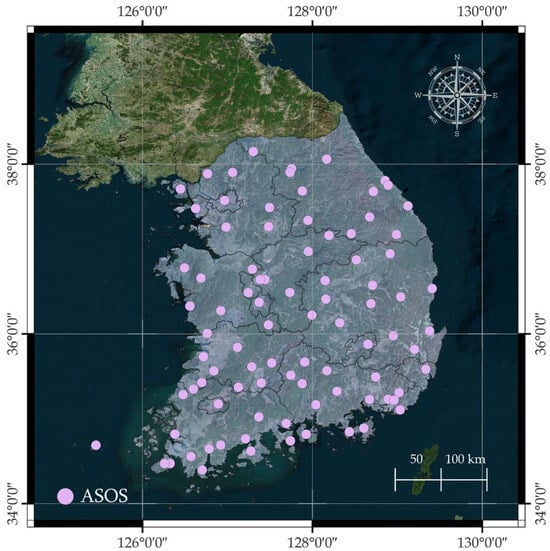
Figure 1.
Spatial distribution of Automated Surface Observing System (ASOS) stations in South Korea (colored in pink).
2.2. Datasets
This section describes the reference observations, precipitation input datasets, and auxiliary variables used in this study. The study period (2019–2024) was deliberately selected to ensure physical consistency and data homogeneity across all input datasets. Major system upgrades implemented by the Korea Meteorological Administration (KMA)—including the nationwide transition to dual-polarization radar, the stabilization of LDAPS land-surface physics, and enhanced quality-control procedures for ASOS observations—were completed around 2018–2019. Although a denser Automated Weather Station (AWS) network (~600 sites) is available in South Korea, ASOS stations were used as the primary reference observations to ensure consistent long-term data quality control and homogeneity for nationwide training and validation.
2.2.1. Reference Data
Reliable ground observations are critical for training and validating high-resolution precipitation models. In this study, data from the Automated Synoptic Observing System (ASOS), operated by the KMA, served as the reference dataset. The ASOS provides high-quality observations through an automated system and a rigorous three-stage quality-control procedure (Levels 1–3) [29]. We utilized a total of 105 ASOS stations across South Korea. The reference variable is daily accumulated precipitation (mm/day) in Korea Standard Time (KST), calculated by summing hourly values from 00:00 to 24:00 KST. All ASOS data were retrieved from the KMA Data Portal (https://data.kma.go.kr, 1 October 2024).
The precipitation sensors employed in the ASOS include tipping-bucket and weighing-type rain gauges, which measure both liquid and solid precipitation (e.g., snow, sleet, and hail) by determining the water-equivalent depth [30]. These daily precipitation values functioned as ground-truth labels for model training and provided the benchmark for accuracy assessment and monthly ECDF correction.
2.2.2. Precipitation Input Data
Precipitation exhibits substantial particle-level variability and spatiotemporal heterogeneity, making accurate localized estimation challenging with any single observation system. Consequently, multisource fusion—integrating Radar, satellite, and NWP data—has been introduced to leverage their differing spatial resolutions and error structures. Machine-learning-based approaches have demonstrated superior performance in this regard [20,21]. For this study, three primary input datasets were selected:
- GPM IMERG 07 Final Run provides global estimates at 0.1° spatial and 30 min temporal resolutions. It merges observations from multiple Passive Microwave (PMW) and Infrared (IR) sensors. The IR and PMW data are integrated using a Kalman-filter-based Climate Prediction Center (CPC) morphing scheme, with final bias corrections applied via the Global Precipitation Climatology Centre (GPCC) gauge analysis [31,32].
- LDAPS is a Unified Model (UM)-based mesoscale numerical weather prediction system operated by the Korea Meteorological Administration (KMA), featuring a horizontal resolution of 1.5 km and 70 vertical levels. In this study, hourly accumulated precipitation derived from 3-hourly analysis fields was used [13]. The LDAPS precipitation input corresponds to the model’s total accumulated precipitation.
- Radar data were obtained from the KMA’s Hybrid Surface Rainfall (HSR) product. HSR provides nationwide coverage at a 0.5 km resolution with a 5 min update cycle. It enhances accuracy by utilizing reflectivity from the lowest-elevation beam to minimize terrain and beam blockage effects, making it highly effective for mountainous regions [33].
2.2.3. Auxiliary Input Data
The accuracy of precipitation estimation models is heavily dependent on the quality of input precipitation data, and the associated uncertainties exert a dominant influence on hydrological modeling outcomes [34]. The occurrence and spatial distribution of precipitation are governed by complex interactions, including orographic lifting, rain shadow effects, land-cover-induced variations in heat and moisture fluxes, and seasonal monsoon circulation. Consequently, machine-learning-based multisource fusion methods that incorporate these factors as auxiliary predictors have been shown to significantly reduce bias and uncertainty in precipitation estimates [22,23,35]. Based on this rationale, the following three categories of auxiliary variables were integrated into the model:
- Topographic Variables (SRTM): Terrain-related predictors—including elevation, slope, and hillshade—were derived from the Shuttle Radar Topography Mission (SRTM) Digital Elevation Model (DEM) at a 30 m resolution (SRTM90_V4), extracted via Google Earth Engine (GEE). The slope was calculated using the GEE terrain analysis function [36], which employs the Horn algorithm to compute elevation gradients based on a 3 × 3 pixel neighborhood. To account for varying solar illumination on the terrain, hillshade was computed by fixing the solar altitude angle at 45° and applying 16 different solar azimuth angles (at 22.5° intervals from 0° to 337.5°). We discretized hillshade into directional classes (1–16) because orographic precipitation is primarily controlled by windward–leeward exposure (i.e., dominant slope orientation relative to prevailing flow), and at 500 m resolution, this categorical encoding provides a noise-robust, scale-consistent representation that Random Forest models can exploit more stably than highly variable continuous aspect/hillshade values. Hillshade was resampled to 500 m resolution using the nearest-neighbor method, while elevation and slope were resampled using bilinear interpolation.
- Land Cover (MODIS): Land-use and land-cover information was obtained from the Moderate Resolution Imaging Spectroradiometer (MODIS) Land Cover Type Product (MCD12Q1), which follows the International Geosphere–Biosphere Program (IGBP) classification scheme. This annual dataset, with a 500 m spatial resolution, was retrieved via GEE and resampled using the nearest-neighbor method to maintain the integrity of categorical classes.
- Seasonality (Month): To represent seasonal cyclicity and preserve chronological continuity, the month index was transformed into cyclic sine and cosine components. This approach prevents the artificial discontinuity between December (12) and January (1), ensuring that the model recognizes the periodic nature of the seasonal cycle. The transformed variables are defined as:
This month-level encoding is intended to represent the background seasonal regime, while day-to-day precipitation variability is primarily captured by the dynamic precipitation inputs (Radar, IMERG, and LDAPS) and the RF mapping.
2.2.4. Data Preprocessing
The datasets were preprocessed according to the workflow summarized in Table 1. All precipitation products were temporally synchronized to Korea Standard Time (KST), and daily accumulated precipitation (mm/day) was computed over a 24 h window from 00:00 to 24:00 KST. To ensure spatial consistency, the World Geodetic Datum 1984 (WGS 84) coordinate reference system was adopted. All input data were then resampled onto a standardized high-resolution grid of 0.005° × 0.005° (approximately 500 m × 500 m), facilitating the multisource data fusion process. We note that bilinear interpolation can smooth sharp, fine-scale radar gradients; however, it was adopted as a practical trade-off to place all inputs on a common analysis grid.

Table 1.
Datasets and preprocessing summary (NA: Not Available).
3. Methods
3.1. Overview
The proposed QPE framework integrates RF and ECDF correction by fusing multisource datasets—Radar, GPM IMERG, and LDAPS—each possessing complementary characteristics. This integration is designed to robustly capture the nonlinear relationships between precipitation and environmental factors within the complex terrain of South Korea. The overall procedure consists of three stages: (a) matchup construction, (b) RF-based precipitation estimation, and (c) ECDF correction (Figure 2).
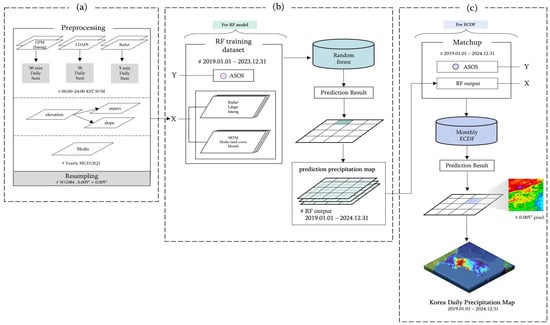
Figure 2.
Workflow of the proposed RF-based QPE framework for South Korea: (a) preprocessing and resampling of data; (b) random-forest training with ASOS targets (2019–2023) (c) ECDF correction and production of the daily precipitation maps (2019–2024).
First, the preprocessed Radar, IMERG, and LDAPS data were spatially collocated with ASOS stations to construct a daily matchup dataset for the period 2019–2023. Next, we conducted a preliminary comparison of four representative machine-learning algorithms: bagging-based methods such as RF and Extremely Randomized Trees (ERT) and boosting-based methods such as Gradient Boosting Regressor (GBR) and AdaBoost. For the full set of station-grid matchups, the dataset was randomly split into 80% for training/validation and 20% for independent evaluation. Hyperparameters for each model were optimized using the Optuna library to ensure a fair comparison under near-optimal settings, with 50 trials conducted per model. Consequently, Random Forest achieved the lowest Mean Absolute Error (MAE) in the blind evaluation, albeit by a narrow margin compared to other ensemble methods (RF: 3.721, ERT: 3.745, GBR: 3.789, AdaBoost: 3.780). Based on this empirical performance and its robustness, Random Forest was selected as the core reconstruction model.
Subsequently, to harmonize differences in observational scales and error structures, a multisource fusion model based on RF was developed. The model incorporated an expanded set of predictors, including topographic variables (elevation, slope, and hillshade), MODIS-derived land-cover information, and cyclic monthly indices representing seasonality. To identify the optimal configuration, ablation experiments were conducted by evaluating four model versions (Versions 1–4) with different input combinations. This approach enables the nonlinear integration of large-scale satellite coverage, high-resolution Radar patterns, and physical predictions from LDAPS.
The optimized model was validated under out-of-sample conditions using independent data from 2024. Consequently, nationwide daily QPE fields for 2019–2024 were generated at a spatial resolution of 0.005° × 0.005°. In the final stage, a nonparametric ECDF correction was applied to the initial RF outputs to mitigate seasonal distribution distortions and biases in extreme values. Monthly ECDFs were utilized to account for seasonal characteristics; the detailed procedures for this stage are described in Section 3.4. The proposed framework was evaluated across the Yeongdong and Yeongseo regions, delineated by the Taebaek Mountains, during the winter (DJF) and summer (JJA) seasons. The results, validated against ASOS observations, demonstrate consistent and reliable high-resolution QPE performance at an approximate spatial resolution of 500 m.
3.2. RF Modeling Framework
RF is particularly well-suited for multi-source precipitation fusion because it recursively partitions the predictor space to capture complex, nonlinear relationships among variables. Furthermore, it mitigates overfitting and local error amplification by aggregating the outputs of multiple decision trees [37,38,39]. Precipitation datasets from Radar, satellite, and NWP sources exhibit heterogeneous error structures and signal characteristics, making it challenging to achieve spatial consistency using a single data source. The ensemble structure of RF statistically integrates these diverse inputs to provide stable and robust estimates. As shown in Figure 3, the final RF estimate, , is computed as the average of the prediction outputs from individual decision trees, , as expressed in Equation (3). This ensemble-averaging mechanism effectively reduces predictive variance while preserving the necessary nonlinearity for accurate multisource QPE generation. The model was implemented using the Scikit-learn library in Python (Version 3.12), with key hyperparameters—such as the number and depth of trees—optimized via the Optuna library.
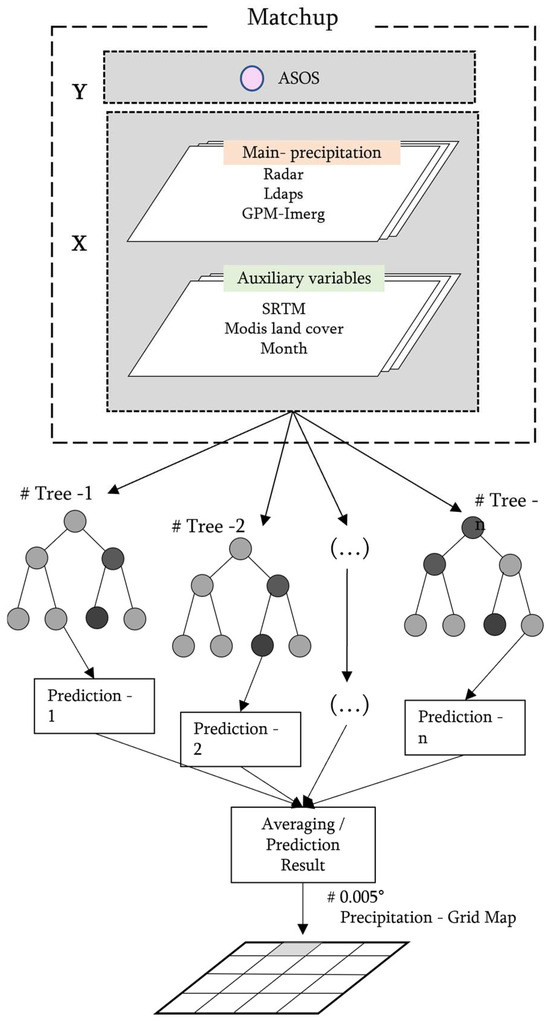
Figure 3.
RF-based QPE pipeline: Inputs, ensemble trees, and averaging.
3.3. Predictor Design and Model Selection
Four model versions (Versions 1–4) were constructed sequentially to evaluate the performance gains in RF-based multisource precipitation estimation as the input variable set was progressively expanded (Table 2). Version 1 served as the baseline configuration, utilizing only primary precipitation inputs from GPM IMERG, LDAPS, and Radar. In Versions 2–4, topographic features, land cover, and seasonality were added incrementally to examine how each auxiliary predictor contributes to capturing the nonlinear interactions between the environment and meteorology that govern precipitation patterns.
Table 2.
Incremental predictor sets and model versions.
Topographic variables—elevation, slope, and hillshade—are critical background factors that explain the spatial distribution of precipitation. In mountainous regions, altitude, slope gradients, and terrain configuration systematically influence airflow patterns, moisture supply, and precipitation intensity. These terrain-dependent precipitation disparities have been consistently documented in both observational and modeling studies [35,40]. Therefore, incorporating topographic information as auxiliary predictors facilitates a more accurate representation of localized spatial patterns during the multisource fusion process.
Furthermore, land-cover information from MODIS (MCD12Q1) accounts for surface-driven variations in heat and moisture fluxes. Surface characteristics have been shown to modify the thermal structure of the atmospheric boundary layer and moisture availability, thereby influencing regional variations in precipitation intensity [22]. Because distinct land-cover types—such as forests, urban areas, and croplands—exhibit different energy-exchange and moisture-recycling behaviors, these data were used as auxiliary variables to account for localized biases in the estimation process.
Finally, seasonality was included to reflect the distinct precipitation regimes of South Korea. Statistical climate analyses indicate that the frequency and intensity distributions of precipitation vary systematically by season [28]. To enable the model to reliably learn these seasonal phases, the month variable was transformed into cyclic predictors using sine–cosine encoding. Based on a comprehensive evaluation of Mean Bias Error (MBE), Mean Absolute Error (MAE), Root Mean Square Error (RMSE), and Correlation Coefficient (CC), Version 4 was selected as the final optimal model.
3.4. ECDF Correction
ECDF correction was applied to align the daily accumulated precipitation fields generated by the Version 4 RF model with the statistical distribution of the ASOS observations. As illustrated in Figure 4, precipitation in South Korea exhibits pronounced seasonality: summer (Jun–Jul–Aug) is characterized by high-intensity extreme events (95th percentile: 56.8, 76.3, 68.8 mm/day, respectively), whereas winter (Dec–Jan–Feb) is dominated by low-intensity precipitation (95th percentile: 17.2, 20.9, 17.1 mm/day, respectively). If such non-Gaussianity and seasonal heterogeneity are neglected, a Global ECDF—which assumes a single distribution over the entire study period—may average out these distinctive seasonal characteristics and distort the intrinsic distribution of each season [41]. To address this, a Monthly ECDF approach was introduced to better preserve extremes and reflect seasonal variability, with its performance compared against the Global ECDF. Monthly stratification was adopted because precipitation distributions can differ markedly even within a given season (Figure 4), whereas daily stratification can become statistically unstable due to limited sample sizes. The ECDF correction procedure maps the cumulative probability of a predicted value to the inverse cumulative distribution of the observations , yielding the corrected estimate as follows (Figure 5):
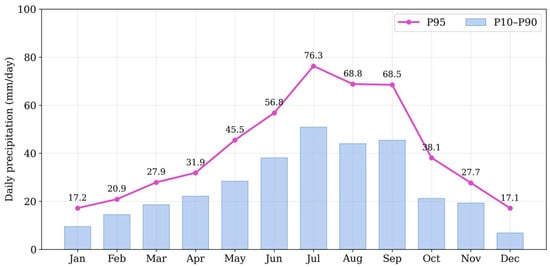
Figure 4.
Six-year (2019–2024) monthly P10–P90 range and P95 of daily precipitation from ASOS stations in South Korea.
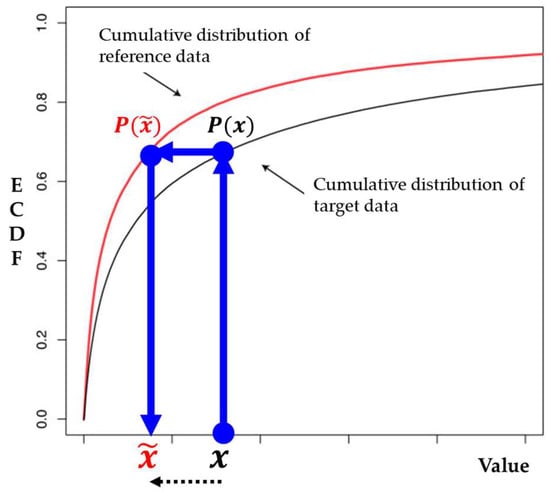
Figure 5.
ECDF correction procedure using cumulative distribution of target data and reference data.
While the Global ECDF applies a single transformation function to all RF model outputs, the Monthly ECDF constructs month-specific functions using the 2019–2024 dataset and applies the corresponding function for each respective month. In all ECDF corrections, linear extrapolation was applied to the distributional tails (values outside the observed bounds) to ensure flexibility in handling unprecedented extreme events [42]. The correction results from both the Global and Monthly ECDF methods were subsequently evaluated using statistical metrics.
3.5. Evaluation Scheme
First, the performance of the RF models (Versions 1–4) was evaluated using random sampling. From the 6440 daily precipitation matchups collected between 2019 and 2023, 80% were allocated for training and 20% for validation; the random seed was fixed to ensure the reproducibility of the results. Accuracy was quantified using the MBE, MAE, RMSE, and CC.
Second, the optimal RF model was selected from the four versions and subjected to Leave-One-Year-Out (LOYO) validation, incorporating both Global and Monthly ECDF corrections. In this stage, data from 2019 to 2023 were used for training, while the 2024 dataset was reserved for independent evaluation.
Third, an in-depth comparison was conducted for regions with complex terrain. The Yeongdong and Yeongseo regions were selected as they exhibit pronounced contrasts in precipitation patterns due to the Taebaek Mountains (Figure 6). Previous research has established that topography is a decisive factor in determining both the statistical distribution of precipitation and the accuracy of estimation models [40,43]. The Taebaek Mountains serve as a representative example, driving distinct precipitation regimes between the two regions through orographic lifting and the modulation of synoptic airflow pathways [44,45,46]. Accordingly, this study evaluated 12 ASOS stations—eight in Yeongseo and four in Yeongdong—using daily observations from 2019 to 2024. To account for seasonal variability, performance was assessed separately for winter (DJF) and summer (JJA).
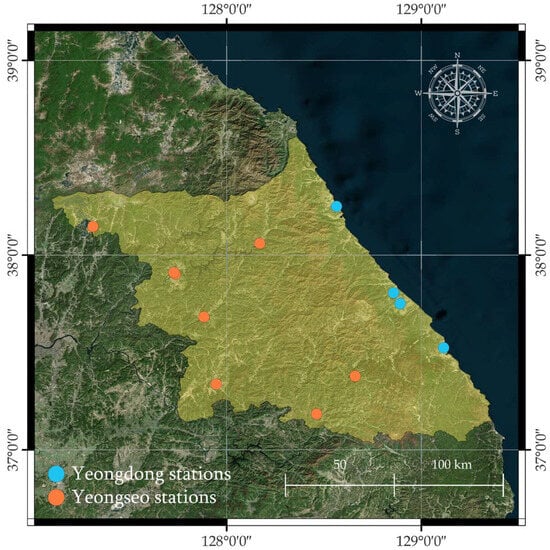
Figure 6.
In-depth evaluation of region and station locations. Blue markers denote Yeongdong and orange markers denote Yeongseo; the shaded area in green indicates the evaluation domain.
Finally, the resulting precipitation estimates were compared against existing precipitation products using ASOS observations as the ground-truth reference. Because this evaluation relies on direct gauge-grid collocation, the reported performance metrics should be interpreted with caution in mountainous areas, where a point gauge may not fully represent the areal mean precipitation of a 500 m grid cell. Accordingly, this study emphasizes national-scale stability and relative improvements across products, while complementing quantitative statistics with region- and season-stratified analyses as well as event-based spatial evaluations.
In addition, the annual MODIS land-cover predictor does not explicitly represent seasonal surface conditions such as snow cover, which may introduce additional uncertainty during winter (DJF). To transparently assess regime-dependent behavior under such conditions, winter (DJF) performance is reported separately in the regional evaluation.
4. Results and Discussion
4.1. Model Evaluation
4.1.1. Performance Comparisons by Incremental Predictor Addition
To quantitatively assess the contribution of the auxiliary input variables, an ablation study was performed by progressively adding topographic features (elevation, slope, and hillshade), land-cover types, and seasonality (sine and cosine of the month) to the baseline precipitation-only model (Version 1), as summarized in Table 3. For model evaluation, 20% of the total dataset (n = 15,750) was randomly selected as an independent test set. The results indicated that the MAE decreased by approximately 12% ((3.876 − 3.415)/3.876), while the CC improved from 0.911 to 0.933, from Version 1 to Version 4. The most significant improvement occurred with the addition of topographic variables (Version 1 to Version 2), consistent with previous studies reporting that terrain characteristics in mountainous and coastal regions strongly influence the spatial structure and reproduction of precipitation extremes [35,40].
Table 3.
Test set evaluation of incremental predictor sets (V1–V4). Best scores are in bold.
Subsequently, the inclusion of land-cover and seasonality further reduced the MAE by 0.231 mm/day (3.646 − 3.415). Land-cover and seasonal variables provide auxiliary information related to surface energy and moisture flux disparities and seasonal shifts in precipitation regimes, respectively. By incorporating these environmental factors into the RF model, spatially and seasonally adjusted weights can be applied even under identical precipitation input conditions, leading to further error reduction [22,28].
The primary reason for the substantial improvement following the addition of topographic predictors is that the spatial variability of precipitation is intrinsically linked to terrain gradients. In mountainous and coastal regions, variations in orographic lifting and moisture transport—driven by altitude, slope, and terrain configuration—are pronounced. The inclusion of topographic information enables the RF model to more sensitively detect and represent these localized precipitation patterns [35,40]. While topographic predictors account for a substantial portion of the overall performance improvement, land-cover and seasonal predictors provide additional gains by reducing systematic biases and improving regime-dependent consistency.
4.1.2. Model Performance by LOYO Validation
Using the RF Version 4 model—which incorporates the full suite of variables, including precipitation, terrain, land cover, and monthly information—we conducted a LOYO validation (Table 4 and Figure 7). The model achieved an MAE of 3.304 mm/day and a CC of 0.935, demonstrating performance consistency with the random sampling test. Despite the significant terrain and seasonal heterogeneity across South Korea, these results indicate a high level of agreement. This performance is comparable to the error ranges reported in RF-based precipitation fusion studies across East Asia and is considered robust given the inherent topographic complexity and data characteristics [39,47].
Table 4.
Performance comparisons among multiple precipitation data with Leave-One-Year-Out (LOYO) validation for 2024.
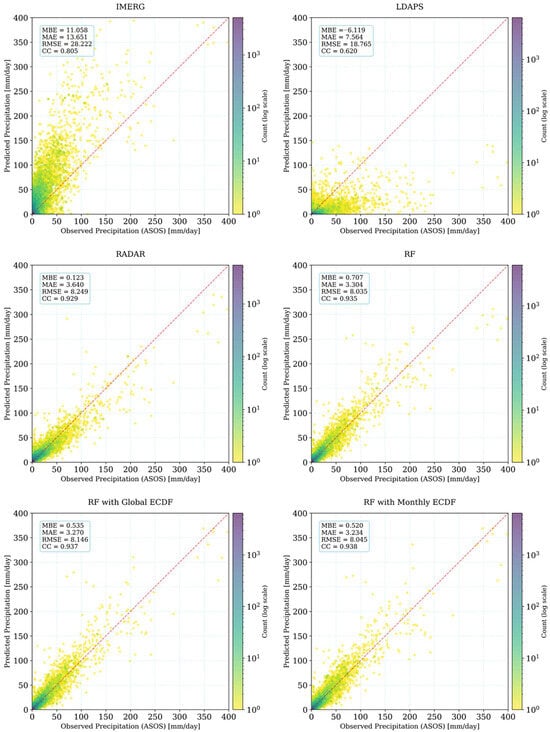
Figure 7.
Scatter plots for performance comparisons among multiple precipitation data with Leave-One-Year-Out (LOYO) validation for 2024.
Because the RF ensemble structure averages heterogeneous error characteristics across multiple sources, it can stably reproduce spatial precipitation patterns, even when the distribution deviates from the training period. This inherent property explains why the independent 2024 evaluation maintained a high correlation coefficient (CC = 0.935), confirming the model’s generalizability [37].
The application of global and monthly ECDF for additional correction reduced the MAE by up to 11.2% (from 3.640 to 3.234) and improved the CC by 0.09 (from 0.929 to 0.938) compared to the original radar precipitation product. Furthermore, when compared with other products such as IMERG and LDAPS, our RF-ECDF integration significantly enhanced accuracy by more than 57.2% (calculated as (7.564 − 3.234)/7.564).
While the LOYO framework provides an independent evaluation for 2024, it cannot fully characterize interannual variability or historically rare extreme events. To explicitly assess performance under extreme rainfall conditions, we evaluated high-percentile days using the full matchup dataset (2019–2024). For ASOS-observed daily precipitation exceeding the 95th percentile (≥49.0 mm day−1; n = 3944), the RF with Monthly ECDF achieved an MBE of −2.48 mm day−1, an MAE of 11.58 mm day−1, an RMSE of 18.80 mm day−1, and a CC of 0.905 (see also Section 4.3 for event-based analyses).
4.1.3. Effect of Monthly ECDF
For the RF-QPE outputs, both Global ECDF (covering the entire study period) and Monthly ECDF (month-specific distributions) were applied. Using the RF Version 4 model integrated with these ECDFs, precipitation maps were generated for the period from 1 January 2019 to 31 December 2024. These maps were evaluated against the ASOS validation set using CC, RMSE, MAE, and MBE.
As the Monthly ECDF directly aligns with the monthly distribution of precipitation, it effectively suppresses monthly fluctuations in the MBE and reduces the overall absolute bias, thereby enhancing the consistency of the bias direction (Figure 8). For instance, the Global ECDF resulted in MBE values of −0.396 and −0.417 mm/day (underestimation) in April and May, respectively, but shifted to 0.676 mm/day (overestimation) in July, showing significant monthly variability in both sign and magnitude. In contrast, the Monthly ECDF yielded MBE values of −0.030, −0.038, and −0.051 mm/day for those same months, converging toward zero with a consistent bias direction throughout the period.
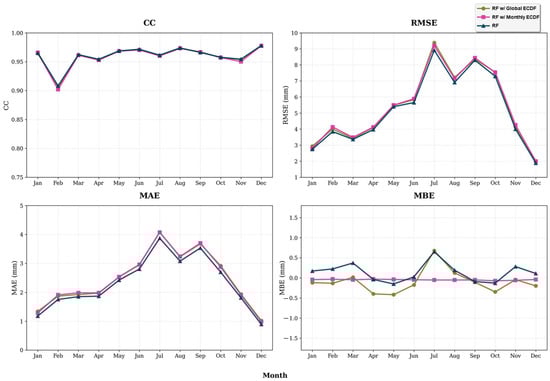
Figure 8.
Month-wise statistics (MBE, MAE, RMSE, and CC) comparing Global and Monthly ECDF corrections for the RF-QPE product; monthly ECDF generally reduces MBE while keeping CC stable.
4.2. Regional and Seasonal Comparisons with Existing Products
As described in Figure 6, the evaluation region was defined as the Yeongdong–Yeongseo area, a mountainous region where precipitation regimes contrast sharply across the Taebaek Mountains. Based on these regional characteristics, the seasonal (DJF and JJA) performance of Radar, IMERG, LDAPS, and the RF with Monthly ECDF was evaluated against daily ASOS observations from 2019 to 2024 at 12 stations (Table 5, Figure 9 and Figure 10).
Table 5.
Seasonal validation over Yeongdong and Yeongseo regions (2019–2024): Comparison of IMERG, LDAPS, Radar, and RF with Monthly ECDF (ours) against ASOS observations.
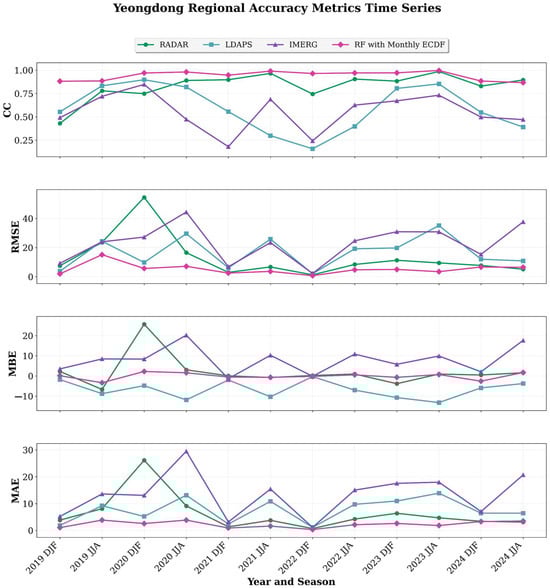
Figure 9.
Seasonal validation over Yeongdong region (2019–2024): Comparison of IMERG, LDAPS, Radar, and RF with Monthly ECDF against ASOS observations.
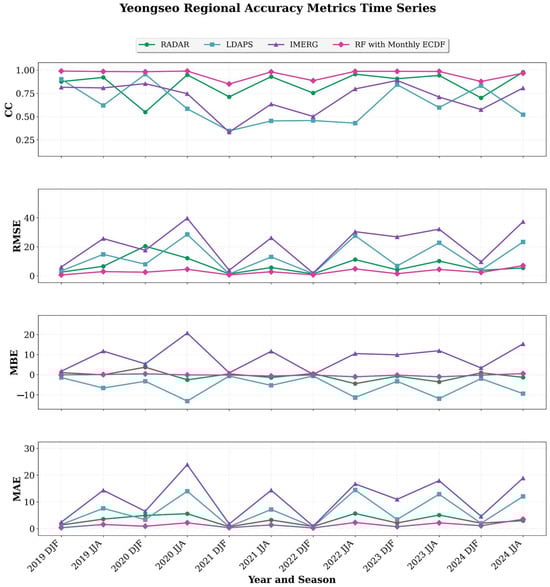
Figure 10.
Seasonal validation over Yeongseo region (2019–2024): Comparison of IMERG, LDAPS, Radar, and RF with Monthly ECDF against ASOS observations.
In the Yeongdong region during the winter (DJF), the Radar data exhibited substantial degradation, with an MAE of 7.919 mm/day and a CC of 0.545. This aligns with previous findings that radar uncertainty increases during snowfall due to beam overshooting, the heterogeneous reflectivity of snow particles, and observation gaps caused by terrain blockage [48]. Seasonal distributional analysis (Figure 11) further confirmed this: the DJF ln(Radar/ASOS) in Yeongdong showed a mean of 0.62, representing an approximate +86% positive bias compared to non-winter months, which indicates significant winter overestimation. In contrast, the RF with Monthly ECDF achieved an MAE of 2.087 mm/day and a CC of 0.936, representing a 73.6% reduction in MAE (from 7.919 to 2.087 mm/day) and a 0.391 increase in CC. This enhancement is attributed not only to the RF model’s predictive capability but also to the month-specific distributional scaling. This approach prevents the low-variance winter precipitation distribution from being excessively stretched, ensuring that corrections remain within a range consistent with observed values [19,41].
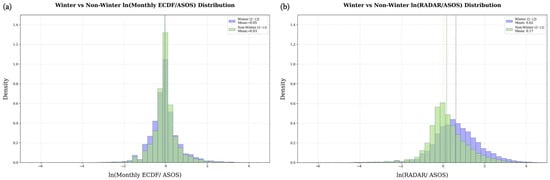
Figure 11.
Winter (DJF) and non–winter seasonal distributions of log-transformed precipitation ratios: (a) RF with Monthly ECDF relative to ASOS, and (b) radar relative to ASOS. Density denotes the normalized probability density of the logarithmic precipitation ratio (ln of model/ASOS), with each histogram normalized to unit area. The blue dashed line indicates the winter mean, and the green dashed line indicates the non-winter mean.
Across all evaluation regimes (Yeongdong and Yeongseo during both DJF and JJA), the RF with Monthly ECDF reduced the MAE by approximately 48.7–87.9%, increased the CC to a range of 0.936–0.982, and stabilized the MBE near zero. Overall, even in regions where precipitation heterogeneity is intensified by seasonal windward–leeward transitions along the Taebaek Mountains, the integration of multi-source RF fusion, terrain/seasonal predictors, and monthly ECDF correction effectively mitigated structural errors and delivered consistent performance improvements in both winter and summer (Table 5). Detailed station-level results are provided in Appendix A (Figure A1).
4.3. Event-Based Spatial Validation
Spatial validation using extreme weather events was conducted to evaluate whether the model can be reliably applied not only under routine conditions but also during highly variable situations where the structure of precipitation fields changes rapidly. Two representative cases—(i) Typhoon Haishen (2020) and (ii) the 2021 monsoon season—were selected to assess the spatial reproducibility of the Monthly ECDF QPE. These cases exhibit pronounced formation–movement–dissipation processes of rainbands and are well-suited for evaluation because they encompass the combined influences of Korea’s distinctive topographic effects and seasonal regime transitions. The analysis periods were defined as (i) Typhoon Haishen (21:00 KST, 1 September 2020–21:00 KST, 7 September 2020) and (ii) the 2021 monsoon season (3–19 July 2021), following the official definitions provided by the Korea Meteorological Administration (KMA).
4.3.1. Typhoon Haishen (2020)
In the case study of Typhoon Haishen, the official termination of the event was defined as 21:00 KST on 7 September 2020 at 40.4° N, 128.6° E, according to the KMA best-track data, marking its transition into an extratropical cyclone. However, to fully capture the evolution of the storm’s impact on the Korean Peninsula, the analysis window was extended to cover 5–10 September. This expansion enabled a comprehensive evaluation of the approach, landfall (or closest passage), departure, and post-extratropical transition (ET) stages through the RF with Monthly ECDF mapping. (All official timing, center locations, and typhoon parameters follow the KMA dataset).
As shown in Figure 12, rainbands were concentrated along the southern and eastern coasts, as well as on windward slopes, between 5 and 7 September. From 8 September onward, precipitation weakened and dissipated into residual rainfall following the extratropical transition (ET) stage. The RF with the Monthly ECDF framework consistently reproduced the alignment, center movement, and decay patterns of the rainbands, demonstrating strong agreement with observed meteorological tendencies.
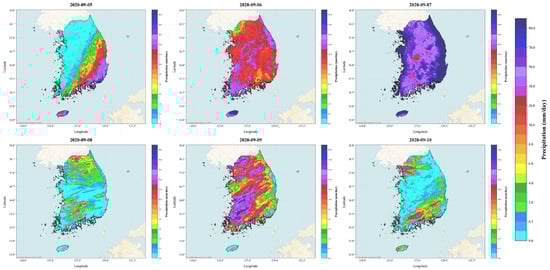
Figure 12.
Our daily precipitation maps over South Korea during Typhoon Haishen (5–10 September 2020, KST). Daily accumulations (mm/day) are rendered using the KMA Radar color scale (e.g., navy = 90 mm/day). According to the KMA best-track data, the system officially terminated at 21:00 KST on 7 September 2020 (40.4° N, 128.6° E); maps for 8–10 September show post-typhoon residual rainfall. Base map source: © OpenStreetMap contributors, © CARTO.
For a quantitative evaluation of the event, four-day accumulated precipitation (5–8 September 2020) was compared with ASOS observations from 94 stations. This comparison yielded a CC of 0.975, with associated error metrics of MBE = 7.32 mm, MAE = 9.90 mm, and RMSE = 14.10 mm. These statistics complement the spatial analyses shown in Figure 12 by providing an event-scale evaluation of accumulated precipitation.
4.3.2. Rainy Season (2021)
Figure 13 presents the daily accumulated precipitation fields at the onset of the 2021 monsoon (3 July) and immediately following its termination (20 July). On 3 July (Figure 13a), a well-organized rainband extended across South Korea, accompanied by enhanced precipitation along the windward slopes of major mountain ranges. The RF with the Monthly ECDF framework accurately reproduced these spatial gradients and frontal structures. In contrast, on 20 July (Figure 13b), following the dissipation of the monsoon front, only scattered residual rainfall remained, resulting in a weak nationwide precipitation field. Our framework consistently captured this weakening and the subsequent displacement pattern.
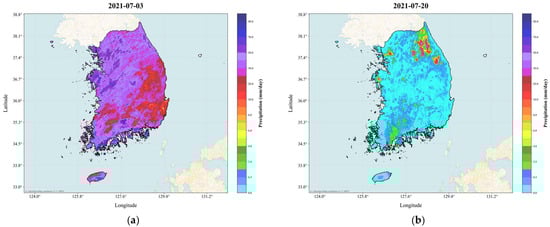
Figure 13.
RF with ECDF generated daily precipitation maps over South Korea during the 2021 Changma (monsoon). (a) 3 July 2021 (the onset day as defined by the KMA); (b) 20 July 2021 (the day following the official termination). Daily accumulations (mm/day) are rendered using the KMA Radar color scale (e.g., navy = 90 mm/day). Base map source: © OpenStreetMap contributors, © CARTO.
For the total accumulated precipitation during the monsoon period (3–19 July), as officially defined by the KMA, the RF with the Monthly ECDF framework was validated against ASOS observations from 66 stations (Figure 14). The correlation coefficient (CC = 0.973) indicates excellent spatial agreement; however, the total accumulation showed an overall underestimation, with an MBE of −19.65 mm and an MAE of 24.49 mm. The best-fit line (y = 0.88x + 6.66) had a slope of less than 1, suggesting a reduced correction strength in the high-precipitation range. This behavior occurs because ECDF correction requires extrapolation when sample sizes in the upper tail of the distribution are limited, leading to more conservative adjustments for extreme values [41,42]. This characteristic should be considered when interpreting the negative bias observed in the monsoon-period accumulation analysis (MBE = −19.65 mm).
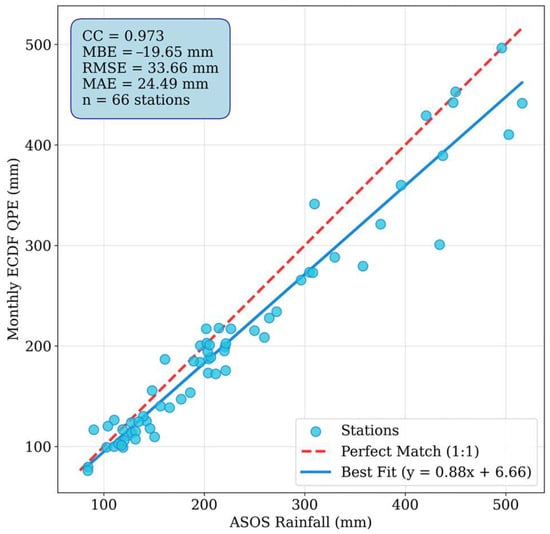
Figure 14.
Station-wise comparison of cumulative rainfall during the 2021 Changma (monsoon) period. The scatter plot compares KMA ASOS observations (x-axis) with the RF with the Monthly ECDF (y-axis) for 66 stations. The dashed line denotes the 1:1 reference, and the solid line represents the least-squares regression (y = 0.88x + 6.66). Statistical metrics include: CC = 0.973, MBE = −19.65 mm, MAE = 24.49 mm, and RMSE = 33.66 mm. The data points represent total cumulative rainfall (mm) over the official monsoon period as defined by the KMA.
The full sequence of daily accumulated precipitation from 1 to 25 July 2021, encompassing the entire monsoon period, is provided in Appendix B (Figure A2). This sequence confirms that the formation, movement, and dissipation of the monsoon front were consistently reproduced over time.
These event-based evaluations provide targeted insight into model behavior under high-impact precipitation regimes characterized by upper-tail rainfall distributions. While they do not replace systematic percentile-based assessments across the full validation dataset, they offer explicit evidence of model performance during disaster-relevant extreme events.
4.3.3. Extreme-Event Robustness and Limitations
Robustness under extreme precipitation conditions is a critical requirement for precipitation fusion products intended for hydrometeorological and disaster-relevant applications. To explicitly evaluate model behavior during heavy-rainfall regimes, we conducted a high-percentile assessment using the full matchup dataset (2019–2024), focusing on days when ASOS-observed daily precipitation exceeds the 95th percentile. This analysis targets precipitation conditions characteristic of intense monsoon rainfall and provides a quantitative complement to overall performance metrics dominated by more frequent moderate events. The results indicate that the proposed RF–Monthly ECDF framework maintains strong skill under heavy-rainfall conditions, although a tendency toward conservative estimates is evident for the most extreme cases.
In addition to percentile-based evaluation, event-focused analyses were performed for historically impactful precipitation episodes, including Typhoon Haishen (2020) and the 2021 summer monsoon. These case studies demonstrate that the proposed framework reproduces coherent spatial patterns and realistic temporal evolution during high-impact events, supporting its robustness under extreme forcing. Nevertheless, it should be noted that the limited length of the available homogeneous dataset constrains explicit evaluation of rare, unprecedented extremes and decadal-scale variability. Consequently, while the present results provide encouraging evidence of robustness under extreme precipitation within the analyzed period, further assessment using longer records and expanded extreme-event samples will be necessary to fully characterize model performance under the most severe hydrometeorological conditions.
4.4. Scalability and Operational Considerations
Although the present study focuses on evaluating fusion skill and robustness under a consistent retrospective setting, the scalability of the proposed RF–Monthly ECDF framework warrants discussion. Nationwide daily processing at a 500 m spatial resolution inevitably entails substantial computational demands, particularly for real-time operational deployment. However, the methodological structure of the proposed framework is inherently amenable to scalable implementation. Both the Random Forest prediction and the subsequent ECDF-based correction are applied independently at the pixel level, enabling efficient parallelization through spatial tiling and distributed computing architectures. Moreover, the ECDF correction operates as a lightweight post-processing step and does not require iterative optimization, further limiting computational overhead. For operational applications, computational demands could be flexibly managed by adjusting spatial resolution, temporal update frequency, or processing domains, depending on user requirements. These characteristics suggest that, while not optimized here for real-time nationwide production, the proposed framework provides a practical foundation for scalable high-resolution precipitation estimation under appropriate computational configurations.
5. Conclusions
This study developed and evaluated a high-resolution (~500 m) daily quantitative precipitation estimation (QPE) framework by fusing radar, satellite (IMERG), and numerical weather prediction (LDAPS) data using a Random Forest (RF) model. The framework was further enhanced through the integration of auxiliary predictors, including topography, land cover, and seasonal information, together with a Monthly ECDF-based distributional correction. Ablation experiments demonstrated the importance of these auxiliary predictors, with their sequential inclusion reducing the mean absolute error by approximately 10–12% and improving the correlation coefficient from 0.911 to 0.930.
LOYO evaluation using the independent year 2024 confirmed the generalizability of the proposed approach, yielding a correlation coefficient of 0.935 and an MAE of 3.304 mm day−1. Regional validation across the Yeongdong and Yeongseo areas under contrasting seasonal regimes (DJF/JJA) showed stable near-zero mean bias, consistently high correlation coefficients (0.94–0.98), and substantial reductions in RMSE (approximately 41–68%). These results indicate robust performance across complex terrain and pronounced seasonal transitions associated with the Taebaek Mountains.
Event-based analyses of the 2021 summer monsoon and Typhoon Haishen further demonstrated the ability of the proposed framework to reproduce key precipitation features, including rainband alignment, peak rainfall locations, and windward–leeward contrasts. Complementary high-percentile evaluations suggest that the RF–Monthly ECDF framework maintains robust performance under heavy-rainfall regimes characteristic of the East Asian summer monsoon, while exhibiting conservative behavior for the most extreme precipitation cases.
Overall, the proposed RF-based fusion framework provides high-resolution daily precipitation fields that are well suited for analyzing precipitation variability in regions characterized by strong topographic and seasonal heterogeneity, such as South Korea. While this study focuses on retrospective evaluation of fusion skill and robustness under physically consistent input conditions, future work will explore non-parametric approaches, such as kernel density estimation (KDE), to more flexibly represent distributional tails and to improve the treatment of unprecedented extreme precipitation events, particularly under monsoon conditions.
Author Contributions
Conceptualization, H.P., S.H.K., and Y.L.; methodology, H.P., S.H.K., and Y.L.; formal analysis, H.P.; data curation, H.P.; writing—original draft preparation, H.P.; writing—review and editing, H.M., M.K., S.H.K., and Y.L.; supervision, Y.L. All authors have read and agreed to the published version of the manuscript.
Funding
This work was supported by Korea Environment Industry and Technology Institute (KEITI) through Research and Development on the Technology for Securing the Water Resources Stability in Response to Future Change Project, funded by Korea Ministry of Climate, Energy and Environment (MCEE) (RS-2024-00332300). This research was supported by a grant (2021-MOIS37-002) from the Intelligent Technology Development Program on Disaster Response and Emergency Management funded by the Ministry of Interior and Safety (MOIS, Korea). This work was supported by the National Research Foundation (NRF), Korea, under the project BK21 FOUR.
Data Availability Statement
The original contributions presented in this study are included in the article. Further inquiries can be directed to the corresponding authors.
Conflicts of Interest
Author Hiroyuki Miyazaki was employed by the company Global Data Lancers (GLODAL) Incorporation. The remaining authors declare that the research was conducted in the absence of any commercial or financial relationships that could be construed as a potential conflict of interest.
Appendix A
Appendix A was constructed to complement the regional evaluation results in Section 4.2 by examining station-level performance across the Yeongdong and Yeongseo regions. The analysis included 12 ASOS stations partitioned by the Taebaek Mountains—Yeongdong: STN 90, 104, 105, and 106; Yeongseo: STN 211, 212, 217, 93, 95, 101, 114, and 121. The accuracies of Radar, LDAPS, IMERG, and the Monthly ECDF QPE were compared during the winter (DJF) and summer (JJA) for the 2019–2024 period. Performance metrics for each station are presented in Figure A1, where each panel displays seasonal time series of CC, RMSE, MAE, and MBE. This allows for a visual inspection of how consistently station-level behaviors align with the regional patterns reported in the main text.
The Yeongdong region, located on the windward slopes of the Taebaek Mountains, frequently experiences strong orographic uplift, leading to the rapid development and deformation of precipitation bands [49]. During these processes, the vertical structure of precipitation often changes due to increasing altitude and bright-band enhancement, which can induce height biases and beam-overshooting errors in radar-based estimates [50]. For the Radar data, the CC dropped to approximately 0.3 during DJF 2019, while the RMSE increased to 20–90 mm/day during JJA, indicating pronounced performance degradation. IMERG showed structural overestimation during JJA, whereas LDAPS exhibited a persistent negative bias (underestimation) in both seasons.
In contrast, the Monthly ECDF QPE consistently achieved the highest correlations (CC > 0.9) and the lowest RMSE and MAE across all stations in both DJF and JJA, with the MBE remaining stable near zero. These results confirm that the seasonal bias characteristics identified for the Yeongdong region in Section 4.2 are consistently reproduced at the individual station level.
The Yeongseo region, situated on the leeward side of the Taebaek Mountains, is subject to enhanced subsidence and drying effects, resulting in markedly lower precipitation amounts compared to Yeongdong [51,52]. Radar, LDAPS, and IMERG showed expanded bias and variability during DJF, along with IMERG overestimation and LDAPS underestimation in JJA; furthermore, CC values varied substantially across stations. However, the Monthly ECDF QPE consistently achieved the highest CC values (0.94–0.98) and the lowest RMSE and MAE across all stations. This demonstrates that the regional statistical behaviors shown in Figure 9 and Figure 10 remain stable at the station level, proving that the Monthly ECDF QPE responds robustly to the seasonal and topographic heterogeneity of the Yeongseo region.


Figure A1.
Station−wise accuracy metrics (MBE, MAE, RMSE, and CC) for 12 ASOS sites in the Yeongdong and Yeongseo regions (2019–2024). The results compare four precipitation products (Radar, LDAPS, IMERG, and the RF with Monthly ECDF) during the winter (DJF) and summer (JJA). The Yeongdong stations include STN 90, 104, 105, and 106, while the Yeongseo stations include STN 93, 95, 101, 114, 121, 211, 212, and 217. Each panel displays seasonal time series, confirming that the regional performance patterns reported in Section 4.2 are consistently reproduced across individual stations.


Appendix B
This appendix presents the full sequence of our daily precipitation maps from 1 to 25 July 2021. The official monsoon period (3–19 July) is defined according to the Korea Meteorological Administration (KMA). Each panel displays daily accumulated precipitation (mm/day), with the color scale following the KMA Radar legend (maximum class: dark blue = 90 mm/day). This sequence complements the spatial patterns shown in Figure 11 of the main text, confirming that the formation, movement, and dissipation of the monsoon front are consistently reproduced throughout the entire period. Dates are annotated at the top of each panel.

Figure A2.
Our daily precipitation maps over South Korea from 1 to 25 July 2021. This period encompasses the official Changma (monsoon) season (3–19 July). Each panel displays daily accumulated precipitation (mm/day) rendered using the KMA Radar color scale (e.g., navy = 90 mm/day). The date is indicated at the top of each panel. Basemap source: © OpenStreetMap contributors, © CARTO.

References
- Huntington, T.G. Evidence for intensification of the global water cycle: Review and synthesis. J. Hydrol. 2006, 319, 83–95. [Google Scholar] [CrossRef]
- Trenberth, K.E. Changes in precipitation with climate change. Clim. Res. 2011, 47, 123–138. [Google Scholar] [CrossRef]
- Boudala, F.S.; Isaac, G.A.; Filman, P.; Crawford, R.; Hudak, D.; Anderson, M. Performance of Emerging Technologies for Measuring Solid and Liquid Precipitation in Cold Climate as Compared to the Traditional Manual Gauges. J. Atmos. Ocean. Technol. 2017, 34, 167–185. [Google Scholar] [CrossRef]
- Nitu, R.; Roulet, Y.A.; Wolff, M.; Earle, M.E.; Reverdin, A.; Smith, C.D.; Kochendorfer, J.; Morin, S.; Rasmussen, R.; Wong, K.; et al. WMO Solid Precipitation Intercomparison Experiment (SPICE) (2012–2015); World Meteorological Organization: Geneva, Switzerland, 2019. [Google Scholar]
- Sun, Q.; Miao, C.; Duan, Q.; Ashouri, H.; Sorooshian, S.; Hsu, K.-L. A review of global precipitation data sets: Data sources, estimation, and intercomparisons. Rev. Geophys. 2018, 56, 79–107. [Google Scholar] [CrossRef]
- Kumjian, M.R.; Prat, O.P.; Reimel, K.J.; van Lier-Walqui, M.; Morrison, H.C. Dual-Polarization Radar Fingerprints of Precipitation Physics: A Review. Remote Sens. 2022, 14, 3706. [Google Scholar] [CrossRef]
- Tang, G.; Clark, M.P.; Papalexiou, S.M.; Ma, Z.; Hong, Y. Have satellite precipitation products improved over last two decades? A comprehensive comparison of GPM IMERG with nine satellite and reanalysis datasets. Remote Sens. Environ. 2020, 240, 111697. [Google Scholar] [CrossRef]
- Huffman, G.J.; Bolvin, D.T.; Braithwaite, D.; Hsu, K.; Joyce, R.; Xie, P.; Yoo, S.H. NASA Global Precipitation Measurement (GPM) Integrated Multi-Satellite Retrievals for GPM (IMERG). In Algorithm Theoretical Basis Document (ATBD) Version 4; NASA: Greenbelt, MD, USA, 2015; p. 30. [Google Scholar]
- Pradhan, R.K.; Markonis, Y.; Godoy, M.R.V.; Villalba-Pradas, A.; Andreadis, K.M.; Nikolopoulos, E.I.; Papalexiou, S.M.; Rahim, A.; Tapiador, F.J.; Hanel, M. Review of GPM IMERG performance: A global perspective. Remote Sens. Environ. 2022, 268, 112754. [Google Scholar] [CrossRef]
- Huffman, G.J.; Bolvin, D.T.; Nelkin, E.J.; Wolff, D.B.; Adler, R.F.; Gu, G.; Hong, Y.; Bowman, K.P.; Stocker, E.F. The TRMM Multisatellite Precipitation Analysis (TMPA): Quasi-Global, Multiyear, Combined-Sensor Precipitation Estimates at Fine Scales. J. Hydrometeorol. 2007, 8, 38–55. [Google Scholar] [CrossRef]
- Song, H.-J.; Lim, B.; Joo, S. Evaluation of Rainfall Forecasts with Heavy Rain Types in the High-Resolution Unified Model over South Korea. Weather Forecast. 2019, 34, 1277–1293. [Google Scholar] [CrossRef]
- Li, L.; Chen, X.; Ma, Y.; Zhao, W.; Zuo, H.; Liu, Y.; Cao, D.; Xu, X. Implications for Validation of IMERG Satellite Precipitation in a Complex Mountainous Region. Remote Sens. 2023, 15, 4380. [Google Scholar] [CrossRef]
- Villarini, G.; Krajewski, W.F. Review of the Different Sources of Uncertainty in Single Polarization Radar-Based Estimates of Rainfall. Surv. Geophys. 2010, 31, 107–129. [Google Scholar] [CrossRef]
- Doviak, R.J.; Zrnić, D.S. Doppler Radar and Weather Observations, 2nd ed.; Academic Press: San Diego, CA, USA, 2014. [Google Scholar]
- Hong, S.Y.; Kwon, Y.C.; Kim, T.H.; Esther Kim, J.E.; Choi, S.J.; Kwon, I.H.; Kim, J.; Lee, E.H.; Park, R.S.; Kim, D.I. The Korean Integrated Model (KIM) System for Global Weather Forecasting. Asia-Pac. J. Atmos. Sci. 2018, 54, 267–292. [Google Scholar] [CrossRef]
- Yu, W.; Yoon, S.; Choi, M.; Jung, K. Performance Comparison of Rainfall and Flood Forecasts Using Short-Term Numerical Weather Prediction Data from Korea and Japan. J. Korea Water Resour. Assoc. 2017, 50, 537–549. [Google Scholar] [CrossRef]
- Goovaerts, P. Geostatistical approaches for incorporating elevation into the spatial interpolation of rainfall. J. Hydrol. 2000, 228, 113–129. [Google Scholar] [CrossRef]
- Verdin, A.; Rajagopalan, B.; Kleiber, W.; Funk, C. A Bayesian kriging approach for blending satellite and ground precipitation observations. Water Resour. Res. 2015, 51, 908–921. [Google Scholar] [CrossRef]
- Gudmundsson, L.; Bremnes, J.B.; Haugen, J.E.; Engen-Skaugen, T. Downscaling RCM precipitation to the station scale using statistical transformations–a comparison of methods. Hydrol. Earth Syst. Sci. 2012, 16, 3383–3390. [Google Scholar] [CrossRef]
- Wolfensberger, D.; Gabella, M.; Boscacci, M.; Germann, U.; Berne, A. RainForest: A random forest algorithm for quantitative precipitation estimation over Switzerland. Atmos. Meas. Tech. 2021, 14, 3169–3193. [Google Scholar] [CrossRef]
- Tyralis, H.; Papacharalampous, G.; Doulamis, N.; Doulamis, A. Merging Satellite and Gauge-Measured Precipitation Using LightGBM with an Emphasis on Extreme Quantiles. IEEE J. Sel. Top. Appl. Earth Obs. Remote Sens. 2023, 16, 6969–6979. [Google Scholar] [CrossRef]
- Zhang, L.; Li, X.; Zheng, D.; Zhang, K.; Ma, Q.; Zhao, Y.; Ge, Y. Merging multiple satellite-based precipitation products and gauge observations using a novel double machine learning approach. J. Hydrol. 2021, 594, 125969. [Google Scholar] [CrossRef]
- Lei, H.; Zhao, H.; Ao, T. A two-step merging strategy for incorporating multi-source precipitation products and gauge observations using machine learning classification and regression over China. Hydrol. Earth Syst. Sci. 2022, 26, 2969–2995. [Google Scholar] [CrossRef]
- Das, P.; Zhang, Z.; Ghosh, S.; Hang, R. A hybrid ensemble learning merging approach for enhancing the super drought computation over Lake Victoria Basin. Sci. Rep. 2024, 14, 13870. [Google Scholar] [CrossRef]
- Jung, I.; Choi, S.; Jung, D.; Woo, J.; Sim, S.; Han, K.-S. Accuracy Assessment of Precipitation Products from GPM IMERG and CAPPI Ground Radar over South Korea. Korean J. Remote Sens. 2024, 40, 269–274. [Google Scholar]
- Nguyen, G.V.; Le, X.-H.; Van, L.N.; May, D.T.T.; Jung, S.; Lee, G. Machine learning approaches for reconstructing gridded precipitation based on multiple source products. J. Hydrol. Reg. Stud. 2023, 48, 101475. [Google Scholar] [CrossRef]
- Yoon, S.-S.; Bae, D.-H. Optimal Rainfall Estimation by Considering Elevation in the Han River Basin, South Korea. J. Appl. Meteorol. Climatol. 2013, 52, 802–818. [Google Scholar] [CrossRef]
- Choi, H.; Kim, J.; Choi, Y.; Hur, I.; Lee, T.; Kim, S.; Min, S.; Lee, D.; Choi, D.; Sung, H.M.; et al. The Recent Climatic Characteristic and Change in the Republic of Korea based on the New Normals (1991–2020). Atmosphere 2023, 33, 477–492. [Google Scholar]
- Lee, K.; Kang, D.H.; Jung, H.C.; Park, G.; Gye, C.; Kumar, S.; Kim, E.J.; Peters-lidard, C.D.; Hwang, E. Toward a ground-based and long-term meteorological forcing dataset for South Korea. Theor. Appl. Climatol. 2023, 153, 155–172. [Google Scholar] [CrossRef]
- Korea Meteorological Administration (KMA). Guide to Ground Meteorological Observation; KMA: Seoul, Republic of Korea, 2024; Available online: https://data.kma.go.kr/data/publication/publicationGlList.do (accessed on 26 September 2025).
- Huffman, G.J.; Bolvin, D.T.; Braithwaite, D.; Hsu, K.L.; Joyce, R.J.; Kidd, C.; Nelkin, E.J.; Sorooshian, S.; Stocker, E.F.; Tan, J.; et al. Integrated Multi-satellite Retrievals for the Global Precipitation Measurement (GPM) Mission (IMERG). In Satellite Precipitation Measurement; Levizzani, V., Kidd, C., Kirschbaum, D., Kummerow, C., Mesrani, K., Turk, F., Eds.; Springer: Cham, Switzerland, 2020; pp. 343–353. [Google Scholar]
- Huffman, G.J.; Bolvin, D.T.; Joyce, R.; Kelley, O.A.; Nelkin, E.J.; Portier, A.; Stocker, E.F.; Tan, J.; Watters, D.C.; West, B.J. IMERG V07 Release Notes; Goddard Space Flight Center: Greenbelt, MD, USA, 2023. [Google Scholar]
- Lyu, G.; Jung, S.-H.; Oh, Y.-J.; Park, H.-M.; Lee, G. Accuracy Evaluation of Composite Hybrid Surface Rainfall (HSR) using KMA Weather Radar Network. J. Korean Earth Sci. Soc. 2017, 38, 496–510. [Google Scholar] [CrossRef]
- Tang, G.; Clark, M.P.; Knoben, W.J.; Liu, H.; Gharari, S.; Arnal, L.; Beck, H.E.; Wood, A.W.; Newman, A.J.; Papalexiou, S.M. The Impact of Meteorological Forcing Uncertainty on Hydrological Modeling: A Global Analysis of Cryosphere Basins. Water Resour. Res. 2023, 59, e2022WR033767. [Google Scholar] [CrossRef]
- Houze, R.A. Orographic effects on precipitating clouds. Rev. Geophys. 2012, 50, RG1001. [Google Scholar] [CrossRef]
- Gorelick, N.; Hancher, M.; Dixon, M.; Ilyushchenko, S.; Thau, D.; Moore, R. Google Earth Engine: Planetary-scale geospatial analysis for everyone. Remote Sens. Environ. 2017, 202, 18–27. [Google Scholar] [CrossRef]
- Grasso, L.; Bikos, D.; Torres, J.; Dostalek, J.F.; Wu, T.C.; Forsythe, J.; Cronk, H.Q.; Seaman, C.J.; Miller, S.D.; Berndt, E.; et al. Satellite imagery and products of the 16–17 February 2020 Saharan Air Layer dust event over the eastern Atlantic: Impacts of water vapor on dust detection and morphology. Atmos. Meas. Tech. 2020, 13, 4033. [Google Scholar] [CrossRef]
- Lee, J.G.; Kim, Y.J. A Numerical Case Study Examining the Orographic Effect of the Taebaek Mountains on Snowfall Distribution over the Yeongdong Area. Atmosphere 2008, 18, 367–386. [Google Scholar]
- Nguyen, G.V.; Le, X.-H.; Van, L.N.; Jung, S.; Yeon, M.; Lee, G. Application of Random Forest Algorithm for Merging Multiple Satellite Precipitation Products across South Korea. Remote Sens. 2021, 13, 4033. [Google Scholar] [CrossRef]
- Cannon, A.J.; Sobie, S.R.; Murdock, T.Q. Bias Correction of GCM Precipitation by Quantile Mapping: How Well Do Methods Preserve Changes in Quantiles and Extremes? J. Clim. 2015, 28, 6938–6959. [Google Scholar] [CrossRef]
- Li, H.; Sheffield, J.; Wood, E.F. Bias correction of monthly precipitation and temperature fields from Intergovernmental Panel on Climate Change AR4 models using equidistant quantile matching. J. Geophys. Res. Atmos. 2010, 115, D10101. [Google Scholar] [CrossRef]
- Milewski, A.; Elkadiri, R.; Durham, M. Assessment and Comparison of TMPA Satellite Precipitation Products in Varying Climatic and Topographic Regimes in Morocco. Remote Sens. 2015, 7, 5697–5717. [Google Scholar] [CrossRef]
- Henn, B.; Newman, A.J.; Livneh, B.; Daly, C.; Lundquist, J.D. An assessment of differences in gridded precipitation datasets in complex terrain. J. Hydrol. 2018, 556, 1205–1219. [Google Scholar] [CrossRef]
- Tsai, C.-L.; Kim, K.; Liou, Y.-C.; Lee, G.; Yu, C.-K. Impacts of Topography on Airflow and Precipitation in the Pyeongchang Area Seen from Multiple-Doppler Radar Observations. Mon. Weather Rev. 2018, 146, 3401–3424. [Google Scholar] [CrossRef]
- Kim, J.; Yoon, D.; Cha, D.-H.; Choi, Y.; Kim, J.; Son, S.-W. Impacts of the East Asian Winter Monsoon and Local Sea Surface Temperature on Heavy Snowfall over the Yeongdong Region. J. Clim. 2019, 32, 6783–6802. [Google Scholar] [CrossRef]
- Breiman, L. Random Forests. Mach. Learn. 2001, 45, 5–32. [Google Scholar] [CrossRef]
- Deng, Y.; Wang, X.; Ruan, H.; Lin, J.; Chen, X.; Chen, Y.; Duan, W.; Deng, H. The magnitude and frequency of detected precipitation determine the accuracy performance of precipitation data sets in the high mountains of Asia. Sci. Rep. 2024, 14, 17251. [Google Scholar] [CrossRef]
- Saltikoff, E.; Lopez, P.; Taskinen, A.; Pulkkinen, S. Comparison of quantitative snowfall estimates from weather radar, rain gauges and a numerical weather prediction model. Boreal Environ. Res. 2015, 20, 667–678. [Google Scholar]
- Yin, Y.; Han, C.; Yang, G.; Huang, Y.; Liu, M.; Wang, X. Changes in the summer extreme precipitation in the Jianghuai plum rain area and their relationship with the intensity anomalies of the South Asian High. Atmos. Res. 2020, 236, 104793. [Google Scholar] [CrossRef]
- Hong, Y.; Gochis, D.; Cheng, J.-T.; Hsu, K.-L.; Sorooshian, S. Evaluation of PERSIANN-CCS Rainfall Measurement using the NAME Event Rain Gauge Network. J. Hydrometeorol. 2007, 8, 469–482. [Google Scholar] [CrossRef]
- Park, S.; Park, S.K.; Lee, J.W.; Park, Y. Geostatistical assessment of warm-season precipitation observations in Korea based on the composite precipitation and satellite water vapor data. Hydrol. Earth Syst. Sci. 2018, 22, 3435–3452. [Google Scholar] [CrossRef]
- Kim, K.; Bang, W.; Chang, E.C.; Tapiador, F.J.; Tsai, C.L.; Jung, E.; Lee, G. Impact of wind pattern and complex topography on snow microphysics during International Collaborative Experiment for PyeongChang 2018 Olympic and Paralympic Winter Games (ICE-POP 2018). Atmos. Chem. Phys. 2021, 21, 11955–11978. [Google Scholar] [CrossRef]


Disclaimer/Publisher’s Note: The statements, opinions and data contained in all publications are solely those of the individual author(s) and contributor(s) and not of MDPI and/or the editor(s). MDPI and/or the editor(s) disclaim responsibility for any injury to people or property resulting from any ideas, methods, instructions or products referred to in the content. |
© 2026 by the authors. Licensee MDPI, Basel, Switzerland. This article is an open access article distributed under the terms and conditions of the Creative Commons Attribution (CC BY) license.