Abstract
This study investigates flow resistance in thin water films on road surfaces during rainfall, which is essential for assessing aquaplaning risk. A one-dimensional surface runoff model based on the diffusion-wave approach is used to compare existing equations for the Darcy–Weisbach friction factor and Manning’s roughness coefficient. Laboratory data from three experimental cases support the analysis. The first case assesses the accuracy of existing equations and develops a new regression-based equation. The second case validates this new model for predicting water film thickness. Findings show that many existing equations poorly estimate water film thickness under high-intensity rainfall conditions relevant for aquaplaning analysis, often under- or overestimating it compared to measurements. Results indicate that flow resistance is mainly influenced by the Froude number, which is defined using the mean macro-texture depth of the pavement. The study emphasizes that accurate estimation of flow resistance parameters is critical in water film modelling, as it directly affects the reliability of traffic safety assessments.
1. Introduction
The thickness of the water film on a pavement surface strongly affects road safety and traffic performance [1]. When a thin sheet of water is present, a tire can become separated from the pavement, a phenomenon known as aquaplaning. Aquaplaning can occur in different forms depending on the water film thickness and vehicle speed. In addition to dynamic aquaplaning, which is associated with thicker water film and higher speeds, viscous aquaplaning may occur at very small water film depths, where hydrodynamic pressure develops within a thin fluid layer separating the tire from the pavement surface. While viscous aquaplaning is relevant for low-speed conditions and extremely thin films, the present study focuses primarily on dynamic aquaplaning scenarios, which are critical for traffic safety during intense rainfall events. Aquaplaning greatly increases the likelihood of traffic accidents [2,3,4]. Numerous statistical studies show that the presence of water is a principal factor in road crashes [5]. The latest World Health Organization Global Road Safety Status Report ranks traffic accidents as the eighth leading cause of death worldwide and identifies water on the roadway as a key contributing factor [5]. According to the U.S. Federal Highway Administration, more than 75% of weather-related crashes occur during rainfall, with wet pavement and rain being the most frequent weather-linked causes of accidents globally [6]. These statistics underline the need for further research and heightened attention to this problem.
Surface runoff in a thin water layer on pavement during rainfall is hydraulically complex, attracting considerable research interest. The presence of water sharply reduces the friction between tire and pavement, with the coefficient dropping to about 0.10 [1]. For example, when a vehicle travels at 20 km/h, the tire pavement contact area is essentially 100%. At 80 km/h, the contact is roughly 50%, and it continues to decline with speed; at 120 km/h, virtually no direct contact remains [1,7]. Figure 1 illustrates how the contact area diminishes as speed increases.
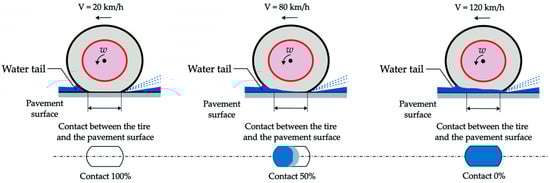
Figure 1.
Illustration of the tire pavement contact area [1,7].
Measuring the thickness of a thin surface water film requires specialised, costly instrumentation compared with conventional hydraulic measurements. Flow resistance in such films is strongly influenced by the pavement’s mean texture depth (micro and macro-texture), rainfall intensity, pavement slope, water viscosity, pavement temperature, the presence of contaminants such as oils and greases from vehicles, and assorted obstacles or debris on the surface [8]. Free surface resistance can be viewed as a shear stress that acts against gravity, slows the flow and therefore affects the film thickness [8,9]. In the case of the thin films, resistance is pronounced, and reliable estimation demands complex laboratory experiments because the film thicknesses are only a few millimeters, requiring specialised sensors. The fact that many researchers have proposed different resistance equations underscores how surface film hydraulics differ from pipe or open channel flow. Experimental studies have enabled the derivation of formulas for the Darcy–Weisbach friction factor and the Manning roughness coefficient. To apply any numerical model for predicting water film thickness on rain-wetted pavements, it is essential to estimate these thin film resistances accurately so that the model can represent film depth credibly. The impact of raindrops increases the flow resistance, with their values being higher compared to the resistances in open flows without the presence of rain. Through experimental investigation, Shen et al. this, finding that flow resistance increases with rising rainfall intensity. They established experimentally that the Darcy–Weisbach friction factor and the Manning roughness coefficient both increase at lower Reynolds numbers (below 1070) and for thin water films. As the water film thickness grows, the effect of raindrops on flow resistance is reduced [10,11].
This study aims to present the equations proposed for the calculation of the Darcy–Weisbach friction factor as well as Manning’s roughness coefficient in the linear flow model, and to examine how the choice of resistance estimation equations influences the calculation of the water film thickness. The validation of existing equations is based on available data from the literature, which include measurements of water film thickness resulting from rainfall. The experiments were conducted under laboratory conditions using artificial nozzles simulating rainfall, analysing surface flow on pavements with different textures set at appropriate slopes. The core objective of this work is to evaluate the existing resistance estimation equations against measured water film thickness along the pavement surface, and to propose a new resistance estimation equation derived through nonlinear regression analysis. The data for this analysis were sourced from literature where the existing resistance equations were previously validated, using experimental measurements from the laboratory for road research at the UK Department of Transport [12]. Based on the test case, a new equation for calculating the friction coefficient was proposed using a regression model, while the other two examples served to verify the proposed equation form. The first verification example was taken from the report, “Computational Analysis of Water Film Thickness During Rain Events for Assessing Hydroplaning Risk” by Lottes and Sitek [13,14]. The second verification example was drawn from the report, “The effects of rainfall intensity, pavement cross slope, surface texture, and drainage length on pavement water depths”, published by the Department of Transportation USA, Federal Highway Administration [15]. The dataset from the test case facilitated a detailed analysis of the key factors influencing hydraulic resistance under rainfall conditions, enabling their incorporation into a regression-based modelling framework. It was found that the mean texture depth (MTD), pavement slope (s), and Froude number (Fr) significantly influence water film thickness formation. The primary objective was to evaluate various functional forms of the friction factor equation in order to achieve optimal agreement with experimental observations. Through extensive testing of multiple formulations, a single equation was identified that provided the best fit to the measured water film thickness values. This proposed equation was subsequently validated using two independent experimental datasets to assess its reliability in predicting rainfall-induced surface resistance—specifically, its accuracy in reproducing measured water film thickness. The final formulation expresses the Darcy–Weisbach friction factor as a function of the Froude number (Fr), defined in terms of the flow velocity (u) and mean texture depth (MTD). This equation structure closely resembles that proposed by [9], which also employs the Froude number and includes the influence of pavement slope.
2. Literature Review
The thickness of the water film above the pavement texture affects aquaplaning, while the pavement surface itself influences the flow resistance of the thin water layer. In most cases, the factors governing friction are the materials used in the pavement structure, namely its micro and macrotexture (i.e., whether the surface is “smooth” or “rough”). Figure 2 schematically illustrates the interaction between pavement texture, surface slope, and water film thickness. Pavement slope also strongly affects runoff and, consequently, water film thickness [16]. Examining surface flow under rainfall, many researchers have conducted experiments with artificial nozzles. As early as 1977, Savat experimentally investigated thin film flow using such nozzles and proposed his own equation for estimating the friction coefficient for laminar flow at low Reynolds numbers [16]:
where λ is the Darcy–Weisbach friction factor, Re is the Reynolds number defined as Re = V∙h/ν, V is the mean flow velocity, h is the water depth and ν is the kinematic viscosity.
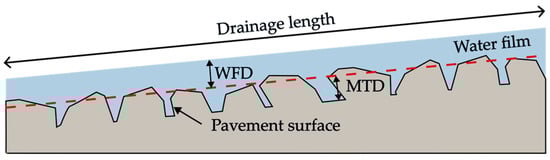
Figure 2.
Pavement texture appearance and water film depth over the pavement [17].
This experiment showed that for lower slopes, the effect of rain on the friction coefficient does not exceed 20%, while this effect decreases as the surface slope and Reynolds number increase [16]. Robertson et al. conducted more extensive research in an experiment where they analyzed runoff from impervious surfaces using artificial rainfall and examined the friction coefficient. During the experiment, they measured the water film thickness with a known flow rate and calculated the Reynolds number, based on which they proposed a relationship between the friction coefficient and Reynolds number using nonlinear regression in the following form [18]:
The obtained relationship had a high coefficient of determination (R2 > 0.75) and was analyzed for Reynolds numbers up to 10,000. In 1973, Shen and Li conducted experimental research and found that the friction coefficient is a function of rainfall intensity and Reynolds number for the case when Re < 900. The proposed relationship has the following form [19]:
In the equation, I represents the rainfall intensity. Some more recent research was conducted as part of A. Wolff, doctoral dissertation, where experimental investigations were carried out to examine and verify the parameters influencing the friction coefficient during flow over pavement surfaces. The research confirmed that the friction coefficient depends on the pavement slope and the Froude number, and proposed the following relationship [9,20]:
where s is the pavement slope and Fr is the Froude number, which in this study was defined based on the mean texture depth of the pavement [9,20]:
in Equation (5), u is the velocity component in the dominant flow direction.
Shen et al. conducted even more detailed experimental research in 2021 on the impact of raindrops on flow resistance in thin water layers. The experiment consisted of two phases: in the first variant, direct raindrop impacts on the surface were allowed, while in the second variant, a protective mesh was used to prevent raindrop impacts on the surface. The test surface was 6.0 m long and 0.25 m wide, with different rainfall intensities applied. The proposed equation without using the protective mesh has the following form [21]:
Similar experiments have also been carried out to estimate the Manning roughness coefficient in order to assess its influence on water film thickness. For thin sheet flow, Anderson et al. derived a relationship for estimating the Manning coefficient on Portland cement-based asphalt surfaces as a function of the Reynolds number, the relationship takes the following form [22]:
where n is the Manning roughness coefficient. Thin film flow is laminar in most cases. As the Reynolds number increases, the Manning coefficient decreases. Later, Charbeneau and colleagues (2007) proposed a slightly different equation expressed as a function of the Reynolds number [23]:
Using Equation (8) yields slightly higher values of the Manning roughness coefficient than Equation (7). A comparison of the two equations is presented in Figure 3 as a function of the Reynolds number.
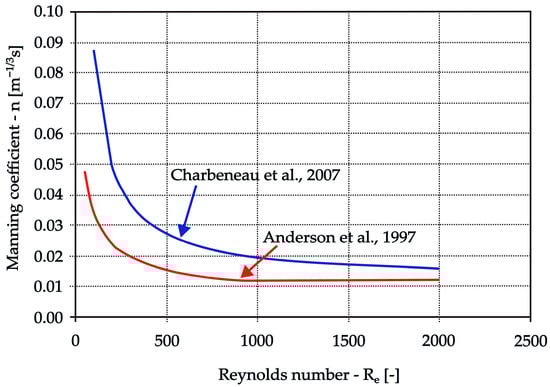
Figure 3.
Comparison of Manning roughness coefficient results according to Equations (7) and (8) [22,23].
With the development of the PAVDRN model for aquaplaning analysis, an equation was proposed for estimating the Manning roughness coefficient as a function of the Reynolds number (Dense-Graded Friction Courses—DGFC) [6]:
The Florida Department of Transportation (FDOT), in its report, proposed the following equation for estimating the Manning roughness coefficient as a function of pavement slope and Reynolds number [6]:
Shen and colleagues (2021), in their detailed investigations of the friction coefficient, also analysed the Manning roughness coefficient under the same experimental conditions and proposed an equation expressed as a function of rainfall intensity and Reynolds number [21]:
Later, in 2022, Chen and Wang developed a somewhat more complex equation for estimating the Manning roughness coefficient as a function of the mean texture depth of the pavement and the pavement slope, in the following form [24]:
Direct interaction between rainfall and rough pavement surfaces affects overall frictional resistance. Rainfall intensity certainly influences the friction coefficient, but the extent to which it does depends on pavement texture and the Reynolds number. Yoon and Wenzel and Shen and Li, reached similar conclusions, showing that on smooth surfaces rain increases the friction coefficient, leading to a thicker water film and reduced runoff velocity. They also found that the decisive factor is the rain is mass flux rather than its intensity alone. Katz et al. determined that at low Reynolds numbers (below 160), surface roughness strongly affects the friction coefficient and overland flow on pavements [23,25]. As the Reynolds number rises, Robertson et al. (1966) observed that roughness continues to influence flow but detected no significant rainfall effect [18,23]. Savat likewise confirmed that on smooth surfaces rain matters at shallow depths, but its influence diminishes as slope and thus runoff increases [18,23]. Through experiments and dimensional analysis, Nicosia et al. found the friction coefficient is highly sensitive to rainfall when the Reynolds number is below 2000 (laminar flow with thin films), whereas at higher Reynolds numbers (above 2000), the rainfall-induced friction effect becomes negligible (turbulent regime) [26]. They concluded that raindrop impact is significant for rainfall intensities exceeding a critical range of 31.75–92.25 mm/h. Since the work of Wolff, several studies have further investigated flow resistance in thin water films under rainfall conditions, primarily focusing on the effects of raindrop impact, rainfall intensity, surface roughness, and Reynolds number. Recent contributions include experimental and semi-empirical formulations accounting explicitly for rainfall intensity and raindrop momentum transfer [21,24,26]. However, many of these approaches introduce additional empirical parameters and are often tailored to specific experimental setups or pavement types. In contrast, Wolff’s formulation remains widely referenced due to its relatively simple structure and its explicit incorporation of pavement slope and Froude number, which enables straightforward implementation in numerical runoff models. This study builds upon these developments by reassessing existing formulations and proposing a simplified resistance equation that retains physical interpretability while improving predictive performance for high-intensity rainfall conditions relevant to aquaplaning analysis.
3. Description of the Numerical Model
The previously presented equations for estimating the friction coefficient and Manning roughness coefficient were analyzed within the linear flow model using the Saint-Venant equations, where the advective inertia term was omitted. In doing so, the linear flow model was adapted to the form known as the diffusive wave model [27,28]:
where, in Equations (13) and (14), the following symbols are used: x—spatial coordinate, t—time, A—cross-sectional area, Q—flow rate, I—rainfall intensity, Z—free surface level, g—gravitational acceleration, R—hydraulic radius, β—velocity non-uniformity coefficient in the cross-section, and n—Manning roughness coefficient.
The diffusive wave model considers only those terms related to the effects of friction, gravitational force in the flow direction, and pressure force. The mathematical model of the diffusive wave, adapted for flow conditions over a rigid pavement surface in the presence of rainfall, has the following form [29,30,31]:
The applicability of the diffusion-wave approximation was assessed through an order-of-magnitude scaling analysis of the governing terms in the Saint-Venant equations. For the investigated conditions, water film thicknesses were on the order of 10−3 m, while characteristic flow velocities were on the order of 10−2–10−1 m/s. Under these conditions, the local and convective acceleration terms are at least one order of magnitude smaller than the gravitational and friction terms. This is particularly valid for the relatively short pavement lengths (7.5–20 m) and slopes ranging from 0.5% to 8% considered in this study. Therefore, neglecting inertial terms and adopting the diffusion-wave approximation is justified for the thin-film flow conditions analyzed here. For the discretization of the equations of the diffusive wave mathematical model and the formation of the numerical model, a division into cross-sections using a staggered computational grid and an explicit numerical scheme is used in Figure 4 [32].
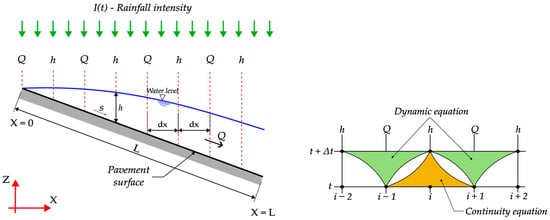
Figure 4.
Discretization scheme for calculation by cross-sections in the diffusive wave model.
By applying this numerical scheme, the discretized equations of the diffusive wave numerical model used for simulation are obtained [30,32,33]:
Based on the diffusion wave model, the result obtained is the water film thickness, calculated by subtracting the mean texture depth (MTD) of the pavement from the total water depth (WFD = h − MTD). The stability of the explicit numerical scheme of the diffusion wave model is governed by the Courant–Friedrichs–Lewy (CFL) stability condition, which is derived from Von-Neumann stability analysis [32]:
The CFL condition was evaluated using the minimum water film thicknesses encountered during the simulations, which represent the most restrictive stability criterion for the explicit scheme. Based on the characteristic flow velocities and spatial discretization (Δx = 0.10 m), the selected time step (Δt = 0.10 s) satisfied the CFL condition throughout the entire simulation domain and duration, ensuring numerical stability even under the shallowest flow conditions. The choice of relatively small spatial and temporal computational steps ensured numerical stability during the calculations. The values used were: ∆x = 0.10 m (spatial discretization) and ∆t = 0.10 s (time step).
A mesh sensitivity analysis was conducted to assess the influence of spatial discretization on the computed water film thickness. Simulations were repeated using a finer spatial step of Δx = 0.05 m, while keeping all other parameters unchanged. The resulting differences in water film thickness at the measurement locations were found to be negligible. Based on these results, the selected spatial discretization of Δx = 0.10 m was deemed sufficient to ensure mesh-independent results. In the applied examples, the following boundary conditions were used: Upstream boundary condition (at the beginning of the reach): the inflow is zero during the rainfall event Q(0, t) = 0. Downstream boundary condition (at the end of the reach): the outflow corresponds to the total flow generated by rainfall over the reach. This boundary is defined by assuming normal depth flow with free outfall at the downstream end. The assumption of normal depth at the downstream boundary is justified by the free outfall conditions applied in the laboratory experiments and the absence of downstream hydraulic controls. Given the relatively short pavement lengths (7.5–20 m), shallow flow depths, and uniform rainfall forcing, backwater effects were found to be negligible. Additional sensitivity tests using alternative downstream boundary conditions showed no noticeable influence on the computed water film thickness upstream of the outlet. The rainfall was of constant intensity, while the initial condition (at t = 0) assumed zero flow and zero water depth along the entire reach. These boundary and initial conditions correspond to those used in laboratory experiments reported in the literature.
4. Model Application
Following the previously presented equations and the numerical model for estimating resistance, model testing was carried out. The test case involved a paved surface with a total length of L = 20.0 m, placed under a slope of s = 2.5%. In this case, rolled asphalt was used, with a mean texture depth MTD = 0.60 mm. The rainfall intensity was constant throughout the experiment, with a value of I = 50 mm/h [12]. Measurements of water film thickness were conducted at four locations along the pavement: 5.0, 10.0, 15.0, and 20.0 m, with free outflow allowed at the downstream end of the surface [12].
The first example for verifying the equation was taken from the report “Computational Analysis of Water Film Thickness During Rain Events for Assessing Hydroplaning Risk”. The experiment was conducted on a pavement surface 7.50 m in length, with a variable slope ranging from 0.5% to 8.0% during the course of the experiment [13,14]. In this verification example, the rainfall intensity was I = 139.7 mm/h, the mean texture depth of the pavement was MTD = 0.50 mm, and the pavement slope was s = 4.0%. Rain simulation was carried out using a channel equipped with nozzles that sprayed water over the test surface. The applied rainfall intensities ranged from 12.7 mm/h to 152.4 mm/h during the experiment. Water film thickness was measured using point gauges with a metric scale and a vernier, enabling direct readings with a precision of 0.2 mm. At each of the four measurement locations, 1.5 m, 3.6 m, 5.4 m, and 7.2 m, five measurements were taken, and the average value was used as the representative water film thickness. Free outflow was allowed at the downstream end of the pavement.
The second example for equation verification was taken from the report, “The effects of rainfall intensity, pavement cross slope, surface texture, and drainage length on pavement water depths”, and in this study utilized hot-mix asphalt concrete with crushed siliceous gravel [15]. In the experiment, a rainfall intensity of I = 135.89 mm/h was applied. The mean texture depth of the pavement was MTD = 0.48 mm, and it was set at a slope of s = 3.0% over a total section length of 7.5 m. Free outflow from the pavement surface was permitted at the end of the section, and water film thickness measurements were taken at four points: 1.5 m, 3.6 m, 5.4 m, and 7.2 m. The examples used for equation verification are quite similar, with only minor differences in rainfall intensity and the mean texture depth of the pavement. In the second model verification example, the slope was reduced from 4.0% to 3.0%.
The mean texture depth (MTD) was not computed within the numerical model but was adopted directly from the experimental studies used as data sources. In all analyzed cases, MTD values were determined experimentally by the original authors using standardized pavement texture measurement methods. These reported values were used as fixed input parameters in the simulations, ensuring consistency with the experimental conditions under which water film thickness measurements were obtained.
In the applied examples, interpolation was performed between the measurement points in order to obtain a denser dataset and allow for more detailed visual comparison with the results computed by the model. However, the comparison between the model and measurements was conducted only at the four locations where actual measurements were available. For these points, it is useful to present the mean squared error (MSE) and the mean absolute percentage error (MAPE) for all resistance equations used in both the test case and the model verification example, to quantitatively assess model performance.
Mean squared error—MSE [30]:
Mean absolute percentage error—MAPE [30]:
5. Results and Discussion
Recent advances in water film thickness prediction increasingly rely on high-resolution numerical simulations and data-intensive approaches, including CFD-based models and machine learning techniques. While such methods may achieve high accuracy, they typically require detailed input data, extensive calibration, and significant computational resources. In contrast, the proposed Froude-based resistance formulation prioritizes physical interpretability, computational efficiency, and ease of implementation. By relying on a single dimensionless parameter, the model offers a transparent alternative that is particularly suitable for engineering applications where rapid assessment and numerical stability are essential. The previously presented equations from the literature review yield different estimates of water film thickness. For this reason, the selected test case was used to evaluate the performance of these equations within the diffusion wave model for estimating water film thickness. In this way, the accuracy of the proposed equations when implemented within the diffusion wave framework was assessed by comparing the computed results to the measured values. The results of this comparison are shown in Figure 5.
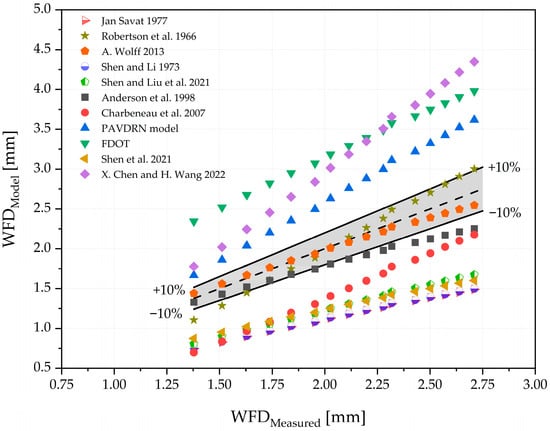
Figure 5.
Comparison of computed and measured water film thickness values for the test case [6,9,16,18,19,21,22,23,24].
In the previously shown figure, intervals of relative error of ±10% are also displayed. This is due to the fact that the water film thicknesses are relatively small and difficult to measure accurately, which naturally results in larger relative measurement errors. According to the presented equations, within the interval of −10% to 10% relative to the measurements, the best agreement is achieved with the friction coefficient Equation (4) by [9]. Slightly poorer agreement is observed with Equation (2) by Robertson et al. [18]. The equation by Anderson et al., (7) for estimating Manning’s roughness coefficient shows good agreement with measurements for water film thicknesses up to 2.0 mm, but larger deviations occur for greater thicknesses [22]. The equations by X. Chen and H. Wang, the PAVDRN model from FDOT, significantly overestimate the water film thickness, while the equations by Charbeneau et al., Shen and Liu et al., Shet et al., and Shen and Li tend to underestimate the water film thickness in this case [6,19,21,24]. The goodness of fit, expressed by the Mean squared error and mean absolute percentage error for the applied equations, is presented in the following table. The smallest deviations in terms of MAPE are observed for the equations by Robertson et al. and A. Wolff, both with errors less than 10%. All other equations exhibit deviations greater than 10%, with the largest MAPE value of 48.10% shown by the equation of X. Chen and H. Wang [9,18,24].
It should be noted that the resistance equations summarized in Table 1 were developed under different experimental and hydraulic conditions. Some formulations were derived for laminar sheet flow on smooth or slightly textured surfaces under rainfall (e.g., Savat, Shen and Li, while others were obtained for rough pavement surfaces or higher Reynolds number regimes (e.g., Robertson et al., Wolff, Chen and Wang) [9,10,16,18,24]. In addition, certain equations explicitly account for rainfall impact, whereas others were developed under steady inflow conditions without direct raindrop interaction. These differences in experimental setup and flow regime partially explain the variability in predicted water film thickness when the equations are applied within a unified numerical framework.

Table 1.
Model calibration results for the test case.
In the linear flow model used to estimate resistance, the Manning roughness coefficient was employed, which has a known relationship with the friction factor n = √(λ∙h1/3)/(8∙g). This relationship allowed the model to utilize equations for resistance estimation based on the friction factor. Applying the linear flow model and analyzing the previously discussed equations for resistance estimation, as well as the parameters influencing resistance in the test case verification, led to the conclusion that equations for estimating the friction factor yield better results for predicting water film thickness compared to equations for calculating the Manning roughness coefficient. It was observed that the calculation of water film thickness is most significantly influenced by the pavement slope (s), mean texture depth (MTD), and the Froude number (Fr). Based on these findings, further analysis was conducted, and a regression model was formed to develop a new equation for estimating the friction factor. Although the analysis indicated that pavement slope (s, mean texture depth (MTD), and the Froude number (Fr) all influence water film thickness, the regression analysis revealed strong interdependence between these variables. In particular, the Froude number inherently incorporates the combined effects of flow velocity and mean texture depth, while flow velocity itself is strongly controlled by pavement slope under rainfall-driven sheet flow conditions. When included simultaneously in the regression, slope and MTD did not provide statistically significant additional explanatory power once the Froude number was introduced. Consequently, these variables were excluded from the final formulation in order to avoid multicollinearity and to obtain a parsimonious model with clear physical interpretability. In this context, the exclusion of pavement slope from the final resistance formulation does not imply that its influence is neglected. The effect of slope is reflected through the flow velocity, which is directly controlled by gravitational forcing under rainfall-driven sheet flow conditions. Since the flow velocity enters the definition of the Froude number, the influence of pavement slope is implicitly incorporated within the proposed Fr-based model, consistent with the physical interpretation of Wolff’s formulation.
Based on parameters that correlate with the friction factor, several different regression models were analyzed to combine one or more parameters into an equation. The goal was to propose an equation with the fewest possible parameters while achieving the best agreement with measurements. Various combinations of proposed equations were explored to optimize model fit against experimental measurements. This approach follows the principle of model parsimony, favoring simpler formulations that retain the dominant physical mechanisms governing thin-film flow resistance. By applying a genetic algorithm to define equation parameters (constants) using the Generalized Reduced Gradient (GRG) nonlinear method, several forms were tested. The objective function used in the optimization procedure was the root mean squared error (RMSE) between the computed and measured water film thickness values at the measurement locations. The genetic algorithm was employed to explore the parameter space and identify suitable initial estimates, which were subsequently refined using the Generalized Reduced Gradient (GRG) nonlinear optimization method.
Equation (23) was derived using the experimental dataset from the test case, which served as the calibration dataset for the proposed resistance formulation. Several candidate functional forms were examined, incorporating combinations of pavement slope, mean texture depth, and flow-related parameters. The selection of the final equation form was guided by regression performance, physical interpretability, and model parsimony. A genetic algorithm was first applied to explore the parameter space and identify suitable initial estimates, followed by refinement using the Generalized Reduced Gradient (GRG) nonlinear optimization method. The objective function minimized during the calibration process was the root mean squared error (RMSE) between computed and measured water film thickness values. The remaining two experimental cases were not used in the derivation process and served exclusively for independent model validation. It was determined that the optimal equation form is a function of the Froude number (Fr):
The coefficient in Equation (23) is dimensionless, as the formulation is based on the Froude number, which is itself a dimensionless parameter. Consequently, the proposed equation is dimensionally consistent and applicable provided that the governing hydraulic variables are expressed in a consistent unit system. Although rainfall intensity does not explicitly appear in Equation (23), its influence is implicitly embedded through the flow velocity and water film thickness, which jointly define the Froude number. Under rainfall conditions, raindrop impact contributes additional momentum to the surface flow, increasing both local velocities and resistance effects. These processes are reflected in the resulting hydraulic response of the flow, particularly in the velocity field and film depth, which are directly involved in the calculation of the Froude number. Consequently, the proposed formulation accounts for the kinetic effects of rainfall indirectly, through their influence on the governing hydraulic variables rather than through an explicit rainfall intensity term.
The proposed model estimates flow resistance using only the Froude number, which is defined based on the mean pavement texture depth and the flow velocity in the direction of motion (Equation (5)). The velocity of water flow during rainfall inherently depends on rainfall intensity, pavement slope, and mean texture depth. This leads to the conclusion that all these influencing factors are captured through the Froude number. Although a formal global sensitivity analysis was not performed, the influence of key parameters such as pavement slope, mean texture depth, and rainfall intensity is implicitly reflected through their combined effect on flow velocity and water film thickness, which together define the Froude number. The proposed formulation therefore captures parameter sensitivity in an integrated manner rather than through explicit independent variables. A dedicated quantitative sensitivity analysis aimed at isolating the individual contribution of each parameter represents an important direction for future research. In practical terms, this means that as resistance increases, the thickness of the water film and the runoff velocity also increase. For this formulated model, the results for the test case are presented in Figure 6, together with the equations proposed by Anderson et al. and A. Wolff [9,22]. The figure demonstrates that the developed model shows good agreement with measurements, and the obtained water film thickness results track the measured data well. The equation by Anderson et al. yields somewhat lower water film thickness values across the analyzed section for which measurements are available [22]. The equation by A. Wolff provides better results than Anderson et al., is equation, with the model tracking measurements well in the 5.0 to 10.0 m range [9,22]. However, for the remainder of the section beyond 10.0 m, it deviates from the measured values, with differences in water film thickness reaching approximately 0.21 mm at the end of the section.
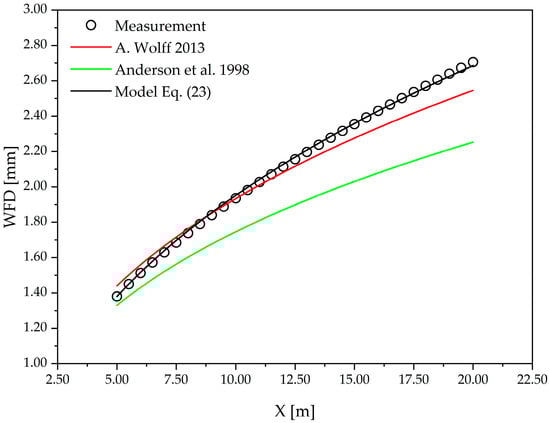
Figure 6.
Calibration of the proposed resistance model: comparison of measured and computed water film thicknesses for the test case [9,22].
For a test case, we also performed verification using two additional examples [13,14,15]. These verification examples employed a shorter pavement section, also with four measurement points. While similar, a key difference between them was the pavement slope. Compared to the test case, the verification examples featured higher rainfall intensities and steeper pavement slopes, but a smaller mean texture depth. These verification examples aim to confirm the proposed resistance equation, enabling the 1D model to yield more accurate water film thickness calculations. The results for the first model verification example are presented in the Figure 7.
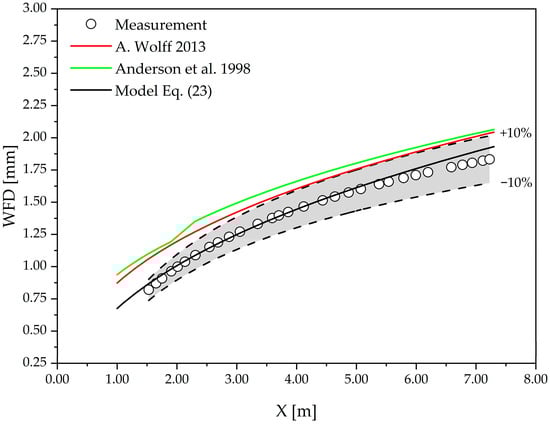
Figure 7.
Computational and measured water film thicknesses in the first verification example [9,22].
The proposed model in the first verification example closely follows the measured data on water film thickness along the entire road segment, with results falling within a ±10% margin. The equations by Anderson et al. and A. Wolff yield similar results but overestimate the water film thickness by approximately 0.20 mm. In this case, the deviation exceeds 10%, placing these models outside the acceptable error range. The results of the mean square error (MSE) and mean absolute percentage error (MAPE) are presented in the Table 2.
Table 2.
Comparison of measured and computed water film thicknesses for the first verification example.
The very low MAPE value obtained for the proposed model in the first verification example should be interpreted in the context of controlled laboratory conditions and a relatively narrow range of hydraulic regimes. The experimental data used for verification correspond to a limited range of Froude numbers and uniform surface characteristics, which reduces variability and may result in lower error metrics. Therefore, while the low MAPE indicates excellent agreement within the investigated regime, it also suggests that the proposed model is currently most reliable within the range of flow conditions represented by the available experimental data. Additional experimental validation across a wider range of pavement textures, slopes, and rainfall intensities is required to further assess the model’s general applicability. The influence of fluid viscosity through temperature variations was not explicitly accounted for in the proposed resistance formulation. The experimental datasets used in this study were obtained under controlled laboratory conditions, typically corresponding to standard water temperatures. Under the investigated thin-film, rainfall-driven flow conditions, the dominant controlling mechanism is represented by the Froude number, while viscosity effects play a secondary role. Nevertheless, variations in water temperature, particularly under near-freezing conditions, may influence flow resistance and water film formation. Incorporating explicit viscosity or Reynolds number effects represents a potential direction for future model development and experimental validation. Regarding the results from the proposed model at the measurement points, the mean absolute percentage error is smallest for our proposed model, at 0.738%. In comparison to the measurements, the Anderson et al. equation has an 11.0% mean absolute percentage error, while the A. Wolff, equation shows a slightly lower error of 3.4% [9,22]. In the second verification example, the proposed model continues to show good agreement with measurements compared to both the Anderson et al. and A. Wolff equations [9,22].
In this example, the proposed model follows the measured data within a ±10% range, with the best agreement observed along the first half of the road segment. At the end of the segment, some deviation from the measured water film thickness values is present; however, the deviation remains below 10%. In this case, the mean absolute percentage error (MAPE) is 7.95%. Good agreement was also observed with the model by A. Wolff, which shows deviations greater than 10% at the beginning of the segment (up to 2.50 m), but exhibits improved accuracy along the second half, with deviations around 10% (MAPE = 9.96%). The equation by Anderson et al. on the other hand, overestimates the water film thickness values throughout this case, resulting in deviations greater than 10% (MAPE = 15.42%). As in the previous example, the mean square error (MSE) and mean absolute percentage error (MAPE) were calculated, and the results are presented in the following table. It should be emphasized that the observed limitations of several existing resistance equations primarily refer to high-intensity rainfall events investigated in this study. Under lower rainfall intensities, some classical formulations may still provide acceptable estimates of water film thickness. The results for the second model verification example are presented in Figure 8, while a comparison of measured and computed water film thicknesses is given in Table 3.
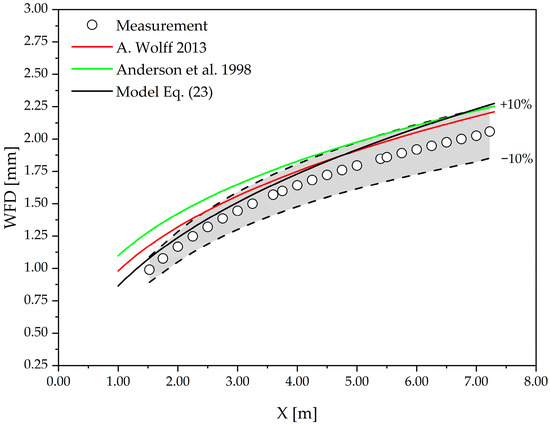
Figure 8.
Computational and measured water film thicknesses in the second verification example [9,21].
Table 3.
Comparison of measured and computed water film thicknesses for the second verification example.
High-resolution CFD simulations can provide detailed insight into thin-film flow dynamics; however, their application to large-scale or real-time pavement assessment is often limited by computational cost and data requirements. The present study does not aim to compete with such approaches in terms of physical detail, but rather to offer a simplified yet reliable alternative suitable for numerical runoff models and practical engineering assessments.
6. Conclusions
This study investigates the estimation of surface resistance on road pavements under thin water film conditions caused by rainfall and analyzes existing equations for estimating the Darcy–Weisbach friction factor and Manning’s roughness coefficient. The results were validated using a sheet flow model based on case studies from the literature, where water film thickness on the pavement was measured under laboratory conditions. The analysis of existing equations revealed that, out of all the equations presented in the literature and examined in this study, only two provided acceptable estimates of water film thickness—those proposed by Anderson et al. and A. Wolff. Among the considered resistance estimation approaches, equations for the friction factor yielded better agreement with measured water film thickness compared to those using Manning’s roughness coefficient. Based on this observation, a new empirical equation for estimating the friction factor was proposed using a regression model developed from test case data. The analysis showed that the Froude number, defined in this study as a function of mean texture depth (MTD) and flow velocity, had the most significant influence on the friction factor. It should be noted that these conclusions primarily apply to high-intensity rainfall conditions examined in this study, which are most critical for aquaplaning risk assessment. The performance of existing equations under low to moderate rainfall intensities was not the primary focus of the analysis. Once the regression model was established and the functional form of the equation defined, the proposed resistance model was validated using two case studies to evaluate its reliability for estimating water film thickness under rainfall in sheet flow simulations. In both verification examples, the proposed resistance equation showed good agreement with measured water film thickness. In the first case, the proposed equation remained entirely within the ±10% error margin, achieving a mean absolute percentage error (MAPE) of only 0.738%. In the second case, the agreement was still within the ±10% range, with a slightly higher MAPE of 7.95%. However, the verification cases used in this study are based on limited measurement data, with no clearly reported measurement error. The lack of adequate measurement equipment and experimental studies highlights the need for further testing and verification of the proposed model. The present analysis is limited to laboratory conditions and a specific range of slopes and pavement textures. The behavior of the proposed formulation under extreme rainfall intensities, steep slopes, or specialized pavement materials was not investigated and represents an important topic for future research. Future research should focus on conducting additional experiments to validate the model across a wider range of scenarios.
Author Contributions
Conceptualization, P.P. and N.J.; methodology, N.J.; software, P.P.; validation, P.P. and N.J.; formal analysis, P.P.; investigation, N.J.; resources, P.P.; data curation, P.P.; writing—original draft preparation, P.P.; writing—review and editing, N.J.; visualization, P.P.; supervision, N.J. All authors have read and agreed to the published version of the manuscript.
Funding
This research received no external funding.
Data Availability Statement
Data are contained within the article.
Conflicts of Interest
The authors declare no conflicts of interest.
References
- Burlacu, A.F.; Racanel, C.; Burlacu, A. Preventing aquaplaning phenomenon through technical solutions. Gradjevinar 2018, 70, 1057–1064. [Google Scholar] [CrossRef]
- Do, M.-T.; Cerezo, V.; Beautru, Y.; Kane, M. Modeling of the connection road surface microtexture/water depth/friction. Wear 2013, 302, 1426–1435. [Google Scholar] [CrossRef]
- Peng, J.; Chu, L.; Fwa, T.F. Determination of safe vehicle speeds on wet horizontal pavement curves. Road Mater. Pavement Des. 2021, 22, 2641–2653. [Google Scholar] [CrossRef]
- Xiao, K.; Hui, B.; Qu, X.; Wang, H.; Diab, A.; Cao, M. Asphalt pavement water film thickness detection and prediction model: A review. J. Traffic Transp. Eng. (Engl. Ed.) 2023, 10, 349–367. [Google Scholar] [CrossRef]
- Chen, S.; Liu, X.; Luo, H.; Yu, J.; Chen, F.; Zhang, Y.; Ma, T.; Huang, X. A state-of-the-art review of asphalt pavement surface texture and its measurement techniques. J. Road Eng. 2022, 2, 156–180. [Google Scholar] [CrossRef]
- Lee, H.S.; Carvajal, M.; Holzschuher, C.; Choubane, B. Florida Department of Transportation’s Enhanced Hydroplaning Prediction Tool. Transp. Res. Rec. J. Transp. Res. Board 2020, 2675, 340–352. [Google Scholar] [CrossRef]
- Lippold, C.; Vetters, A.; Ressel, W.; Alber, S. Vermeidung von Abflussschwachen Zonen in Verwindungsbereichen—Vergleich und Bewertung von Baulichen Lösungen; BASt Report V319; Bundesanstalt für Straßenwesen (BASt): Bergisch Gladbach, Germany, 2019; ISBN 978-3-95606-463-0.
- Huebner, R.S.; Anderson, D.A.; Warner, J.C.; Reed, J.R. PAVDRN: Computer model for predicting water film thickness and potential for hydroplaning on new and reconditioned pavements. Transp. Res. Rec. 1997, 1599, 128–131. [Google Scholar] [CrossRef]
- Wolff, A. Simulation of Pavement Surface Runoff Using the Depth-Averaged Shallow Water Equations. Ph.D. Thesis, University of Stuttgart, Stuttgart, Germany, 2013. [Google Scholar]
- Shen, E.; Liu, G.; Xia, X.; Dan, C.; Zheng, F.; Zhang, Q.; Zhang, Y.; Guo, Z. Resistance to Sheet Flow Induced by Raindrop Impact on Rough Surfaces. Catena 2023, 231, 107272. [Google Scholar] [CrossRef]
- Li, C.; Hao, J.; Zhang, G.; Fang, H.; Wang, Y.; Lu, H. Estimating Manning’s Coefficient n for Sheet Flow During Rainfall Events on Rough Pavement Surfaces. Catena 2023, 230, 107184. [Google Scholar] [CrossRef]
- Russam, K.; Ross, N.F. The Depth of Rain Water on Road Surfaces; Report No. LR 236; Climate and Environment Section Road Research Laboratory Crowthorne: Berkshire, UK, 1968. [Google Scholar]
- Lottes, S.A.; Sitek, M.A. Computational Analysis of Water Film Thickness During Rain Events for Assessing Hydroplaning Risk. Part 1. Nearly Smooth Road Surfaces; Argonne National Lab. (ANL): Argonne, IL, USA, 2020.
- Lottes, S.A.; Sitek, M.A. Computational Analysis of Water Film Thickness During Rain Events for Assessing Hydroplaning Risk. Part 2. Rough Road Surfaces; Argonne National Lab. (ANL): Argonne, IL, USA, 2020.
- Gallaway, B.M.; Schiller, R.E.J.; Rose, J.G. The Effects of Rainfall Intensity, Pavement Cross Slope, Surface Texture, and Drainage Length on Pavement Water Depths; Texas Transportation Institute and the Texas Highway Department: College Station, TX, USA, 1971; Volume 6, pp. 1–86. [Google Scholar]
- Savat, J. Hydraulics of Sheet Flow on a Smooth Surface and the Effect of Simulated Rainfall. Earth Surf. Process. 1977, 2, 125–140. [Google Scholar] [CrossRef]
- Pourhassan, A.; Gheni, A.A.; ElGawady, M.A. Water Film Depth Prediction Model for Highly Textured Pavement Surface Drainage. Transp. Res. Rec. 2022, 2676, 100–117. [Google Scholar] [CrossRef]
- Robertson, A.F.; Turner, A.K.; Crow, F.R.; Ree, W.O. Runoff from Impervious Surfaces Under Conditions of Simulated Rainfall. Trans. ASAE 1966, 9, 343–346. [Google Scholar] [CrossRef]
- Shen, H.W.; Li, R.-M. Rainfall effect on sheet flow over smooth surface. J. Hydraul. Div. ASCE 1973, 99, 771–792. [Google Scholar] [CrossRef]
- Ressel, W.; Wolff, A.; Alber, S.; Rucker, I. Modelling and simulation of pavement drainage. Int. J. Pavement Eng. 2019, 20, 801–810. [Google Scholar] [CrossRef]
- Shen, E.; Liu, G.; Jia, Y.; Dan, C.; Elbasit, M.A.A.; Liu, C.; Gu, J.; Shi, H. Effects of raindrop impact on the resistance characteristics of sheet flow. J. Hydrol. 2021, 592, 125767. [Google Scholar] [CrossRef]
- Anderson, D.A.; Huebner, R.S.; Reed, J.R.; Warner, J.C.; Henry, J.J. Improved Surface Drainage of Pavements; NCHRP Web Document No. 16. National Cooperative Highway Research Program; Transportation Research Board: Washington, DC, USA, 1997; Volume 16. [Google Scholar]
- Charbeneau, R.J.; Jeong, J.; Barrett, M.E. Highway Drainage at Superelevation Transitions; Center for Transportation Research, The University of Texas at Austin: Austin, TX, USA, 2008; Volume 1, 180p. [Google Scholar]
- Chen, X.; Wang, H. Analysis and mitigation of hydroplaning risk considering spatial-temporal water condition on the pavement surface. Int. J. Pavement Eng. 2022, 24, 2036988. [Google Scholar] [CrossRef]
- Katz, D.M.; Watts, F.J.; Burroughs, E.R. Effects of Surface Roughness and Rainfall Impact on Overland Flow. J. Hydraul. Eng. 1995, 121, 546–553. [Google Scholar] [CrossRef]
- Nicosia, A.; Di Stefano, C.; Palmeri, V.; Pampalone, V.; Ferro, V. Flow resistance of overland flow on a smooth bed under simulated rainfall. Catena 2020, 187, 104351. [Google Scholar] [CrossRef]
- Akan, A.O. Open Channel Hydraulics; Butterworth-Heinemann; Elsevier: Oxford, UK, 2006; ISBN 978-0-7506-6857-6. [Google Scholar]
- Chaudhry, M.H. Open-Channel Flow, 2nd ed.; Springer: New York, NY, USA, 2008. [Google Scholar]
- Kazezyılmaz-Alhan, C.M.; Medina, M.A.; Rao, P. On numerical modeling of overland flow. Appl. Math. Comput. 2005, 166, 724–740. [Google Scholar] [CrossRef]
- Szymkiewicz, R. Numerical Modeling in Open Channel Hydraulics; Water Science and Technology Library; Springer: Dordrecht, The Netherlands, 2010; Volume 83. [Google Scholar] [CrossRef]
- Vieira, J. Conditions governing the use of approximations for the Saint-Vénant equations for shallow surface water flow. J. Hydrol. 1983, 60, 43–58. [Google Scholar] [CrossRef]
- Crossley, A.J. Accurate and Efficient Numerical Solutions for the Saint Venant Equations of Open Channel Flow. Ph.D. Thesis, University of Nottingham, Nottingham, UK, October 1999. [Google Scholar]
- Roberts, S.G. Numerical Solution of Conservation Laws Applied to the Shallow Water Wave Equations; Mathematical Sciences Institute, Australian National University: Canberra, Australia, 4 January 2013. [Google Scholar]


Disclaimer/Publisher’s Note: The statements, opinions and data contained in all publications are solely those of the individual author(s) and contributor(s) and not of MDPI and/or the editor(s). MDPI and/or the editor(s) disclaim responsibility for any injury to people or property resulting from any ideas, methods, instructions or products referred to in the content. |
© 2026 by the authors. Licensee MDPI, Basel, Switzerland. This article is an open access article distributed under the terms and conditions of the Creative Commons Attribution (CC BY) license.