


Abstract
Predicting algal proliferation in freshwater systems is crucial for effective water quality management and ecological sustainability. This study proposes a novel data-driven framework that integrates correlation-based feature ranking with a concatenation-enhanced artificial neural network (ANN) architecture to improve algae prediction accuracy. The analysis was conducted through a systematic evaluation of parameter relationships, employing Pearson’s correlation coefficient and standardized coefficients (Beta) to determine feature importance. Based on the magnitude of these coefficients, the input variables were progressively grouped into six feature sets, enabling a comparative assessment of predictive performance. The ANN models were trained and validated using root mean squared error (RMSE), mean absolute error (MAE) and Normalized Nash–Sutcliffe Efficiency (NNSE) as evaluation metrics. The results demonstrate that the fourth feature set, including chlorophyll-a, temperature, dissolved oxygen, total dissolved solids, and ammonia (NH3), identified through combined Pearson and Beta analysis, achieved the lowest prediction errors and superior generalization performance. These findings highlight the effectiveness of feature selection guided by correlation and standardized coefficients in enhancing ANN performance for algae prediction. The proposed framework offers valuable insights for improving the predictive modeling of algal dynamics, thereby supporting proactive water quality monitoring and the sustainable management of aquatic ecosystems.
1. Introduction
Harmful algal blooms (HABs), which result from lake eutrophication, have emerged as one of the most serious global environmental challenges, exerting significant ecological, economic, and public health impacts [1]. When HABs occur, they tend to accumulate in nearshore zones, where secondary environmental hazards such as algal toxin release and the formation of black water masses, can further degrade water quality and threaten aquatic life [2,3]. Complex interactions among multiple environmental variables typically govern the formation and persistence of HABs [4]. Eutrophication, primarily driven by excessive nutrient loading of nitrogen and phosphorus, remains one of the dominant factors, alongside climatic and hydrological variability [5,6]. Therefore, the timely monitoring and prediction of HABs are crucial for the effective management of aquatic ecosystems and the sustainable protection of freshwater resources [7]. Traditional monitoring approaches rely on in situ sampling and laboratory analysis of key water quality indicators, such as chlorophyll a (Chl-a), dissolved oxygen (DO), and total phosphorus (TP). While these methods provide reliable measurements, they are inherently limited by high operational costs, low temporal frequency, and insufficient spatial coverage [8,9,10]. To overcome these limitations, recent advances have incorporated remote sensing technologies, Internet of Things (IoT)-based monitoring systems, and the integration of meteorological data to provide more comprehensive and continuous observations of aquatic environments. Early remote sensing studies largely relied on moderate-resolution sensors such as MODIS; however, recent developments in satellite technology have significantly enhanced the capability to monitor HAB dynamics. In particular, the Sentinel-3 Ocean and Land Color Imager (OLCI) offers improved spectral resolution and higher sensitivity to optically active water constituents, enabling more accurate detection of chlorophyll-a and bloom-related proxies. For instance, Joshi et al. [11] used Sentinel-3 OLCI imagery in conjunction with a Random Forest (RF) model to predict multiple HAB proxies, demonstrating that chlorophyll-a achieved the highest predictive accuracy and showed strong correlations with other bloom indicators, such as microcystin and Secchi depth. Similarly, Jia et al. [12] integrated OLCI-derived chlorophyll-a with Cyclone Global Navigation Satellite System (GNSS-R) reflectivity and ERA5-Land meteorological data, achieving high classification accuracy (95.5%) for bloom severity. These studies highlight the growing importance of advanced optical and multi-source remote sensing systems in overcoming the spatial and temporal limitations of traditional monitoring approaches, particularly under conditions of cloud cover and dynamic environmental variability.
In parallel with advancements in sensing technologies, data-driven machine learning (ML) approaches have gained increasing attention for HAB prediction due to their ability to model the complex, nonlinear relationships inherent in environmental systems [13]. Yi et al. [14] developed an Extreme Learning Machine (ELM) framework for chlorophyll-a prediction, in which their ELM2 model demonstrated superior accuracy relative to linear regression, backpropagation neural networks, and the Adaptive Neuro-Fuzzy Inference System (ANFIS). Specifically, the ELM2 model achieved higher correlation coefficients (R) and lower root mean square errors (RMSE) than the comparative models. Heddam et al. [15] further showed that integrating signal decomposition techniques with ML models such as Random Forest Regression (RFR) and Artificial Neural Networks (ANNs) enhances predictive performance for cyanobacterial concentrations. Izadi et al. [16] employed spatio-temporal ML models using satellite-derived inputs, where XGBoost achieved superior forecasting accuracy for HAB occurrences up to eight days in advance. Additional studies have explored alternative data modalities, including image-based ML approaches for microalgae monitoring [17] and environmental factor-driven modeling of algal growth dynamics [18]. Furthermore, Abdullah et al. [19] emphasized the importance of integrating IoT-based sensing systems with advanced ML and deep learning frameworks to develop comprehensive end-to-end HAB prediction systems.
Among ML techniques, ANNs have demonstrated strong potential for modeling nonlinear environmental processes due to their adaptive learning capabilities and flexibility in handling heterogeneous datasets [20]. Wei et al. [21] successfully applied ANN models to predict algal bloom dynamics in Lake Kasumigaura, capturing temporal variations in multiple algal species. A comprehensive review by Paturi et al. [22] further highlighted that multilayer perceptron (MLP)-based ANN models are widely used in HAB prediction, particularly for chlorophyll-a estimation. However, despite their effectiveness, several challenges remain, including limited interpretability, sensitivity to data quality, and difficulties in generalizing models across different geographical regions.
Despite the progress achieved in both remote sensing and machine learning-based HAB prediction, existing studies often treat feature selection, model architecture, and data integration as separate processes. Moreover, many ANN-based approaches rely on conventional architectures that may not fully exploit the hierarchical and multi-level relationships among environmental variables. To address these limitations, this study proposes a novel concatenate-based ANN architecture for predicting HAB occurrences in Midmar Dam, South Africa. The proposed framework integrates systematic feature selection based on Pearson correlation and standardized coefficients (Beta) with an enhanced network structure designed to capture complex feature interactions. The primary objectives are to identify the most influential physicochemical drivers of algal blooms and to improve predictive performance through architectural innovation and optimized feature representation.
Existing HAB prediction approaches can broadly be categorized into process-based and data-driven models [23,24]. Process-based models rely on a mechanistic understanding of ecological and physicochemical processes but are often constrained by system complexity and parameter uncertainty [25,26]. In contrast, data-driven models leverage observed data to uncover nonlinear patterns and provide robust predictive capabilities [27]. Building upon these advances, the present study contributes a hybrid perspective by combining data-driven feature selection with a novel ANN architecture, thereby enhancing both predictive accuracy and interpretability of HAB dynamics.
The rest of this paper is organized as follows: Section 2 presents the study area, dataset characteristics, and preprocessing techniques, followed by a detailed explanation of the proposed concatenate-based ANN model, including its architecture, parameter tuning, and performance evaluation metrics. Section 3 presents the experimental results, which include descriptive statistical analysis, correlation assessment, feature importance ranking, and a comparative evaluation of prediction performance across different feature sets. Finally, Section 4 concludes the study by summarizing the main findings, highlighting the practical implications for predicting HABs and managing water quality, and proposing future research directions to enhance model generalization and scalability.
2. Materials and Methods
2.1. Study Area and Data
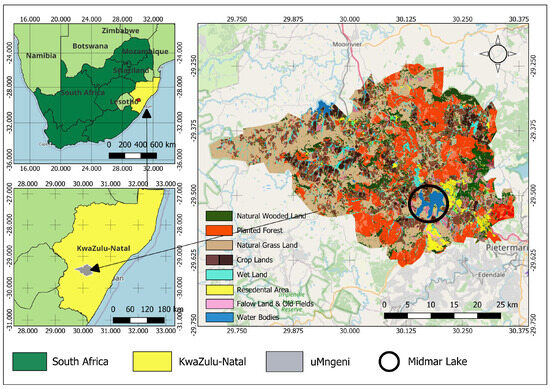
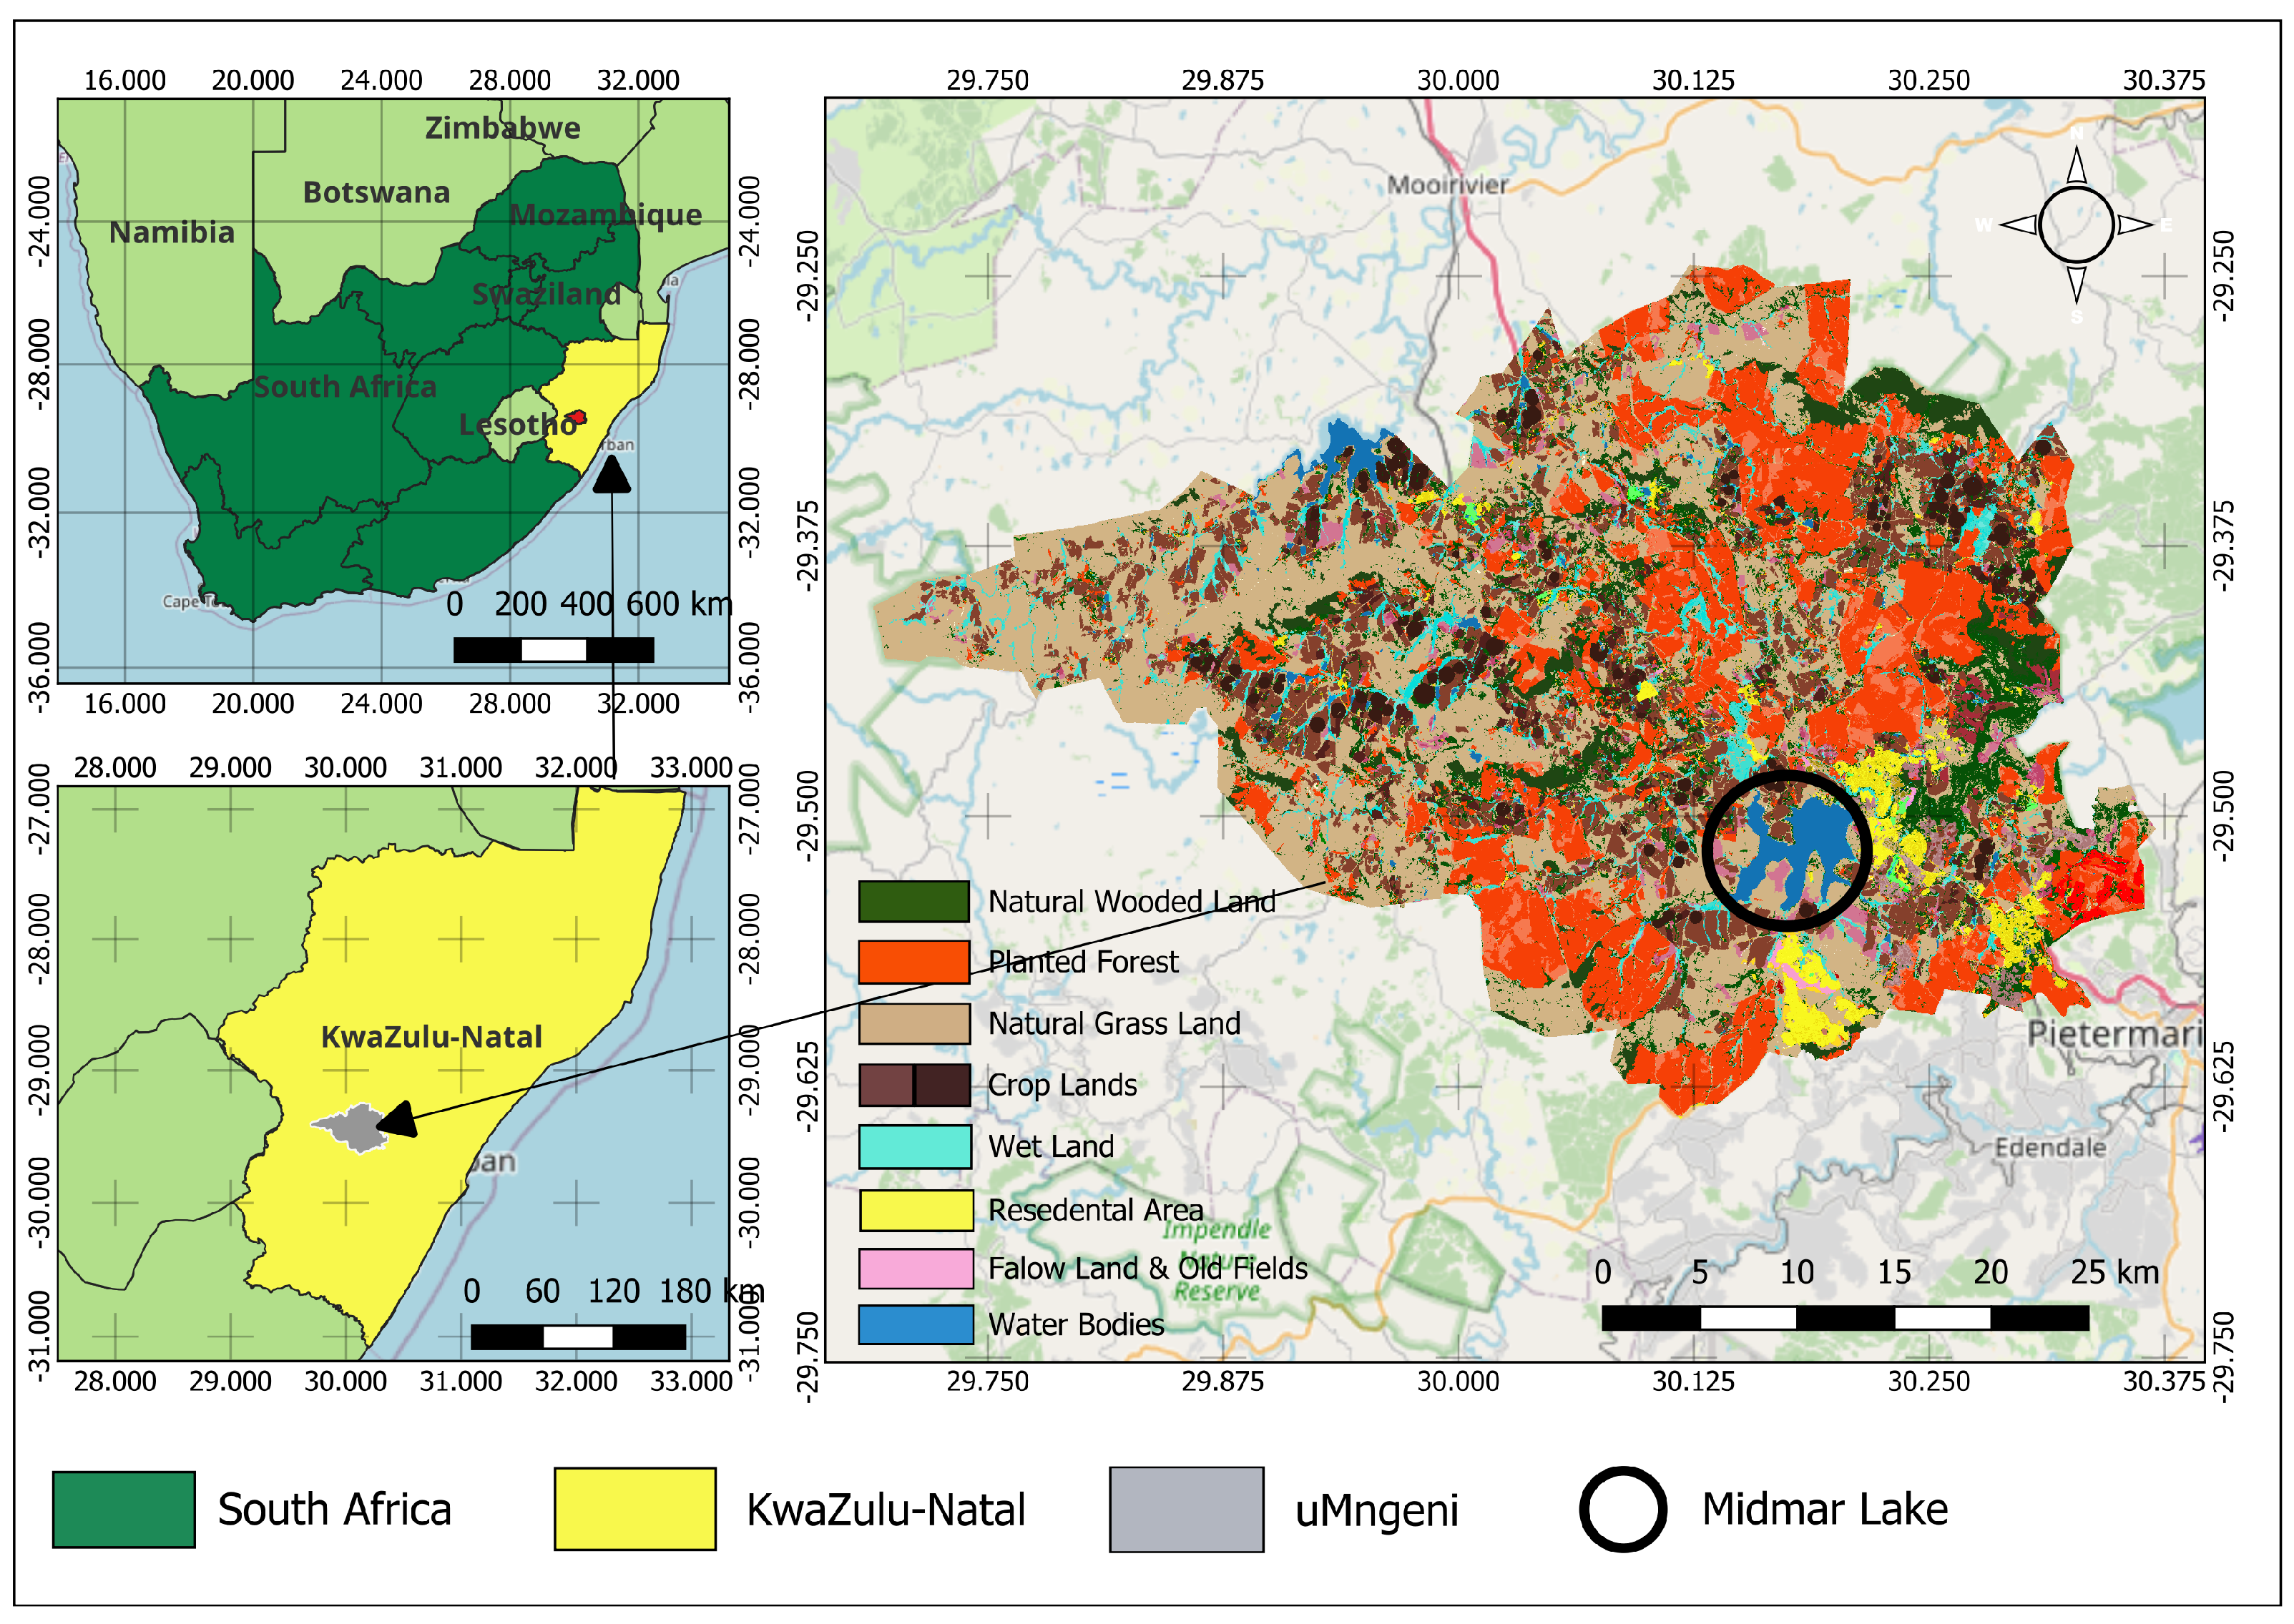
This study was conducted at Midmar Dam, a primary freshwater reservoir situated in the upper uMngeni River catchment near the towns of Howick and Pietermaritzburg in KwaZulu-Natal Province, South Africa. The dam plays a critical role in regional water supply, supporting domestic, industrial, and agricultural demands across the uMngeni Water Management Area. Structurally, Midmar Dam is a hybrid system that integrates both gravity and earth-fill construction, forming a stable and efficient water storage facility within a broad, topographically varied valley. The uMngeni River serves as the dam’s principal tributary, contributing an estimated mean annual runoff of approximately 158.5 million cubic meters of water [28]. The geographical location of Midmar Dam is illustrated in Figure 1.
Figure 1.
Study area.
Water quality monitoring at Midmar Dam follows an established programme with daily, weekly, or monthly sampling frequencies depending on the parameter. Sampling was conducted near the dam wall using a boat (Explorer 510, Motor Yamaha 85 hp) and standard field equipment (Aquaread, Water Quality instruments, Kent, UK). To capture vertical variability, discrete depth samples were collected at multiple levels (e.g., 2 m, 4 m, and deeper intervals up to 22 m) using a depth sampler that isolates water at the target depth. Additionally, a 4 m integrated sampler was used to obtain composite samples representing averaged conditions from the surface to approximately 8 m depth. On-site measurements of dissolved oxygen (DO), pH, and temperature were taken using a calibrated multiparameter probe at 2-m intervals throughout the water column. Each measurement was accompanied by metadata including sampling depth, dam level, coordinates, elevation, and time. Samples intended for laboratory analysis were collected in appropriate plastic or glass containers (0.5–5 L), stored in cooler boxes to preserve integrity, and transported to the laboratory for microbiological and chemical assessment. The dataset spans a 20-year period (2004–2024) and includes routinely monitored physicochemical and microbiological variables. The parameters used in this study include Algae, chlorophyll a, conductivity, dissolved oxygen (DO), pH, temperature, fluoride (F), nitrate (NO3), total dissolved solids (TDS), ammonia (NH3), hardness, iron (Fe), turbidity, and alkalinity. Together, these variables provide a comprehensive representation of the environmental conditions influencing harmful algal bloom (HAB) dynamics in Midmar Dam.
2.2. Data Preprocessing
Effective preprocessing of raw environmental data is a fundamental prerequisite for constructing reliable predictive models, as it ensures data integrity, consistency, and comparability across diverse variables [29]. In this study, the dataset obtained from Midmar Dam comprised physicochemical and microbiological parameters. Given the long-term and heterogeneous nature of the dataset, a series of preprocessing procedures was implemented to enhance data quality and prepare it for model training and evaluation. First, parameters with insufficient sampling frequency were excluded from the analysis to avoid potential biases and instability in the predictive models. Second, the dataset was examined for missing values, which were subsequently imputed using the K-Nearest Neighbors (KNNImputer) algorithm. Unlike conventional methods such as mean or median substitution, the KNNImputer algorithm estimates missing values based on the Euclidean distance between neighboring data points, thereby leveraging multivariate relationships within the dataset [30]. This technique preserves the intrinsic data structure, minimizes information loss, and enhances the robustness of subsequent modeling steps. Third, to address dimensional inconsistencies among the predictors, all features were standardized using Z-score normalization. Standardization transforms each feature such that it has a mean of zero and a standard deviation of one, ensuring that all parameters contribute equally to the model regardless of their original measurement units. This transformation also mitigates the influence of residual outliers and improves numerical stability during model optimization. Mathematically, let denote the feature space composed of water quality parameters, where n is the number of samples in the dataset. The standardized value of the ith component, is computed as [31]:
where represents the jth component of the ith feature vector , and and denote the mean and standard deviation of the corresponding component, respectively. Finally, the dataset was divided using a chronological splitting procedure to maintain the intrinsic temporal structure of the long-term environmental monitoring data. Approximately 80% of the accessible records, or historical observations gathered between 2004 and 2019, were used for hyperparameter optimization and model training. About 20% of the dataset, being the remaining and most recent observations from 2020 to 2024, were put aside solely for independent model testing. This time-aware partitioning offers a realistic evaluation of the model’s predicted performance under future, unknown environmental conditions and avoids information leakage that could result from random data splitting. Through this systematic preprocessing workflow, comprising variable screening, imputation, normalization, and data partitioning, the dataset was transformed into a clean, balanced, and standardized format suitable for accurate and robust modeling.
2.3. Model Development
2.3.1. Artificial Neural Network
Artificial Neural Networks (ANNs) are nonlinear computational models inspired by the structure and functioning of the human brain, enabling them to learn complex relationships among input variables without requiring explicit analytical formulations [32,33]. Their ability to capture intricate patterns makes them particularly valuable in environmental modeling, forecasting, and water quality assessment, where system dynamics are often nonlinear and influenced by multiple interacting factors. An ANN consists of interconnected layers of artificial neurons, an input layer, one or more hidden layers, and an output layer through which information propagates during both training and prediction [34,35].
In feedforward architectures, data flow sequentially from the input to the output layer, with each neuron applying a weighted linear transformation followed by a nonlinear activation function. For a network with L layers and parameters , the mapping from an input vector X to a predicted scalar is expressed as:
where for layer l: is the activation function, the weight matrix is , and the bias vector is .
Model training is performed using the backpropagation algorithm, which iteratively updates the network parameters to minimize the discrepancy between predicted and observed values. This adaptive learning process allows ANNs to generalize beyond the training dataset, a characteristic particularly advantageous for modeling noisy and nonlinear environmental datasets [36]. Consequently, ANNs have been widely applied in water-quality research, including the prediction of microbial contamination and the forecasting of HABs [21,37,38,39]. In this study, a conventional feedforward ANN with 20 neurons was developed as a baseline model for algae prediction, see Figure 2. The number of neurons in the hidden layers was determined after testing configurations with (10, 15, 20, 25, and 30 neurons) were evaluated. The architecture with 20 neurons consistently demonstrated superior and stable performance, achieving an effective trade-off between model complexity and generalization capability. Consequently, the 20-neuron architecture was selected as it ensured reliable convergence, stable predictive performance, and sufficient representational capacity.
Figure 2.
Architecture of the conventional feedforward ANN model.
The subsequent subsection presents the proposed ANN, which introduces an enhanced architecture developed using the Concatenate technique. This approach aims to overcome the limitations of conventional ANNs by improving feature representation and prediction accuracy in harmful algal bloom forecasting.
2.3.2. Proposed Concatenate-Based Artificial Neural Network Architecture
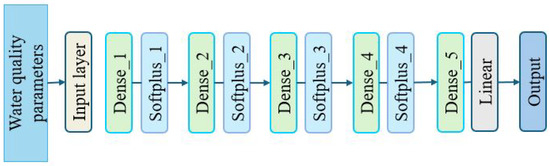
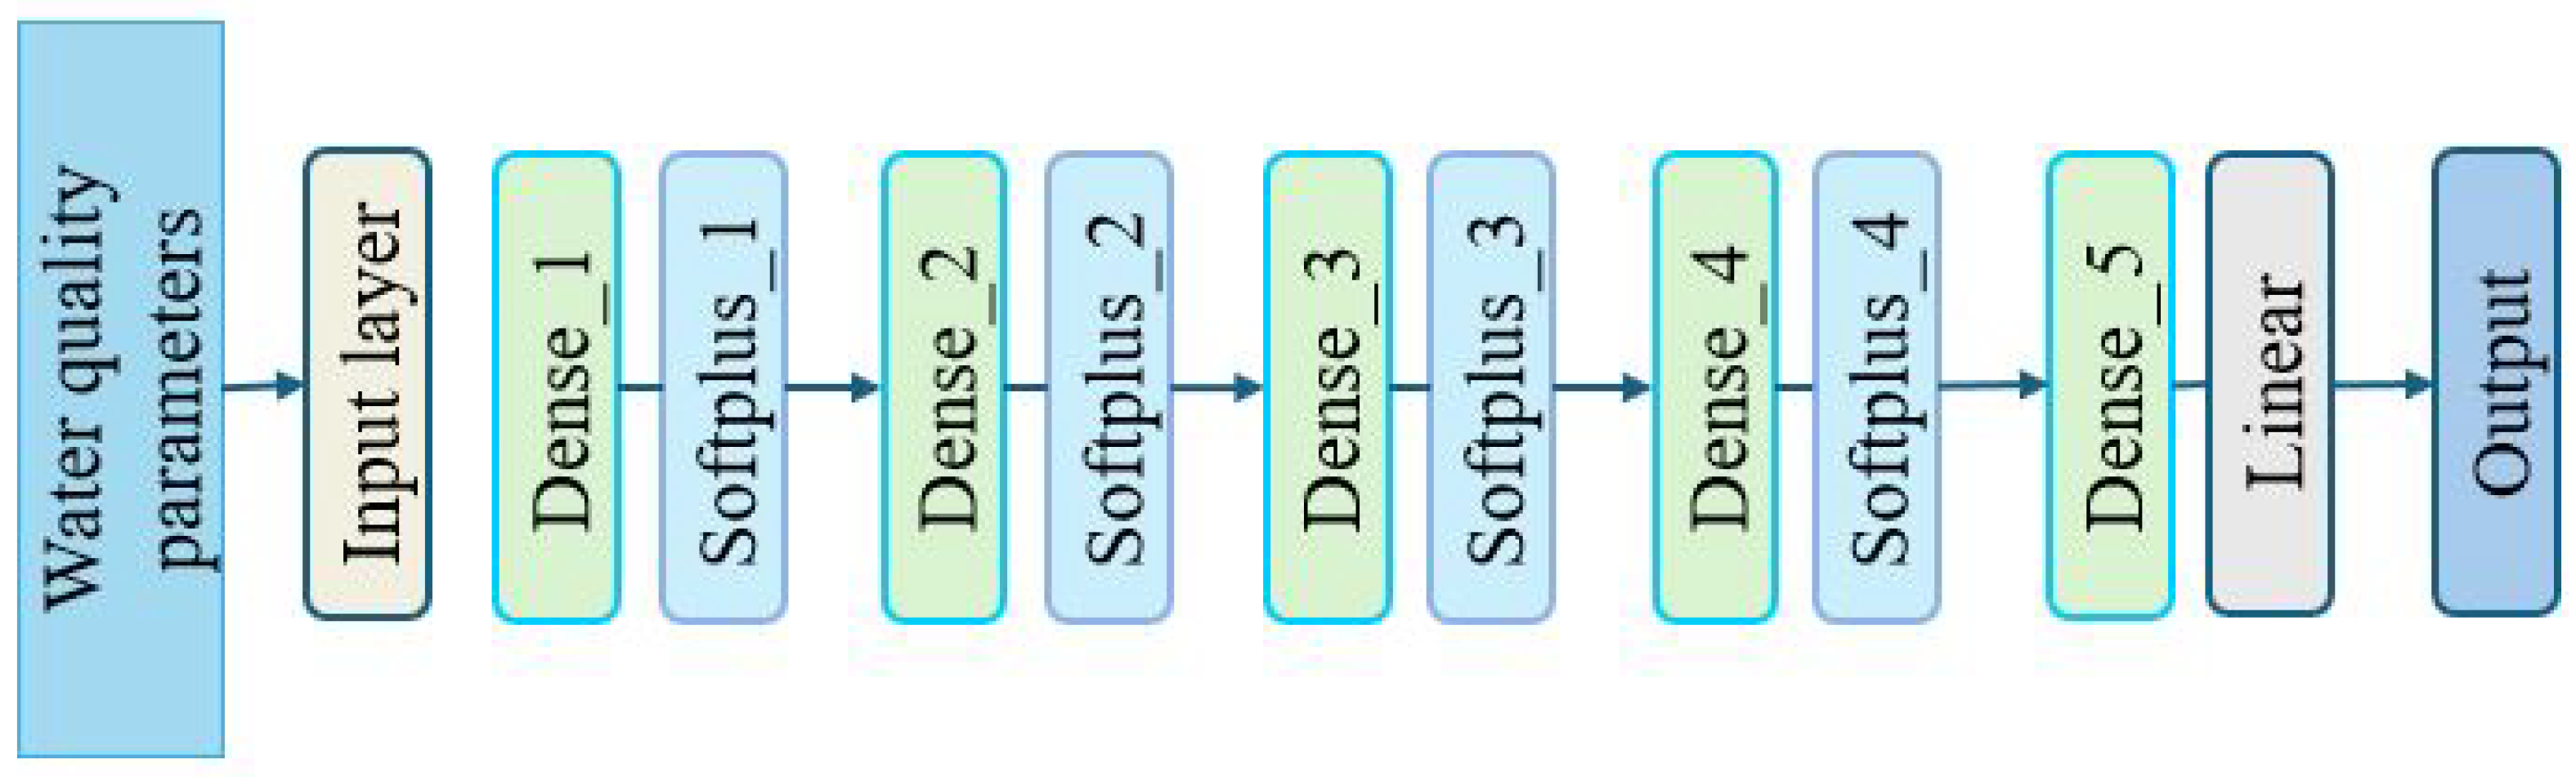
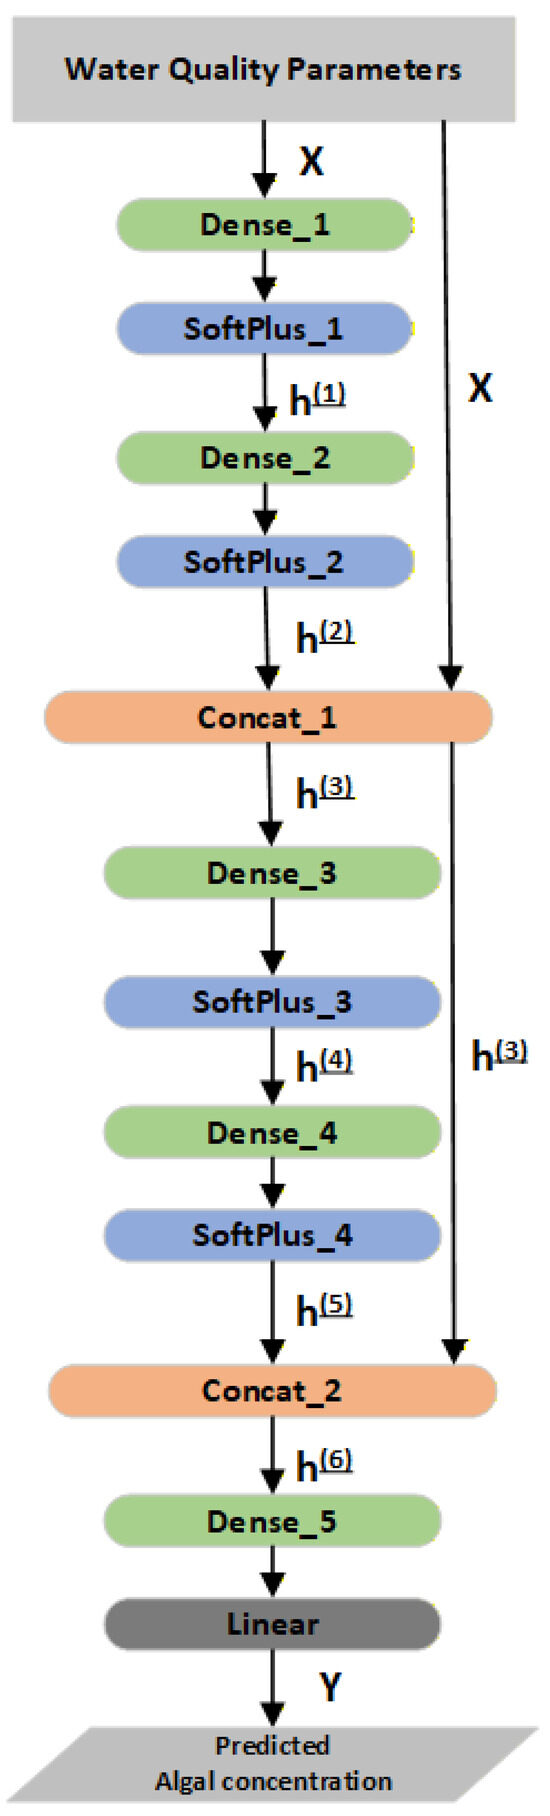
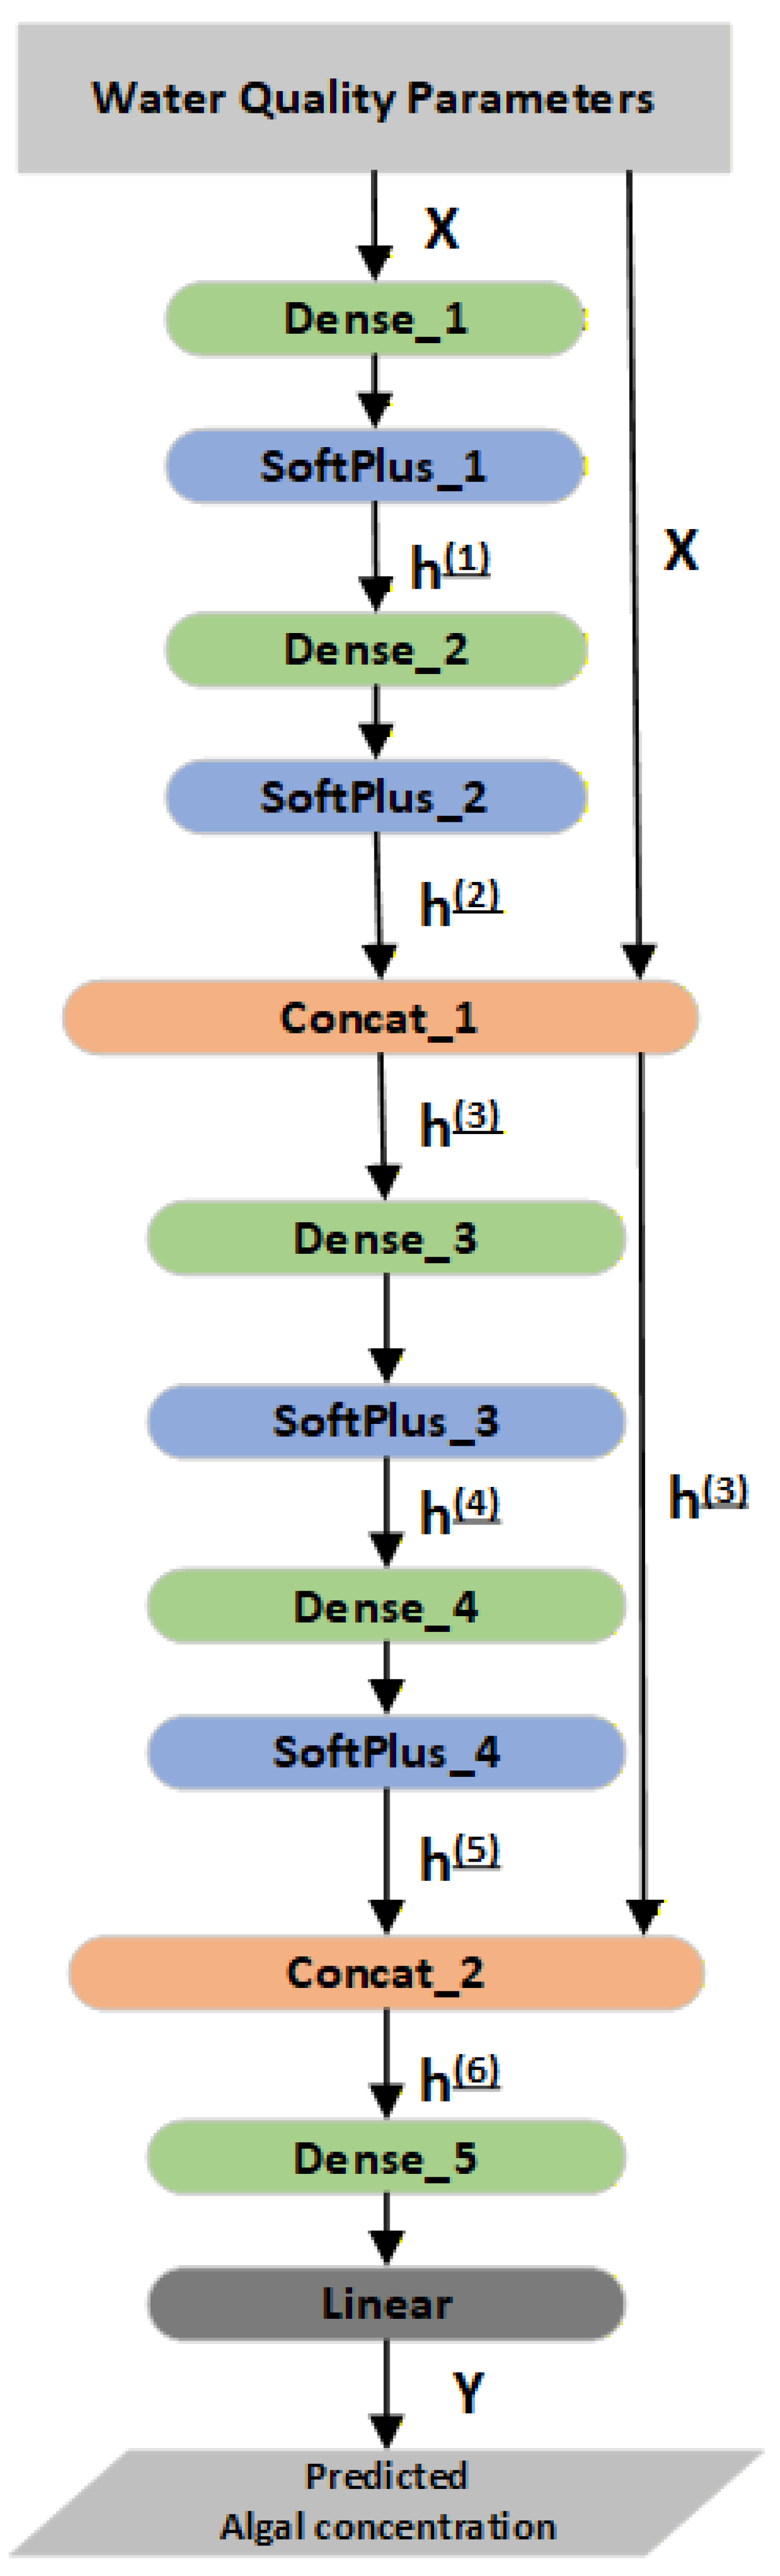
While conventional feedforward ANNs have demonstrated strong predictive capabilities for HABs, their strictly sequential layer-by-layer information flow may limit the reuse of early-stage features and the integration of multi-scale representations. This study proposes a concatenation-enhanced ANN architecture that systematically fuses intermediate feature maps across different network depths prior to the final prediction. The proposed architecture is illustrated in Figure 3.
Figure 3.
The schematic of the proposed method.
As shown in Figure 3, the input layer receives water quality features, including physicochemical and microbiological parameters, and transmits them through a series of dense (fully connected) layers. Each dense block extracts increasingly abstract representations of the input data, capturing complex nonlinear interactions among environmental variables.
Formally, let denote the input vector of physicochemical water quality parameters after preprocessing (including KNN imputation and standardization), and let denote the target algal concentration. The proposed architecture consists of hidden layers, each containing neurons with Softplus activation.
The first hidden layer computes
where , , and is the Softplus activation function.
The subsequent hidden layers are defined as
The final output layer produces the prediction:
Thus, the overall functional mapping implemented by the network can be written compactly as
where denotes the set of all trainable parameters.
From Figure 3, the input block corresponds to the vector . Each successive hidden block represents the nonlinear transformations , , , and , computed via affine mappings followed by Softplus activation. The concatenation nodes in the diagram stacks intermediate representations into a higher-dimensional feature vector. The final output node implements the linear projection , producing the predicted algal concentration. Hence, each graphical component in Figure 3 directly maps to its corresponding mathematical operator in Equations (4)–(8).
The concatenation mechanism is motivated by the observation that HAB dynamics are governed by interacting physicochemical processes operating at different temporal and hierarchical scales. In a conventional sequential ANN, early-layer representations are transformed and potentially diluted as they propagate through subsequent hidden layers. By contrast, the proposed architecture introduces two skip-concatenation connections, which preserve and re-inject raw input features and intermediate representations into deeper layers.
It is important to clarify that both the baseline model (conventional ANN) and the proposed model are feedforward architectures. The distinction lies not in the feedforward property but in the presence of skip-concatenation connections. The baseline ANN follows a strictly sequential path: , without any feature reuse across depths. The proposed model, while still feedforward (no recurrent loops), introduces the two concatenation operations described above. Thus, the advancement is not from “feedforward to non-feedforward” but from “sequential feedforward” to “feedforward with concatenation-driven feature fusion mechanism.” This architectural enhancement is analogous to skip connections in residual networks but adapted for regression tasks with continuous environmental data.
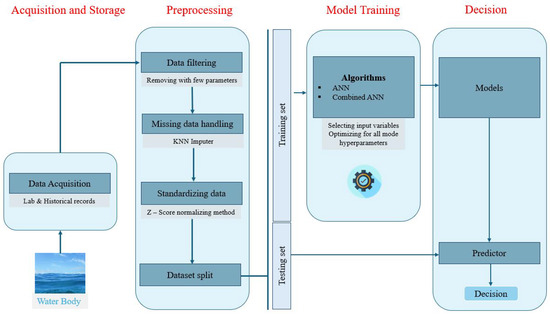
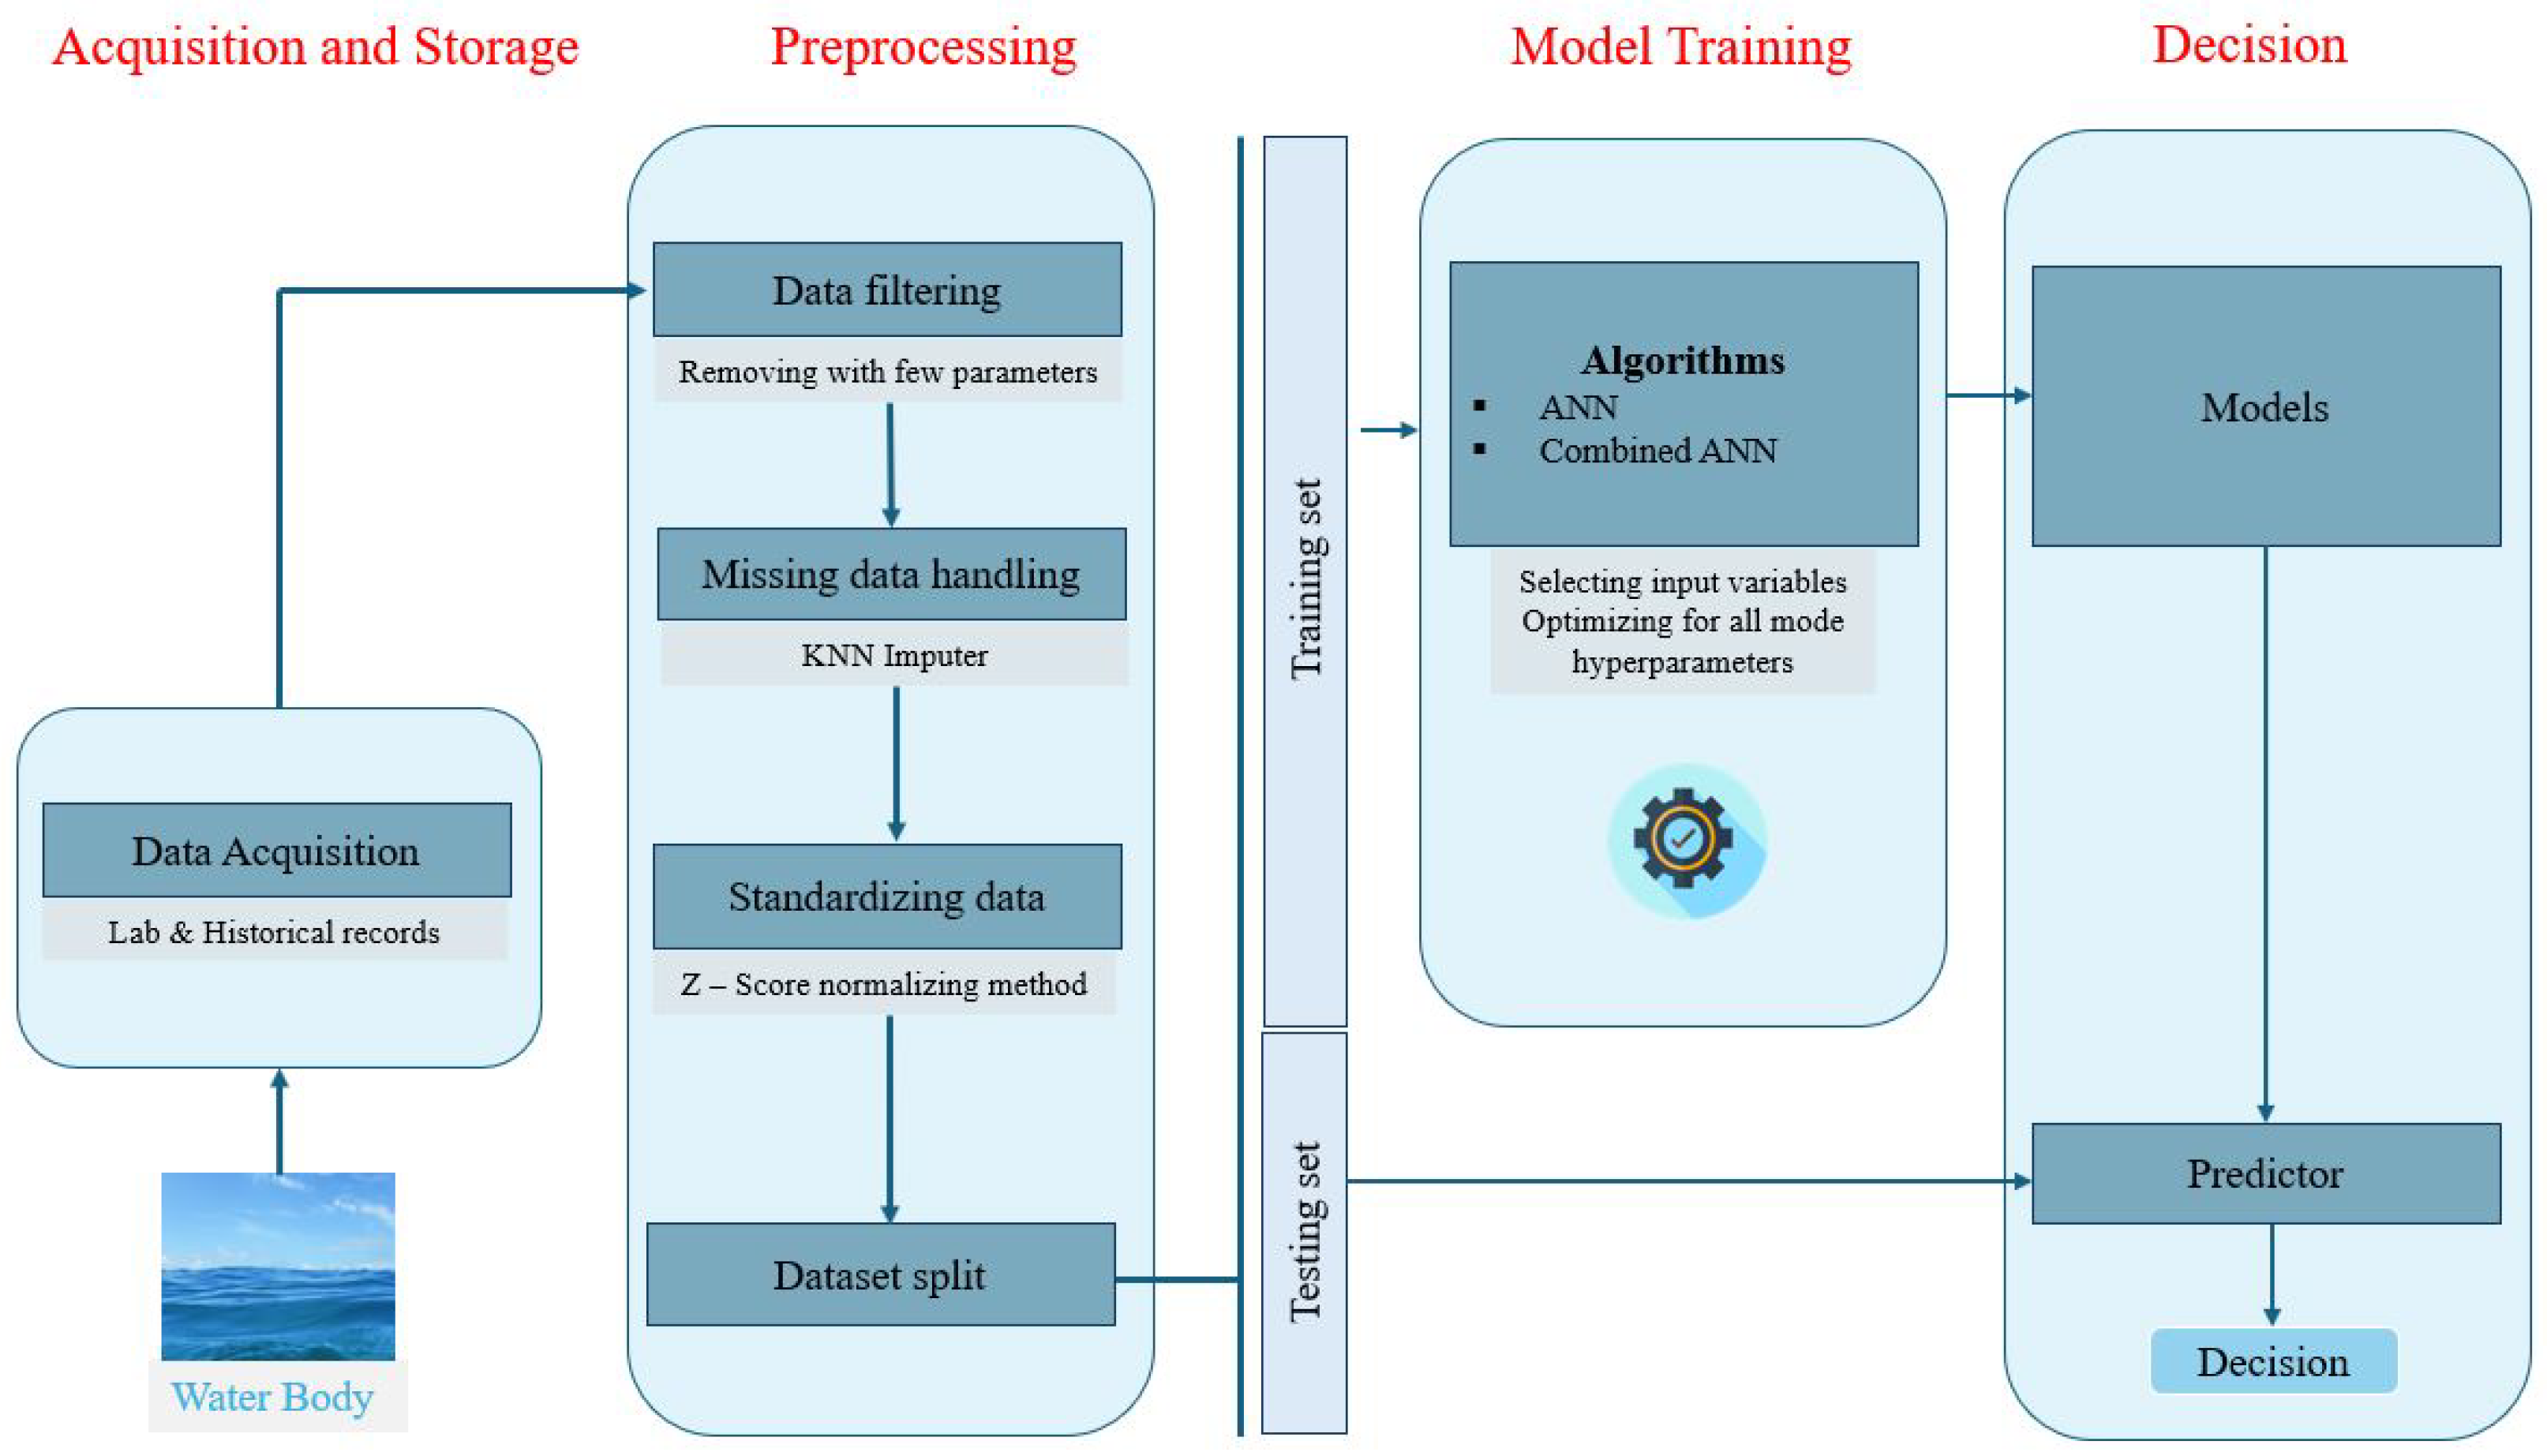
Figure 4 presents the conceptual diagram of the methodology used to predict the harmful algal blooms. To ensure optimal performance, extensive hyperparameter tuning was conducted for both the traditional and proposed ANN models, as summarized in Table 1.
Figure 4.
Conceptual framework illustrating the methodological approach employed for harmful algal bloom prediction.
Table 1.
Hyperparameter tuned values for feed-forward ANN and concatenate-based (Combined) ANN.
For both models, the implementation used the Keras library (TensorFlow backend) in Python 3.14.4. The Adam optimizer was used with an initial learning rate of 0.001, chosen for its adaptive learning rate and superior handling of sparse gradients, a batch size of 10, and a maximum of 100 epochs. Early stopping with a patience of 15 epochs monitored validation MAE. The Softplus activation was chosen for its smooth, differentiable profile and for avoiding dead neurons (unlike ReLU). A linear activation function was used in the output layer to accommodate the continuous range of algal cell densities. This adaptive training strategy allowed the model to converge to an optimal solution while maintaining generalization to unseen data. Overall, the proposed Concatenate-based ANN architecture represents a methodological advancement over traditional feedforward designs. By leveraging feature fusion and hierarchical representation learning, it provides a more accurate, stable, and interpretable framework for forecasting harmful algal blooms and understanding the complex environmental interactions underlying their formation in the Midmar Dam ecosystem.
2.4. Assessment of Model Performances
Evaluating model performance is a critical step in validating the predictive capability and generalization strength of machine learning algorithms. In this study, the performance of the traditional ANN and the proposed Concatenate-based ANN was assessed using three widely adopted statistical metrics: MAE, RMSE and NNSE. The MAE measures the average magnitude of the prediction errors, disregarding their direction, thereby providing a straightforward interpretation of the average model deviation [40]. The RMSE, obtained as the square root of the mean squared error (MSE), expresses the model error in the same units as the original data, enabling a more intuitive evaluation of prediction quality [41,42]. The Nash–Sutcliffe Efficiency (NSE) is a widely used metric in hydrological and environmental modeling that evaluates how well the predicted values match the observed data compared to the mean of the observations [43]. However, NSE can take negative values when model performance is poor, which complicates interpretation [44,45]. To address this limitation, the normalized NSE (NNSE) is used, transforming NSE into a bounded, more interpretable range. NNSE values lie within the interval (0, 1), where values closer to 1 indicate superior predictive performance, while values approaching 0 reflect poor model skill.
The mathematical expressions for the four evaluation measures are defined as follows:
where n denotes the total number of data samples, represents the actual (observed) value, and represents the corresponding predicted value for the ith sample.
These statistical measures collectively facilitate a robust comparative evaluation between models. Lower MAE and RMSE values indicate higher predictive accuracy. In this study, these metrics were computed for both the traditional ANN and the proposed Concatenate-based ANN using independent test data, ensuring unbiased performance assessment.
3. Experimental Results and Discussion
3.1. Descriptive Statistics of Water Quality
The descriptive statistics of the physicochemical and biological parameters measured at Midmar Dam during the 20-year monitoring period (2004–2024) are shown in Table 2. These characteristics provide a fundamental understanding of the trophic status and ecological variability of the dam, and are important environmental indicators that control the dynamics of HABs. Overall, the results show a considerable degree of fluctuation across parameters, suggesting that both seasonal and hydrometeorological factors have an impact on the typically stable but fluctuating water quality conditions. As a stand-in for algal biomass, chlorophyll a (Chl-a) showed a mean concentration of 0.57 µg/L, with a low of 0.02 µg/L and a maximum of 0.98 µg/L. This variance suggests sporadic periods of increased algal development, likely due to favorable temperature conditions and nutrient influxes. Similarly, during rainfall and catchment runoff events, turbidity levels (mean = 0.58 NTU) exhibited sporadic increases (up to 0.99 NTU), suggesting transient sediment disturbances or organic matter influxes. The wide range of dissolved oxygen (DO) (0.02–0.98 mg/L, mean = 0.60 mg/L) suggests dynamic oxygen conditions that may affect algae metabolism and nutrient cycling. These variations often occur in nutrient-rich or stratified waters, where internal nutrient loading can be triggered by oxygen depletion near the bottom, thereby exacerbating algal growth. Aquatic species benefit from balanced acid-base environments, as seen by the pH levels (mean = 0.47), which stayed close to neutrality. The buffering system’s stability is further supported by slight variations in alkalinity (mean = 0.54 mg CaCO3/L). Conductivity and total dissolved solids (TDS) exhibited moderate mean values (0.32 mS/m and 0.51 mg/L, respectively), reflecting the ionic strength and mineralization levels typical of freshwater systems influenced by both natural and anthropogenic inputs. The observed variability in nitrate (NO3) and ammonia (NH3) concentrations (means = 0.47 mg N/L and 0.57 mg N/L, respectively) highlights the influence of nutrient enrichment from agricultural runoff and catchment discharges, key drivers of eutrophication and algal proliferation. The temperature exhibited a mean of 0.52 °C (normalized), consistent with the region’s temperate climate, and provided optimal thermal conditions for algal growth and microbial processes. Similarly, hardness (mean = 0.54 mg CaCO3/L) and iron (mean = 0.38 mg/L) showed moderate variations, indicating stable mineral content with occasional increases due to sediment resuspension or catchment erosion.
Table 2.
Statistical summary of the water quality parameters for the study area.
Collectively, these findings indicate that Midmar Dam experiences generally stable physicochemical conditions but is periodically influenced by nutrient enrichment and sediment disturbance events, factors that create favorable conditions for the development of harmful algal blooms. The observed variability across parameters highlights the complex, nonlinear interactions within the aquatic ecosystem, underscoring the need for advanced machine learning models, such as the proposed ANN architecture, to effectively capture and predict HAB dynamics based on these interdependent environmental indicators.
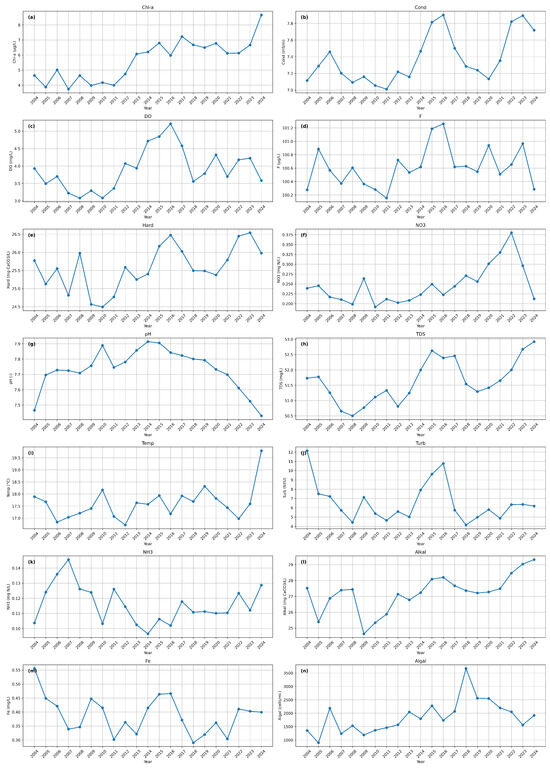
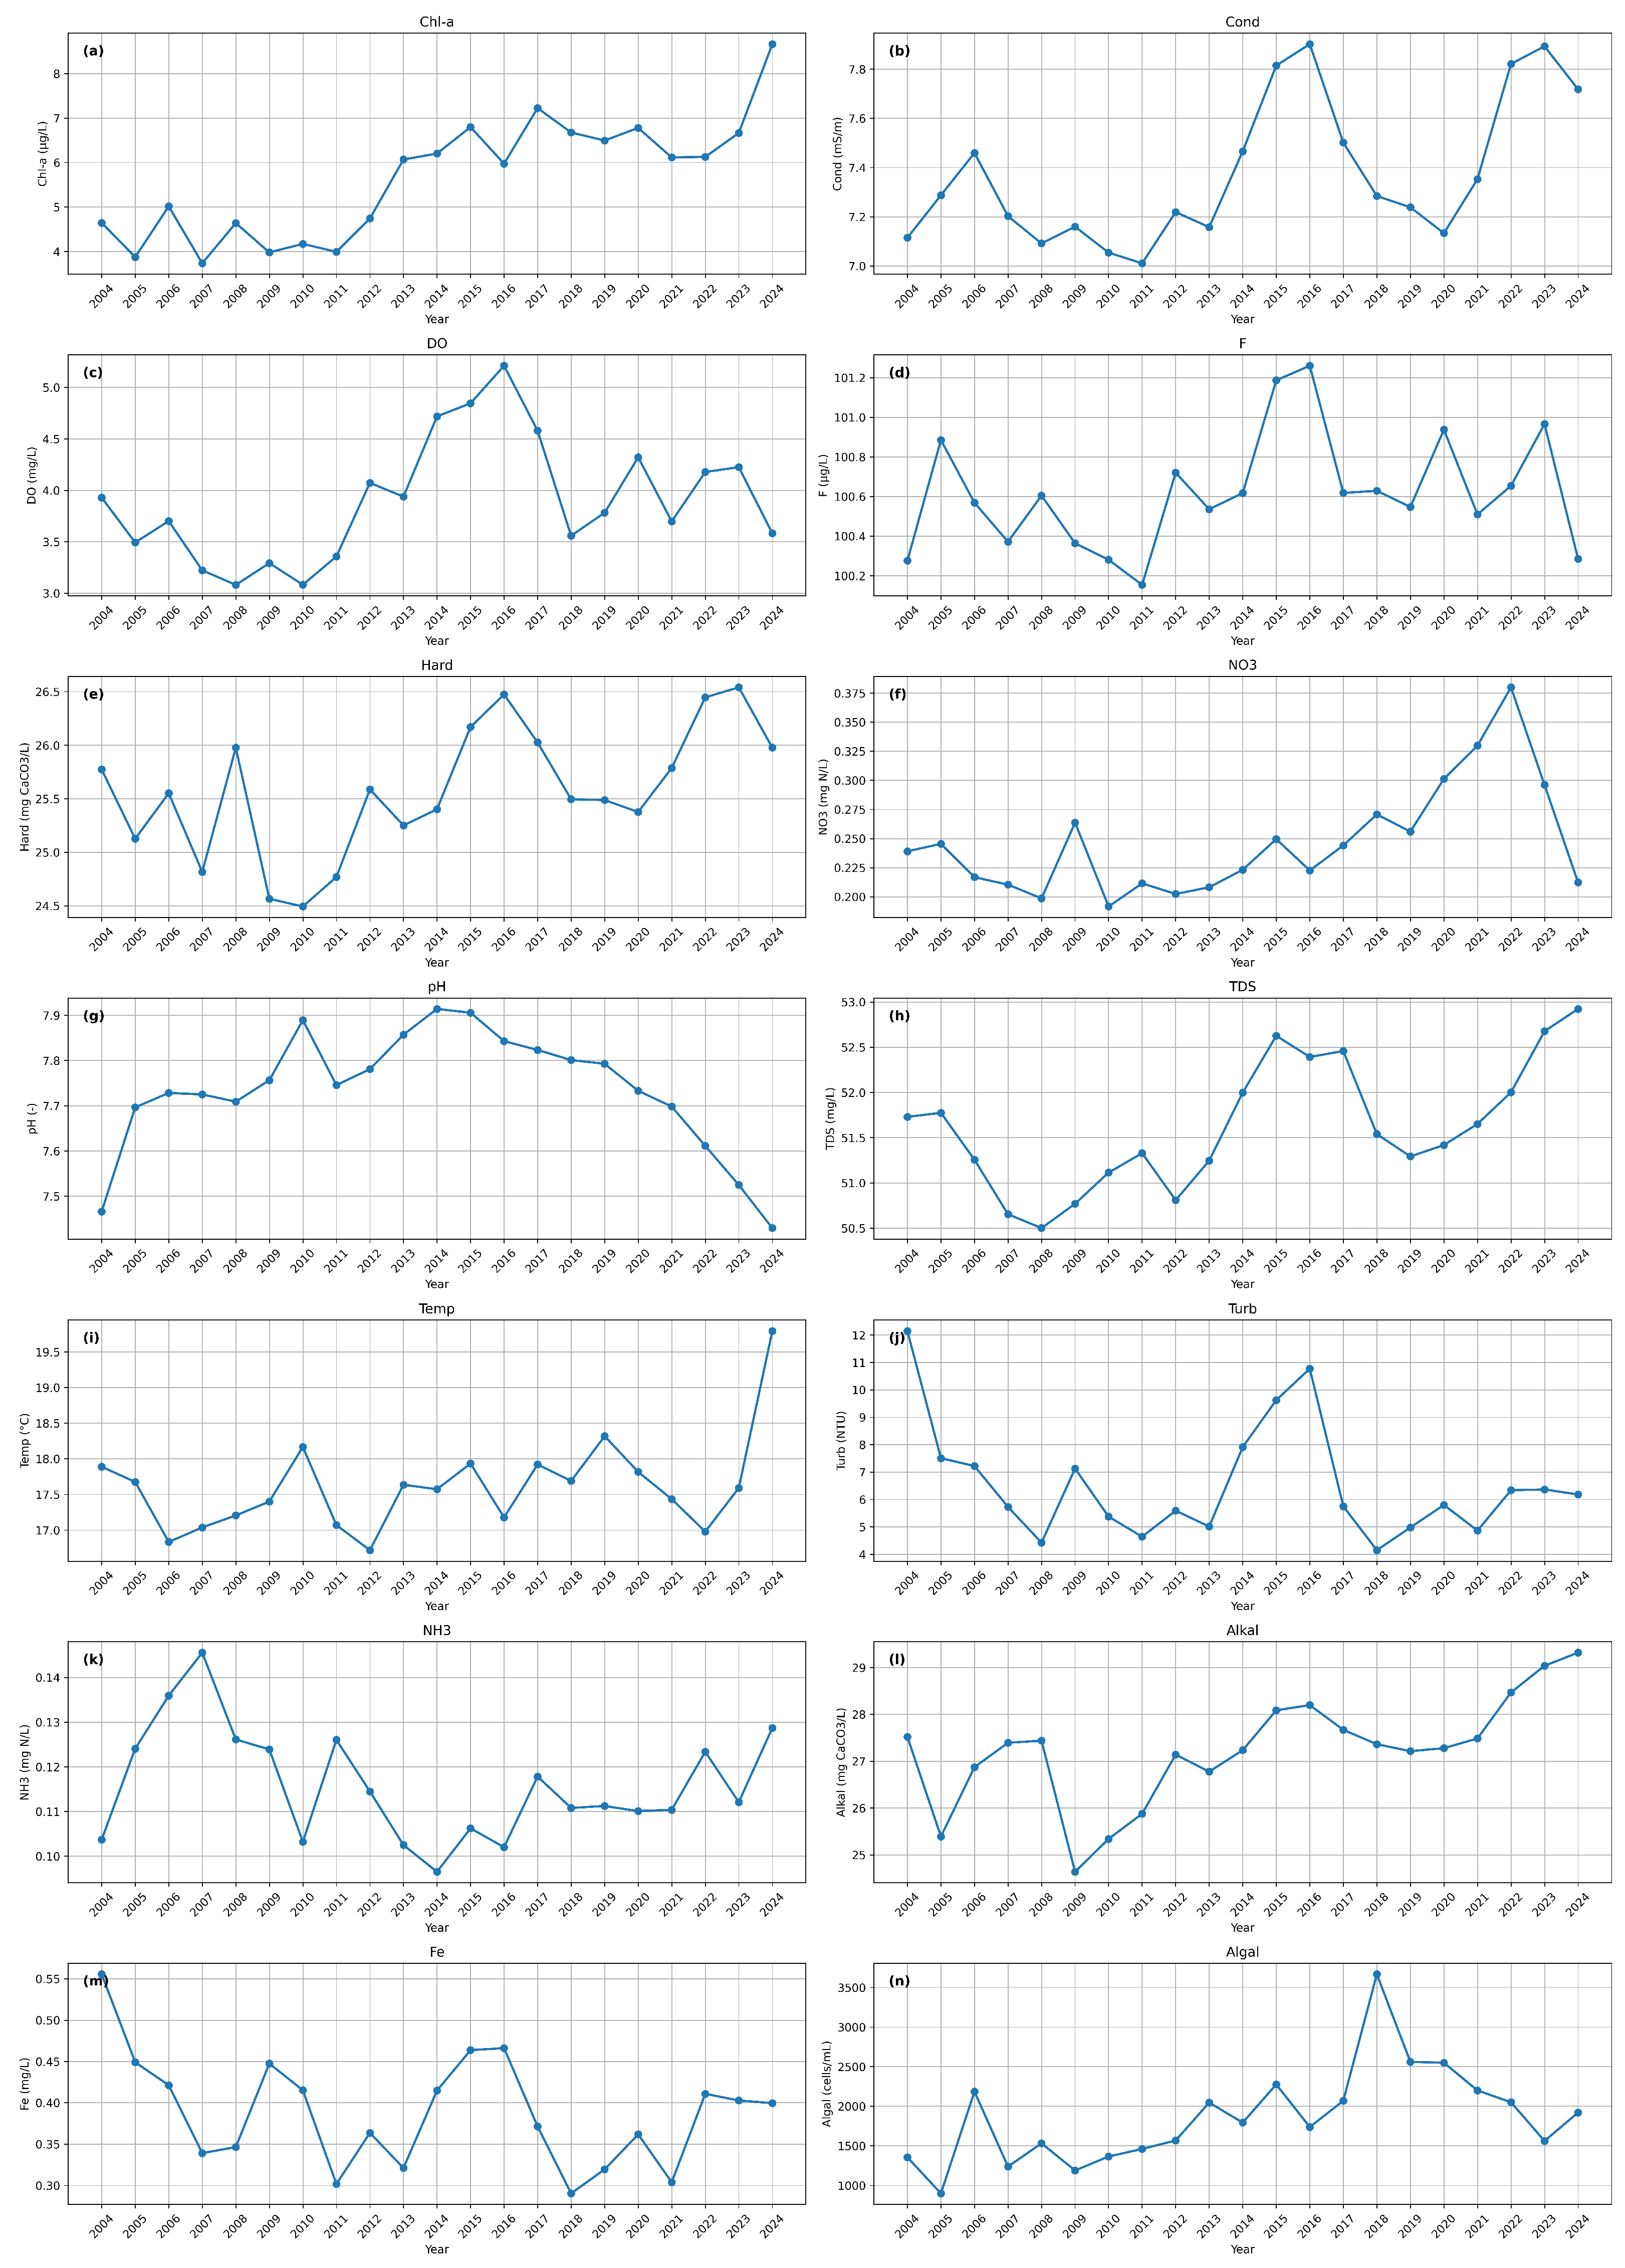
Figure 5 further elucidates the temporal dynamics of the monitored variables by illustrating their annual variations over the 20-year period. The results reveal clear inter-annual fluctuations and co-variability among key parameters, particularly temperature, nutrient concentrations (NO3 and NH3), and algal abundance. Periods of elevated algal concentrations tend to coincide with increases in temperature and nutrient levels, suggesting a synergistic effect of thermal conditions and nutrient enrichment on bloom formation. Similarly, turbidity and conductivity exhibit episodic peaks that align with fluctuations in nutrient variables, likely reflecting catchment runoff events and sediment disturbances. Dissolved oxygen shows an inverse relationship during some high-algae periods, suggesting potential oxygen depletion associated with increased biological activity.
Figure 5.
The annual variation of (a) chlorophyll a, (b) conductivity, (c) dissolved oxygen, (d) fluoride, (e) hardness, (f) nitrate, (g) pH, (h) total dissolved solids, (i) temperature, (j) turbidity, (k) ammonia, (l) alkalinity, (m) iron, and (n) Algae.
3.2. Correlation Between Algae and Other Water Quality Parameters
Prior to developing a model, it is essential to comprehend the relationships between physicochemical parameters, as this provides information about the degree of linear relationship between the input data and the goal variable. Finding strong connections makes it easier to identify which parameters have greater predictive potential, which helps the model identify significant patterns and increase forecasting accuracy. Weak correlations, on the other hand, imply limited linear dependency, suggesting that these characteristics may have a less direct impact on prediction and that nonlinear modeling methods could be needed to extract their implicit influence. The linear associations between physicochemical factors and algal densities in Midmar Dam were assessed in this study using Pearson’s correlation coefficient at the 0.05 significance level (Table 3). This coefficient measures the strength and direction of linear associations between paired variables by calculating their covariance normalized by the product of their standard deviations. The specific formula is as follows [46]:
where denotes the correlation coefficient between variables X and Y, cov(X, Y) represents their covariance, and and are the standard deviations of X and Y, respectively.
Table 3.
Pearson’s correlation coefficient between algae and other parameters at 0.05 level of significance.
Overall, the results reveal a complex network of interrelationships among water quality parameters, reflecting the multifactorial nature of algal bloom dynamics (Table 4). Moderate to strong positive correlations were observed between nitrate (NO3), total dissolved solids (TDS), and ammonia (NH3) (r = 0.75, r = 0.55, respectively), indicating the combined influence of nutrient enrichment and dissolved ion concentration on eutrophication processes. Similarly, alkalinity exhibited moderate positive associations with hardness (r = 0.62) and fluoride (r = 0.47), suggesting that carbonate buffering capacity and ionic strength may jointly influence the chemical stability of the aquatic system. Algal concentration demonstrated a weak-to-moderate positive correlation with several parameters, including temperature (r = 0.49), hardness (r = 0.50), alkalinity (r = 0.47), and total dissolved solids (r = 0.40). These associations imply that elevated algal levels tend to coincide with warmer conditions and moderately mineralized water, both of which enhance photosynthetic activity and nutrient uptake. The observed correlation between algae and nitrate (r = 0.32) further underscores the role of nitrogen availability as a key nutrient supporting algal proliferation in Midmar Dam. In contrast, weaker relationships were found between algae and turbidity (r = 0.03), conductivity (r = 0.04), and dissolved oxygen (r = 0.11), suggesting that these parameters exert limited direct linear influence on algal abundance, although they may still contribute indirectly through nonlinear interactions. The weak Pearson correlation between chlorophyll-a and algal biomass reflects the inherently nonlinear and multivariate nature of algal dynamics, where relationships are shaped by complex ecological processes and temporal variability. Although Chl-a shows only a limited linear association with algae, it remains a significant predictor within the modeling framework. This underscores the importance of employing nonlinear approaches, such as ANNs, to effectively capture the complex interactions underlying harmful algal bloom prediction. The intercorrelations among environmental parameters also highlight potential co-regulatory effects. For instance, the strong relationship between TDS and nitrate (r = 0.75) suggests that nutrient loading is often accompanied by increased ionic content, possibly due to catchment runoff or agricultural leaching. Similarly, the moderate correlation between temperature and TDS (r = 0.59) reflects the effect of seasonal variability on solute concentration, as higher temperatures promote both evapoconcentration and biological activity.
Table 4.
Pearson correlation coefficient between algae and other parameters.
Collectively, the correlation results emphasize that algal dynamics in Midmar Dam are governed by the combined effects of nutrient enrichment, mineral composition, and temperature variation rather than by any single dominant factor. The relatively low to moderate correlation coefficients (r < 0.6) indicate that while some linear associations exist, the system’s behavior is largely governed by nonlinear and interdependent interactions. This finding reinforces the necessity of employing advanced machine learning models—such as the proposed concatenate-based artificial neural network—to effectively capture these complex, multivariate relationships and enhance the predictive accuracy of harmful algal bloom forecasting.
3.3. Relative Importance of Input Variables
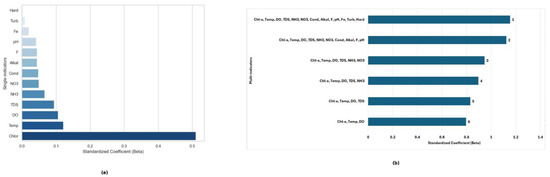
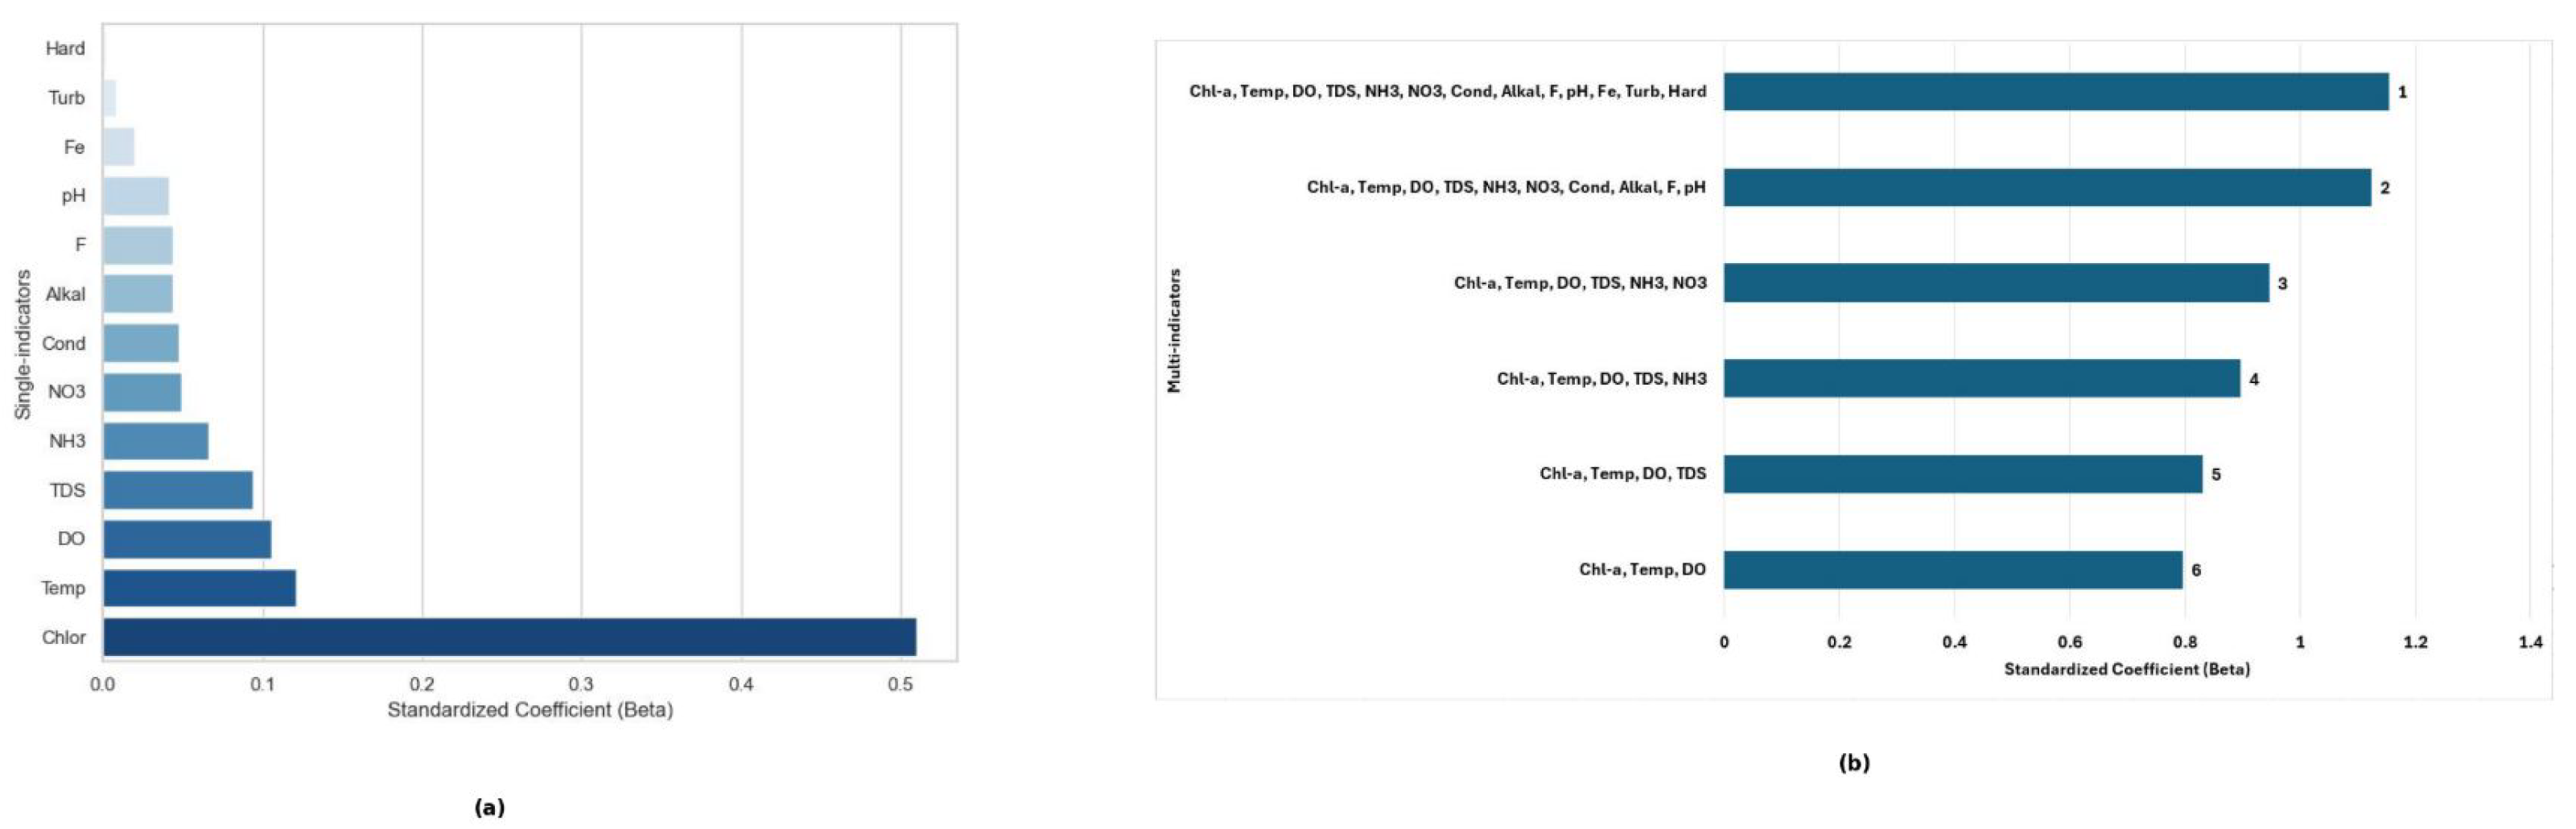
Assessing the relative significance of input variables is crucial for enhancing the interpretability of the model and understanding how each physicochemical parameter contributes to the prediction of algal blooms. The intricate multivariate interactions that define aquatic ecosystems are not fully captured by correlation analysis, despite its ability to offer initial insights into linear dependencies [47]. To address this, the standardized coefficient (Beta) was employed to quantify the net influence of each predictor on algal concentration while controlling for the effects of other variables. The Beta coefficient, which ranges between −1 and +1, represents the standardized effect size of an independent variable on the dependent variable, thereby offering a comparative measure of variable importance within the predictive framework [48]. In this study, the standardized coefficients were used to rank all input parameters according to their magnitude of influence, as shown in Figure 6a. To facilitate clearer interpretation, the parameters were subsequently grouped into six categories of increasing importance, as depicted in Figure 6b.
Figure 6.
(a) The standardized coefficients (Beta) between each indicator and algae, (b) a multiple indicator dataset with progressive accumulation of the standardized coefficients (Beta) values.
Category 1 includes all input variables considered in the model, while categories 2 through 6 progressively emphasize the most influential parameters. This systematic grouping enhances the understanding of the relationships between algae and environmental indicators, highlighting that parameters with higher standardized coefficients exert greater predictive significance in the occurrence of harmful algal blooms.
3.4. Comparative Analysis of Algae Prediction Performance Based on Different Feature Sets
To evaluate how the choice and number of input variables affect predictive accuracy, we trained and compared a baseline feedforward ANN and the proposed concatenate-based (Combined) ANN across six progressively accumulated feature combinations derived from the standardized-coefficient (Beta) ranking. Feature combinations were formed by cumulatively adding variables in descending order of Beta (see Figure 6b). Model performance was assessed on an independent test set using three error metrics: MAE, RMSE, and NNSE. The numerical results are summarized in Table 5.
Table 5.
Descriptive statistics of the selected water quality features and the corresponding model performance evaluation metrics.
The two architectures exhibit a consistent pattern: predictive error generally decreases as key features are added up to an intermediate feature set, after which additional features provide little benefit or produce inconsistent effects. For the conventional ANN, Feature Combination 4 delivered the best performance (MAE = 0.167, RMSE = 0.193, NNSE = 0.545), indicating that the first four to five most important predictors capture the bulk of the signal needed to forecast algal concentration. Feature Sets with fewer variables (Combinations 1–3) produced larger errors (e.g., Combination 1: MAE = 0.284, RMSE = 0.320, NNSE = 520), reflecting insufficient information for accurate prediction. Adding variables beyond combination 4 (Combinations 5 and 6) did not yield further error reduction and, in some cases, slightly degraded performance, suggesting diminishing returns and potential introduction of noise or redundancy. The Combined ANN shows a similar but markedly better improvement pattern. Notably, Combination 4 is again the most effective configuration for the Combined ANN, achieving substantially lower errors than the baseline: MAE = 0.101, and RMSE = 0.163, and a notably higher NNSE (0.652), indicating superior predictive skill and closer agreement with observed values. The NNSE metric further strengthens this conclusion by providing a normalized perspective on model efficiency. The higher NNSE values obtained by the Combined ANN, particularly at Combination 4, confirm that the proposed architecture not only reduces prediction errors but also improves the model’s ability to reproduce the temporal variability of algal concentrations. In contrast, lower NNSE values observed in suboptimal feature sets (e.g., Combination 3 for the Combined ANN) highlight instability and reduced generalization, likely due to insufficient or noisy input information.
Across all feature sets, the Combined ANN outperforms the traditional ANN in most cases (compare, for example, Combination 2: ANN MAE = 0.183 vs. Combined ANN MAE = 0.524, noting here that some Combined ANN results (e.g., Combination 3: MAE = 0.848) indicate instability for particular sets, which merits further inspection). The superior performance of the Combined ANN at Combination 4 suggests that the concatenate-based architecture more effectively fuses complementary feature representations and extracts nonlinear interactions when an optimal subset of informative variables is provided. This advantage is particularly evident in the improved NNSE scores, which reflect enhanced capability to reproduce observed system dynamics rather than merely minimize error magnitude.
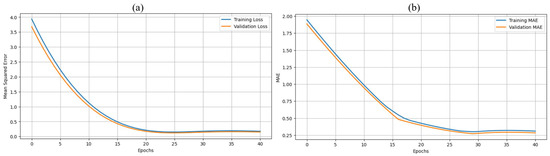
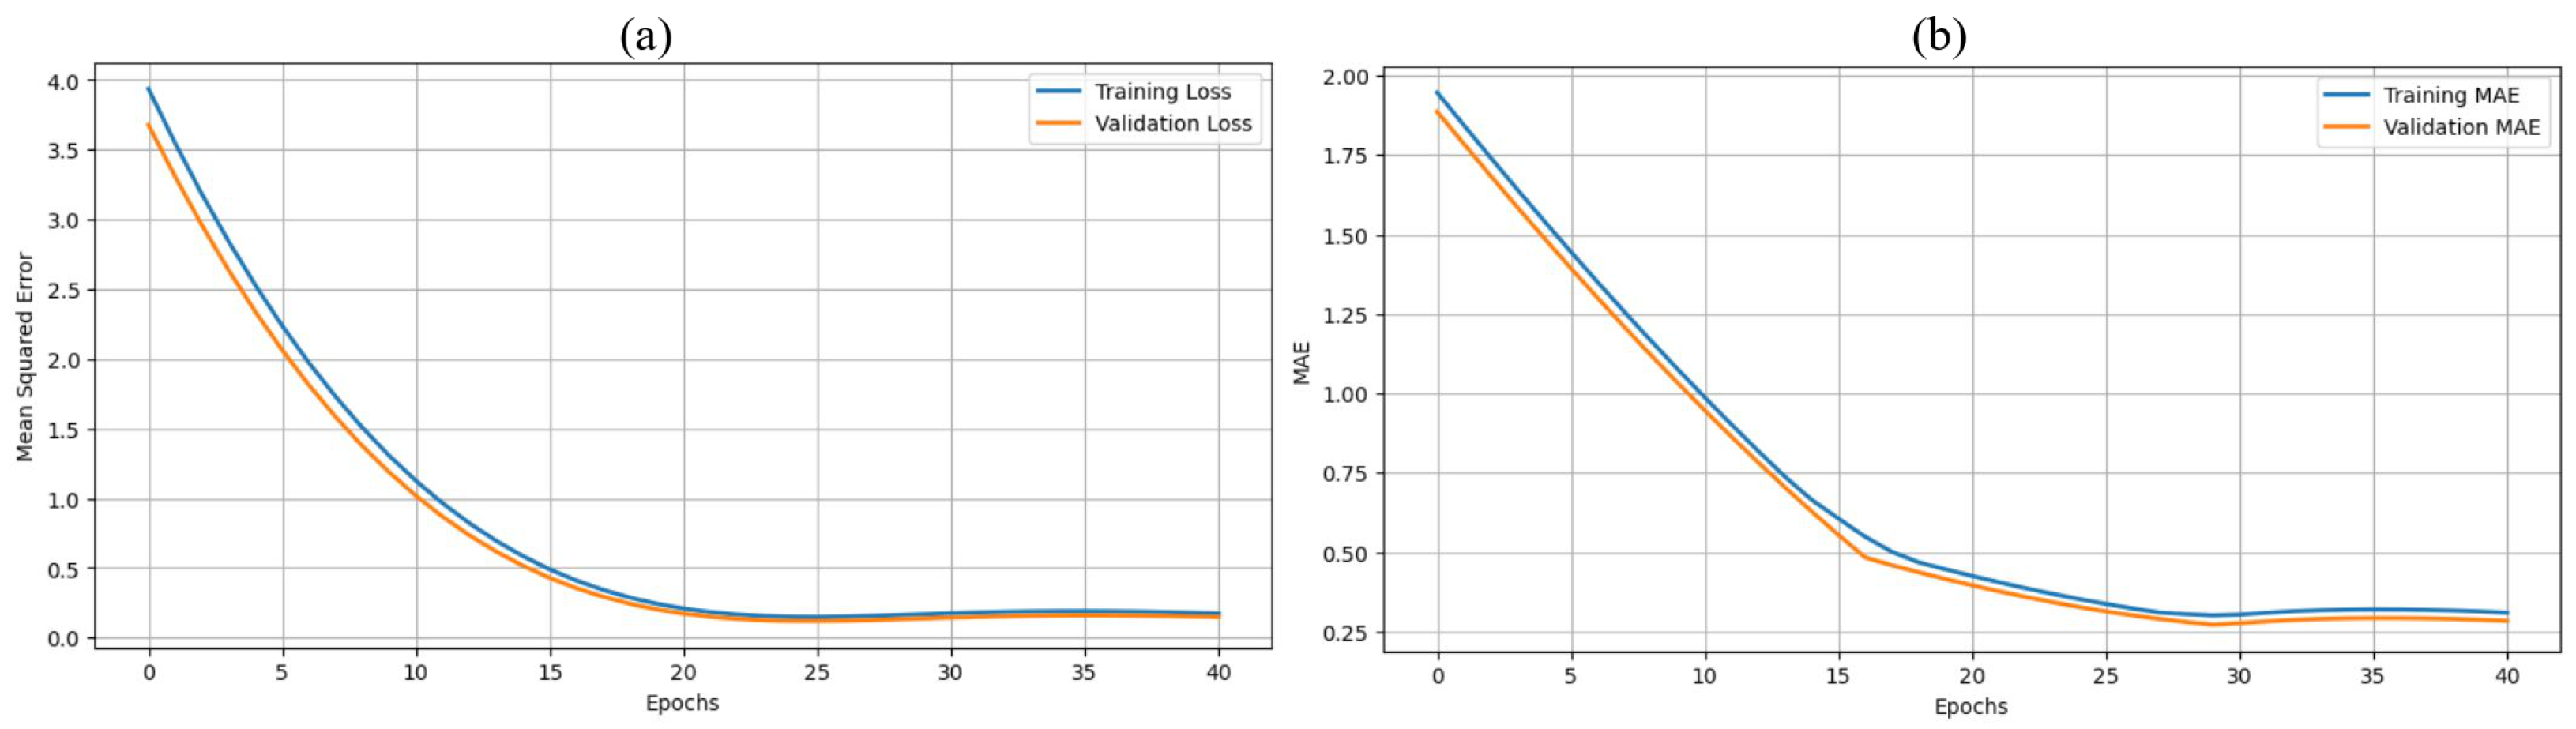
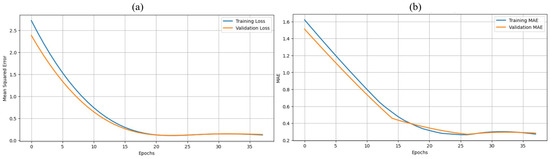
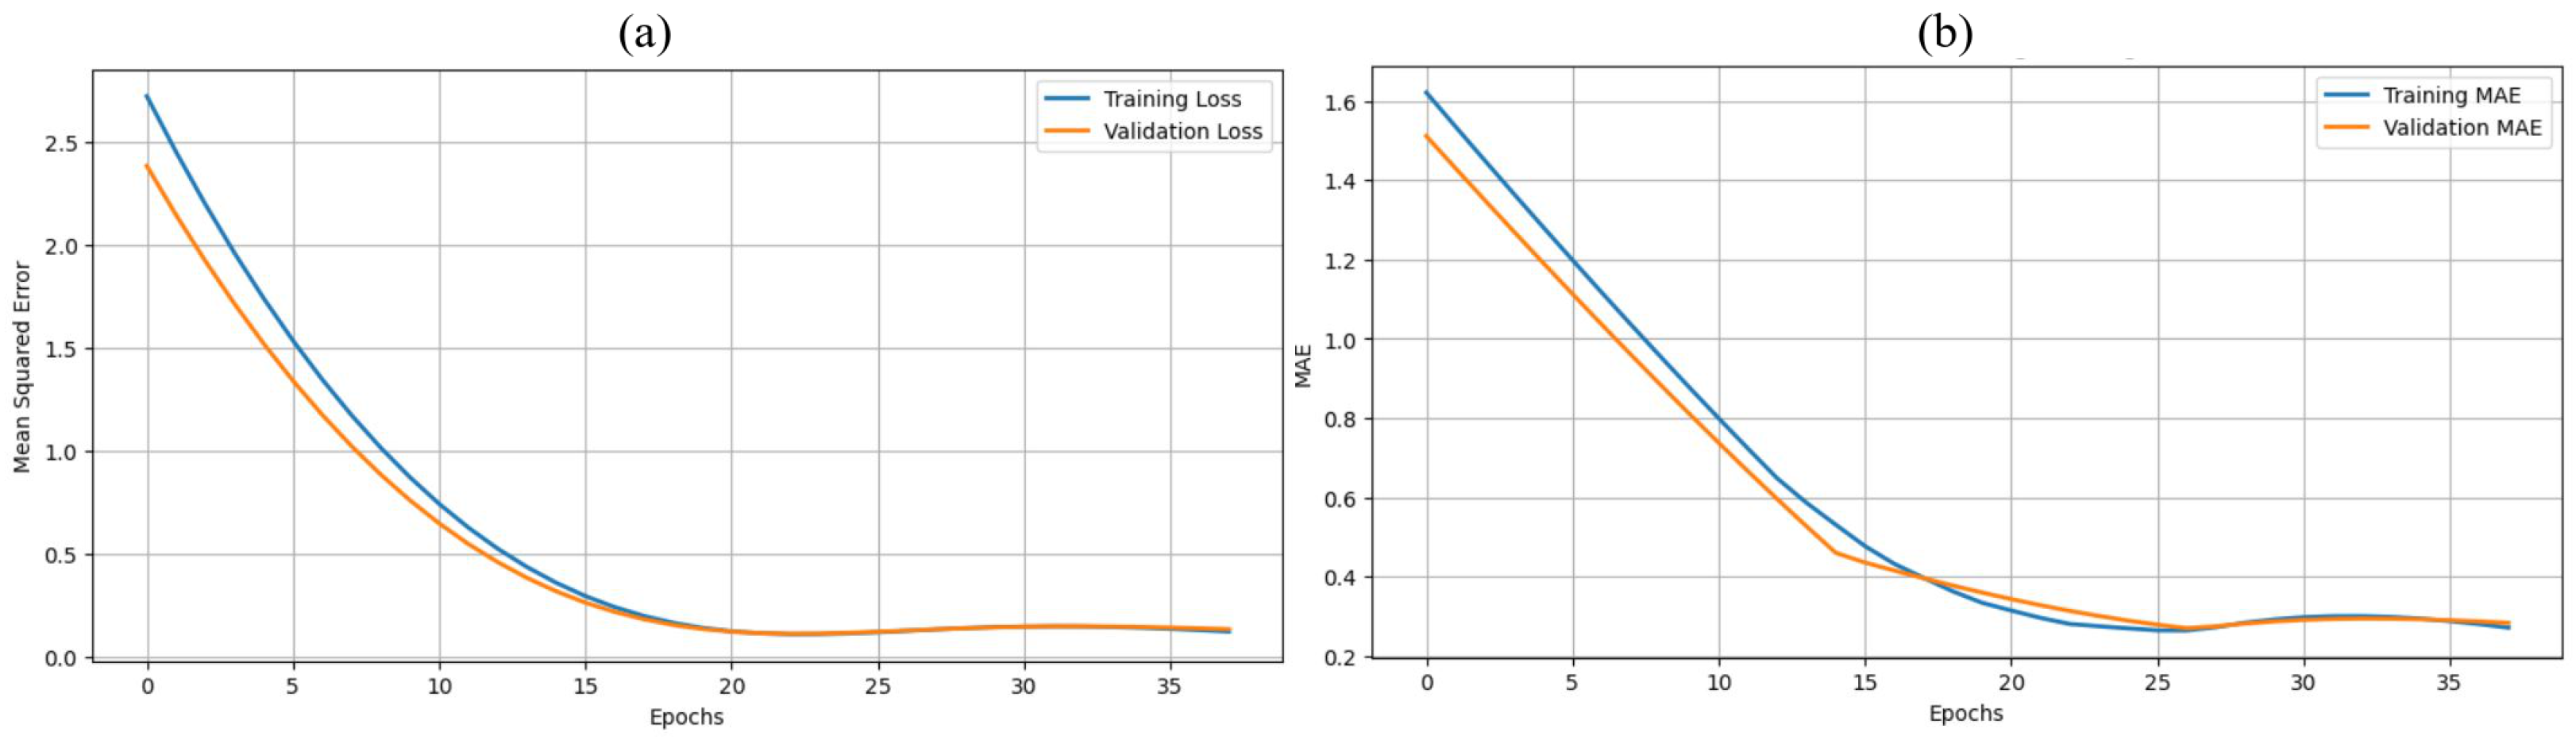
The training curves were analyzed to assess the learning dynamics and generalization capability of both models during optimization. Figure 7 presents the training and validation loss trajectories, mean squared error (MSE), and mean absolute error (MAE) for the baseline ANN, while Figure 8 illustrates the corresponding curves for the concatenate-based ANN.
Figure 7.
Training and validation across epochs for the conventional ANN model. (a) for MSE and (b) for MAE.
Figure 8.
Training and validation across epochs for the concatenate-based ANN model. (a) for MSE and (b) for MAE.
In both figures, the loss functions exhibit a consistent downward trend during the initial training epochs, indicating effective learning of the underlying relationships between water quality parameters and algal concentration.
Several conclusions can be drawn from these results:
- First, an intermediate, parsimonious feature set represented by Combination 4 (chlorophyll-a, temperature, dissolved oxygen, TDS, and NH3) balances information content and model complexity most effectively for this dataset.
- Second, the concatenate-based architecture amplifies the benefit of this parsimonious set, reducing both bias and variance relative to the traditional ANN and thereby.
- Third, adding additional variables beyond the optimal subset tends to yield marginal gains or increased variability in performance, consistent with issues of multicollinearity, noisy measurements, or overfitting when weakly informative predictors are included.
While the proposed concatenate-based ANN demonstrates strong overall performance, residual analysis reveals several edge cases. The model tends to underestimate extreme algal bloom events due to their rarity and nonlinear nature, reflecting a bias toward moderate conditions. Prediction errors also increase during abrupt environmental transitions, such as post-runoff changes in nutrients or turbidity, which are not fully captured by static inputs. Additionally, instability is observed with less informative feature sets (e.g., Feature Set 3 in the Combined ANN), indicating sensitivity to noise and multicollinearity. Finally, reduced variability in key drivers limits the model’s ability to detect subtle algal changes.
3.5. Discussion
The results of this investigation demonstrate the effectiveness of the suggested concatenate-based ANN architecture in predicting HAB incidents at the Midmar Dam. The model demonstrated a significant improvement in predicting accuracy over the traditional ANN by employing a concatenation-based feature fusion approach. The improved ability of the suggested model to incorporate nonlinear interactions among water quality indicators, which capture the complex dependencies that control algal proliferation, is responsible for its better performance. The experimental results revealed that the concatenate-based ANN achieved substantially lower MAE and RMSE and higher NNSE values across most feature combinations, with the best results observed for Feature Combination 4 (MAE = 0.101, RMSE = 0.163, NNSE = 0.652). This feature set emerged as the most informative subset, striking a balance between predictive power. A notable observation is the diminishing improvement in model accuracy when additional features were introduced beyond this optimal subset. This phenomenon suggests that incorporating variables with weak or redundant correlations may introduce noise, inflate model complexity, and potentially degrade generalization performance. Such behavior is consistent with the principle of parsimony, which advocates for using minimal yet informative predictors to achieve robust predictive modeling. Ly et al. [49] conducted a comprehensive 10-year study of the Han River in South Korea, analyzing 20 water-quality parameters at 40 monitoring stations. Using entropy analysis rather than simple linear correlation, they identified the most critical drivers of algal blooms as DTP, DTN, pH, DO, BOD, temperature, precipitation, and flow rate. The performance stability achieved by the concatenate-based ANN across multiple feature sets reinforces its resilience and adaptability in handling multicollinearity, a common challenge in environmental datasets where interdependent variables coexist. The improved predictive outcomes of the concatenate-based ANN relative to the traditional architecture highlight the importance of architectural optimization in environmental modeling. The concatenation of intermediate feature maps allowed the model to preserve complementary information extracted at different abstraction levels, resulting in a more comprehensive representation of environmental dynamics. This capability is particularly advantageous in complex ecological systems, where interactions among physicochemical parameters are often nonlinear or interdependent.
From an operational perspective, the findings hold practical implications for water quality monitoring and management. Identifying an optimal parameter subset implies that accurate HAB forecasting can be achieved with a limited number of key indicators. This reduction in monitoring complexity not only lowers the cost and logistical burden associated with data collection but also facilitates the deployment of real-time models using field sensors. Consequently, water management authorities can implement proactive and cost-effective early warning systems to mitigate the adverse impacts of algal blooms on water supply and ecosystem health. The study also highlights areas for further investigation.
Although the concatenate-based ANN demonstrated superior predictive accuracy, several limitations should be acknowledged. First, the model relies exclusively on physicochemical parameters and does not incorporate biological interactions or remote sensing data. Guallar et al. [50] showed that biological variables (lagged algal abundances) contributed 30–40% of predictive information in absence-presence models, suggesting that incorporating such feedback could further improve performance. Future research should implement adaptive or online learning strategies to update model parameters as new data becomes available.
Second, the dataset, while spanning 20 years (2004–2024), may not fully capture extreme bloom events or long-term climate-induced shifts in algal dynamics. Third, the model was developed and validated using data from a single site (Midmar Dam), which may limit generalizability to other water bodies with different trophic states, hydrodynamics, or algal species assemblages. Paturi et al. [22] noted that most ANN-based HAB studies are concentrated in China, South Korea, and the United States, with limited application in African freshwater systems. While our study addresses this geographical gap, cross-validation across multiple South African dams (e.g., Nagle, Inanda, or Hazelmere) is needed to assess transferability.
Overall, this study demonstrates that the proposed concatenate-based ANN represents a significant advancement in data-driven HAB prediction. Its superior performance, efficient use of limited but informative features, and capacity to model nonlinear environmental relationships make it a promising computational tool for sustainable freshwater ecosystem management. The insights from this research provide a foundation for developing scalable, adaptive predictive frameworks applicable to other reservoirs and aquatic systems facing eutrophication and algal bloom challenges.
4. Conclusions
A recently developed Concatenate-Based ANN model for forecasting HABs in Midmar Dam, South Africa, was developed and evaluated in this study. The proposed architecture is based on a concatenation-driven feature fusion mechanism, in which intermediate representations from successive network layers are integrated to enhance the modeling of complex, nonlinear relationships among physicochemical variables. By leveraging two decades of water quality data, the proposed ANN demonstrated a significant enhancement in predictive accuracy compared to the conventional ANN, achieving the lowest observed error metrics (MAE = 0.101, RMSE = 0.163) and a higher NNSE (0.652) when trained with an optimal subset of five key features chlorophyll-a, temperature, dissolved oxygen, total dissolved solids, and ammonia (NH3). The findings highlight the crucial role of efficient feature selection and architectural optimization in enhancing machine learning applications for environmental prediction.
The superior performance of the concatenate-based ANN highlights its ability to capture the intricate dependencies that drive algal proliferation, thereby offering a more robust, stable, and interpretable framework for HAB forecasting. Furthermore, the identification of a parsimonious and informative feature set demonstrates that high predictive accuracy can be achieved with a limited number of input variables. This efficiency has practical implications for real-world water quality management, as it reduces monitoring costs, simplifies sensor deployment, and supports the implementation of automated early warning systems. The proposed modeling framework can thus serve as a valuable decision-support tool for water authorities to mitigate eutrophication risks and maintain ecosystem health.
Despite these contributions, several limitations should be acknowledged. First, the study is based on data from a single site (Midmar Dam), which may limit the model’s generalizability to other water bodies with different ecological characteristics. Second, although the dataset spans multiple years, it may not fully capture extreme events or rare bloom conditions. Third, the model relies primarily on physicochemical parameters, without incorporating additional drivers such as biological interactions or remote sensing data, which may also influence algal dynamics. Future research should address these limitations by validating the proposed framework across multiple geographic locations and diverse aquatic environments to enhance model generalization. The integration of additional data sources, like meteorological variables and satellite-derived observations, could further improve predictive accuracy and robustness. Moreover, the development of hybrid and ensemble learning approaches that integrate the concatenate-based ANN with other machine learning paradigms may enhance both performance and interpretability. Expanding the dataset through continuous monitoring and incorporating real-time data streams will be critical to deploying scalable, operational early warning systems. Overall, this study presents an efficient data-driven framework for HAB prediction, advancing machine learning applications in water quality monitoring and supporting sustainable freshwater ecosystem management under increasing environmental pressures.
Author Contributions
Conceptualization, A.A.M.S.I., T.W. and J.-R.T.; methodology, A.A.M.S.I., T.W., M.N. (Mfanasibili Nkonyane) and J.-R.T.; software, A.A.M.S.I.; validation, A.A.M.S.I., T.W. and J.-R.T.; formal analysis, A.A.M.S.I., T.W., M.N. (Mfanasibili Nkonyane), M.N. (Mlondi Ngcobo) and J.-R.T.; investigation, A.A.M.S.I., T.W. and J.-R.T.; resources A.A.M.S.I., T.W., M.N. (Mfanasibili Nkonyane), M.N. (Mlondi Ngcobo) and J.-R.T.; data curation, A.A.M.S.I., T.W., M.N. (Mfanasibili Nkonyane), M.N. (Mlondi Ngcobo) and J.-R.T.; writing—original draft preparation, A.A.M.S.I.; writing—review and editing, A.A.M.S.I., T.W. and J.-R.T.; visualization, A.A.M.S.I.; supervision, T.W. and J.-R.T.; project administration, T.W.; funding acquisition, T.W. All authors have read and agreed to the published version of the manuscript.
Funding
This research received no external funding.
Data Availability Statement
The data presented in this study are available on request from the corresponding authors. The data are not publicly available due to privacy restrictions.
Conflicts of Interest
Authors Mfanasibili Nkonyane and Mlondi Ngcobo were employed by Dube TradePort Corporation and Umngeni-Uthukela Water, respectively. The remaining authors declare that the research was conducted in the absence of any commercial or financial relationships that could be construed as a potential conflict of interest.
Abbreviations
The following abbreviations are used in this manuscript:
| ANN | Artificial Neural Network |
| ANFIS | Adaptive Neuro-Fuzzy Inference System |
| HABs | Harmful Algal Blooms |
| ML | Machine Learning |
| MSE | Mean Squared Error |
| RMSE | Root Mean Squared Error |
| MAE | Mean Absolute Error |
| DO | Dissolved Oxygen |
| TDS | Total Dissolved Solids |
| NH3 | Ammonia |
| NO3 | Nitrate |
| F | Fluoride |
| Fe | Iron |
| Chl-a | Chlorophyll-a |
| OLCI | Ocean and Land Color Imager |
| pH | Potential of Hydrogen |
| Temp | Temperature |
| Cond | Conductivity |
| Alkal | Alkalinity |
| WQI | Water Quality Index |
| CNN | Convolutional Neural Network |
| LSTM | Long Short-Term Memory |
| Coefficient of Determination | |
| KNN | K-Nearest Neighbors |
| KNNImputer | K-Nearest Neighbors Imputation Algorithm |
| MLP | Multilayer Perceptron |
| ELM | Extreme Learning Machine |
| MLR | Multiple Linear Regression |
| NNSE | Normalized Nash–Sutcliffe Efficiency |
References
- Fang, C.; Song, K.; Paerl, H.W.; Jacinthe, P.A.; Wen, Z.; Liu, G.; Tao, H.; Xu, X.; Kutser, T.; Wang, Z.; et al. Global divergent trends of algal blooms detected by satellite during 1982–2018. Glob. Change Biol. 2022, 28, 2327–2340. [Google Scholar] [CrossRef]
- Duan, H.; Wan, N.; Qiu, Y.; Liu, G.; Chen, Q.; Luo, J.; Chen, Y.; Qi, T. Discussions and practices on the framework of monitoring system in eutrophic lakes and reservoirs. J. Lake Sci. 2020, 32, 1396–1405. [Google Scholar] [CrossRef]
- Qian, R.; Peng, F.L.; Xue, K.; Qi, L.Y.; Duan, H.T.; Qiu, Y.G. Assessing the Risks of Harmful Algal Blooms Accumulation at Littoral Zone of Large Lakes and Reservoirs: An Example from Lake Chaohu. Lake Sci. 2021, 34, 49–60. [Google Scholar]
- Wells, M.L.; Trainer, V.L.; Smayda, T.J.; Karlson, B.S.; Trick, C.G.; Kudela, R.M.; Ishikawa, A.; Bernard, S.; Wulff, A.; Anderson, D.M.; et al. Harmful algal blooms and climate change: Learning from the past and present to forecast the future. Harmful Algae 2015, 49, 68–93. [Google Scholar] [CrossRef]
- Glibert, P.M. Harmful algae at the complex nexus of eutrophication and climate change. Harmful Algae 2020, 91, 101583. [Google Scholar] [CrossRef]
- Zhou, Z.X.; Yu, R.C.; Zhou, M.J. Evolution of harmful algal blooms in the East China Sea under eutrophication and warming scenarios. Water Res. 2022, 221, 118807. [Google Scholar] [CrossRef]
- Zhang, C. Current techniques for detecting and monitoring algal toxins and causative harmful algal blooms. J. Environ. Anal. Chem. 2015, 2, 1000123. [Google Scholar]
- Zhang, H.; Sun, D.; Li, J.; Qiu, Z.; Wang, S.; He, Y. Remote sensing algorithm for detecting green tide in China coastal waters based on GF1-WFV and HJ-CCD data. Acta Opt. Sin. 2016, 36, 0601004. [Google Scholar] [CrossRef]
- Deng, R.; Zhu, T.; Zhou, W.; Liu, F.; Lin, X. Machine learning based water quality evolution and pollution identification in reservoir type rivers. Environ. Pollut. 2025, 382, 126668. [Google Scholar] [CrossRef]
- Sun, Y.; Wang, D.; Li, L.; Ning, R.; Yu, S.; Gao, N. Application of remote sensing technology in water quality monitoring: From traditional approaches to artificial intelligence. Water Res. 2024, 267, 122546. [Google Scholar] [CrossRef] [PubMed]
- Joshi, N.; Park, J.; Zhao, K.; Londo, A.; Khanal, S. Monitoring harmful algal blooms and water quality using sentinel-3 OLCI satellite imagery with machine learning. Remote Sens. 2024, 16, 2444. [Google Scholar] [CrossRef]
- Jia, Y.; Xiao, Z.; Yang, L.; Liu, Q.; Jin, S.; Lv, Y.; Yan, Q. Enhancing algal bloom level monitoring with CYGNSS and Sentinel-3 data. Remote Sens. 2024, 16, 3915. [Google Scholar] [CrossRef]
- Busari, I.; Sahoo, D.; Harmel, R.D.; Haggard, B.E. A review of machine learning models for harmful algal bloom monitoring in freshwater systems. J. Nat. Resour. Agric. Ecosyst. 2023, 1, 63–76. [Google Scholar] [CrossRef]
- Yi, H.S.; Park, S.; An, K.G.; Kwak, K.C. Algal bloom prediction using extreme learning machine models at artificial weirs in the Nakdong River, Korea. Int. J. Environ. Res. Public Health 2018, 15, 2078. [Google Scholar] [CrossRef]
- Heddam, S.; Yaseen, Z.M.; Falah, M.W.; Goliatt, L.; Tan, M.L.; Sa’adi, Z.; Ahmadianfar, I.; Saggi, M.; Bhatia, A.; Samui, P. Cyanobacteria blue-green algae prediction enhancement using hybrid machine learning–based gamma test variable selection and empirical wavelet transform. Environ. Sci. Pollut. Res. 2022, 29, 77157–77187. [Google Scholar] [CrossRef]
- Izadi, M.; Sultan, M.; Kadiri, R.E.; Ghannadi, A.; Abdelmohsen, K. A remote sensing and machine learning-based approach to forecast the onset of harmful algal bloom. Remote Sens. 2021, 13, 3863. [Google Scholar] [CrossRef]
- Uguz, S.; Sahin, Y.S.; Kumar, P.; Yang, X.; Anderson, G. Real-Time Algal Monitoring Using Novel Machine Learning Approaches. Big Data Cogn. Comput. 2025, 9, 153. [Google Scholar] [CrossRef]
- Sumanasekara, H.; Jayasingha, H.; Amarasooriya, G.; Dayarathne, N.; Mainali, B.; Senevirathna, L.; Gamage, A.; Merah, O. Hybrid Machine Learning Models for Predicting the Impact of Light Wavelengths on Algal Growth in Freshwater Ecosystems. Phycology 2025, 5, 23. [Google Scholar] [CrossRef]
- Rostam, N.A.P.; Malim, N.H.A.H.; Abdullah, R.; Ahmad, A.L.; Ooi, B.S.; Chan, D.J.C. A complete proposed framework for coastal water quality monitoring system with algae predictive model. IEEE Access 2021, 9, 108249–108265. [Google Scholar] [CrossRef]
- Park, S.; Sin, Y. Artificial neural network (ANN) modeling analysis of algal blooms in an estuary with episodic and anthropogenic freshwater inputs. Appl. Sci. 2021, 11, 6921. [Google Scholar] [CrossRef]
- Wei, B.; Sugiura, N.; Maekawa, T. Use of artificial neural network in the prediction of algal blooms. Water Res. 2001, 35, 2022–2028. [Google Scholar] [CrossRef]
- Paturi, U.M.R.; Ramesh, C.; Muppala, M.; Mekala, R.R.; Kasu, S.R.; Reddy, N.S. Artificial Neural Networks for Modeling Harmful Algal Blooms: A Review. Mar. Ecol. 2025, 46, e70037. [Google Scholar] [CrossRef]
- Caballero, C.B.; Martins, V.S.; Paulino, R.S.; Butler, E.; Sparks, E.; Lima, T.M.; Novo, E.M. The need for advancing algal bloom forecasting using remote sensing and modeling: Progress and future directions. Ecol. Indic. 2025, 172, 113244. [Google Scholar] [CrossRef]
- Zuse Rousso, B.; Bertone, E.; Stewart, R.; Hamilton, D.P. A systematic literature review of forecasting and predictive models for cyanobacteria blooms in freshwater lakes. Water Res. 2020, 182, 115959. [Google Scholar] [CrossRef] [PubMed]
- Yan, Z.; Kamanmalek, S.; Alamdari, N. Predicting coastal harmful algal blooms using integrated data-driven analysis of environmental factors. Sci. Total Environ. 2024, 912, 169253. [Google Scholar] [CrossRef]
- Shen, J.; Qin, Q.; Wang, Y.; Sisson, M. A data-driven modeling approach for simulating algal blooms in the tidal freshwater of James River in response to riverine nutrient loading. Ecol. Model. 2019, 398, 44–54. [Google Scholar] [CrossRef]
- Zhi, W.; Appling, A.P.; Golden, H.E.; Podgorski, J.; Li, L. Deep learning for water quality. Nat. Water 2024, 2, 228–241. [Google Scholar] [CrossRef] [PubMed]
- Graham, P.M. Modelling the Water Quality in Dams Within the Umgeni Water Operational Area with Emphasis on Algal Relations. Doctoral Dissertation, North-West University, Potchefstroom, South Africa, 2007. [Google Scholar]
- Makaba, T.; Dogo, E. A comparison of strategies for missing values in data on machine learning classification algorithms. In 2019 International Multidisciplinary Information Technology and Engineering Conference (IMITEC); IEEE: Piscataway, NJ, USA, 2019; pp. 1–7. [Google Scholar]
- Juna, A.; Umer, M.; Sadiq, S.; Karamti, H.; Eshmawi, A.A.; Mohamed, A.; Ashraf, I. Water quality prediction using KNN imputer and multilayer perceptron. Water 2022, 14, 2592. [Google Scholar] [CrossRef]
- Ibrahim, A.A.M.; Nkonyane, M.; Ngcobo, M.; Walingo, T.; Tapamo, J.R. Data-Driven Machine Learning Models for E. coli Concentration Prediction. Sustainability 2025, 18, 179. [Google Scholar] [CrossRef]
- Aslam, B.; Maqsoom, A.; Cheema, A.H.; Ullah, F.; Alharbi, A.; Imran, M. Water quality management using hybrid machine learning and data mining algorithms: An indexing approach. IEEE Access 2022, 10, 119692–119705. [Google Scholar] [CrossRef]
- Palani, S.; Liong, S.Y.; Tkalich, P. An ANN application for water quality forecasting. Mar. Pollut. Bull. 2008, 56, 1586–1597. [Google Scholar] [CrossRef] [PubMed]
- Khan, Y.; Chai, S.S. Ensemble of ANN and ANFIS for water quality prediction and analysis-a data driven approach. J. Telecommun. Electron. Comput. Eng. (JTEC) 2017, 9, 117–122. [Google Scholar]
- Krenker, A.; Bešter, J.; Kos, A. Introduction to the artificial neural networks. In Artificial Neural Networks: Methodological Advances and Biomedical Applications; InTech: Singapore, 2011; pp. 1–18. [Google Scholar]
- Maier, H.R.; Galelli, S.; Razavi, S.; Castelletti, A.; Rizzoli, A.; Athanasiadis, I.N.; Sànchez-Marrè, M.; Acutis, M.; Wu, W.; Humphrey, G.B. Exploding the myths: An introduction to artificial neural networks for prediction and forecasting. Environ. Model. Softw. 2023, 167, 105776. [Google Scholar] [CrossRef]
- Lee, J.H.; Huang, Y.; Dickman, M.; Jayawardena, A.W. Neural network modelling of coastal algal blooms. Ecol. Model. 2003, 159, 179–201. [Google Scholar] [CrossRef]
- Recknagel, F.; French, M.; Harkonen, P.; Yabunaka, K.I. Artificial neural network approach for modelling and prediction of algal blooms. Ecol. Model. 1997, 96, 11–28. [Google Scholar] [CrossRef]
- Yabunaka, K.I.; Hosomi, M.; Murakami, A. Novel application of a back-propagation artificial neural network model formulated to predict algal bloom. Water Sci. Technol. 1997, 36, 89–97. [Google Scholar] [CrossRef]
- Singh, Y.; Walingo, T. Smart water quality monitoring with IoT wireless sensor networks. Sensors 2024, 24, 2871. [Google Scholar] [CrossRef]
- Mallik, S.; Chakraborty, A.; Mishra, U.; Paul, N. Prediction of irrigation water suitability using geospatial computing approach: A case study of Agartala city, India. Environ. Sci. Pollut. Res. 2023, 30, 116522–116537. [Google Scholar] [CrossRef] [PubMed]
- Demiray, B.Z.; Mermer, O.; Baydaroglu, Ö.; Demir, I. Predicting Harmful Algal Blooms Using Explainable Deep Learning Models: A Comparative Study. Water 2025, 17, 676. [Google Scholar] [CrossRef]
- Moriasi, D.N.; Arnold, J.G.; Van Liew, M.W.; Bingner, R.L.; Harmel, R.D.; Veith, T.L. Model evaluation guidelines for systematic quantification of accuracy in watershed simulations. Trans. ASABE 2007, 50, 885–900. [Google Scholar] [CrossRef]
- Nossent, J.; Bauwens, W. Application of a normalized Nash-Sutcliffe efficiency to improve the accuracy of the Sobol’sensitivity analysis of a hydrological model. In EGU General Assembly Conference Abstracts; EGU: Munich, Germany, 2012; p. 237. [Google Scholar]
- Mathevet, T.; Michel, C.; Andréassian, V.; Perrin, C. A bounded version of the Nash-Sutcliffe criterion for better model assessment on large sets of basins. IAHS Publ. 2006, 307, 211. [Google Scholar]
- Jiang, Y.; Song, Y.; Liu, J.; Liu, H.; Zang, X.; Ji, Z. Machine learning assisted precise prediction of algae bloom in large-scale water diversion engineering. Desalination 2025, 610, 118880. [Google Scholar] [CrossRef]
- Nafsin, N.; Li, J. Prediction of total organic carbon and E. coli in rivers within the Milwaukee River basin using machine learning methods. Environ. Sci. Adv. 2023, 2, 278–293. [Google Scholar] [CrossRef]
- Sakaa, B.; Elbeltagi, A.; Boudibi, S.; Chaffaï, H.; Islam, A.R.M.T.; Kulimushi, L.C.; Choudhari, P.; Hani, A.; Brouziyne, Y.; Wong, Y.J. Water quality index modeling using random forest and improved SMO algorithm for support vector machine in Saf-Saf river basin. Environ. Sci. Pollut. Res. 2022, 29, 48491–48508. [Google Scholar] [CrossRef]
- Ly, Q.V.; Nguyen, X.C.; Lê, N.C.; Truong, T.D.; Hoang, T.H.T.; Park, T.J.; Maqbool, T.; Pyo, J.; Cho, K.H.; Lee, K.S.; et al. Application of Machine Learning for eutrophication analysis and algal bloom prediction in an urban river: A 10-year study of the Han River, South Korea. Sci. Total Environ. 2021, 797, 149040. [Google Scholar] [CrossRef] [PubMed]
- Guallar, C.; Delgado, M.; Diogène, J.; Fernández-Tejedor, M. Artificial neural network approach to population dynamics of harmful algal blooms in Alfacs Bay (NW Mediterranean): Case studies of Karlodinium and Pseudo-nitzschia. Ecol. Model. 2016, 338, 37–50. [Google Scholar] [CrossRef]

Disclaimer/Publisher’s Note: The statements, opinions and data contained in all publications are solely those of the individual author(s) and contributor(s) and not of MDPI and/or the editor(s). MDPI and/or the editor(s) disclaim responsibility for any injury to people or property resulting from any ideas, methods, instructions or products referred to in the content. |
© 2026 by the authors. Licensee MDPI, Basel, Switzerland. This article is an open access article distributed under the terms and conditions of the Creative Commons Attribution (CC BY) license.