Abstract
Although it is the wettest continent, droughts are a regular occurrence in South America. As the effects of anthropogenic influences, including climate change, become more pronounced, droughts are expected to increase in frequency and severity. The purpose of this study is to assess the relative drought vulnerability of the countries in South America. Each country is evaluated for drought exposure, sensitivity, adaptive capacity, and overall vulnerability. Sixteen drought-related indicators were used to measure the relative vulnerability of each country and to measure separate scores for exposure, sensitivity, and adaptive capacity to identify what factor(s) contributed to a country’s vulnerability. The results indicate that Ecuador, a country with a high population and limited water resources, is the most vulnerable to drought in South America, followed by Colombia and Uruguay. Conversely, the country least vulnerable to drought is Guyana, followed by Suriname and Chile. Our analysis suggests that there are both geographic and as well as economic factors influencing the relative drought vulnerability of countries in South America.
1. Introduction
Drought is repeatedly recognized as one of the deadliest and most financially costly climate hazards globally [,,,]. South America is the wettest continent on Earth, with extensive rainforests and an estimated 20% of its area being wetlands []. Yet, the continent regularly experiences drought [], and some of them have been severe. Recent extreme droughts include the following:
- In the summer and fall of 2001, Brazil experienced widespread droughts, which limited the country’s hydropower production to the degree that the national government-imposed energy conservation measures [].
- In the southern hemisphere summer of 2008/2009 (December–February), an extreme drought caused hydropower production to drop to 20% in Uruguay, a country that relies on hydropower for 80% of its national energy supply. The same drought reduced grain production by 39% in Argentina and killed 1.5 million of the country’s livestock [].
- The Chilean megadrought started in 2010 and is the worst drought on the continent in 1000 years [,]. Precipitation deficit estimates range from 20–40% to 25–70% [] and in combination with heightened temperatures, water reservoirs have dried out [,], leaving over half a million people relying on water truck deliveries in central Chile in 2020 [,]. The drought has also led to extensive agricultural losses, including the loss of tens of thousands of farm animals, and in August 2019 an agricultural emergency was declared for 50 municipalities by the Chilean Ministry of Agriculture []. While the drought was triggered by a decrease in precipitation, studies have indicated that the drought severity and societal impacts were further exacerbated by poor water management [,].
- In 2005, a drought in the Amazon caused the first ever recorded negative annual carbon balance for the rainforest as wildfires triggered by the drought released massive amounts of carbon into the atmosphere []. In 2010, a stronger, more destructive drought hit the Amazon, causing the second-ever negative annual carbon balance [].
- In northeastern Brazil, extreme droughts were recorded in 2012 and 2016, which both surpassed the severity of the 2005 and 2010 droughts and caused shortages of drinking and irrigation water and hydroelectric energy for the region [].
- The Amazon River Basin faced severe drought conditions in 2023–2024, facing the most severe conditions since monitoring started in 1954 []. In January 2025, the region, which entered rainy season in December, is experiencing below average rainfall; however, with La Niña conditions persisting from February to April and typically bringing above-average rainfall, recovery from drought conditions is a possibility [].
A relatively large percentage of the population in South America is employed in the agricultural sector [,]. Due to many South American countries’ reliance on agriculture for food production, extreme droughts can cause food shortages and severe economic impacts. In 2012, the Paraguayan government declared a state of food security emergency after 263,800 families lost crops in a drought []. The drought not only affected staple crops such as sesame, cotton, soybean, and corn, but limited the distribution of food along rivers and canals due to low water levels and created a lack of sufficient potable water for domestic use []. The total agricultural production decreased by 30–50% []. The 2012 Paraguayan Drought was especially damaging for indigenous groups, with over 313 indigenous communities reported as being affected by the food and water scarcity [].
A significant body of research has linked hydrologic extremes in South America to natural variability of sea surface temperatures in the Pacific Ocean [,,,,]. The impacts vary geographically, with warm El Niño–Southern Oscillation (ENSO) events typically bringing drier than average conditions to the Amazon and northeastern South America but flooding on the west coast and southeastern part of the continent. Conversely, cool ENSO events (La Niña) tend to produce higher rainfall in northern South America and dry conditions in Argentina and southern Brazil [,]. Influence on precipitation is also asserted by the variability in temperature of the Atlantic Ocean, but this influence primarily serves to strengthen or dampen the impact of the concurrent ENSO, rather than independently changing the seasonal precipitation patterns [,,]. Recent research has also indicated that ENSO-triggered droughts in the Amazon Basin (which drains major parts of Brazil, Bolivia, Peru, Ecuador, and Colombia, as well as small parts of Venezuela, Guyana, Suriname and French Guiana), are further enhanced by the Indian Ocean Dipole [].
The occurrence of multiple extreme droughts in the last 20 years seems to suggest that other factors at play drive drought in South America, and some studies point to climate change as a source of the increase in the severity of droughts and associated hazards on the continent [,,,]. The global warming trend and other anthropogenic influences such as deforestation and the use of fire to clear land are anticipated to enhance risks of drought in the future and initiate a tipping point for much of the Amazon to a drier, non-forested ecosystem [,].
Droughts impact every community and country differently. A significant portion of drought vulnerability studies are regional in their character and focus on variations in vulnerability over a relatively limited geographical space, often a region of high agricultural value, such as the state of Nebraska (U.S.), Narmada River Basin (India), Southeast Iran, and Turkey [,,,]. Larger-scale continental studies have mainly been covering Europe [,,,], particularly the data-rich countries of the European Union. Africa, which is frequently subject to devastating droughts, has also been evaluated on the continental scale [,,]. However, large-scale studies for the other continents are still missing. The aim of this study is to investigate which countries in South America are the most vulnerable to droughts, recognizing their unique climates, landscapes, economies, and people, and identify what contributes to their vulnerability. The paper is organized in the following order: introduction; presentation of data and methods, including the framework for drought vulnerability assessment; presentation of the results; discussion of the findings; and conclusion.
2. Methods
There are various ways to define and estimate societal hazard vulnerability [,,,,]. When it comes to climate hazard vulnerability, a common approach is to define vulnerability as a function of exposure, sensitivity, and adaptive capacity [,,]. Exposure can be described as the extent to which a system or population encounters a hazard or stressor. Sensitivity is to what degree people are affected. In a study of this scale, this is very much linked to the economic situation and activities of each country. Both exposure and sensitivity are positively correlated with vulnerability. Adaptive capacity, on the other hand, is negatively correlated with vulnerability, and can be described as a measure of a country’s ability to prepare and/or respond to the adverse effects of the climate hazard [,,].
2.1. Indicators
There is no established approach for selecting vulnerability indicators []. While some vulnerability/resilience datasets have been developed for different countries, such as the Social Vulnerability Index [] and the Baseline Resilience Indicators for Communities [] for the United States, this study requires data that are available for multiple countries. Following the framework of Engstrom et al. [], the indicators also needed to reflect the social, economic, cultural, and institutional setting of each country, and be quantifiable. Sixteen drought-related indicators were identified and used to measure the relative vulnerability of each country in South America. Each indicator was categorized as either being related to drought exposure, sensitivity, or adaptive capacity. While the choice of indicators is inherently subjective, the determinations were made by considering the unique physical, socio-economic, and cultural profile of South America. Recognizing that some indicators have year-to-year variability, all of the indicator data were collected as five-year averages from 2016 to 2020.
2.2. Exposure Indicators
Water Stress
Water stress is a measure of a country’s freshwater withdrawal as a proportion of available freshwater resources. The indicator includes freshwater used in all economic activities as a percentage of annual renewable freshwater resources. This indicator is calculated by the United Nations Food and Agricultural Organization as an indicator of progress towards the Sustainable Development Goal 6 “to ensure availability and sustainable management of water and sanitation for all by 2030”. Water stress data were sourced from AQUASTAT, the Food and Agriculture Organization (FAO) of the United Nations’s global information system on water resources and management [].
Population Density
Population density measures the number of inhabitants per square kilometer. Drought exposure is partially determined by the number of entities at risk. The more people in an area, the more people the drought can impact []. The information for this indicator was sourced from AQUASTAT [].
Total Renewable Water Resources per Capita
This indicator measures the quantity of renewable water resources per inhabitant per year. The quantity of renewable water available indicates how a nation may be affected by drought events. A higher amount of renewable water resources signifies countries are better able to withstand periods of low precipitation. Information for this indicator was sourced from AQUASTAT [].
2.3. Sensitivity Indicators
Agriculture
This indicator measures the percentage of a country’s GDP that is due to agriculture. The agricultural sector is often the most severely impacted by droughts. Crop failures and pasture losses lead to a direct impact on the economy []. The more reliant a country is on agriculture for GDP, the more sensitive their economy is to drought impacts. Information for this indicator was sourced from AQUASTAT [].
Cattle Density
The number of cattle per square kilometer is included as an indicator, as cattle ranching is culturally and economically significant in parts of South America [,] and cattle require significant amounts of water throughout their life cycle []. Having large herds of cattle (high density) makes a country sensitive to drought because of the impact it can have on feed production and cattle drinking water. The data on cattle density were collected from AQUASTAT [].
Dam Capacity Per Capita
Dams and reservoirs are key aspects of infrastructure that mitigate water scarcity. During droughts, dams serve a key role in providing water to surrounding communities. They can also ensure downstream flow rates to limit impacts on ecosystems and river transportation []. This indicator measures the total cumulative storage capacity of all dams in a country per capita []. The greater the ability to store water, the less sensitive a country will be to drought.
Human Development Index
The Human Development Index (HDI) was created by the United Nations to provide a statistical measure of a country’s achievements in human development, including indices on life expectancy at birth, expected years of schooling, mean years of schooling, and gross national income per capita []. The three pillars of human development, namely education, health, and income distribution, significantly affect the ability of a country to handle drought impacts. Education is considered a crucial strategy to identifying regional solutions for drought impacts [], health conditions represent a country’s ability to handle drought-related health crises from malnutrition or poor water quality, and drought impacts are typically exacerbated in poorer areas [].
Prevalence of Undernourishment
Droughts frequently reduce agricultural production and increase food insecurity in affected areas. Nations characterized by a pronounced prevalence of undernourishment even during “normal” conditions are particularly susceptible to experiencing acute food insecurity during drought episodes. This indicator reports the average percentage of a population undernourished over three years. The data for this indicator are presented as averages of five years of three-year means. Data were sourced from AQUASTAT [].
Access to Safe Drinking Water
This indicator quantifies the proportion of a country’s population that has access to potable water. Droughts exert strain on communal water infrastructures, often heightening water insecurity. Common water-related hazards during droughts include depleted water-distribution systems and diminished water pressure. Additionally, droughts pose challenges to water management, such as compromised water quality and damaged pipelines []. For nations grappling with water supply issues, droughts serve to compound existing stresses. The information for this indicator was sourced from AQUASTAT [].
Share of Electricity Production from Hydropower
South America is the global region the relies the most on hydropower for the electricity supply []. Given the physical geography of South America, with ample precipitation and complex topography dominating a major part of the continent, it is no surprise that hydropower is one of the main sources of electricity. On average, the countries included in the analysis receive 49% of their electricity from hydropower []. Brazil is the second largest hydropower producer in the world, and supplies about 60% of its electricity needs from this source. Paraguay receives close to 100% of its electricity from hydropower []. While a high dam storage capacity per capita is considered positive, as it can serve to safeguard water supply at times of drought, a high reliance on hydropower for a country’s electricity supply makes the country vulnerable to dry conditions, as it can cause power shortages. Recognizing that hydropower production varies from year-to-year due to climate variability, the share of electricity from hydropower included in this analysis is an average of the production for the years 2016–2020 [].
Freshwater Fish as Food Supply
Fisheries are an important source of protein and income in South America. Aquaculture is growing, and the consumption of fish is expected to increase in the future []. During periods of drought, fish populations dramatically change as river and lake levels fall. Usually, fish populations become less abundant during and after droughts [,]. Populations that heavily rely on freshwater fish as a food source can face food insecurity and economic decline if the impacts on the freshwater system are severe. This indicator measures freshwater fish consumption in kilograms per capita per year and is sourced from AQUASTAT [].
2.4. Adaptive Capacity Indicators
Percent of Cultivated Land Irrigated
Irrigation is an important strategy to mitigate the impacts of droughts on agriculture, helping to ensure food security and income without relying on natural precipitation. Countries with a higher percentage of their agricultural lands equipped for irrigation are better prepared to handle droughts. This indicator includes the total percentage of all agricultural lands that are actively irrigated. Information for this indicator was sourced from AQUASTAT [].
Desalinated Water Produced
Desalination is the process of converting salt water (often ocean water) into freshwater for human consumption or agricultural needs. This indicator measures the amount of desalinated water produced by a country per year. Desalination is considered a drought-proof water source because it does not depend on rainfall, river levels, or reservoirs; however, it is also extremely expensive and energy-intensive, requiring large amounts of capital, infrastructure, and engineering expertise. Despite this, some countries such as Spain and South Africa have turned to desalination as an alternative water source and are less vulnerable to drought as a result [,]. Some countries in South America use desalination as part of their regular water supply, albeit to a limited extent. Based on data from AQUASTAT [], this indicator was made binary, giving a value of one to countries that do not have a set up for significant freshwater production via desalination and a zero to countries that can produce 10,000,000 m3 or more per year.
GDP per Capita
While droughts can have severe economic impacts on developed and developing countries, a higher GDP is associated with higher economic diversification. Countries with higher GDP per capita typically have more robust manufacturing and service sectors that can mitigate the agricultural effects of drought. Additionally, a higher GDP indicates more money that can be invested in drought-mitigating infrastructure such as irrigation systems, desalination plants, and reservoirs. Information for this indicator was sourced from AQUASTAT [].
Drought Plan
Drought plans are comprehensive documents that illustrate the strategies a country has put into place to mitigate the effects of drought and combat desertification. Having a protocol in place for drought situations indicates that a country has considered and prepared for drought conditions. As a binary indicator, if a country has a drought plan in effect, no matter the age, it will receive a score of zero, while a country with no drought plan will receive a score of one. Drought plans were sourced from the United Nations Convention to Combat Desertification [].
Using the 16 indicators selected, a score for each category: exposure, sensitivity, adaptive capacity, and total vulnerability was calculated. The scores were calculated by scaling each indicator from 0 to 1 (Equation (1)), where a score of 0 was given to the country that was the least vulnerable based on that indicator, and a score of 1 was given to the country that was the most vulnerable based on that indicator.
is the normalized value of the indicator and is the raw value of the indicator. Equation (1) was used for indicators that were estimated to be positively correlated with vulnerability. For indicators that were estimated to be negatively correlated with vulnerability, Equation (2) was used:
Following, the scaled indicator values were averaged for each category to receive one score for exposure, sensitivity, adaptive capacity, and total vulnerability for each country. Total vulnerability was calculated by averaging the exposure, sensitivity, and adaptive capacity values for each country. The average values for each category were scaled again from 0 to 1 to determine the relative ranking of each country from lowest to highest for exposure, sensitivity, adaptive capacity, and total vulnerability. A visual representation of the process is provided in Figure 1.
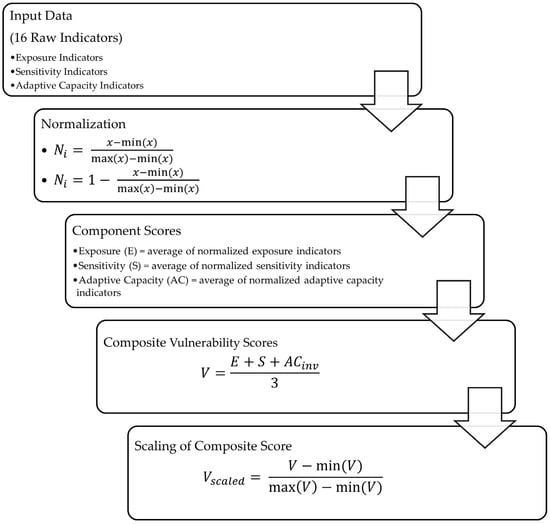
Figure 1.
Process flow diagram of index construction from raw data to vulnerability calculation.
The scaled scores were grouped into three categories, labeled “low”, “medium”, and “high”, using the Jenks Natural Breaks algorithm []. This method groups similar values and creates class breaks where large data differences occur, enhancing contrast and organizing features into distinct categories. To assess robustness, a secondary trial was completed. In the original trial, each indicator was assigned equal weight when calculating scores for exposure, sensitivity, adaptive capacity, and overall vulnerability. In reality, the indicators contribute different amounts to a country’s drought vulnerability; however, it is beyond the scope of this research to determine the relative weights of each indicator. To account for this, a randomly generated set of 1000 weights from 0 to 1 was applied to the indicators for each country, simulating different scenarios where the indicators were weighted differently.
3. Results
3.1. Exposure
The countries found to have the highest drought exposure are Ecuador, Argentina, and Uruguay. The countries found to have the lowest drought exposure are Bolivia, Suriname, and Guyana.
Figure 2 demonstrates the geographical patterns associated with drought exposure. The western and southern portions of the continent primarily received high scores for exposure while eastern and central South America received moderate scores. The two countries receiving the lowest scores, Guyana and Suriname are located on the northern coast of the continent in a region dominated by rainforests and high precipitation. Table 1 shows the relative ranking of all the countries in the analysis.
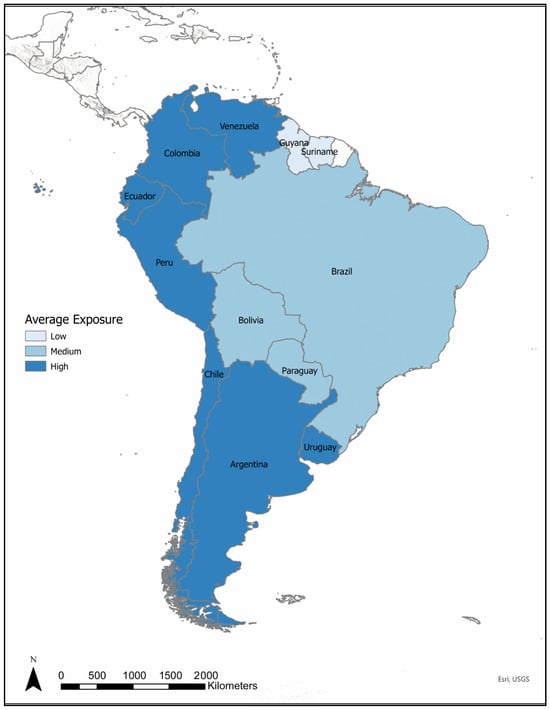
Figure 2.
Map of South America categorized by degrees of exposure. Countries with high exposure are colored with the darkest shade of blue, while countries with low exposure are colored with the lightest shade of blue.

Table 1.
Ranking of the countries of South America from lowest to highest for each category, comprising drought vulnerability and for the total vulnerability score. Ecuador is the most vulnerable country, and Guyana is the least vulnerable. Readers should be aware that the adaptive capacity is inverted, meaning that Bolivia and Uruguay have the lowest adaptive capacity, while Peru has the highest.
3.2. Sensitivity
The countries found to have the highest drought sensitivity are Paraguay, Ecuador, and Colombia. The countries found to have the lowest drought sensitivity are Suriname, Argentina, and Chile.
In Figure 3, we observe a different geographic pattern than that seen for drought exposure. For sensitivity, the northwest region of the continent—extending from Paraguay to Venezuela—receives the highest score for sensitivity, while the southern countries of Argentina and Chile receive low scores. The eastern half of the continent scores moderately. Table 1 shows the relative ranking of all the countries in the analysis.
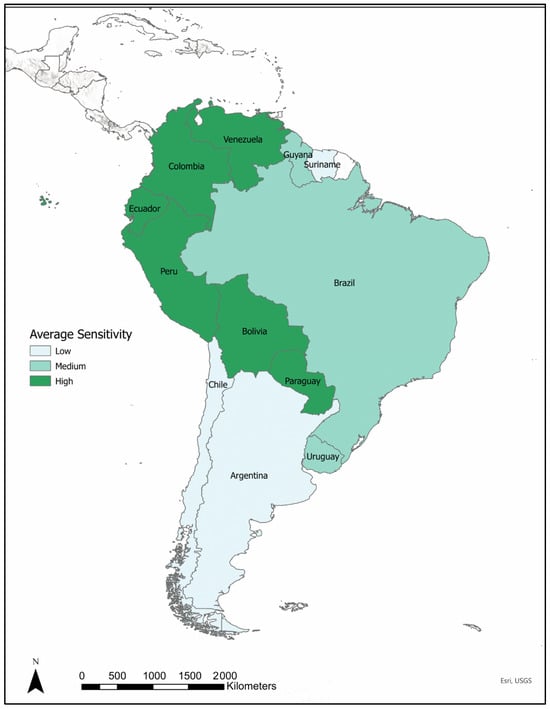
Figure 3.
Map of South America categorized by degrees of sensitivity. Countries with high sensitivity are colored with the darkest shade of green, while countries with low sensitivity are colored with the lightest shade of green.
3.3. Adaptive Capacity
In contrast to exposure and sensitivity, a higher score for adaptive capacity means a country is more vulnerable to drought. In this case, when the scores for adaptive capacity are scaled, a score of 1 is given to the country that has the lowest adaptive capacity (least prepared to handle a drought), and a score of 0 is given to the country that has the highest adaptive capacity (most prepared to handle a drought). The countries found to have the lowest adaptive capacities are Paraguay, Bolivia, and Uruguay. The countries found to have the highest adaptive capacities, from highest to lowest, are Peru, Chile, and Venezuela (Figure 4). Table 1 shows the relative ranking of all the countries in the analysis.
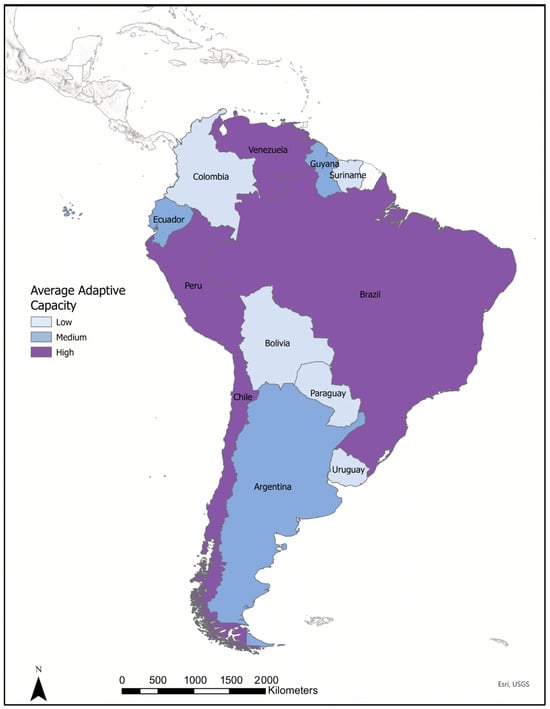
Figure 4.
Map of South America categorized by degrees of adaptive capacity. Countries with high adaptive capacity are colored with the darkest shade of purple, while countries with low adaptive capacity are colored with the lightest shade of purple.
3.4. Total Vulnerability
The relative drought vulnerability of a country was calculated as the average of the exposure, sensitivity, and adaptive capacity scores, and then scaled from 0 to 1. The countries found to have the highest relative vulnerability are Ecuador, Colombia, and Uruguay. The countries found to have the lowest total vulnerability are Chile, Suriname, and Guyana.
Since total vulnerability is a function of the average scores of each country for exposure, sensitivity, and adaptive capacity, the resulting map, Figure 5, is a conglomeration of the above geographic distributions. The drier eastern half of the continent, except for Chile, received higher vulnerability scores than the western half. In addition, countries with low adaptive capacity scores such as Colombia and Uruguay also received high scores for total vulnerability. Table 1 shows the relative ranking of all the countries in the analysis.
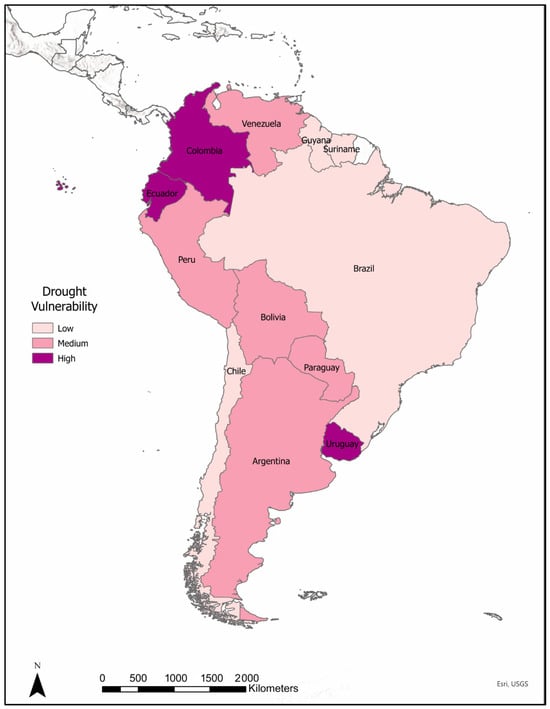
Figure 5.
Map of South America categorized by degrees of total vulnerability. Countries with high vulnerability are colored with the darkest shade of pink, while countries with low vulnerability are colored with the lightest shade of pink.
The approach of giving exposure, sensitivity, and adaptive capacity equal weight in the vulnerability calculation assumes that each category and indicator act equally in making a country vulnerable to drought. To account for this, a sensitivity analysis was completed (see Section 2). Figure 6, Figure 7, Figure 8 and Figure 9 are box plots showing the median and scaled scores for exposure, sensitivity, adaptive capacity, and total vulnerability, as they were re-calculated for each country using the weighted indicator sets. The boxplots include red dots that represent the value calculated in the original trial. Based on the initial results and the secondary trial, the averages of the secondary trial were found to be consistent with the relative rankings reported in Table 1 and Figure 2, Figure 3, Figure 4 and Figure 5.
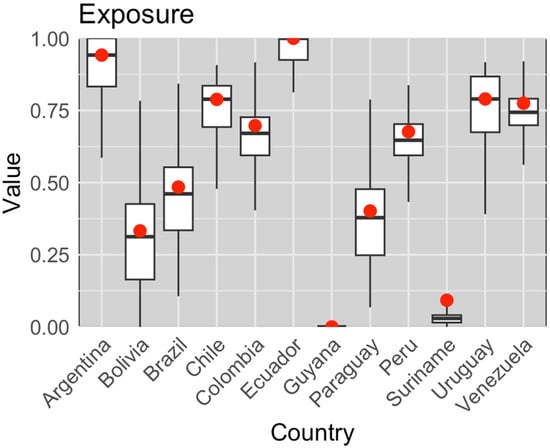
Figure 6.
Boxplot of drought exposure scores for countries in South America across 1000 random weighted scenarios and original values. The box represents an interquartile range (IQR) with the median represented by a bold horizontal line. The red dots represent the original scores calculated in the initial trial. This plot was used to assess the robustness of the original, equally weighted results.
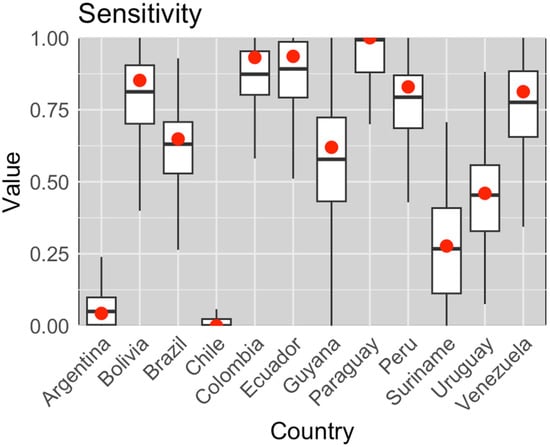
Figure 7.
Boxplot of drought sensitivity scores for countries in South America across 1000 random weighting scenarios and original values. The box represents an interquartile range (IQR) with the median represented by a bold horizontal line. The red dots represent the original scores calculated in the initial trial. This plot was used to assess the robustness of the original, equally weighted results.
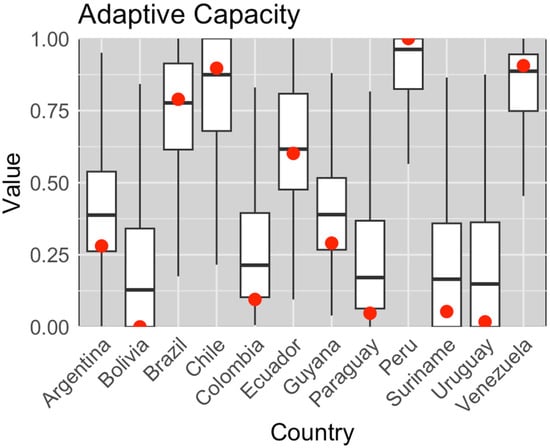
Figure 8.
Boxplot of adaptive capacity scores for countries in South America across 1000 random weighting scenarios and original values. The box represents an interquartile range (IQR) with the median represented by a bold horizontal line. The red dots represent the original scores calculated in the initial trial. A higher adaptive capacity value for this figure represents a country that is less vulnerable to drought in regard to this measure. This plot was used to assess the original, equally weighted results.
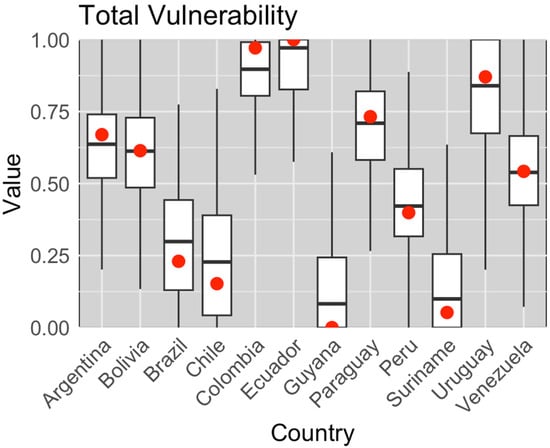
Figure 9.
Boxplot of drought vulnerability scores for countries in South America across 1000 random weighting scenarios and original values. The box represents an interquartile range (IQR) with the median represented by a bold horizontal line. The red dots represent the original scores calculated in the initial trial. This plot was used to assess the original, equally weighted results.
Figure 10 and Figure 11 show the proportions of the entire continent that have low, medium, and high vulnerability for land area and population. Over half of the continent in both land area and population have low vulnerability.
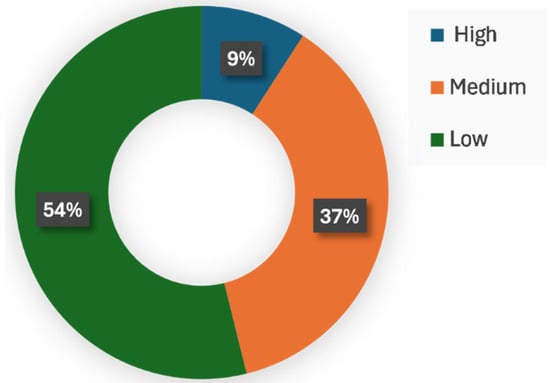
Figure 10.
Proportion of South America categorized by drought vulnerability level by land area. The donut chart displays the distribution of the land area of South America across three vulnerability tiers: high, medium, and low. This classification reflects aggregated measures of exposure, sensitivity, and adaptive capacity based on available national indicators.
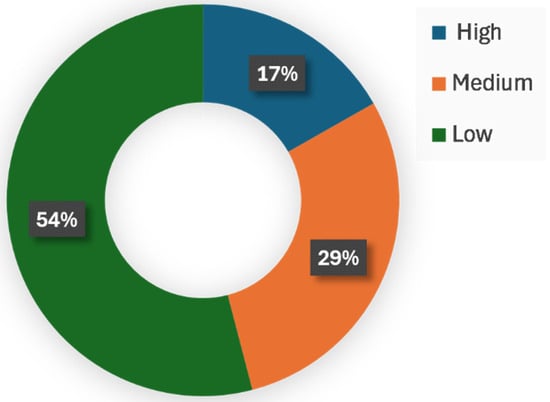
Figure 11.
Proportion of South America categorized by drought vulnerability level by population. The donut chart displays the distribution of the population of South America across three vulnerability tiers: high, medium, and low. This classification reflects aggregated measures of exposure, sensitivity, and adaptive capacity based on available national indicators.
4. Discussion
4.1. Findings
This study, analyzing the relative drought vulnerability of the South American nations, is the first of its kind. By analyzing different factors that could make a country vulnerable to drought, a ranking was presented, showing what countries are more vulnerable, and whether that vulnerability could be attributed to exposure, sensitivity, or adaptive capacity.
Ecuador, the most exposed country in South America, received the highest score largely due to its population density, which is one-third higher than that of the next most densely populated country, Colombia. All countries along the western and southern coasts of South America received high exposure scores, suggesting a geographic trend (Figure 2). Two of the three indicators used—water stress and renewable water resources per capita—are closely linked to climate and hydrological patterns. Hence, the exposure score is a reflection of the drier climate of the west coast of the continent. The third indicator, population density is also influenced by physical geography such as topography and proximity to water sources.
Like exposure, sensitivity is calculated with indicators that are influenced by physical features, including value added to GDP through agriculture, cattle per square km, and freshwater fish consumption. These indicators are speculated to be the reason why, excluding Argentina and Chile, sensitivity follows similar geographic patterns as exposure. However, sensitivity, unlike exposure, also considers indicators that have significant economic influence, including population with access to safe drinking water and HDI. The economic strength and high quality of life of Argentina and Chile are the reasons why these countries have a relatively low sensitivity, while other Western countries did not.
Adaptive capacity, in comparison to the other two factors of drought vulnerability, does not appear to display any geographic patterns (Figure 4). Instead, adaptive capacity seems to have stronger ties to the economic situation in a country. Adaptive capacity is a measure of how well a country can adapt and recover from drought conditions, so it is not surprising that the countries with more economic resources score higher on their ability to overcome drought situations. Countries with greater means can afford the desalination and irrigation infrastructure that helps them adapt to situations of drought. GDP per capita is also an indicator used to determine this category, so the resulting geographic distribution of adaptive capacity scores is expected.
Uruguay is an interesting example of how economic strength, while it does play a factor in vulnerability, does not protect a country from having a high vulnerability to drought. Uruguay, which has the highest GDP per capita of any country in South America, received the third highest score for total vulnerability. Despite high exposure, Uruguay is one of the least prepared countries on the continent for drought conditions. It is one of three countries on the continent without a drought plan and very little of its agricultural land is equipped for irrigation.
Ecuador and Colombia, the countries with the highest vulnerability scores, have high population densities and low quantities of renewable water resources. Despite this, they utilize some of the highest amounts of hydropower. They also are both on the lower end of GDP per capita, displaying both high exposure and sensitivity and low adaptive capacities. In contrast, Guyana and Suriname, scoring the lowest for drought vulnerability, are low-density rainforest-swathed countries with plentiful water resources. Their extremely low exposure makes up for moderate scores in adaptive capacity and sensitivity.
4.2. Limitations
The test runs with 1000 random weights assigned to the indicators are displayed in Figure 6, Figure 7, Figure 8 and Figure 9. For some countries, the varying weights leads to long ranges of possible values, while for others, typically the highest (lowest) ranked countries, the score does not change much with varying weights. Figure 6, Figure 7, Figure 8 and Figure 9 also show the scores from the original exposure/sensitivity/adaptive capacity/vulnerability calculations. These do at times divert from the median of the scores calculated using the weighted indicators. However, the relative ranking between the countries remains the same.
There is no well-established way of assessing vulnerability. In this study, the vulnerability scores are rescaled between 0 and 1 to present a relative ranking of drought vulnerability across the nations of South America. This does not necessarily represent the absolute vulnerability of all countries. This was carried out to better facilitate visual comparisons between nations.
As a continent-based analysis, our analysis gives an indication of how the countries compare at the national level, and a limitation is that our study may lack the granularity and specificity of regional-scale analyses. Future work may benefit from being completed at a higher resolution to achieve a more complete understanding of drought risk and impacts in South America. By focusing on a specific region or country in an analysis, we can obtain a better visual of the discrepancies of drought vulnerability that exist within one country or region. For example, by undertaking our research at the country level, we are unable to explore how the vulnerability of the southeast region of Brazil differs from the north, given their substantial differences in geography, level of urbanization, and demographics.
In our study, all countries in South America received equal weight despite significant differences in population and land area. This limitation may present a skewed view of the level of drought vulnerability in South America as a whole. Based on our analysis, the majority of South America in terms of land area and population are “low vulnerability” Figure 10 and Figure 11). This is primarily because, Brazil, the largest country in South America in terms of both population and land area is a “low vulnerability” country. However, the relative “low vulnerability” of Brazil does not discount the large swaths of the continent that are particularly vulnerable.
5. Conclusions and Future Directions
Due to this study’s nature, we cannot make any assumptions about what makes certain countries more vulnerable to drought beyond the indicators used in the research. While we believe that this analysis represents a comprehensive picture of general drought vulnerability across South America, the authors recognize that the results are a reflection of the indicators included, and that other studies include additional and different indicators [,]. What we can do is to look at the geographic, social, and economic patterns to understand why countries received high or low exposure, sensitivity, adaptive capacity, and drought vulnerability scores.
Our analysis reveals some overarching trends and geographic patterns of drought vulnerability in South America, including the east–west divide of the continent for drought exposure and apparent economic influence on drought sensitivity and adaptive capacity. We also revealed the countries that are most and least vulnerable to droughts. Given the expectation that climate change will increase the intensity and frequency of droughts in the region, it is imperative that we understand what the potential risks and impacts of this may be. A continent-wide drought vulnerability analysis of South America is a small but important step in preparing the continent to deal with these devastating natural disasters.
Author Contributions
Conceptualization, J.E.; data curation, E.S.; formal analysis, E.S.; methodology, E.S. and J.E.; supervision, J.E.; visualization, E.S.; writing—original draft, E.S. and J.E.; writing—review and editing, E.S. and J.E. All authors have read and agreed to the published version of the manuscript.
Funding
This research received no external funding.
Data Availability Statement
All data used in this analysis are publicly available for free. Data created as part of the analysis are available from the authors upon reasonable request.
Conflicts of Interest
The authors declare no conflicts of interest.
References
- Ding, Y.; Hayes, M.J.; Widhalm, M. Measuring economic impacts of drought: A review and discussion. Disaster Prev. Manag. Int. J. 2011, 20, 434–446. [Google Scholar] [CrossRef]
- Edwards, B.; Gray, M.; Hunter, B. The social and economic impacts of drought. Aust. J. Soc. Issues 2019, 54, 22–31. [Google Scholar] [CrossRef]
- Freire-González, J.; Decker, C.; Hall, J.W. The Economic Impacts of Droughts: A Framework for Analysis. Ecol. Econ. 2017, 132, 196–204. [Google Scholar] [CrossRef]
- World Meteorological Organization (WMO). Atlas of Mortality and Economic Losses from Weather, Climate and Water Extremes (1970–2012); WMO: Geneva, Switzerland, 2014. [Google Scholar]
- Wittmann, F.; Householder, E.; Wittmann, A.d.O.; Lopes, A.; Junk, W.J.; Piedade, M.T. Implementation of the Ramsar Convention on South American Wetlands: An Update. Res. Rep. Biodivers. Stud. 2015, 4, 47–58. Available online: https://www.tandfonline.com/doi/abs/10.2147/RRBS.S64502 (accessed on 4 July 2025). [CrossRef]
- van Garderen, L.; Mindlin, J. A storyline attribution of the 2011/2012 drought in Southeastern South America. Weather 2022, 77, 212–218. [Google Scholar] [CrossRef]
- Cavalcanti, I.F.A.; Kousky, V.E. Drought in Brazil During Summer and Fall 2001 and Associated Atmospheric Circulation Features. Rev. Climanálise 2001, 2, 1–10. [Google Scholar]
- United Nations Framework Convention on Climate Change. New Report Details Dire Climate Impacts in Latin America and the Caribbean|UNFCCC. Available online: https://unfccc.int/news/new-report-details-dire-climate-impacts-in-latin-america-and-the-caribbean (accessed on 4 July 2025).
- NASA. A Strained Water System in Chile. Available online: https://earthobservatory.nasa.gov/images/146577/a-strained-water-system-in-chile (accessed on 4 July 2025).
- Garreaud, R.; Boisier, J.P.; Rondanelli, R.; Montecinos, A.; Sepúlveda, H.; Veloso, D. The Central Chile Mega Drought (2010–2018): A Climate dynamics perspective. Int. J. Climatol. 2019, 40, 421–439. [Google Scholar] [CrossRef]
- Álamos, N.; Alvarez-Garreton, C.; Muñoz, A.; González-Reyes, Á. The influence of human activities on streamflow reductions during the megadrought in central Chile. Hydrol. Earth Syst. Sci. 2024, 28, 2483–2503. [Google Scholar] [CrossRef]
- Barría, P.; Chadwick, C.; Ocampo-Melgar, A.; Galleguillos, M.; Garreaud, R.; Díaz-Vasconcellos, R.; Poblete, D.; Rubio-Álvarez, E.; Poblete-Caballero, D. Water management or megadrought: What caused the Chilean Aculeo Lake drying? Reg. Environ. Chang. 2021, 21, 19. [Google Scholar] [CrossRef]
- Muñoz, A.A.; Klock-Barría, K.; Alvarez-Garreton, C.; Aguilera-Betti, I.; González-Reyes, Á.; Lastra, J.A.; Chávez, R.O.; Barría, P.; Christie, D.; Rojas-Badilla, M.; et al. Water Crisis in Petorca Basin, Chile: The Combined Effects of a Mega-Drought and Water Management. Water 2020, 12, 648. [Google Scholar] [CrossRef]
- Erfanian, A.; Wang, G.; Fomenko, L. Unprecedented drought over tropical South America in 2016: Significantly under-predicted by tropical SST. Sci. Rep. 2017, 7, 5811. [Google Scholar] [CrossRef]
- ACAPS Thematic Report—Brazil: Impact of Drought in the Brazilian Amazon and 2025 Outlook (28 January 2025)—Brazil|ReliefWeb. Available online: https://reliefweb.int/report/brazil/acaps-thematic-report-brazil-impact-drought-brazilian-amazon-and-2025-outlook-28-january-2025 (accessed on 3 July 2025).
- Valdes, C. Brazil’s Momentum as a Global Agricultural Supplier Faces Headwinds. Amber Waves Econ. Food Farming Nat. Resour. Rural. Am. 2022. [Google Scholar] [CrossRef]
- World Bank Open Data. Available online: https://data.worldbank.org (accessed on 4 July 2025).
- International Federation of Red Cross and Red Crescent, Disaster Relief Emergency Fund (DREF) Paraguay: Drought. Inter-national Federation of Red Cross and Red Crescent. 2012. Available online: https://reliefweb.int/node/536308 (accessed on 1 July 2025).
- Uvo, C.B.; Repelli, C.A.; Zebiak, S.E.; Kushnir, Y. The Relationships Between Tropical Pacific and Atlantic SST and Northeast Brazil Monthly Precipitation. 1998. Available online: https://journals.ametsoc.org/view/journals/clim/11/4/1520-0442_1998_011_0551_trbtpa_2.0.co_2.xml (accessed on 4 July 2025).
- Penalba, O.C.; Rivera, J.A. Precipitation response to El Niño/La Niña events in Southern South America—Emphasis in regional drought occurrences. Adv. Geosci. 2016, 42, 1–14. [Google Scholar] [CrossRef]
- Tedeschi, R.G.; Grimm, A.M.; Cavalcanti, I.F.A. Influence of Central and East ENSO on precipitation and its extreme events in South America during austral autumn and winter. Int. J. Climatol. 2016, 36, 4797–4814. [Google Scholar] [CrossRef]
- Cai, W.; McPhaden, M.J.; Grimm, A.M.; Rodrigues, R.R.; Taschetto, A.S.; Garreaud, R.D.; Dewitte, B.; Poveda, G.; Ham, Y.-G.; Santoso, A.; et al. Climate impacts of the El Niño–Southern Oscillation on South America. Nat. Rev. Earth Environ. 2020, 1, 215–231. [Google Scholar] [CrossRef]
- Steiger, N.J.; Smerdon, J.E.; Seager, R.; Williams, A.P.; Varuolo-Clarke, A.M. ENSO-driven coupled megadroughts in North and South America over the last millennium. Nat. Geosci. 2021, 14, 739–744. [Google Scholar] [CrossRef]
- Cavalcanti, I.F.A. Large scale and synoptic features associated with extreme precipitation over South America: A review and case studies for the first decade of the 21st century. Atmos. Res. 2012, 118, 27–40. [Google Scholar] [CrossRef]
- Kayano, M.T.; Capistrano, V.B. How the Atlantic Multidecadal Oscillation (AMO) Modifies the ENSO Influence on the South American Rainfall.|EBSCOhost. Available online: https://openurl.ebsco.com/contentitem/doi:10.1002%2Fjoc.3674?sid=ebsco:plink:crawler&id=ebsco:doi:10.1002%2Fjoc.3674 (accessed on 3 July 2025).
- Mamani, L.; Andreoli, R.V.; de Souza, I.P.; Cevalho, W.; Sales, D.; Kayano, M.T.; de Souza, R.A.F.; Molina-Carpio, J.; Ceron, W.L.; Macedo, T. Extreme droughts in the Amazon Basin during cyclic ENSO events coupled with Indian Ocean Dipole modes and Tropical North Atlantic warming. Sci. Total Environ. 2025, 963, 178536. [Google Scholar] [CrossRef]
- Engström, J.; Abbaszadeh, P.; Keellings, D.; Deb, P.; Moradkhani, H. Wildfires in the Arctic and tropical biomes: What is the relative role of climate? Nat. Hazards 2022, 114, 1901–1914. [Google Scholar] [CrossRef]
- Rivera, J.A.; Arias, P.A.; Sörensson, A.A.; Zachariah, M.; Barnes, C.; Philip, S.; Kew, S.; Vautard, R.; Koren, G.; Pinto, I.; et al. 2022 early-summer heatwave in Southern South America: 60 times more likely due to climate change. Clim. Chang. 2023, 176, 102. [Google Scholar] [CrossRef]
- Lovejoy, T.E.; Nobre, C. Amazon Tipping Point. Sci. Adv. 2018, 4, eaat2340. [Google Scholar] [CrossRef]
- Walker, R.T. Collision Course: Development Pushes Amazonia Toward Its Tipping Point. Environ. Sci. Policy Sustain. Dev. 2020, 63, 15–25. [Google Scholar] [CrossRef]
- Serkendiz, H.; Tatli, H.; Özcan, H.; Çetin, M.; Sungur, A. Multidimensional assessment of agricultural drought vulnerability based on socioeconomic and biophysical indicators. Int. J. Disaster Risk Reduct. 2023, 98, 104121. [Google Scholar] [CrossRef]
- Savari, M.; Eskandari Damaneh, H.; Eskandari Damaneh, H. Drought vulnerability assessment: Solution for risk alleviation and drought management among Iranian farmers. Int. J. Disaster Risk Reduct. 2022, 67, 102654. [Google Scholar] [CrossRef]
- Wilhelmi, O.V.; Wilhite, D.A. Assessing Vulnerability to Agricultural Drought: A Nebraska Case Study. Nat. Hazards 2002, 25, 37–58. [Google Scholar] [CrossRef]
- Swain, S.; Mishra, S.K.; Pandey, A.; Kalura, P. Inclusion of groundwater and socio-economic factors for assessing comprehensive drought vulnerability over Narmada River Basin, India: A geospatial approach. Appl. Water Sci. 2022, 12, 14. [Google Scholar] [CrossRef]
- Blauhut, V.; Stahl, K.; Stagge, J.H.; Tallaksen, L.M.; De Stefano, L.; Vogt, J. Estimating drought risk across Europe from reported drought impacts, drought indices, and vulnerability factors. Hydrol. Earth Syst. Sci. 2016, 20, 2779–2800. [Google Scholar] [CrossRef]
- Naumann, G.; Cammalleri, C.; Mentaschi, L.; Feyen, L. Increased economic drought impacts in Europe with anthropogenic warming. Nat. Clim. Chang. 2021, 11, 485–491. [Google Scholar] [CrossRef]
- Blauhut, V.; Gudmundsson, L.; Stahl, K. Towards pan-European drought risk maps: Quantifying the link between drought indices and reported drought impacts. Environ. Res. Lett. 2015, 10, 014008. [Google Scholar] [CrossRef]
- Ercin, E.; Veldkamp, T.I.E.; Hunink, J. Cross-border climate vulnerabilities of the European Union to drought. Nat. Commun. 2021, 12, 3322. [Google Scholar] [CrossRef]
- Ahmadalipour, A.; Moradkhani, H. Multi-dimensional assessment of drought vulnerability in Africa: 1960–2100. Sci. Total Environ. 2018, 644, 520–535. [Google Scholar] [CrossRef]
- Ahmadalipour, A.; Moradkhani, H.; Castelletti, A.; Magliocca, N. Future drought risk in Africa: Integrating vulnerability, climate change, and population growth. Sci. Total Environ. 2019, 662, 672–686. [Google Scholar] [CrossRef]
- Naumann, G.; Barbosa, P.; Garrote, L.; Iglesias, A.; Vogt, J. Exploring drought vulnerability in Africa: An indicator based analysis to be used in early warning systems. Hydrol. Earth Syst. Sci. 2014, 18, 1591–1604. [Google Scholar] [CrossRef]
- Cutter, S.L. The Vulnerability of Science and the Science of Vulnerability. Ann. Assoc. Am. Geogr. 2003, 93, 1–12. [Google Scholar] [CrossRef]
- Cutter, S.L. Vulnerability to environmental hazards. Prog. Hum. Geogr. 1996, 20, 529–539. [Google Scholar] [CrossRef]
- Cardona, O.D.; van Aalst, M.K.; Birkmann, J.; Fordham, M.; McGregor, G.; Perez, R.; Pulwarty, R.S.; Schipper, E.L.F.; Sinh, B.T.; Décamps, H.; et al. Determinants of risk: Exposure and vulnerability. In Managing the Risks of Extreme Events and Disasters to Advance Climate Change Adaptation: Special Report of the Intergovernmental Panel on Climate Change; Cambridge University Press: Cambridge, UK, 2012; pp. 65–108. [Google Scholar] [CrossRef]
- González Tánago, I.; Urquijo, J.; Blauhut, V.; Villarroya, F.; De Stefano, L. Learning from experience: A systematic review of assessments of vulnerability to drought. Nat. Hazards 2016, 80, 951–973. [Google Scholar] [CrossRef]
- Estoque, R.C.; Ishtiaque, A.; Parajuli, J.; Athukorala, D.; Rabby, Y.W.; Ooba, M. Has the IPCC’s revised vulnerability concept been well adopted? Ambio 2023, 52, 376–389. [Google Scholar] [CrossRef]
- Singh, N.P.; Bantilan, C.; Byjesh, K. Vulnerability and policy relevance to drought in the semi-arid tropics of Asia—A retrospective analysis. Weather. Clim. Extrem. 2014, 3, 54–61. [Google Scholar] [CrossRef]
- Weis, S.W.M.; Agostini, V.N.; Roth, L.M.; Gilmer, B.; Schill, S.R.; Knowles, J.E.; Blyther, R. Assessing vulnerability: An integrated approach for mapping adaptive capacity, sensitivity, and exposure. Clim. Chang. 2016, 136, 615–629. [Google Scholar] [CrossRef]
- Engström, J.; Jafarzadegan, K.; Moradkhani, H. Drought Vulnerability in the United States: An Integrated Assessment. Water 2020, 12, 2033. [Google Scholar] [CrossRef]
- Balbus, J.; Crimmins, A.; Gamble, J.L.; Easterling, D.R.; Kunkel, K.E.; Saha, S.; Sarofim, M.C. Chapter 1: Climate Change and Human Health|Climate and Health Assessment. U.S. Global Change Research Program. Available online: https://web.archive.org/web/20250628112054/https://health2016.globalchange.gov/climate-change-and-human-health (accessed on 3 July 2025).
- Smit, B.; Wandel, J. Adaptation, adaptive capacity and vulnerability. Glob. Environ. Chang. 2006, 16, 282–292. [Google Scholar] [CrossRef]
- Cutter, S.L. The origin and diffusion of the social vulnerability index (SoVI). Int. J. Disaster Risk Reduct. 2024, 109, 104576. [Google Scholar] [CrossRef]
- Cutter, S.L.; Emrich, C.T. Social Vulnerability Index (SoVI®): Methodology and Limitations; Hazards and Vulnerability Research Institute: Columbia, SC, USA, 2017; Available online: https://www.vulnerabilitymap.org/Portals/0/Files/Social%20Vulnerability%20Index%20SoVI%20-%20Methodology%20and%20Limitations.pdf?ver=Dtf6UG34OrlIsrehg3sjLQ%3D%3D (accessed on 1 July 2025).
- Cutter, S.L.; Burton, C.G.; Emrich, C.T. Disaster Resilience Indicators for Benchmarking Baseline Conditions. J. Homel. Secur. Emerg. Manag. 2010, 7, 1–22. [Google Scholar] [CrossRef]
- AQUASTAT—FAO’s Global Information System on Water and Agriculture. Available online: https://www.fao.org/aquastat/en/ (accessed on 3 July 2025).
- Carrão, H.; Naumann, G.; Barbosa, P. Mapping global patterns of drought risk: An empirical framework based on sub-national estimates of hazard, exposure and vulnerability. Glob. Environ. Chang. 2016, 39, 108–124. [Google Scholar] [CrossRef]
- Madadgar, S.; AghaKouchak, A.; Farahmand, A.; Davis, S.J. Probabilistic estimates of drought impacts on agricultural production. Geophys. Res. Lett. 2017, 44, 7799–7807. [Google Scholar] [CrossRef]
- Sluyter, A. Cattle in Latin American History. Oxf. Res. Encycl. Lat. Am. Hist. 2023. [Google Scholar] [CrossRef]
- Klein, H.S.; Luna, F.V. Cattle. In Brazilian Crops in the Global Market: The Emergence of Brazil as a World Agribusiness Exporter Since 1950; Springer Nature: Cham, Switzerland, 2023; pp. 295–323. [Google Scholar] [CrossRef]
- Mekonnen, M.M.; Hoekstra, A.Y. A Global Assessment of the Water Footprint of Farm Animal Products. Ecosystems 2012, 15, 401–415. [Google Scholar] [CrossRef]
- López-Moreno, J.I.; Vicente-Serrano, S.M.; Beguería, S.; García-Ruiz, J.M.; Portela, M.M.; Almeida, A.B. Dam effects on droughts magnitude and duration in a transboundary basin: The Lower River Tagus, Spain and Portugal. Water Resour. Res. 2009, 45. [Google Scholar] [CrossRef]
- United Nations. Human Development Index. Available online: https://hdr.undp.org/data-center/human-development-index (accessed on 4 July 2025).
- Intergovernmental Panel on Climate Change (IPCC). Climate Change 2021—The Physical Science Basis: Working Group I Contribution to the Sixth Assessment Report of the Intergovernmental Panel on Climate Change; Cambridge University Press: Cambridge, UK, 2023. [Google Scholar] [CrossRef]
- Elkouk, A.; Pokhrel, Y.; Satoh, Y.; Bouchaou, L. Implications of changes in climate and human development on 21st-century global drought risk. J. Environ. Manag. 2022, 317, 115378. [Google Scholar] [CrossRef]
- Mullin, M. The effects of drinking water service fragmentation on drought-related water security. Science 2020, 368, 274–277. [Google Scholar] [CrossRef]
- International Energy Agency. Electricity Supply Mix by Region, 2020—Charts—Data & Statistics. IEA. Available online: https://www.iea.org/data-and-statistics/charts/electricity-supply-mix-by-region-2020 (accessed on 6 July 2025).
- Wiatros-Motyka, M.; Fulghum, N.; Jones, D. Global Electricity Review 2024. May 2024. Available online: https://policycommons.net/artifacts/12310492/untitled/13206852/ (accessed on 3 July 2025).
- Naylor, R.L.; Kishore, A.; Sumaila, U.R.; Issifu, I.; Hunter, B.P.; Belton, B.; Bush, S.R.; Cao, L.; Gelcich, S.; Gephart, J.A.; et al. Blue food demand across geographic and temporal scales. Nat. Commun. 2021, 12, 5413. [Google Scholar] [CrossRef] [PubMed]
- Matthews, W.J.; Marsh-Matthews, E. Effects of drought on fish across axes of space, time and ecological complexity. Freshw. Biol. 2003, 48, 1232–1253. [Google Scholar] [CrossRef]
- Dhakal, N.; Salinas-Rodriguez, S.G.; Hamdani, J.; Abushaban, A.; Sawalha, H.; Schippers, J.C.; Kennedy, M.D. Is Desalination a Solution to Freshwater Scarcity in Developing Countries? Membranes 2022, 12, 381. [Google Scholar] [CrossRef]
- Morote, Á.-F.; Olcina, J.; Hernández, M. The Use of Non-Conventional Water Resources as a Means of Adaptation to Drought and Climate Change in Semi-Arid Regions: South-Eastern Spain. Water 2019, 11, 93. [Google Scholar] [CrossRef]
- United Nations Convention to Combat Desertification. Drought planning. UNCCD. Available online: https://www.unccd.int/land-and-life/drought/drought-planning (accessed on 7 July 2025).
- De Smith, M.J.; Goodchild, M.; Longley, P.A. Univariate classification schemes. In Geospatial Analysis—A Comprehensive Guide, 6th ed.; Troubador Publishing Ltd.: Leicester, UK, 2007; Available online: https://www.spatialanalysisonline.com/extractv6.pdf (accessed on 1 July 2025).
- Hedayat, H.; Seyed Kaboli, H. Drought risk assessment: The importance of vulnerability factors interdependencies in regional drought risk management. Int. J. Disaster Risk Reduct. 2024, 100, 104152. [Google Scholar] [CrossRef]
- Rahman, G.; Jung, M.-K.; Kim, T.-W.; Kwon, H.-H. Drought impact, vulnerability, risk assessment, management and mitigation under climate change: A comprehensive review. KSCE J. Civ. Eng. 2025, 29, 100120. [Google Scholar] [CrossRef]
Disclaimer/Publisher’s Note: The statements, opinions and data contained in all publications are solely those of the individual author(s) and contributor(s) and not of MDPI and/or the editor(s). MDPI and/or the editor(s) disclaim responsibility for any injury to people or property resulting from any ideas, methods, instructions or products referred to in the content. |
© 2025 by the authors. Licensee MDPI, Basel, Switzerland. This article is an open access article distributed under the terms and conditions of the Creative Commons Attribution (CC BY) license (https://creativecommons.org/licenses/by/4.0/).