Article

Study on Stress Monitoring and Risk Early Warning of Flexible Mattress Deployment in Deep-Water Sharp Bend Reaches

1
Changjiang Wuhan Waterway Engineering Bureau, Wuhan 430014, China
2
Department of Port, Waterway and Coastal Engineering, School of Transportation, Southeast University, Nanjing 211189, China
*
Author to whom correspondence should be addressed.
Water 2025, 17(15), 2333; https://doi.org/10.3390/w17152333
Submission received: 4 June 2025 / Revised: 22 July 2025 / Accepted: 29 July 2025 / Published: 6 August 2025
(This article belongs to the Section Oceans and Coastal Zones)

Abstract

This study addresses the complex challenges associated with flexible mattress (soft mattress) installation in the sharply curved and deep-water sections of the Yangtze River, particularly in the Yaozui revetment reconstruction project. Under extreme hydrodynamic conditions—water depths exceeding 30 m and velocities over 2.5 m/s—the risk of structural failures such as displacement, flipping, or tearing of the mattress becomes significant. To improve construction safety and stability, the study integrates numerical modeling and on-site strain monitoring to analyze the mechanical response of flexible mattresses during deployment. A three-dimensional finite element model based on the catenary theory was developed to simulate stress distributions under varying flow velocities and angles, revealing stress concentrations at the mattress’s upper edge and reinforcement junctions. Concurrently, a real-time monitoring system using high-precision strain sensors was deployed on critical shipboard components, with collected data analyzed through a remote IoT platform. The results demonstrate strong correlations between mattress strain, flow velocity, and water depth, enabling the identification of high-risk operational thresholds. The proposed monitoring and early-warning framework offers a practical solution for managing construction risks in extreme riverine environments and contributes to the advancement of intelligent construction management for underwater revetment works.

1. Introduction

The Yangtze River Basin has long been recognized as a vital “golden waterway” in China. Channel regulation projects are of great importance for ensuring the safety and stability of navigation routes and protecting the ecological environment. However, the Jingjiang section of the Yangtze River is characterized by sharp river bends, turbulent flow, and considerable water depth, all of which present complex hydrological conditions that impose stringent requirements on underwater bank protection construction. The Yaokou revetment reconstruction project is located in a typical sharply curved deep-water section of the Jingjiang reach. During construction, flexible mattresses must be deployed under challenging conditions, with flow velocities exceeding 2.5 m/s and water depths surpassing 30 m. These conditions make the construction process extremely difficult and technically demanding.
During deployment, flexible mattresses are highly susceptible to the combined effects of longitudinal and transverse tensile forces, which can lead to sliding, overturning, or tearing of the mattress structure. These failures not only compromise the quality of the project but also result in severe resource waste. Therefore, research on monitoring techniques and risk early-warning systems for flexible mattress deployment in sharply curved deep-water areas has significant theoretical value and practical engineering relevance. Real-time monitoring and risk warning during the deployment process can greatly improve construction safety, stability, and efficiency, while ensuring engineering quality and achieving ecological protection objectives.
In recent years, with the widespread implementation of channel regulation and bank protection projects, the construction technology of flexible mattresses has attracted increasing attention. A growing body of research indicates that flow-induced damage during mattress deployment has become one of the key constraints affecting construction quality. Consequently, it is necessary to investigate force monitoring and risk early-warning techniques during the deployment of flexible mattresses. Currently, as a type of flexible scour protection structure, flexible mattresses are widely used in the Yangtze River for protecting sandbars, riverbanks, and bridge foundations. Their adaptability and environmental compatibility have made them a focus of engineering interest. This is especially true in the middle and lower reaches of the Yangtze River, where deep water, high flow velocity, and turbulent hydrodynamics complicate the stress conditions during deployment. As a result, structural failures such as overturning, tearing, and displacement frequently occur, posing potential threats to project integrity and personnel safety. Existing research has mainly focused on the following two aspects of flexible mattress construction technology:
First, research has primarily focused on the hydrodynamic responses during the deployment process, analyzing the forces and deformations of the mattress structure through physical experiments and numerical simulations. For instance, Yang Hanyuan [1] and colleagues employed a three-dimensional fluid–structure interaction model to systematically investigate the interaction between flow disturbance structures during submergence and the dynamic responses of flexible mattresses. They found that the region near the head beam experiences the strongest force, which increases exponentially with water depth, thus identifying critical areas and conditions that require close monitoring during construction. Flexible mattress full-section bottom protection was once applied in the regulation project at the entrance of the right branch of Bagua Island in Nanjing. Located in the main channel, where strong currents and complex topography pose significant construction challenges for full-section mattress deployment, Luo Qing [2] and collaborators used a multi-beam bathymetric system to collect underwater topographic data of the construction zone multiple times. They evaluated mattress deployment quality using multi-beam imagery and conducted quantitative analyses of bed evolution over time using GIS spatial analysis techniques, thereby enhancing the understanding of engineering effects and project performance. The results demonstrated that the project achieved the desired protective outcomes after completion.
The unidirectional grid flexible mattress, a novel structure using unidirectional grids as load-bearing elements, was studied by Wu Jie [3] in the context of scour protection projects in the middle and lower reaches of the Yangtze River. They employed the finite element method to simulate the stress characteristics of this structure during downstream deployment. Results showed that the maximum stress borne by the unidirectional grid mattress was significantly lower than its tensile strength, indicating that the structure is well-suited for protection applications in the Yangtze. Compared to conventional reinforced mattresses, the unidirectional grid structure reduced deployment costs by more than 20%, highlighting its considerable application potential. To explore feasible and efficient underwater flexible mattress construction techniques, Chen Dong [4] proposed a method based on a deep-water channel regulation project involving the simultaneous hoisting of multiple concrete interlocking units and ultra-short baseline underwater positioning for flexible mattresses. The study also analyzed key points in applying these techniques to channel regulation. The findings revealed that the innovative application of these technologies effectively overcame the low efficiency and precision issues of traditional deployment methods. It enabled dynamic and precise positioning, accurate detection of mattress overlaps, and assessment of surface smoothness, all of which indicate promising prospects for future applications.
In their study on construction methods and quality control of sand-rib flexible mattresses in deep and fast-flowing areas, Chen Huida [5] and colleagues provided a detailed account of sand-rib mattress installation and quality control strategies, offering valuable references for similar projects. As flexible mattresses are increasingly used in the treatment of soft foundations in hydraulic engineering, their reinforcing and drainage functions have proven effective in reducing differential settlement and lateral displacement of soft soil embankments, thereby significantly enhancing overall foundation stability. During the submergence process, flexible mattresses are prone to tearing due to ship movement and water flow. To investigate the effects of relative ship displacement, water depth, surface velocity, and reinforcement strip arrangement on mattress stress during downstream deployment, Chang Liuhong [6] developed a mathematical model based on catenary theory, considering an exponential distribution of flow velocity with depth, and conducted a series of numerical simulations. The results showed that relative ship displacement had the greatest impact on mattress stress, followed by surface velocity and water depth. The maximum axial and lateral stresses occurred at the top of the mattress, with a stress distribution pattern of higher values at the edges and lower values in the center. The arrangement of reinforcement strips significantly reduced both axial and lateral stresses, thereby preventing tearing during deployment.
Second, research has also addressed the challenges of monitoring and evaluating flexible mattresses under complex construction conditions. Wei Xianglong [7] and colleagues proposed an underwater deformation monitoring method based on Distributed Fiber Optic Sensing (DFOS), and developed a strain data denoising model using a BiLSTM-CNN neural network under conditions lacking “clean data” as a reference. This significantly improved the accuracy and applicability of the monitoring data, offering an effective technical solution for the real-time monitoring of flexible structures in complex environments. The construction of a deformation monitoring system for flexible mattresses is an important step toward the intelligent management of inland waterways. To address the complexity of such a system, the study proposed a framework encompassing three main components: deformation monitoring, data visualization, and deformation analysis. It integrated multi-source monitoring through distributed optical fibers, piezometers, and flexible displacement meters, and established a cross-validation and identification method for deformation based on multi-source monitoring data. The processed data were then loaded into a deformation analysis system developed through hybrid programming, enabling the visualization, analysis, and identification of deformation patterns. The results provide useful references for the monitoring, early warning, and system development of hydraulic structures in inland waterway regulation projects.
Due to the remote location of the protective edges of underwater flexible mattresses from the riverbanks, they are prone to settlement deformation under scouring flows, which greatly affects their service performance. At present, there is no effective method to achieve real-time monitoring of settlement deformation at the mattress tail. To address this issue, Wei Xianglong’s [8] team proposed using vibrating-wire sensors for real-time monitoring of tail settlement and conducted field prototype testing. The results showed that by fixing a piezometer at the protective edge to measure water pressure and integrating it with an automated measurement and control system, the scour-induced settlement of the mattress tail could be observed in real time. The conversion between the pressure data and reference hydrological station water levels enabled accurate measurement, with prototype instruments exhibiting high survival rates. However, factors such as differences in water surface slope between hydrological stages and piezometric conversion errors affected measurement precision. In the Yudai Islet protection project in the Dongliu channel, the measurement accuracy for mattress tail scour settlement was 0.54 m. Reducing the distance from the reference point and minimizing the influence of water surface slope differences can further improve precision.
Ensuring the quality of mattress deployment is particularly important. However, commonly used detection methods for underwater mattress construction suffer from various limitations and fail to fully meet engineering requirements. To guarantee deployment quality, Yu Gang [9] applied side-scan sonar technology to flexible mattress detection, optimized the detection method and accuracy, and implemented the approach in the second phase of the Yangtze River regulation project. Through image and data analysis, the high efficiency, accuracy, and intuitiveness of the method were validated. Furthermore, to address the challenges of detecting mattress quality in tidal sections downstream of the Yangtze—where tidal range fluctuations and hydrodynamic conditions are complex—Jin Jian’s [10] team implemented a real-time sonar detection scheme in the Phase II construction of the 12.5 m deep-water navigation channel downstream of Nanjing. This approach effectively controlled the overall deployment quality of the mattress and met project requirements. However, most existing studies have focused on straight river reaches or regions with relatively stable hydrological conditions. Systematic investigations under the coupled extreme conditions of “sharp bend + deep water + high velocity” remain lacking. Moreover, traditional deformation monitoring methods such as sonar scanning and multi-beam bathymetry [11,12,13] suffer from significant limitations in both response speed and accuracy, making them inadequate for real-time risk warning applications. While some numerical simulation studies have introduced fluid–structure interaction (FSI) modeling approaches, many simplify the mattress structure or neglect the feedback effects of flow disturbances, failing to fully capture the mechanical behavior evolution during actual deployment conditions [14,15,16].
Smyrnis [17] pointed out that research on the stability of block mattresses under high-velocity and highly turbulent flow conditions remains insufficient. Existing empirical formulas, such as Pilarczyk’s equation, show limited predictive capability in edge and transition zones, often underestimating the risk of failure at open edges. To address this gap, the study conducted small-scale physical model experiments to investigate the failure mechanisms under various combinations of turbulence intensity and flow velocity, and emphasized that edge and transitional areas should be treated as critical weak points in structural design. In the 11th International Conference on Scour and Erosion (ICSE-11), Di Pietro [18] conducted experimental research on pre-filled mattresses subjected to propeller jet-induced scour around berthing structures. A novel evaluation method was proposed to assess their anti-scour performance, demonstrating the mattress system’s stability under high shear stress conditions. Similarly, Genovese [19] introduced a composite rock bag protection system designed for high-energy marine environments, whose deformation compatibility and energy dissipation mechanisms are functionally analogous to those of mattress structures, providing practical insight into flexible scour protection systems. Tsubokawa et al. [20] investigated coastal slope failure events in Hokkaido, Japan, and emphasized the importance of flexible revetment layers in preventing sub-retaining wall erosion and soil displacement, highlighting the applicability of flexible systems in slope-stabilizing revetment designs. In summary, these studies highlight the advantages of flexible scour protection systems in high-energy environments. Their adaptability, energy dissipation capacity, and structural stability make them effective solutions for preventing local scour and slope failure in coastal and marine settings.
This study focuses on a typical sharply curved and deep-water section of the Jingjiang Reach of the Yangtze River, aiming to address key challenges such as complex force mechanisms and uncontrollable risks during the deployment of flexible mattresses. To this end, a real-time force monitoring and early-warning system is developed, combining numerical simulation with field monitoring to analyze the mechanical responses of the mattress structure and to construct a risk assessment model. The findings provide both theoretical foundations and technical references for flexible mattress installations in similarly challenging river environments.
The research is structured as follows: Section 2 presents the engineering background and project overview; Section 3 details the numerical simulation study, including hydrodynamic modeling and stress analysis during mattress deployment; Section 4 introduces the monitoring devices and measurement methodologies adopted on site; and Section 5 focuses on the acquisition and analysis of monitoring data, along with the development of a real-time early-warning framework.

2. Study Site: The Yaojv Revement Reconstruction Project

2.1. Project Overview

The Yaojv revetment reconstruction project, part of Phase II of the Jingjiang River regulation works along the Yangtze River, is located in a highly curved and complex river reach. The total length of the project is approximately 900 m and is divided into three construction zones: upstream, midstream, and downstream. The upstream section, about 300 m in length, stabilizes the riverbank primarily through promontory removal, slope reconstruction, and underwater toe protection. The midstream section, characterized by concave-bank collapses, involves localized blockage and the construction of composite ecological habitat modules. The downstream section includes corresponding underwater transitional protection measures. Additionally, underwater transition zones of appropriate lengths are set at both upstream and downstream ends to mitigate local scouring effects and enhance slope stability within the collapsed areas.
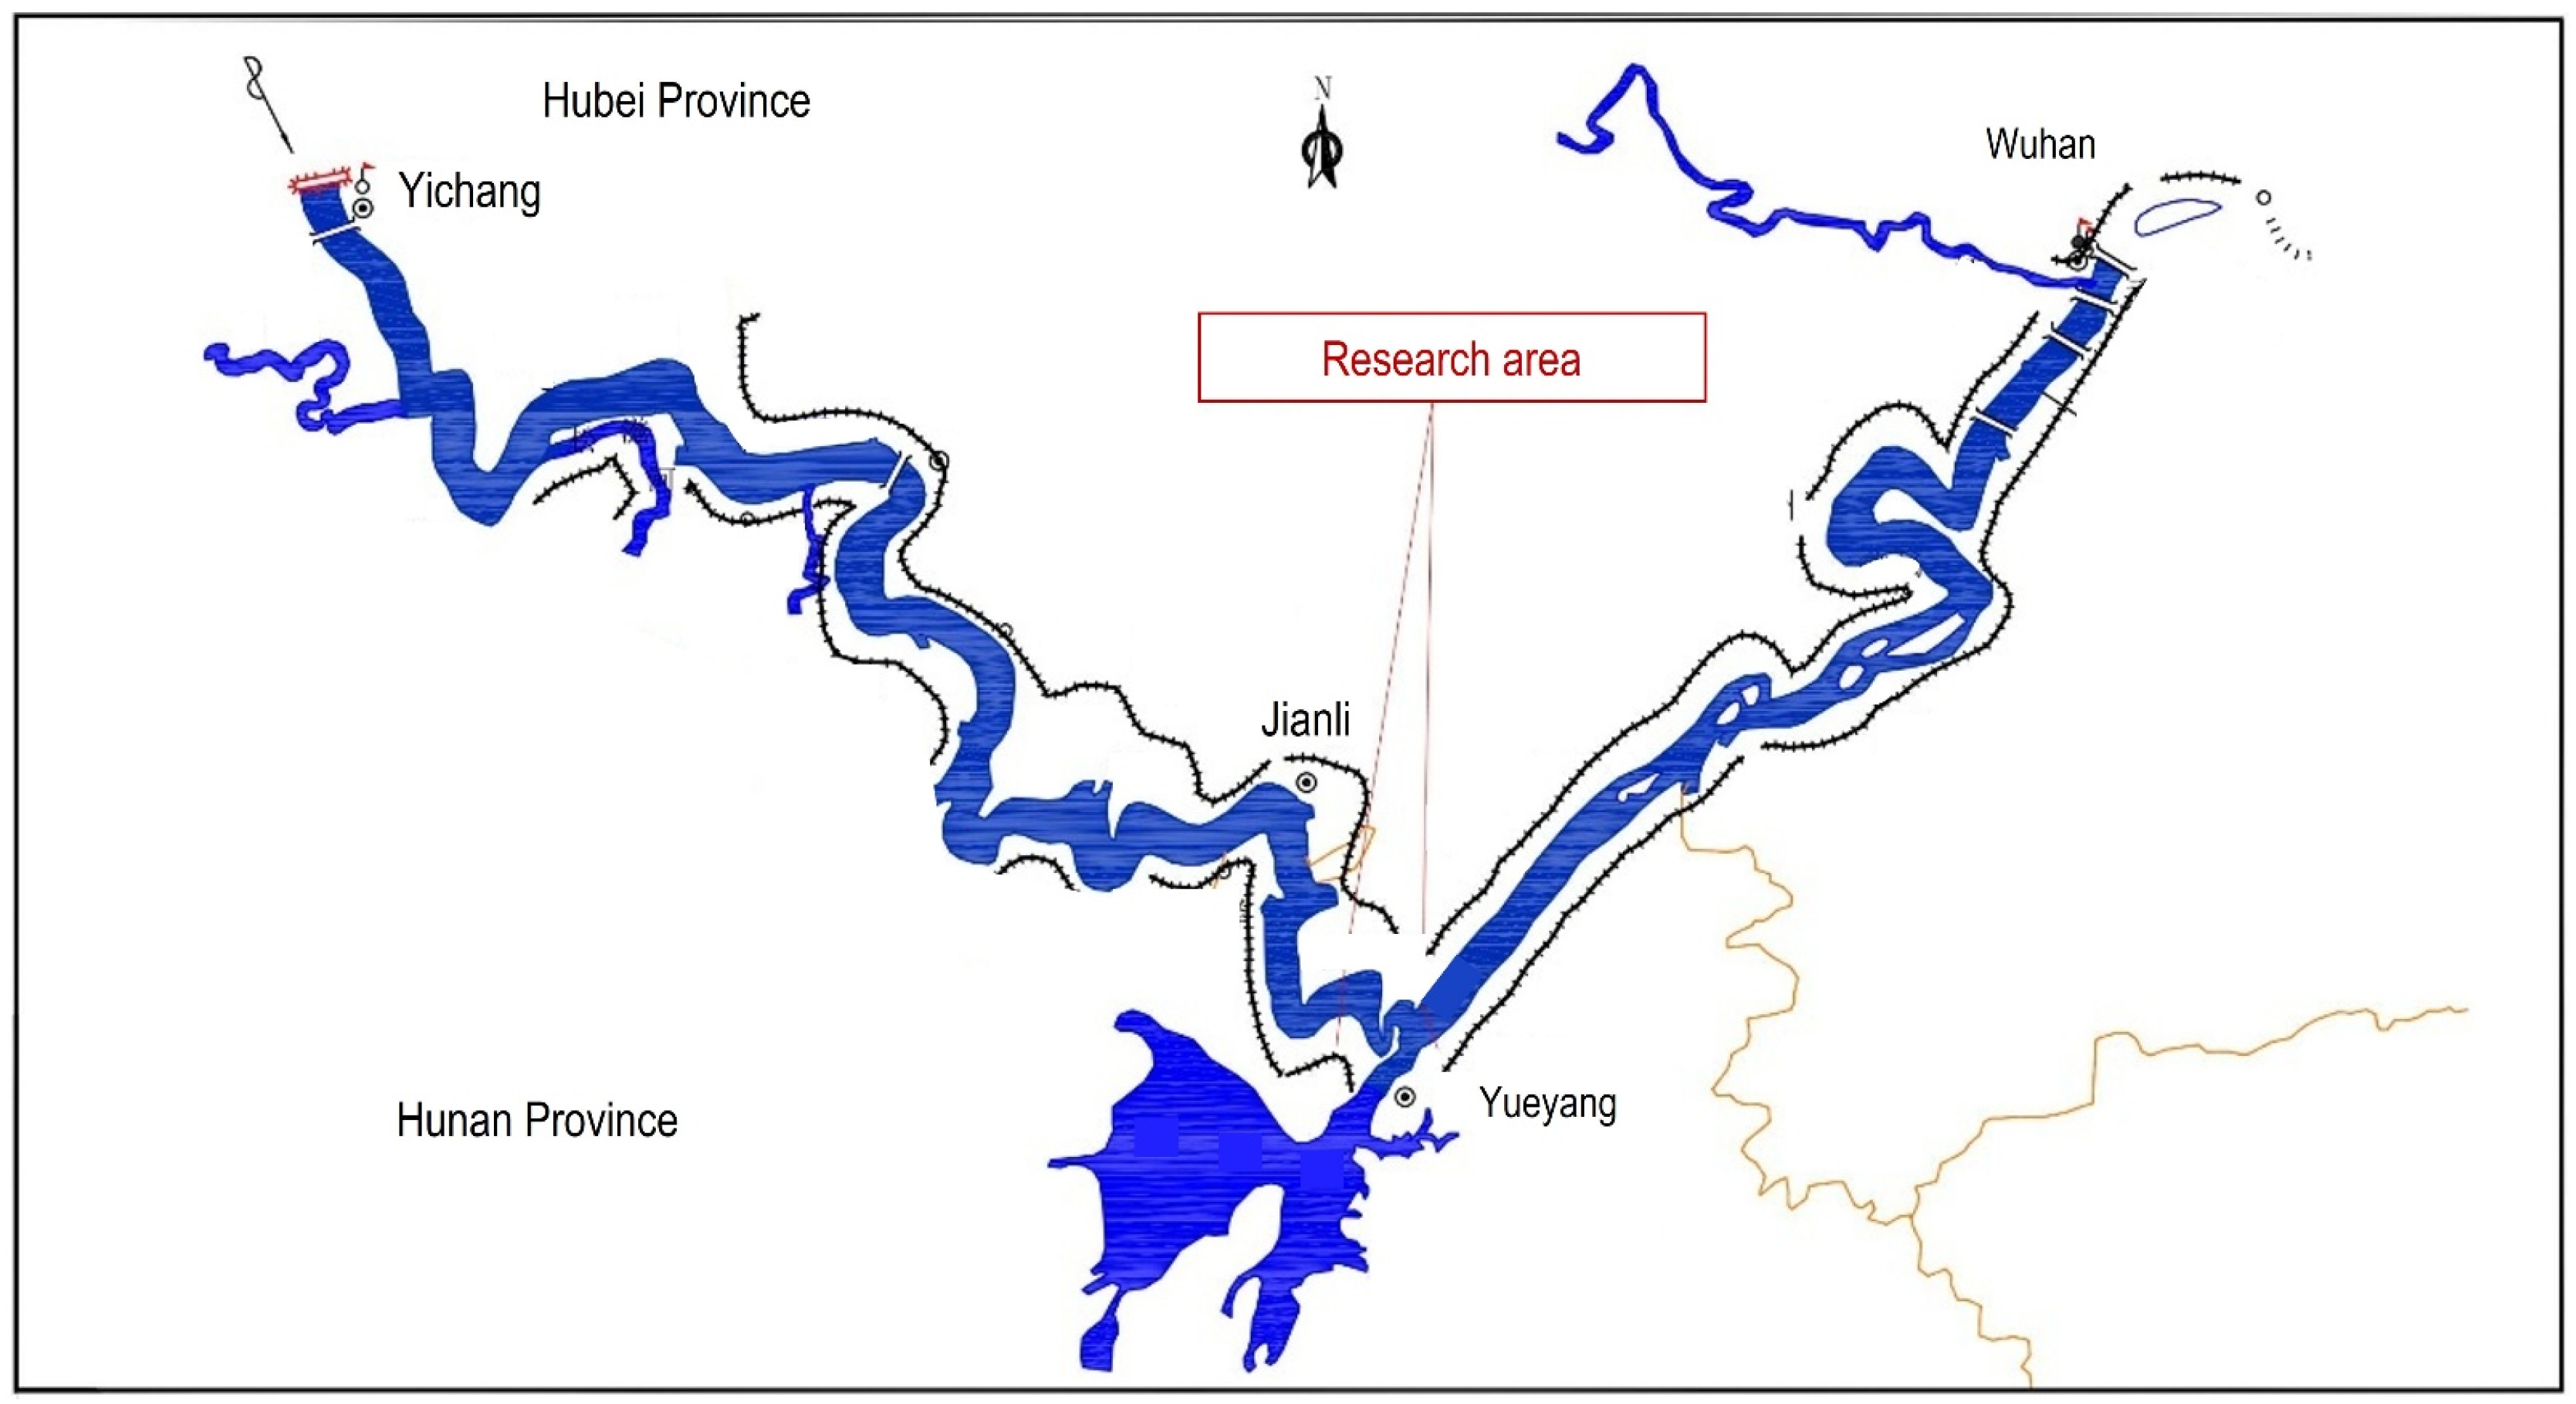
This project (Figure 1) is located in a typical flow-impingement region, featuring complex topography and unique hydrological conditions. The inner-bend circulation within the channel, compounded by crossflow, backflow, and vortex currents, results in highly turbulent and irregular local hydrodynamic conditions. Furthermore, the water depth in this area is considerable—up to 36 m during the construction period—and the main stream velocity during the flood season often exceeds 2.5 m/s. The flow direction forms a large angle with the bank slope, placing stringent demands on construction techniques and safety control. Under such conditions, the flexible mattress used for underwater slope protection is subjected to significant longitudinal and lateral forces, especially when the water depth exceeds 20 m and flow velocity exceeds 2 m/s. These complex working conditions can compromise mattress stability, leading to issues such as difficulty in securing the mattress head and tearing during deployment.
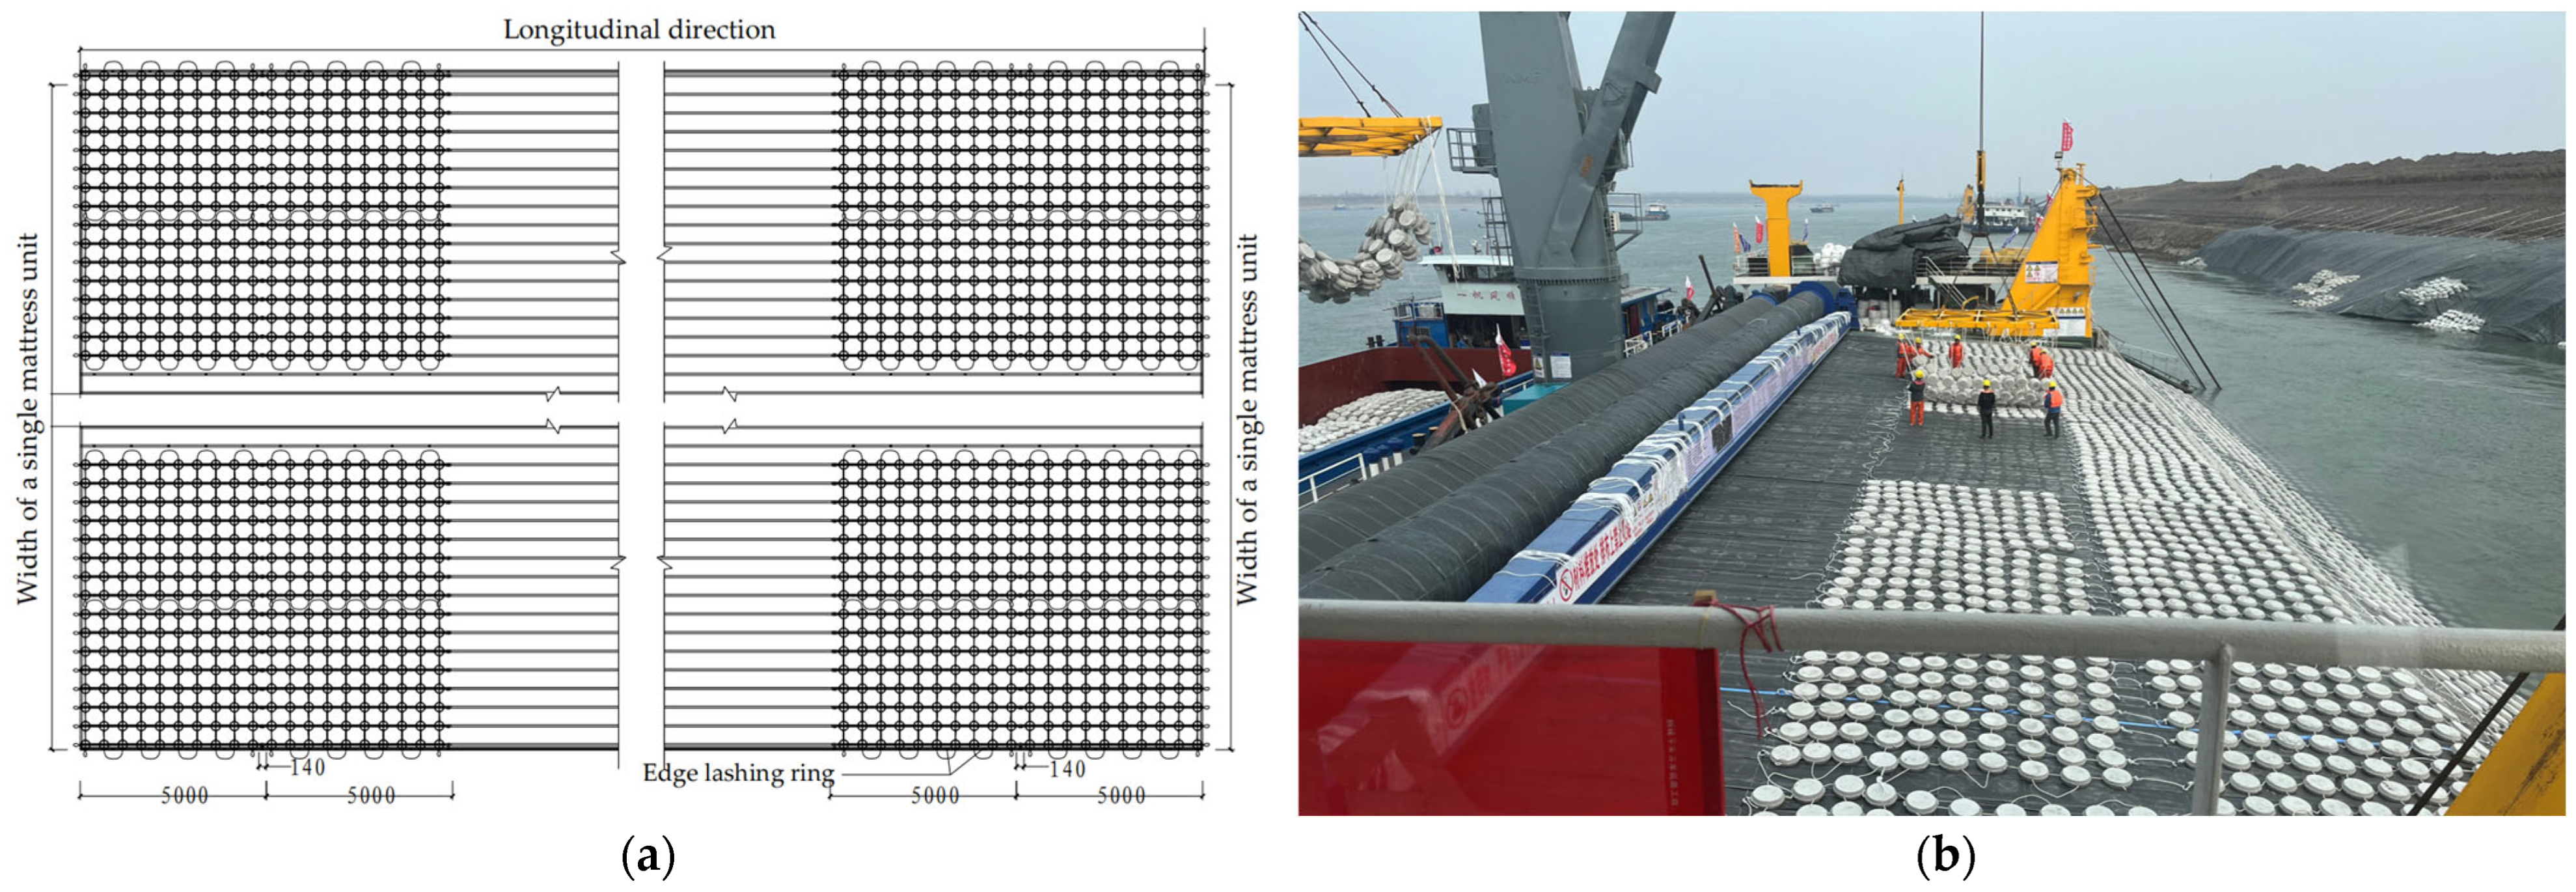
In this project, D1-type flexible mattresses (Figure 2) are used for slope protection and underwater bottom reinforcement. Each individual D1-type interlocking flexible mattress measured 50 m × 40 m, and multiple units were connected to form a continuous strip of 200 m × 40 m for deployment. The mattresses are deployed perpendicular to the flow direction, with concrete interlocking blocks arranged on the surface to enhance structural stability. Additionally, an ecological rock-filling layer is placed on the mattress, with thickness adjusted according to position, to improve the local underwater ecological environment and enhance overall anti-scouring performance. The construction process involves multiple specialized deployment and transport vessels operating as a coordinated fleet, supported by auxiliary ships to form an efficient cooperative system. Prior to construction, detailed underwater topographic surveys were conducted to fully understand the underwater terrain and flow distribution, laying a solid technical foundation for construction planning and deployment precision control.

2.2. Mechanisms of Flexible Mattress Failure

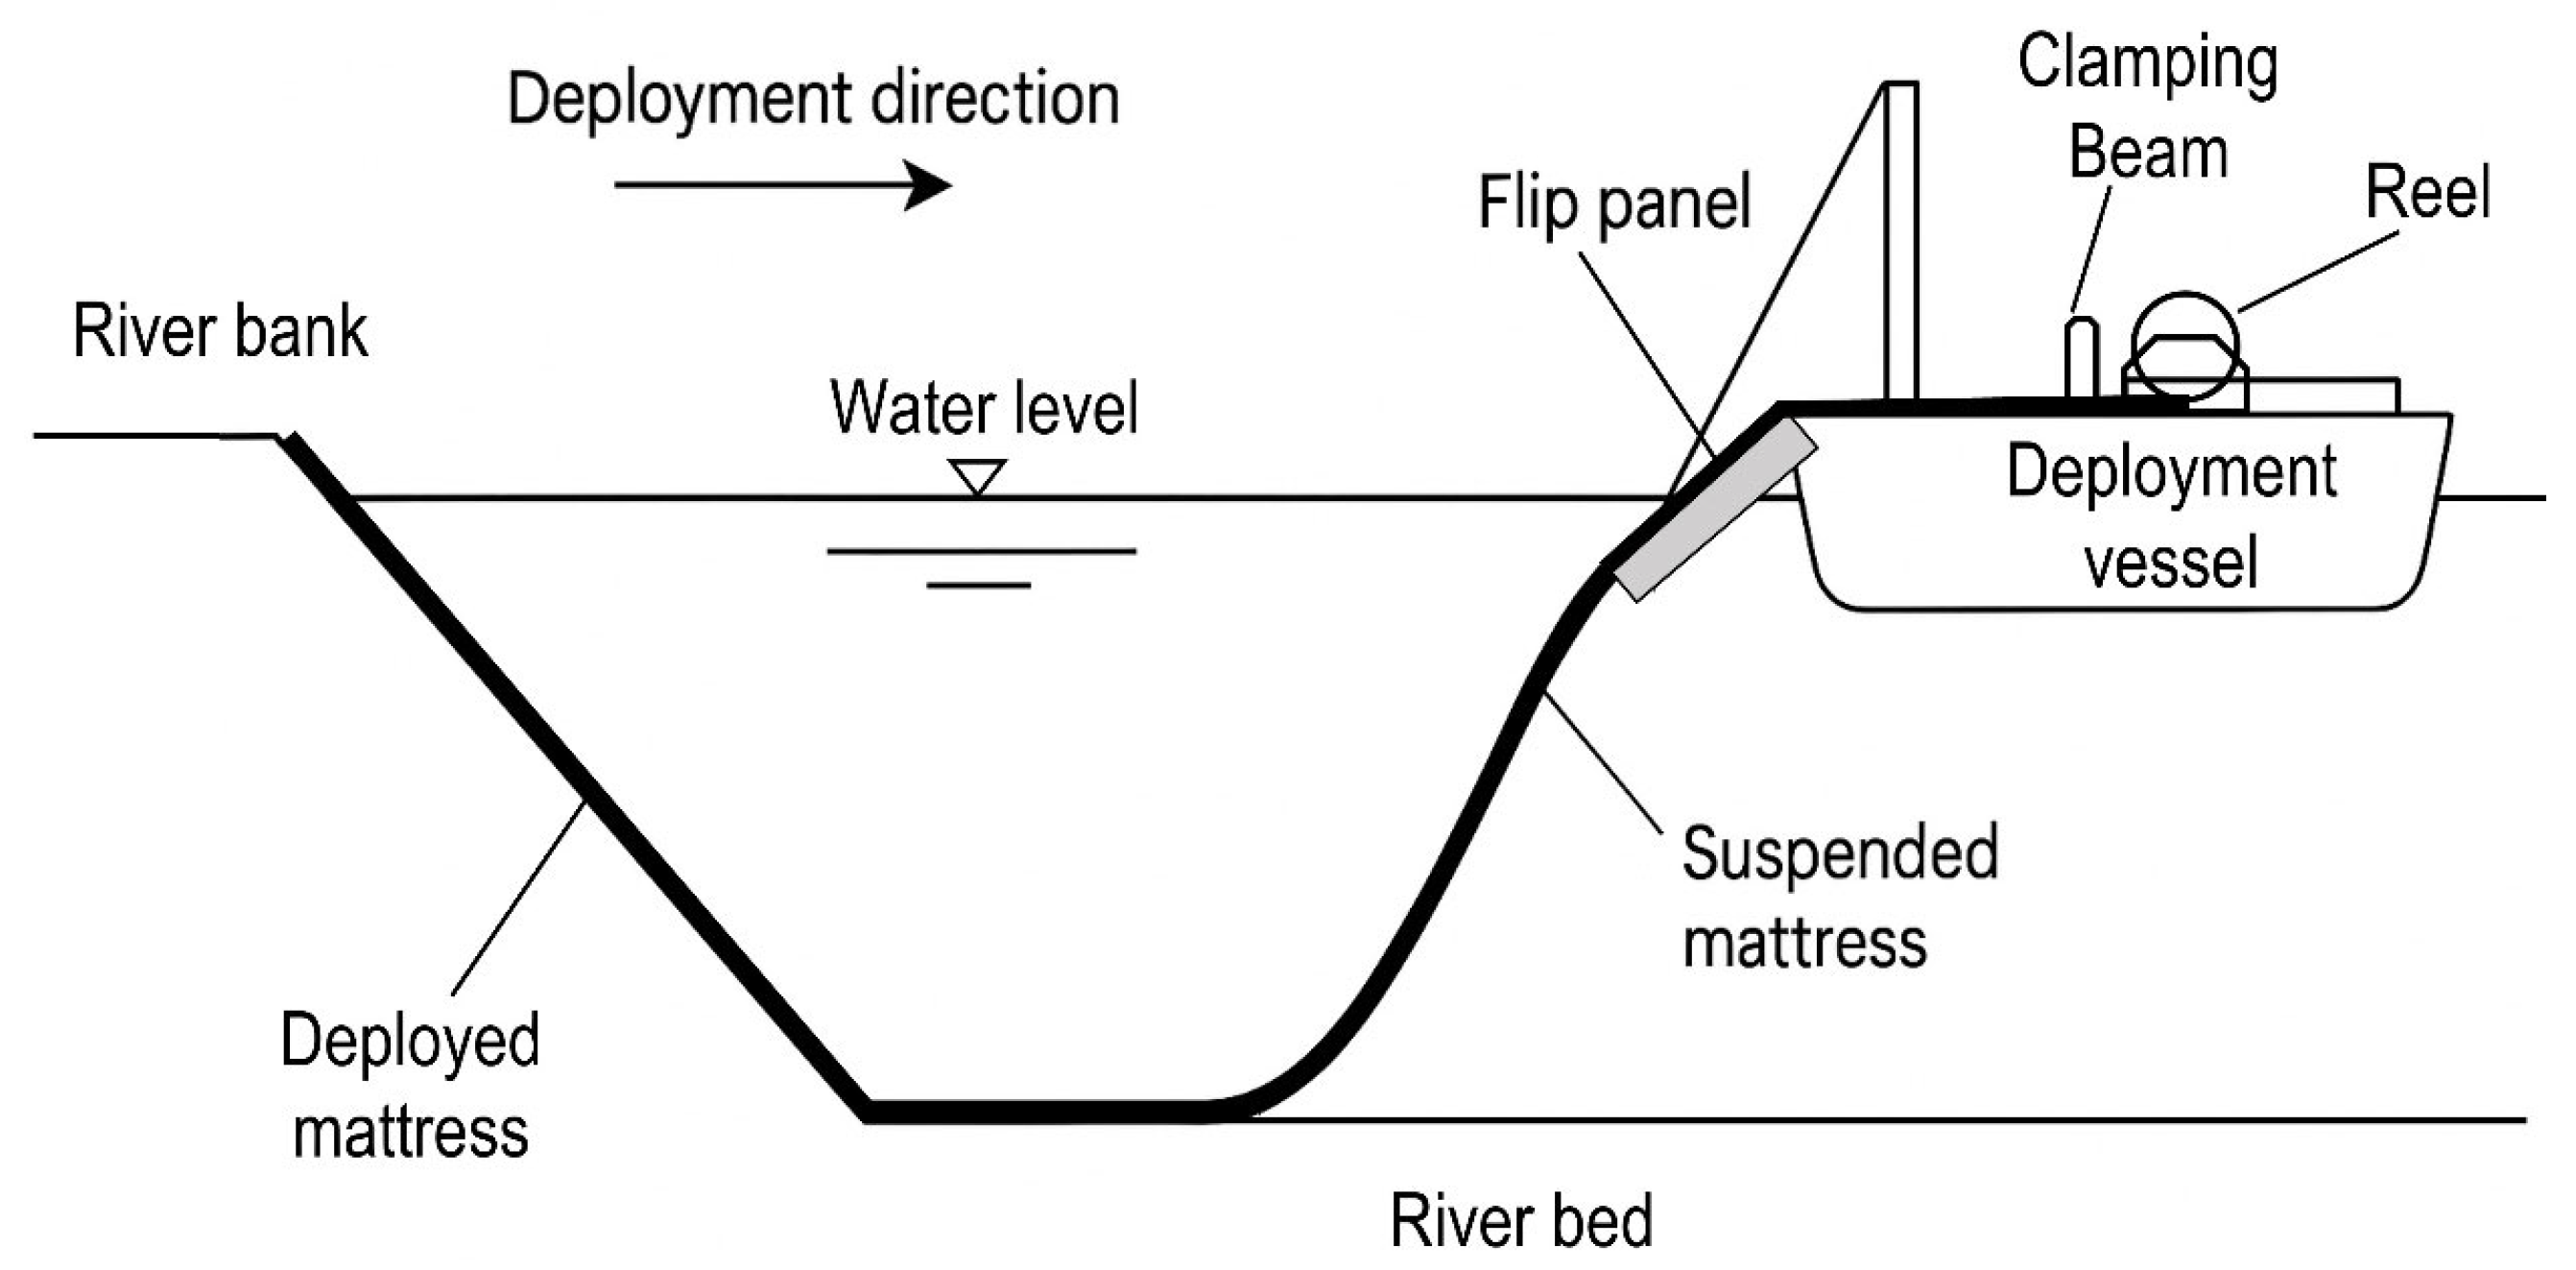
To reduce the hydrodynamic force, mattresses are generally deployed perpendicular to the flow direction, meaning the vessel moves in a direction transverse to the current. This reduces the direct impact force from water. However, due to the natural turbulence in river systems, the flow patterns are often unstable, and the direction of water contact on the mattress surface is inconsistent. As a result, the projected area of the suspended mattress in the flow direction is not zero. Consequently, under the combined action of hydrodynamic forces and the self-weight of the mattress, both the mattress and deployment equipment experience substantial loading.
During submergence, if there is an angle between the mattress and the flow direction, the mattress may “catch” the flow, increasing the tensile force exerted by the nylon ropes attached to both sides for fixation. This can lead to localized failure at the rope connections, resulting in tearing of the mattress.
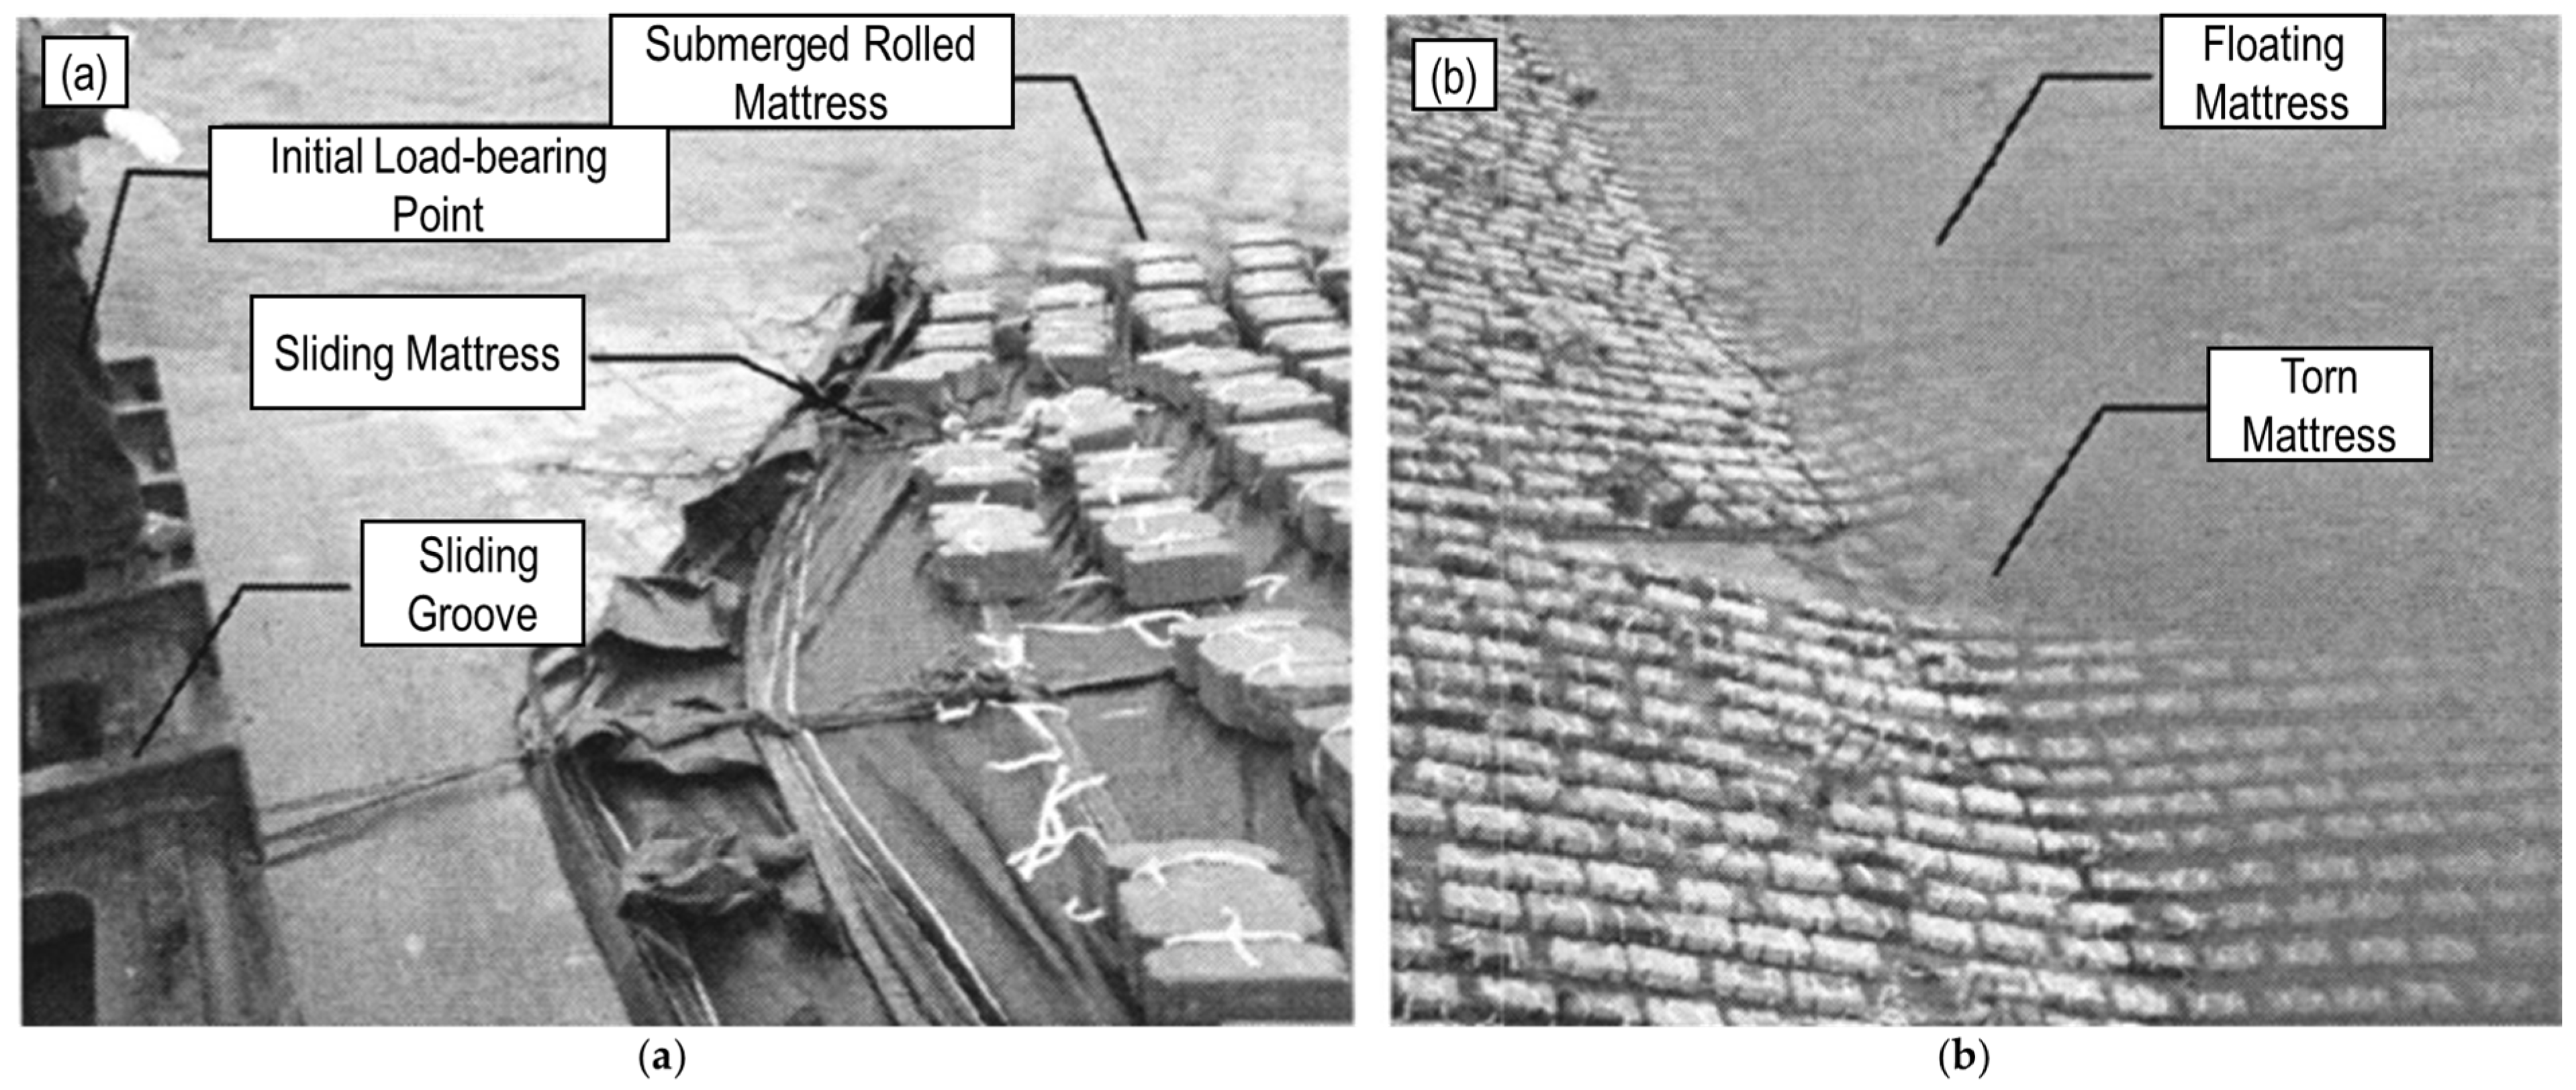
According to the findings of Xie Shengkai [21] in the Heishazhou Channel regulation project, when deploying mattresses perpendicular to the flow, the first row of mattress units along the edge is clamped in a sliding groove (see Figure 3a) to prevent the mattress from sliding downstream on the deck and to guide the deployment. When the flow has a certain velocity, its direction will not be perfectly parallel to the mattress. In particular, flow separation caused by the prow of the deployment vessel creates substantial tangential impact forces on the upstream edge of the mattress, which translates into significant tensile loads. Due to the current sliding groove layout, these forces are not evenly distributed along the upstream row of mattress units. Instead, they concentrate on the bottommost interlocking block within the groove, which is secured only by two ropes. This makes it highly susceptible to detachment, initiating a sliding motion downstream. Once the first unit is dislodged, the tensile load shifts upward, causing sequential failure of the next unit and continuing up the groove until all units are detached, leading to what is known as a mattress sliding failure [22,23,24,25].
Once slippage occurs, the upper edge of the submerged portion of the mattress is prone to rolling due to flow impact and turbulent uplift. This results in two adverse consequences: (1) the mattress deviates from its designated bedding position, failing to meet design specifications and wasting materials; (2) the rolled-up front end of the mattress increases its frontal area against the flow, intensifying blockage and creating more pronounced vortices and turbulence. This, in turn, increases the local flow velocity, causing the mattress to oscillate vertically under flow impact. Such oscillation can result in tearing of the mattress, as shown in Figure 3 [26,27,28].
When the current has a higher velocity, the suspended parts of the mattress and submerged concrete blocks on the deck receive vertical hydrodynamic forces from the upstream direction, causing the mattress to slide downstream, leading to sliding or contraction failures. Furthermore, once slippage occurs, the upper submerged edge of the mattress, driven by hydrodynamic force and turbulent eddies, tends to roll up, producing two significant negative outcomes: (1) the mattress deviates from its intended bedding location, compromising the design objective and resulting in material waste; (2) the rolled front end increases the flow-facing surface area of the mattress, enhancing water resistance and creating intensified local turbulence. This elevates the local flow speed, leading to more violent vertical oscillations and flotation under flow impact, which may eventually tear the mattress (see Figure 4) [29,30,31].

3. Numerical Modeling and Force Analysis

3.1. Hydrodynamic Condition Analysis

3.1.1. Establishment of Hydrodynamic Model

The Xiongjiazhou reach is located at the lower end of the Jingjiang section and is one of the meandering segments of the middle Yangtze River that has undergone channel shortening via chute cutoff. It is a typical S-shaped expanding bend. The left bank of the Jingjiang is composed of a typical binary soil structure, with an upper layer of cohesive soil and a lower layer of non-cohesive soil. The cohesive layer is relatively thin, generally 1–3 m thick. The right bank mostly features a hilly terrace landform composed of granite, whereas the left bank is more susceptible to erosion. The riverbed is primarily composed of medium to fine sand, which has weak resistance to scouring. This study focuses on two bends in the Xiongjiazhou reach: Guanyinzhou and Qigongling, spanning a total length of approximately 21 km.
In the Delft3D-based hydrodynamic numerical simulation, grid generation is a key step in model development, directly affecting simulation accuracy and computational efficiency. In this study, the RGFGRID module was used to generate a structured, regular grid. Boundary data from the research area were imported, and initial contours were drawn using spline curves, followed by iterative optimization of grid density and boundary fitting. To address boundary jaggedness caused by complex terrain, irregular elements were minimized during design, while maintaining precision and controlling the total number of elements. The final grid resolution is approximately 35 m × 11 m, comprising 56,792 elements based on a Cartesian coordinate system. Orthogonality checks showed that most grid elements met the cosine error threshold of less than 0.02, indicating good overall quality suitable for subsequent computations.
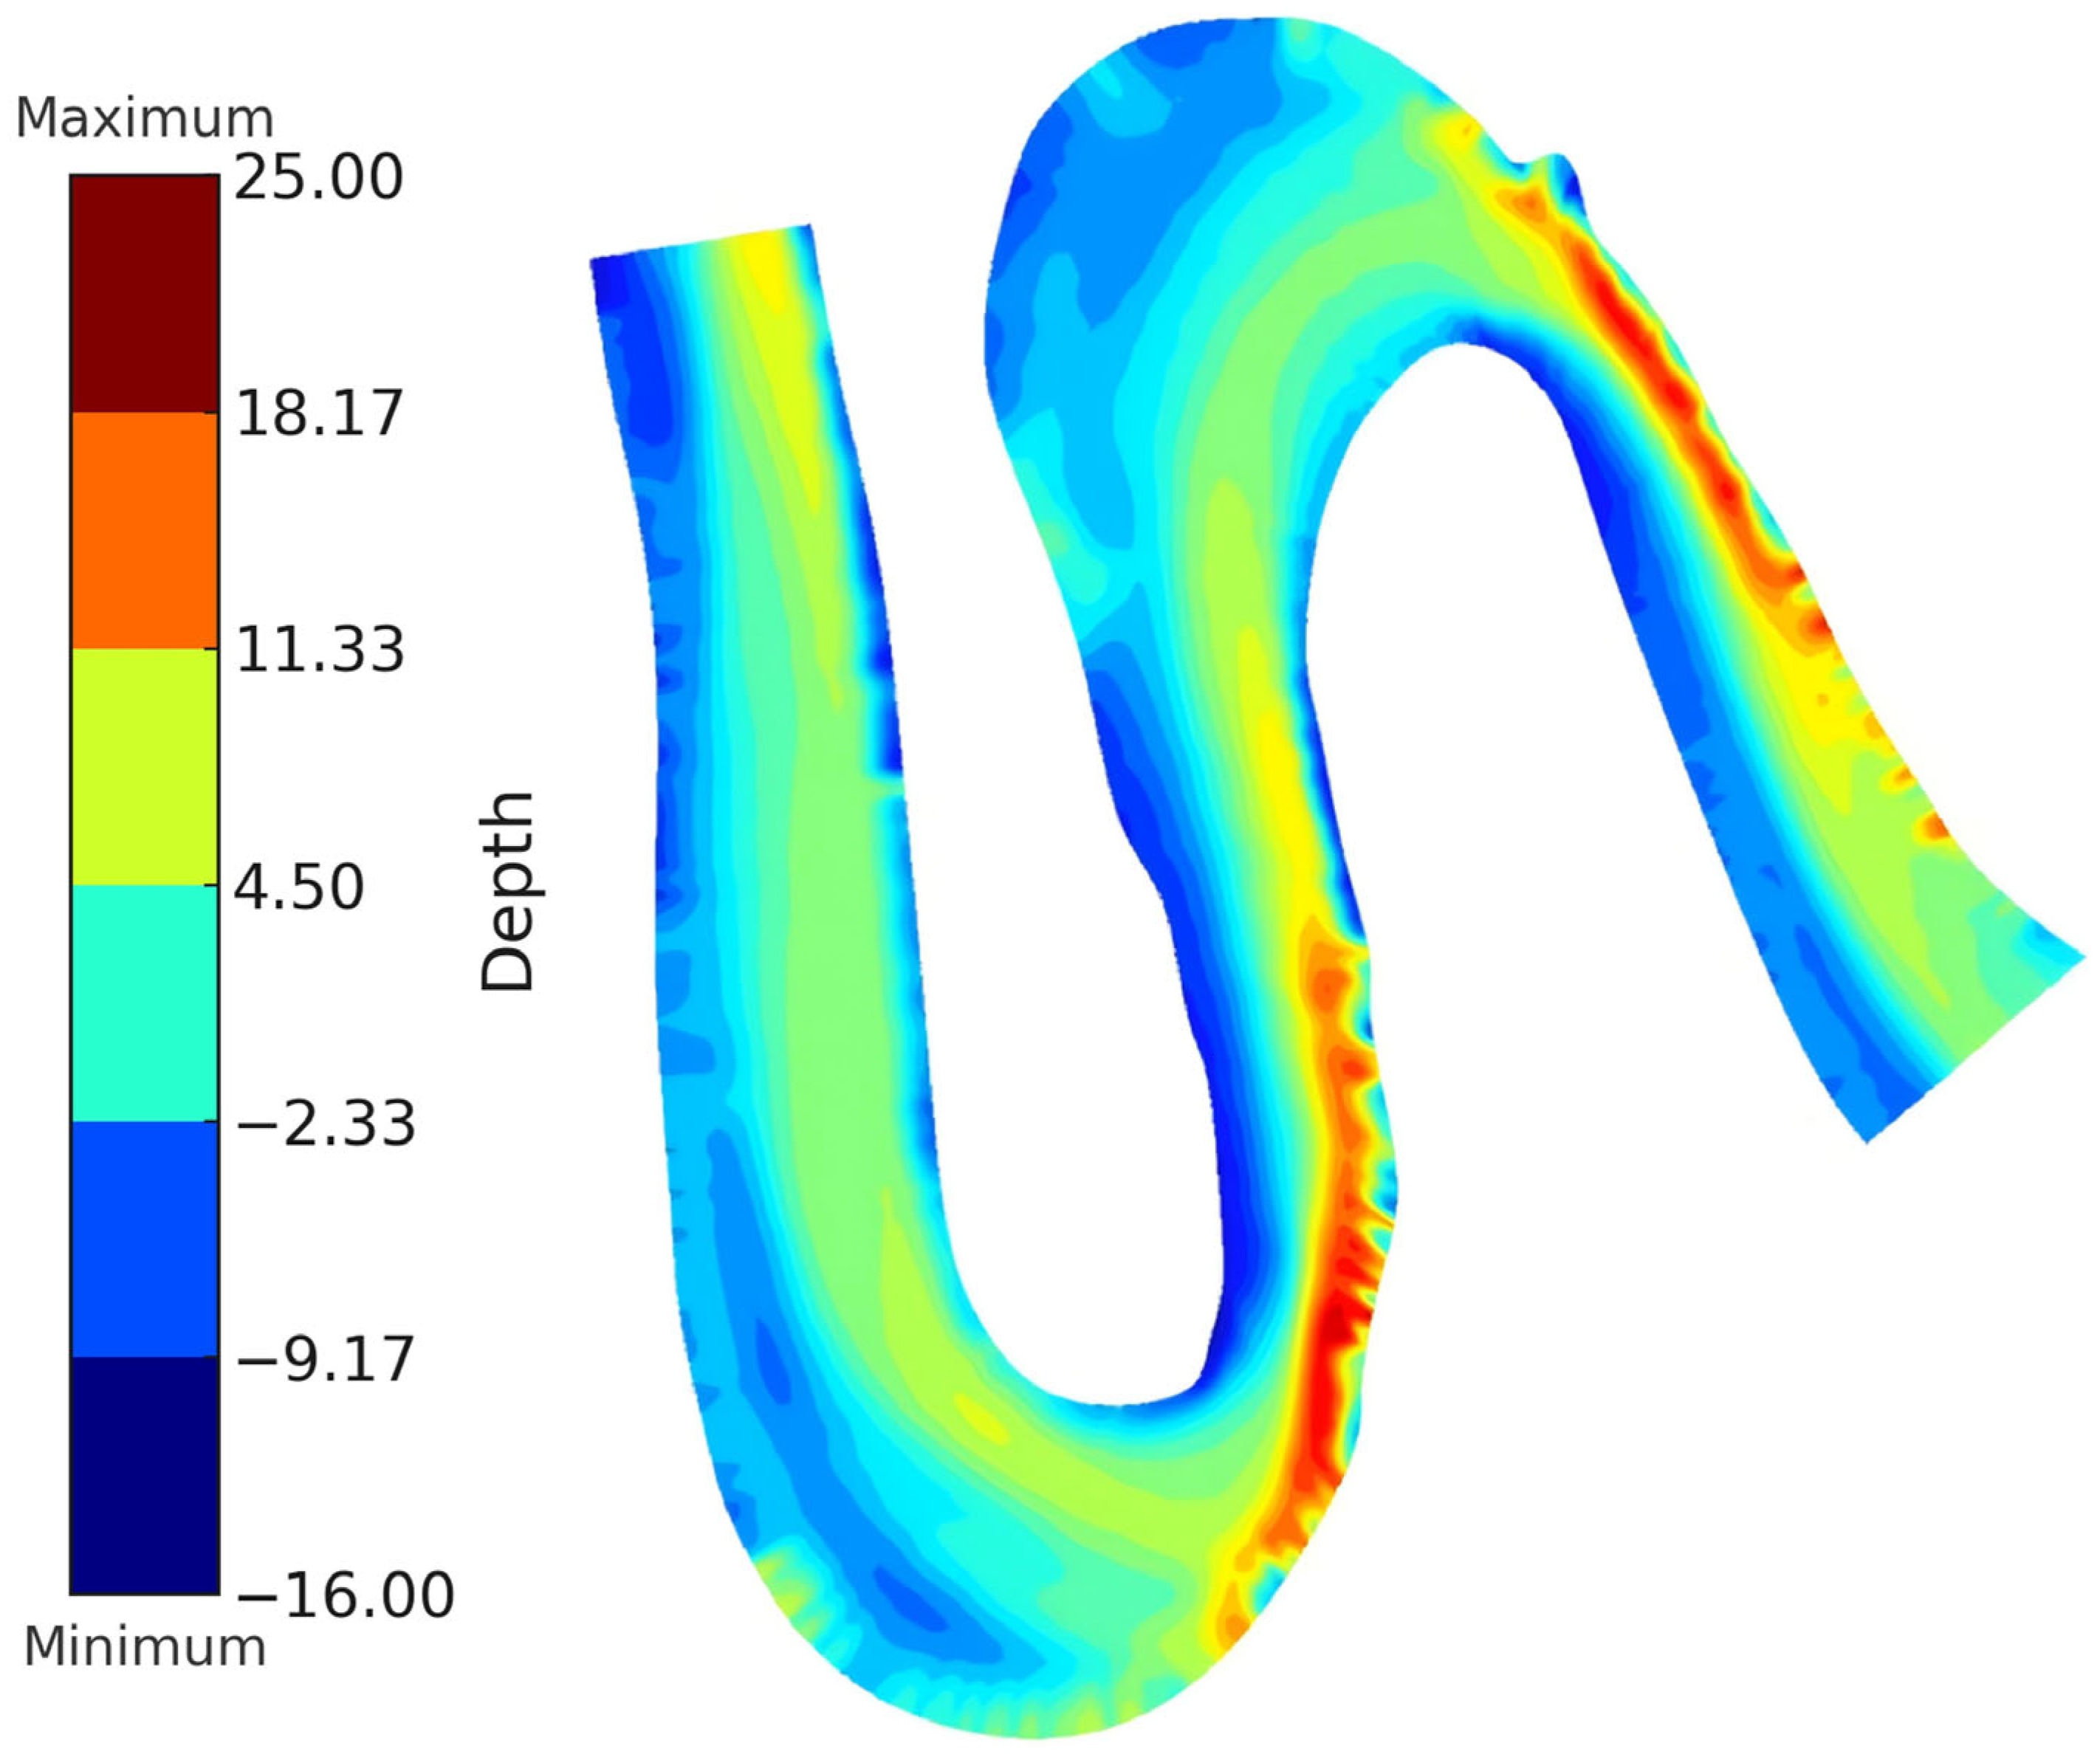
Accurate underwater topography is essential for reconstructing realistic flow fields in numerical hydrodynamic simulations. This study employed measured bathymetric data collected in July 2024 for the Xiongjiazhou to Chenglingji section and used the Delft3D-QUIKIN module to construct the terrain. Bathymetric data were first organized into .xyz formatted elevation point files. After ensuring consistency in the coordinate system, the data were jointly imported with the pre-generated grid to perform terrain interpolation. Linear interpolation was used in densely sampled areas to better approximate real terrain, while Delaunay triangulation was applied to sparse regions to fill gaps. Where necessary, shoreline data were manually supplemented to enhance precision. The resulting terrain file reveals a main channel with a trunk-like shape, distinct longitudinal water depth gradients, uneven erosion and deposition along banks, and cross-sections with eccentric U-shaped profiles. These topographic features reflect actual flow conditions and can be exported as .dep files for model computation.
During the model framework construction phase, the core input files must first be loaded, including the computational grid file (.grd), shoreline boundary file (.enc), and bathymetric data file (.dep), in order to establish a complete set of topographic and boundary conditions. Regarding temporal control parameters, the simulation start and end times are set based on observed data from the year 2020, ensuring the simulation captures representative hydrological variation. The Reference date parameter defines the origin of the time axis for output results, facilitating comparison with observed data. The choice of timestep plays a critical role in both computational efficiency and numerical stability. Although the Alternating Direction Implicit (ADI) scheme employed by Delft3D allows relatively flexible timestep settings—requiring only that the Courant Number remain below 10 for stability—it is generally recommended that the Courant Number be kept below 1 to improve accuracy and stability. After multiple rounds of calibration and testing, a timestep of 30 s was ultimately selected to achieve a reasonable balance between computational accuracy and efficiency.
For the initial condition settings, a cold start approach is used to initialize the computational domain, assigning uniform initial water level and discharge values across the simulation domain to establish a physically consistent initial hydrodynamic field. Based on field measurements from 2020, the initial water level is uniformly set to 14.448 m, and the inflow boundary discharge is set to 31,370 m3/s. These settings ensure physical consistency at the onset of the simulation, providing a stable foundation for the subsequent development of flow fields and sediment transport dynamics (see Figure 5).
Three types of boundary conditions are defined in the model:
Inflow boundary conditions: Where observed discharge data are available, they are directly used as inflow inputs. In the absence of observational data, discharge or water level variation curves are manually prescribed based on hydrological records. In this study, various inflow discharge combinations were applied under different simulation scenarios.
Outflow boundary conditions: When observed water levels are available, they are directly used as boundary inputs. If not, manually defined discharge or water level variation curves based on hydrological data are adopted. This study employed several water level combinations at the outflow boundary for different simulation scenarios.
Land boundary conditions: Based on the principles of “impermeable rigid wall” and “no-slip,” the normal and tangential velocities at land boundaries are both set to zero, ensuring that the flow cannot penetrate or slip along the interface.
The selection of physical parameters in the hydrodynamic model directly influences the rationality and physical consistency of the simulation results. Therefore, parameter configuration must reflect actual river characteristics and draw on established research experience. The gravitational acceleration is set at the standard physical constant of 9.81 m/s2, and water density is uniformly set to 1000 kg/m3, corresponding to typical freshwater conditions at ambient temperature. The choice of bed roughness significantly affects velocity distribution, energy loss, and hydraulic calculations. This study adopts the Manning’s equation to represent bottom friction. Through calibration based on comparisons between simulated and observed flow velocities and water levels under typical hydrological conditions, the Manning roughness coefficient was determined to be 0.014, ensuring high accuracy in the model’s representation of flow characteristics.
The key parameters defined during the model setup are summarized in Table 1.

3.1.2. Flow Velocity Distribution Under Different Discharge Conditions

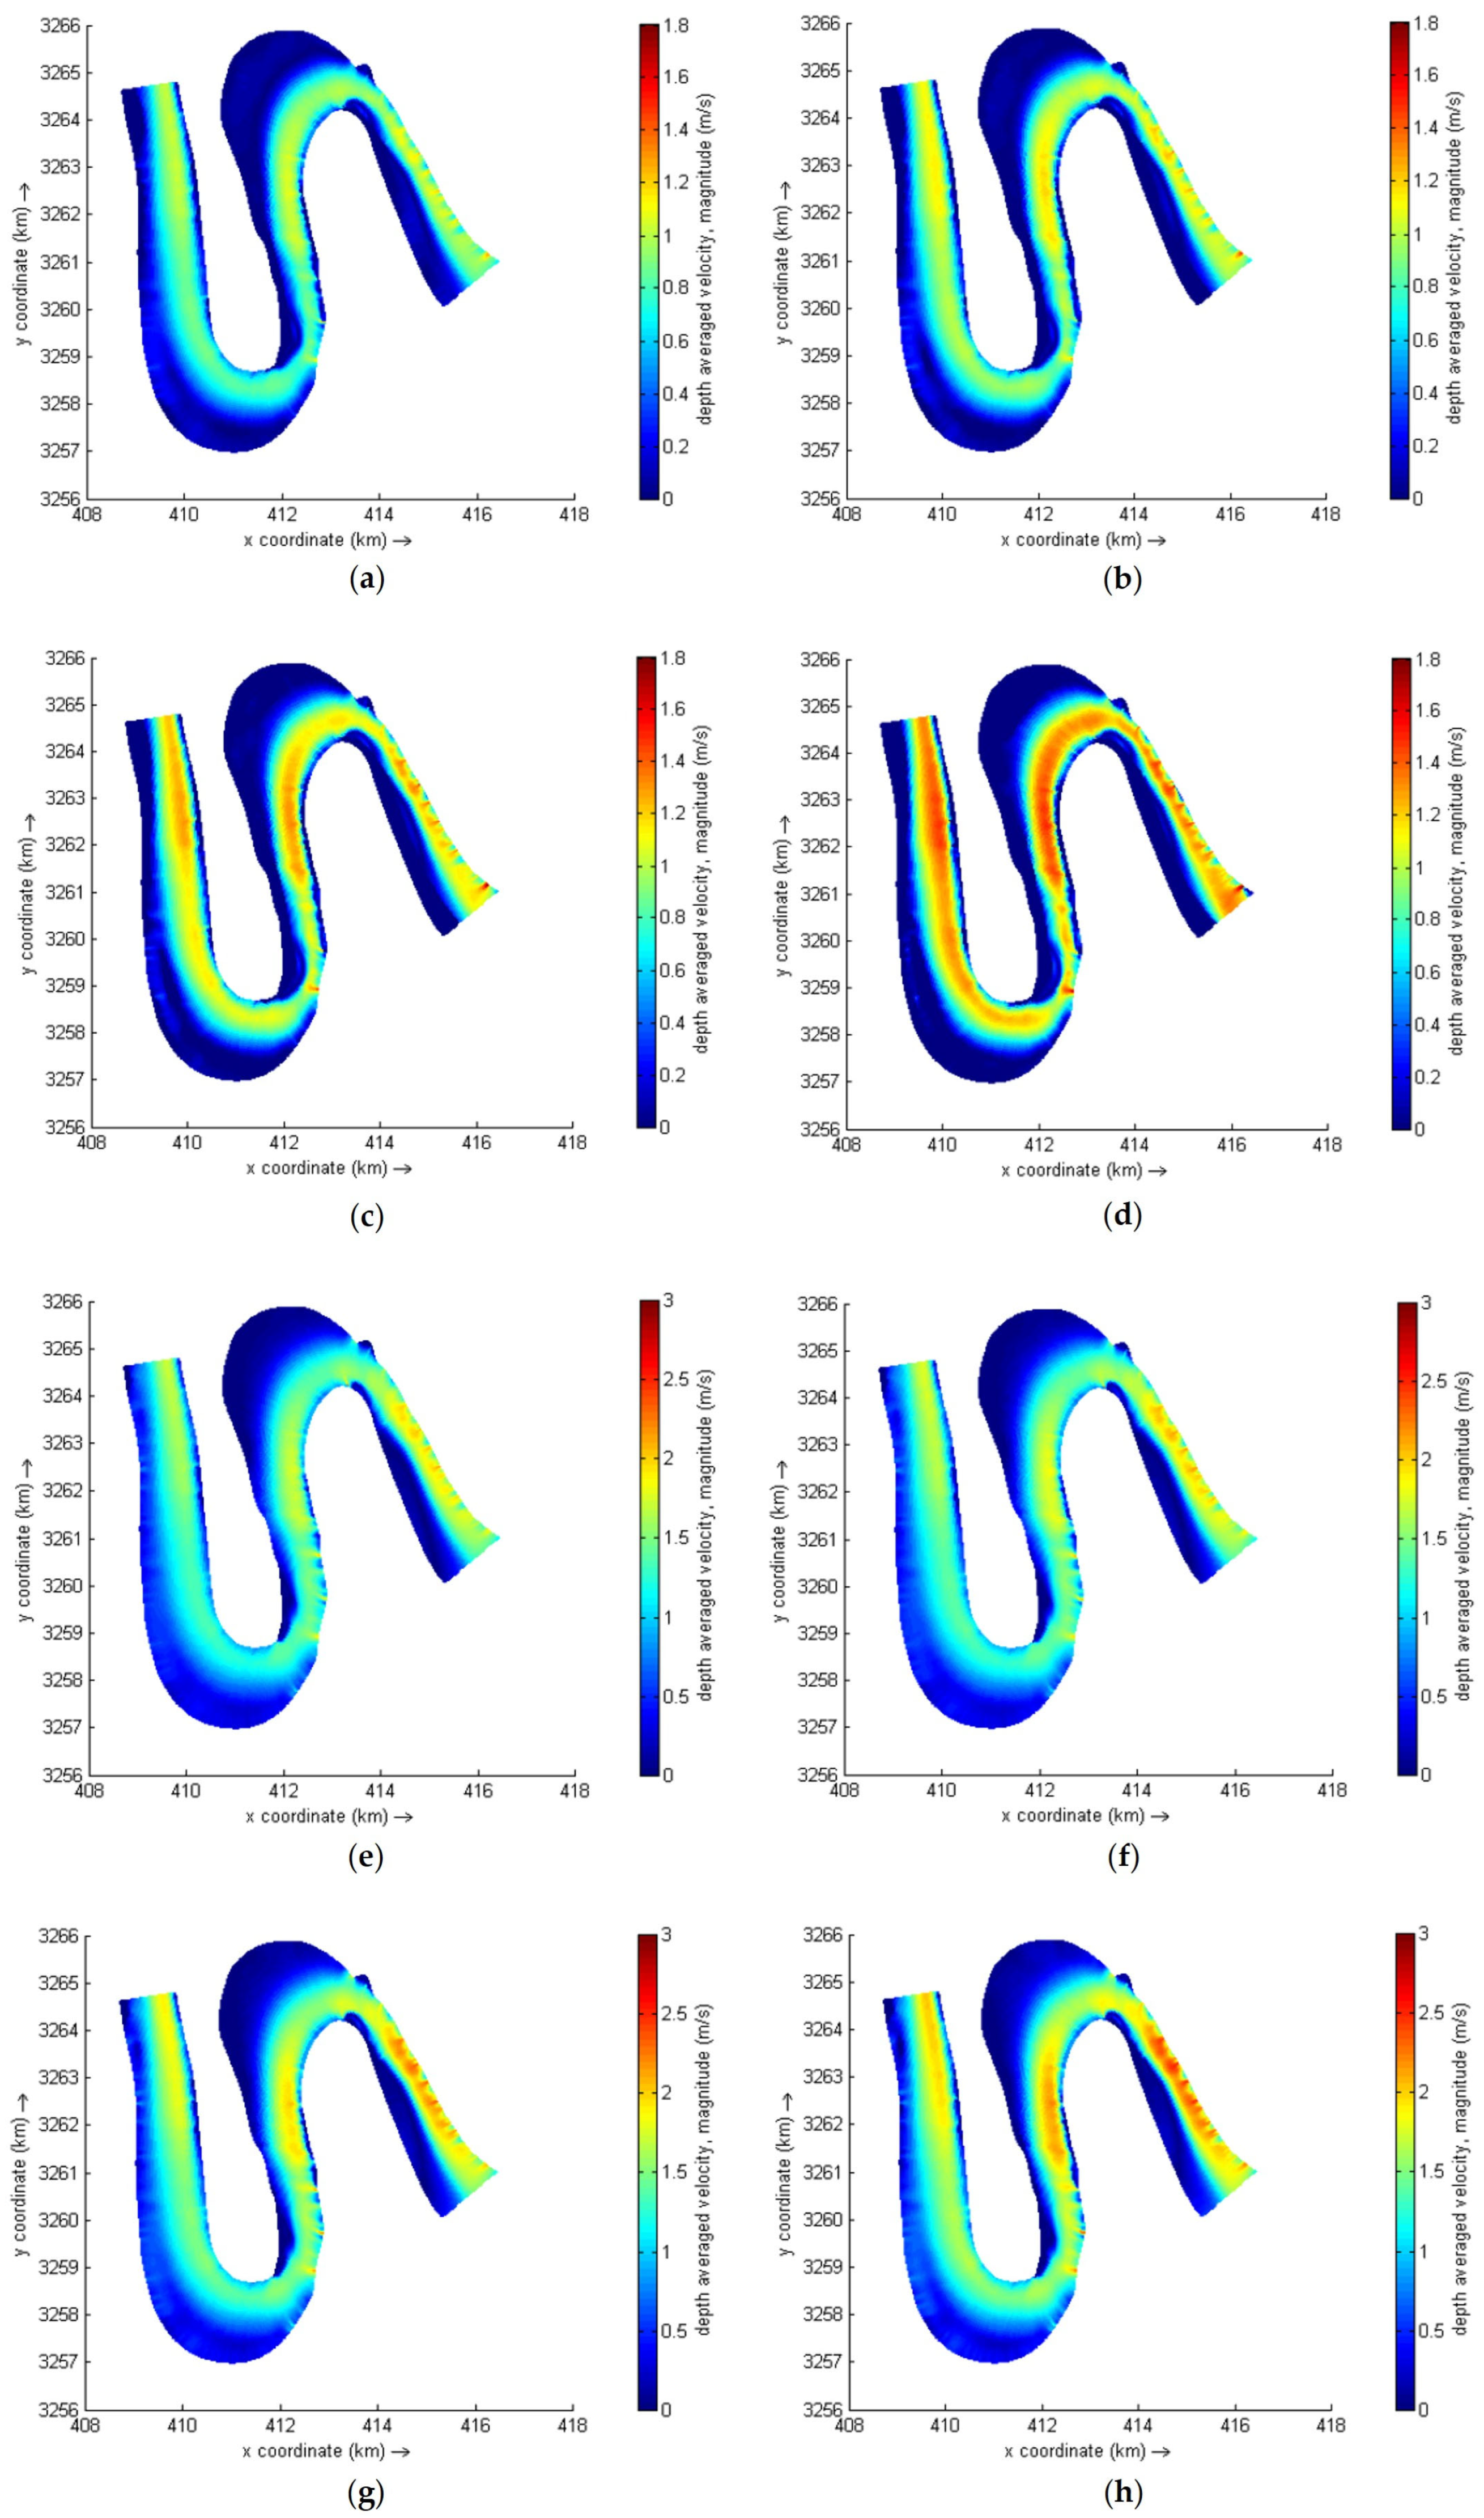
To investigate the hydrodynamic characteristics of the meandering river reach under different inflow conditions, eight representative simulation scenarios were designed (see Table 2), with each scenario defined by a combination of inlet discharge and outlet water level as boundary conditions. The scenario settings are based on field measurement data from 2019 to 2020, water level time series from the Chenglingji hydrological station, and discharge time series from the Jianli station. Considering the requirement to avoid construction during high-flow periods for flexible mattress deployment, boundary conditions and initial fields were established using two representative periods—low-flow and mean-flow seasons.
The inlet discharge was set within the range of 7000 to 15,000 m3/s, and the water level at the outflow boundary is assigned based on hydrological station records corresponding to the simulation period. The corresponding outlet water levels ranged from 4 m to 11 m, increasing with the magnitude of the inflow discharge. At model initialization, the domain was defined as a quiescent flow field. After steady-state computation, the model transitioned into unsteady simulation mode to analyze variations in key hydrodynamic parameters such as velocity distribution, shear stress, and water level response across scenarios.
(1)
General Characteristics of Flow Velocity Distribution:
Scenarios 1–4 in Figure 6 and Figure 7 represent the low-flow season. Under these conditions, the velocity distribution within the river reach exhibits pronounced spatial asymmetry. Influenced by the geometry of the S-shaped meanders, a high-velocity band forms along the convex (outer) bank, where flow velocities generally exceed 1.2 m/s and locally reach 1.6–1.8 m/s (depicted as red-yellow transition zones in Figure 6). The main stream shifts toward the outer bend due to centrifugal force, forming a dominant high-speed channel. At the concave (inner) bank of the Qigongling bend, blue zones of near-zero velocity appear, while a distinct tongue-shaped stagnant zone develops at the inner-bank inflection point of the Qizhou bend, indicating significant recirculation and flow blockage effects. These low-velocity regions transition gradually into the mainstream via low-speed bands extending along the banks, reflecting well-developed boundary layers. In the upstream straight section, although the overall velocity field is uniform, narrow low-speed zones are visible along both banks in the figures, indicating that wall friction and boundary layer development still significantly affect near-bank velocities.
Scenarios 5–8 in Figure 6 and Figure 7 represent the mean-flow season. In the upstream straight reach, the velocity distribution is relatively uniform. The central main current band shows velocities ranging from 1.0 to 1.5 m/s, while blue-green low-speed zones (<0.5 m/s) form on both sides due to friction and boundary layer effects, creating a “high–low–high” tripartite pattern. At the first right-hand bend, the main flow rapidly shifts toward the outer bend (red-yellow high-velocity zone in Figure 6), reaching speeds of 1.5–2.2 m/s. Meanwhile, the inner bend forms a typical blue-colored backwater zone, resulting in a flow structure characterized by “fast on convex bank—moderate center—slow on concave bank.” In the second bend, the red-colored main current becomes more concentrated, with local peak velocities reaching 2.4–3.0 m/s. The backwater zone on the inner side narrows significantly, highlighting pronounced flow asymmetry. In the downstream straight section, the high-velocity zone shifts from red to orange, indicating momentum loss and a decrease in velocity to 1.0–1.8 m/s.
(2)
Flow Velocity Variation with Water Level:
In Scenarios 1–4 (Figure 6 and Figure 7), the effect of varying water levels (6 m, 5 m, 4 m, and 3 m) on flow velocity distribution is analyzed. Under high water-level conditions (6 m), the main flow channel is relatively wide. Although a tendency for flow concentration near the convex bank is observed, the maximum velocity is approximately 1.1 m/s, and the overall velocity distribution remains relatively gentle. On the concave bank side, low-velocity or stagnant water zones are present. In this case, the flow velocity gradient is relatively small, resulting in a more uniform distribution. As the water level drops to 5 m, 4 m, and eventually 3 m, the main flow zone begins to shift toward the deep channel and gradually adheres to the riverbank. The effective flow cross-section decreases, and flow velocity intensifies, forming a more pronounced, high-speed main flow corridor. When the water level reaches 3 m, flow velocities can reach 1.7–1.8 m/s. Meanwhile, the boundaries of the inner stagnant water zones become more distinct, and zero-velocity regions expand. In Scenarios 5–8 (Figure 6 and Figure 7), the impact of water level variation from 11 m to 8 m on flow velocity is examined. The overall variation pattern is similar to the situation of dry seasons. Under the 11 m water-level condition, the river section exhibits relatively large water depths and a broad flow cross-section. The main current flows adjacent to the convex bank, but the overall flow velocity remains low, with velocities in the main channel primarily concentrated in the range of 1.5–2.0 m/s. In the velocity distribution map, high-velocity zones appear as wide and shallow belt-like regions, while the concave bank hosts extensive low-velocity or stagnant zones with stable recirculating flow. The high-velocity zones are strongly coupled with the orientation of the deep channel. According to the Chezy formula, flow velocity is proportional to the hydraulic radius, which, in natural rivers, is approximately equal to water depth. Therefore, flow velocities tend to be higher in deep channel areas, and the velocity gradient is most pronounced between the convex-bank shoals and adjacent channel sections. As the water level decreases to 3 m, the flow is constrained to pass through a narrower main channel, resulting in a higher degree of kinetic energy concentration, with local maxima reaching up to 3.0 m/s. The main flow axis becomes attached to the deep channel boundary near the convex bank, forming a scouring pattern characterized by “high-speed flow along the bank and a constricted channel.”

3.1.3. Flow Field Characteristics Analysis

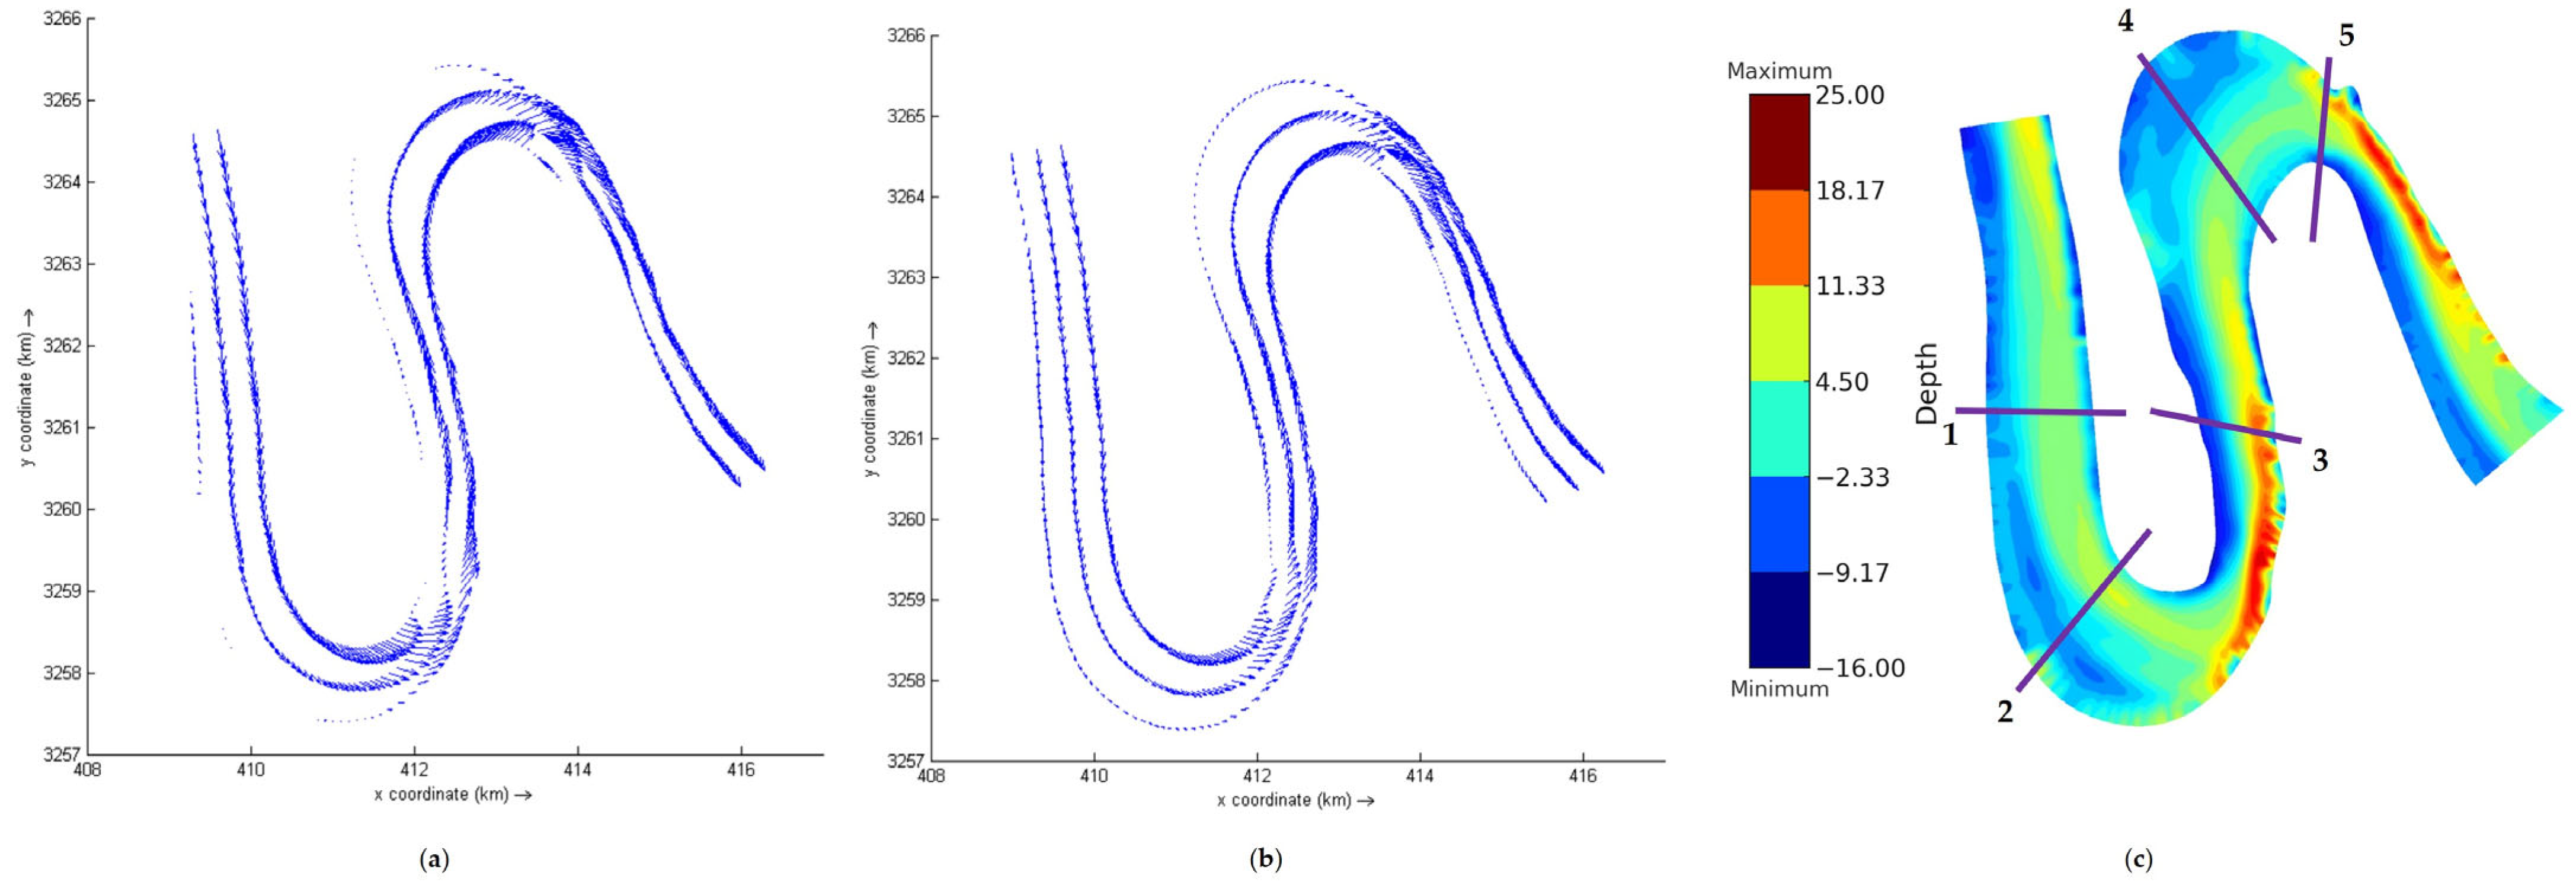
Figure 8 illustrates the velocity vector fields of the river reach under different flow conditions. During the low-flow period (Figure 8a, Scenario 4), the mid-channel shoals at Qigongling and Qizhou bends are exposed, and the main channel is not fully inundated. Velocity vectors are sparse and short, with noticeable elongation only at localized points in the main thalweg. During the mean-flow period (Figure 8b, Scenario 8), increased discharge and water level lead to an expanded flow field. The figure shows two prominent areas where streamlines converge: one near the outlet of the first bend, and the other along the concave bank of the second major bend. These convergence zones reflect the concentration of velocity, the formation of high-velocity corridors, and the intensification of local transverse velocity gradients and shear strength—indicating potential erosion-prone regions.
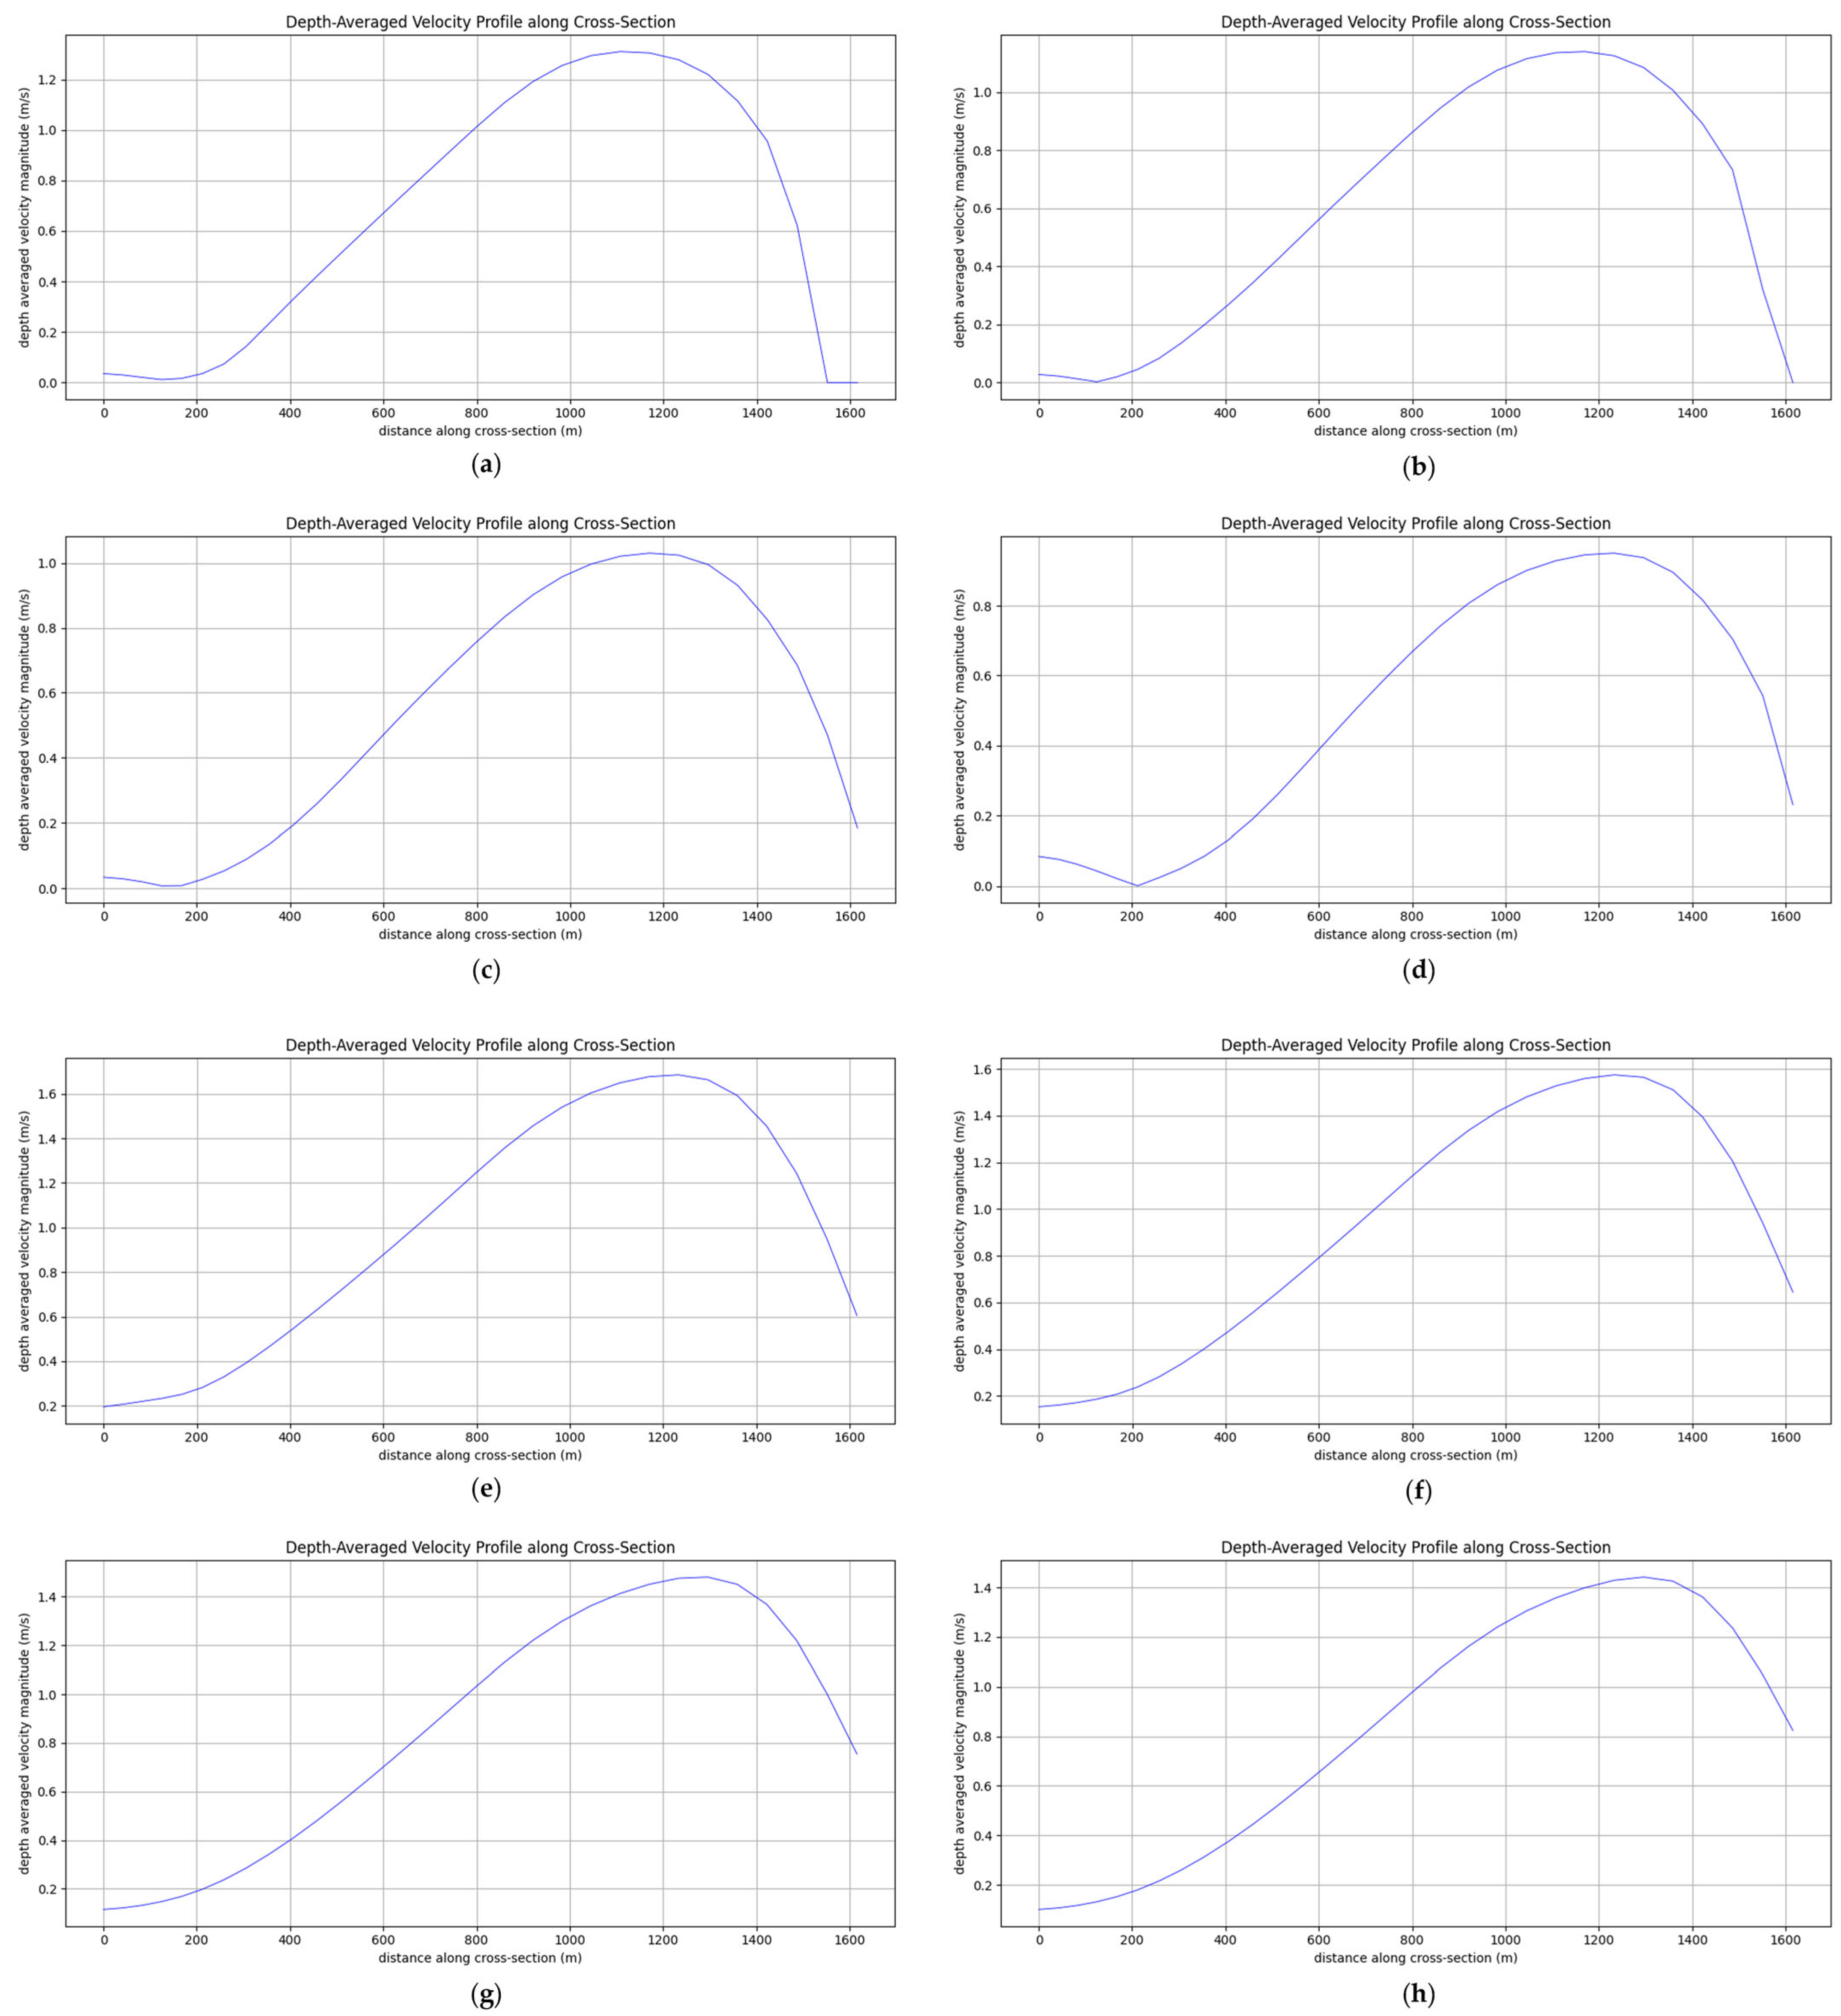
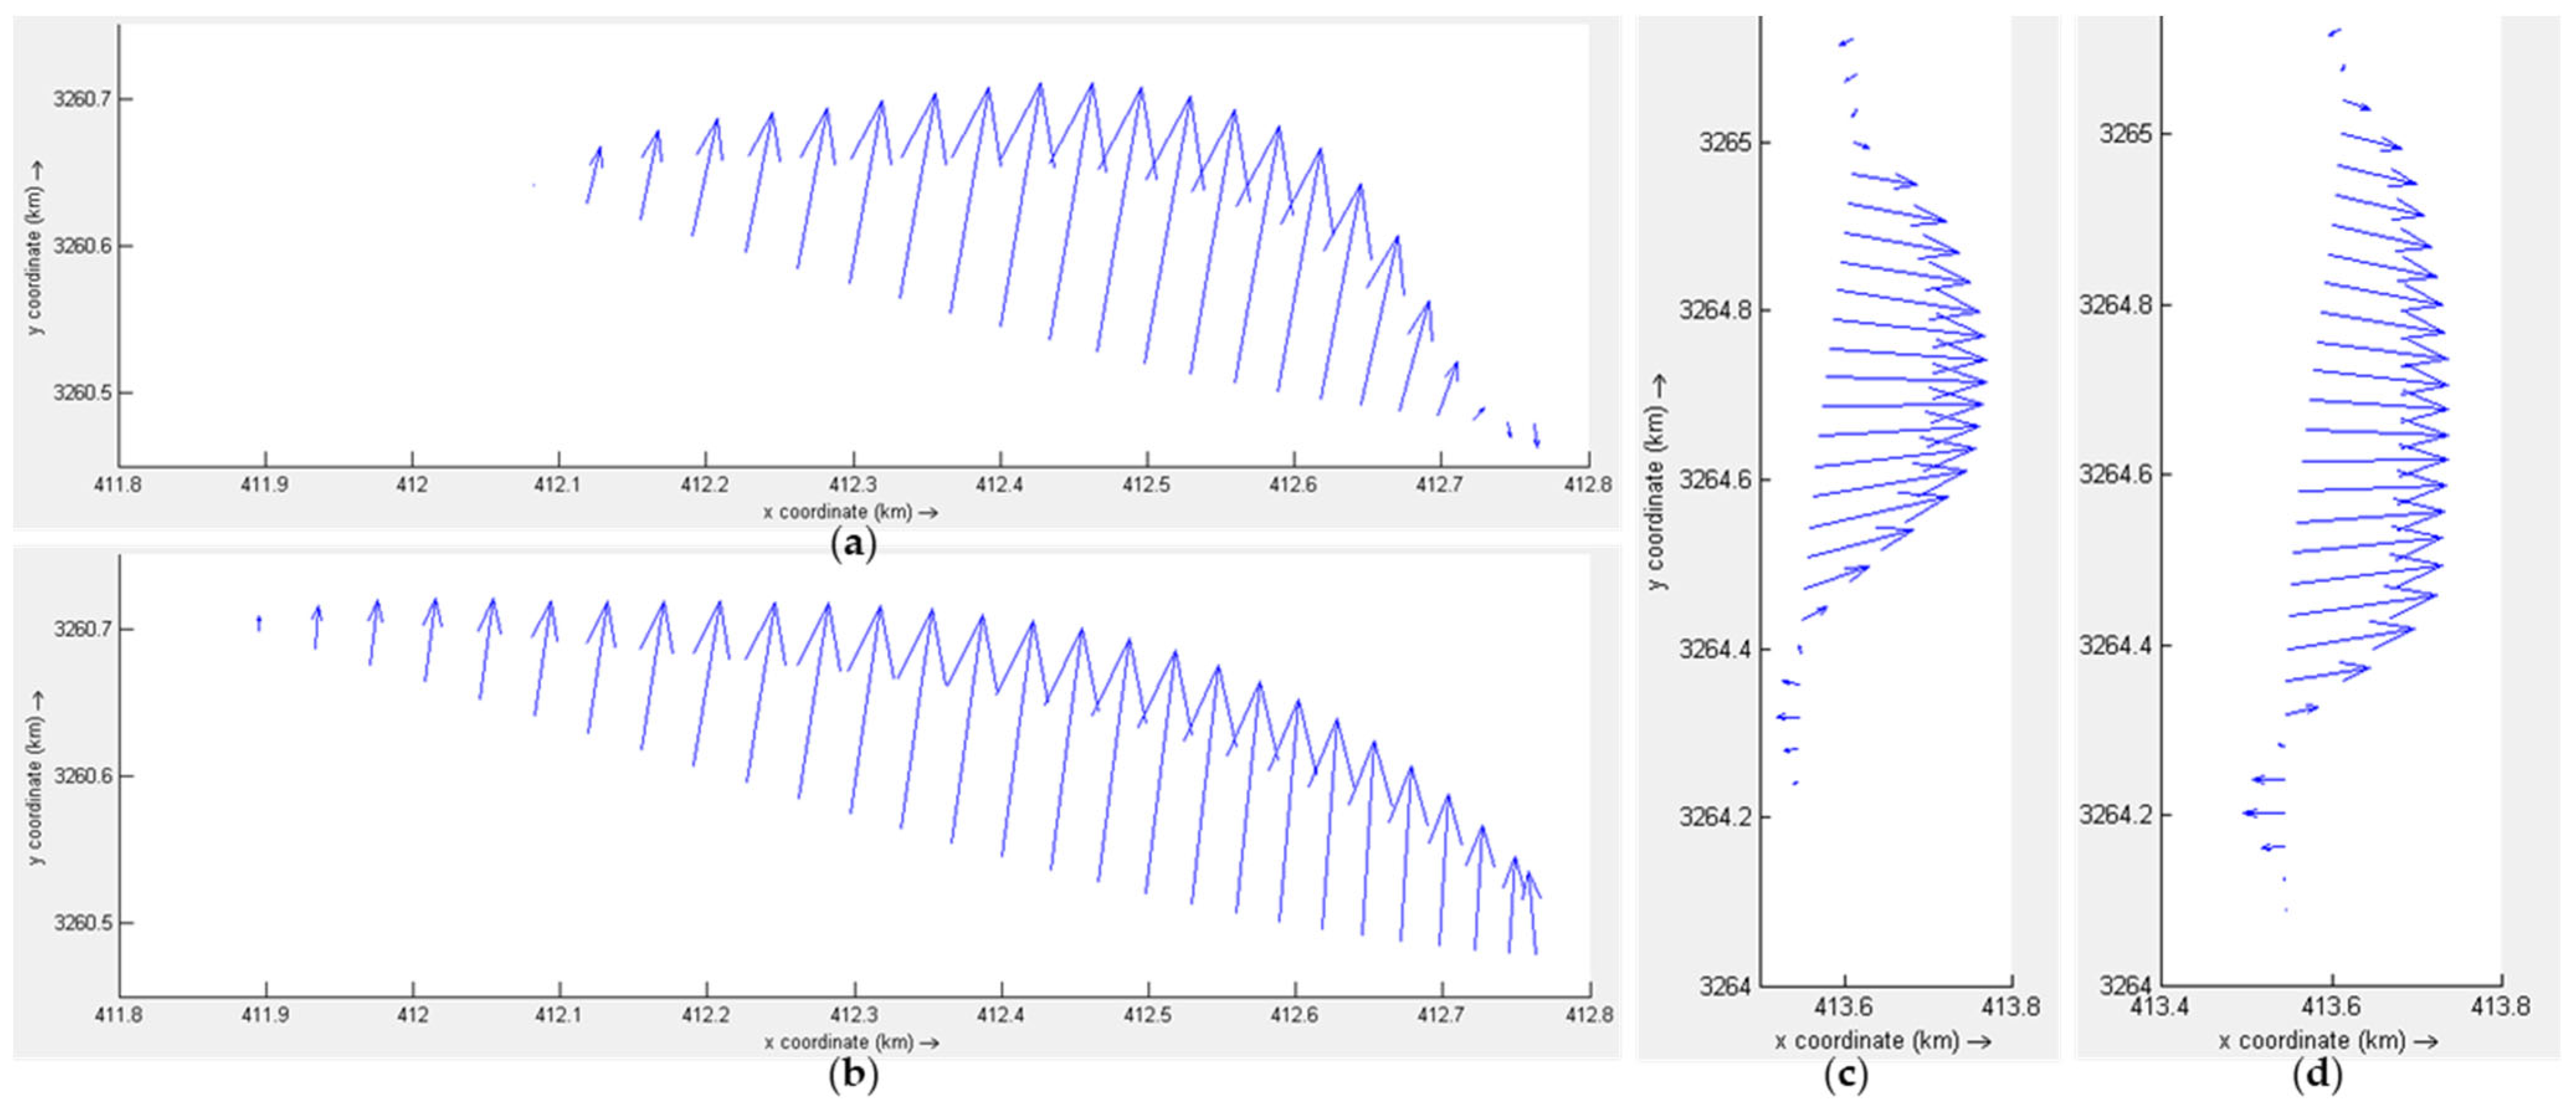
Figure 8c marks the locations of selected representative cross-sections. Figure 9a–d present the velocity vector fields at cross-sections 3 and 5 under different scenarios, respectively. It can be observed that, as conditions shift from the low-flow to the mean-flow period, the high-velocity core zone at Section 3 expands laterally from a narrow central region: during the low-flow period, the velocity vectors are shortest and concentrated at the deepest part of the section; during the mean-flow period, the high-velocity zone extends across nearly half the cross-section, though low-velocity regions still persist at the edges.
At Section 5 (Figure 9c,d), the left side of the diagram (adjacent to the inner bend) exhibits a reverse flow zone under both low-flow and mean-flow conditions. The reversed velocity vectors clearly indicate the presence of a stable recirculation zone along the inner bend. During the flood period, however, the mainstream flow dominates the cross-section, compressing the recirculation region into a narrow near-bank strip, with reversed blue vectors almost disappearing from the diagram.
Moreover, the broad recirculation zones observed during the low-flow season tend to facilitate sediment platform formation, which provides favorable habitats for aquatic organisms. However, as the water level rises, the high-energy main flow intrudes into these areas, compressing the backflow tongue to a width of just a few tens of meters. Consequently, sediment deposition zones are forced to migrate toward the shallow nearshore areas. The high-velocity band shifts closer to the bank toe, reflecting an increase in bank shear stress, which poses erosion risks and may even lead to bankline retreat.

3.1.4. Model Validation

To evaluate the applicability and accuracy of the constructed Delft3D-Flow hydrodynamic model, this section uses measured hydrological data from August 2020. The simulation was conducted for 12 August, with a duration of eight hours. The inflow discharge at the upstream boundary was set to 31,370 m3/s, and the downstream boundary water level was set to 14.448 m. Four representative cross-sections (See Section 1, Section 2, Section 4, and Section 5 in Figure 8c) were selected to compare the simulated water levels with the measured data, as shown in Table 3.
To quantify the consistency and deviation between the model simulation results and the measured data, three commonly used statistical metrics were employed in this study: Root Mean Square Error (RMSE), Mean Absolute Error (MAE), and the coefficient of determination (R2). For water level validation, the calculated values were RMSE = 0.0089 m and MAE = 0.0073 m, both significantly lower than the typical engineering accuracy requirement (±0.05 m). The coefficient of determination was R2 ≈ 0.9992, indicating a high degree of linear correlation between the simulated and observed water levels.

3.2. Analysis of Forces on the Mattress Structure

3.2.1. Model Construction

(1)
Determination of the Catenary Equation
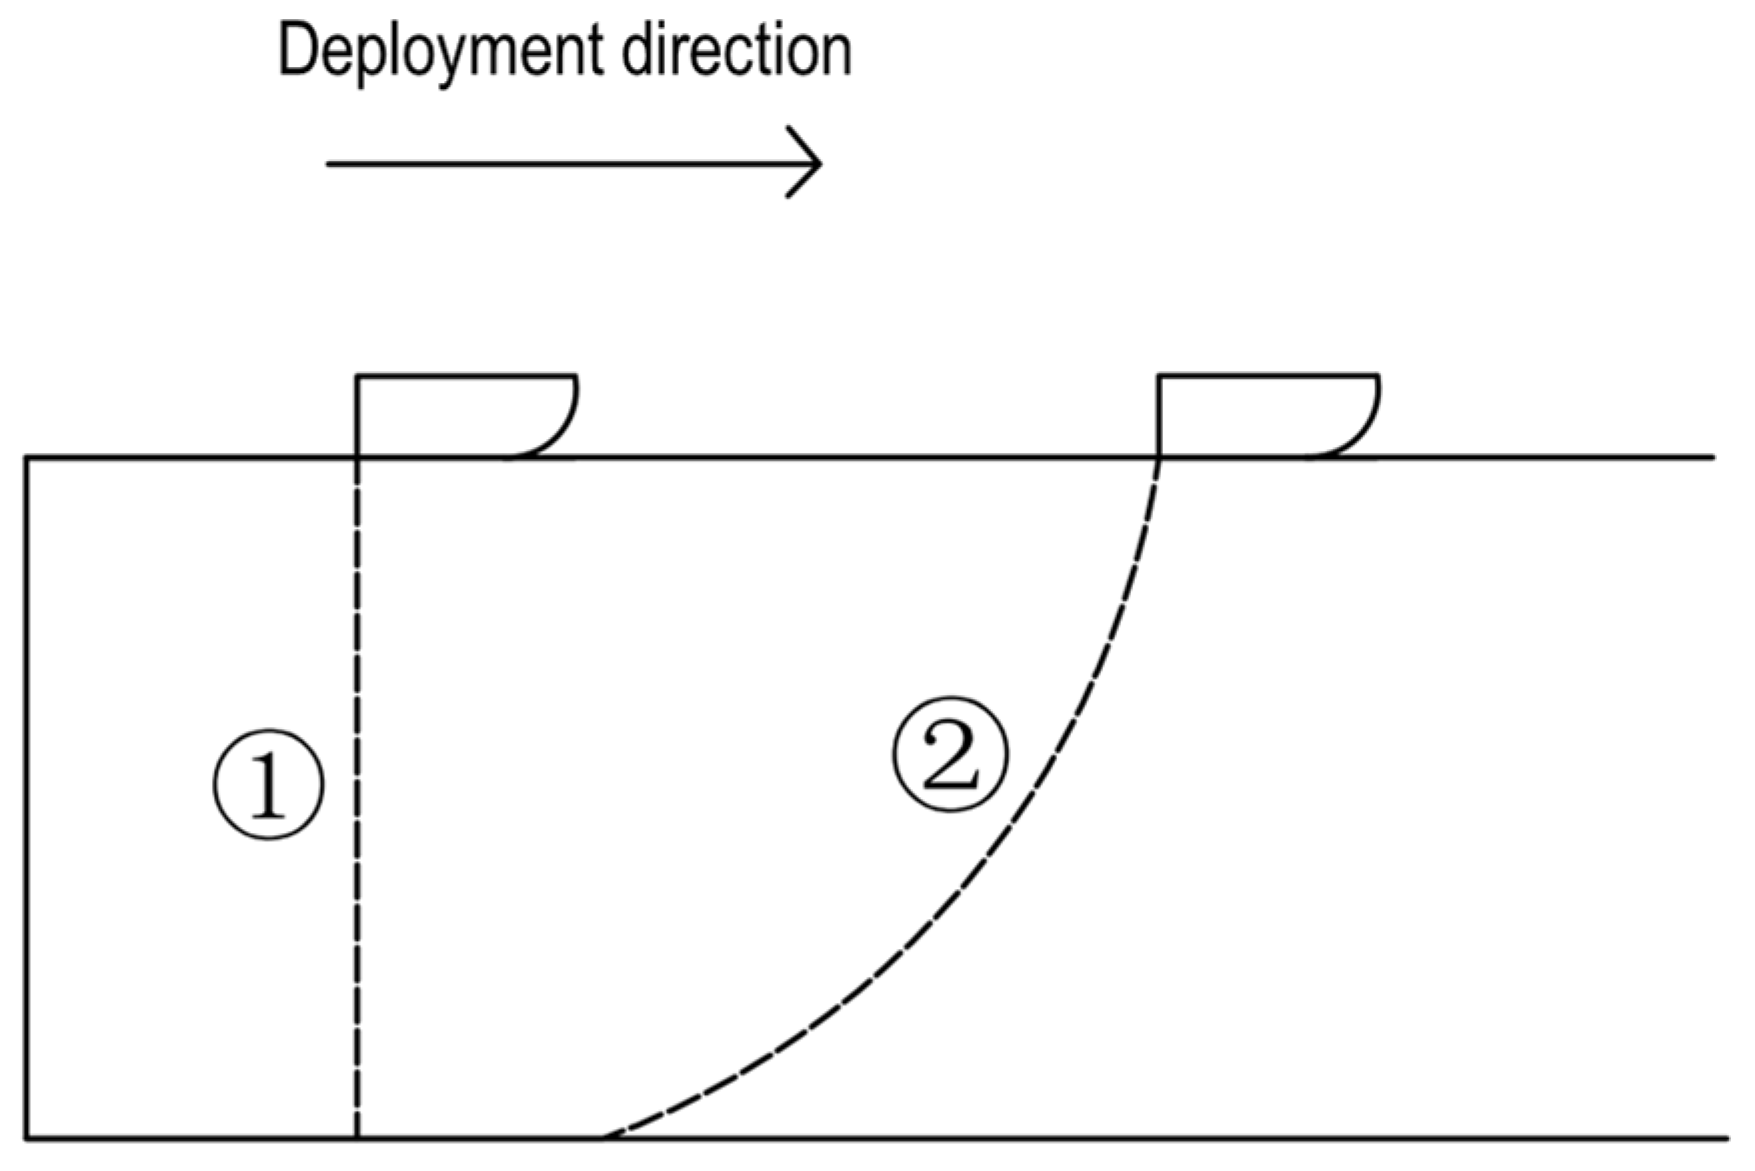
Before establishing a nonlinear finite element model of the flexible mattress, it is necessary to define its fundamental configuration in water. At the initial stage, the mattress is vertically suspended in water, as illustrated by Line Shape ① in Figure 10. As the deployment vessel moves, the mattress is gradually lifted into a curved form. When the vessel’s advancing speed equals the mattress release speed, the mattress configuration stabilizes, forming Line Shape ② in the figure. At this stage, the suspended length of the mattress reaches its maximum, and the influence of hydrodynamic force is most significant—representing the most unfavorable loading condition and the main focus of this study. Based on previous research, this configuration can be approximated by a catenary curve, which is thus adopted as the modeled geometry in this analysis.
To simulate the structural loading state and deformation characteristics of the mattress during deep-water deployment, a large-scale three-dimensional finite element model was constructed, building on earlier validation with small-scale models. The simulation focuses on the spatial configuration and mechanical response during the construction phase of mattress deployment. The model is developed using the ANSYS Workbench platform (Version 2021 R1), and the catenary configuration of the suspended mattress in water is determined according to catenary theory. Based on engineering parameters, the deployed length of the mattress is set to 50 m, with a water depth of 35 m.
Catenary Equation:
y = a cosh x a 1 ,
a (m): shape parameter of the catenary, related to the horizontal tension T 0 (m);
x : horizontal coordinate, with the origin located at the lowest point of the catenary;
y (m): vertical coordinate, where y ( 0 ) = 0 at the lowest point.
Total Length Equation:
S = 2 a s i n h ( L 2 a ) ,
L (m): total arc length of the catenary (horizontal distance between suspension points).
Sag Equation:
s = a [ cosh L 2 a 1 ] ,
s : vertical distance between the lowest point and the suspension points.
Given a water depth of s = 35 m , and a catenary span S = 2 × 50 m = 100 m , by solving the total length and sag equations simultaneously, we obtain:
a = 16.67 m ;
L = 60.6 m .
Therefore, the resulting catenary equation is:
y = 16.67 [ cosh x 16.67 1 ] ,
(2)
Geometric Modeling
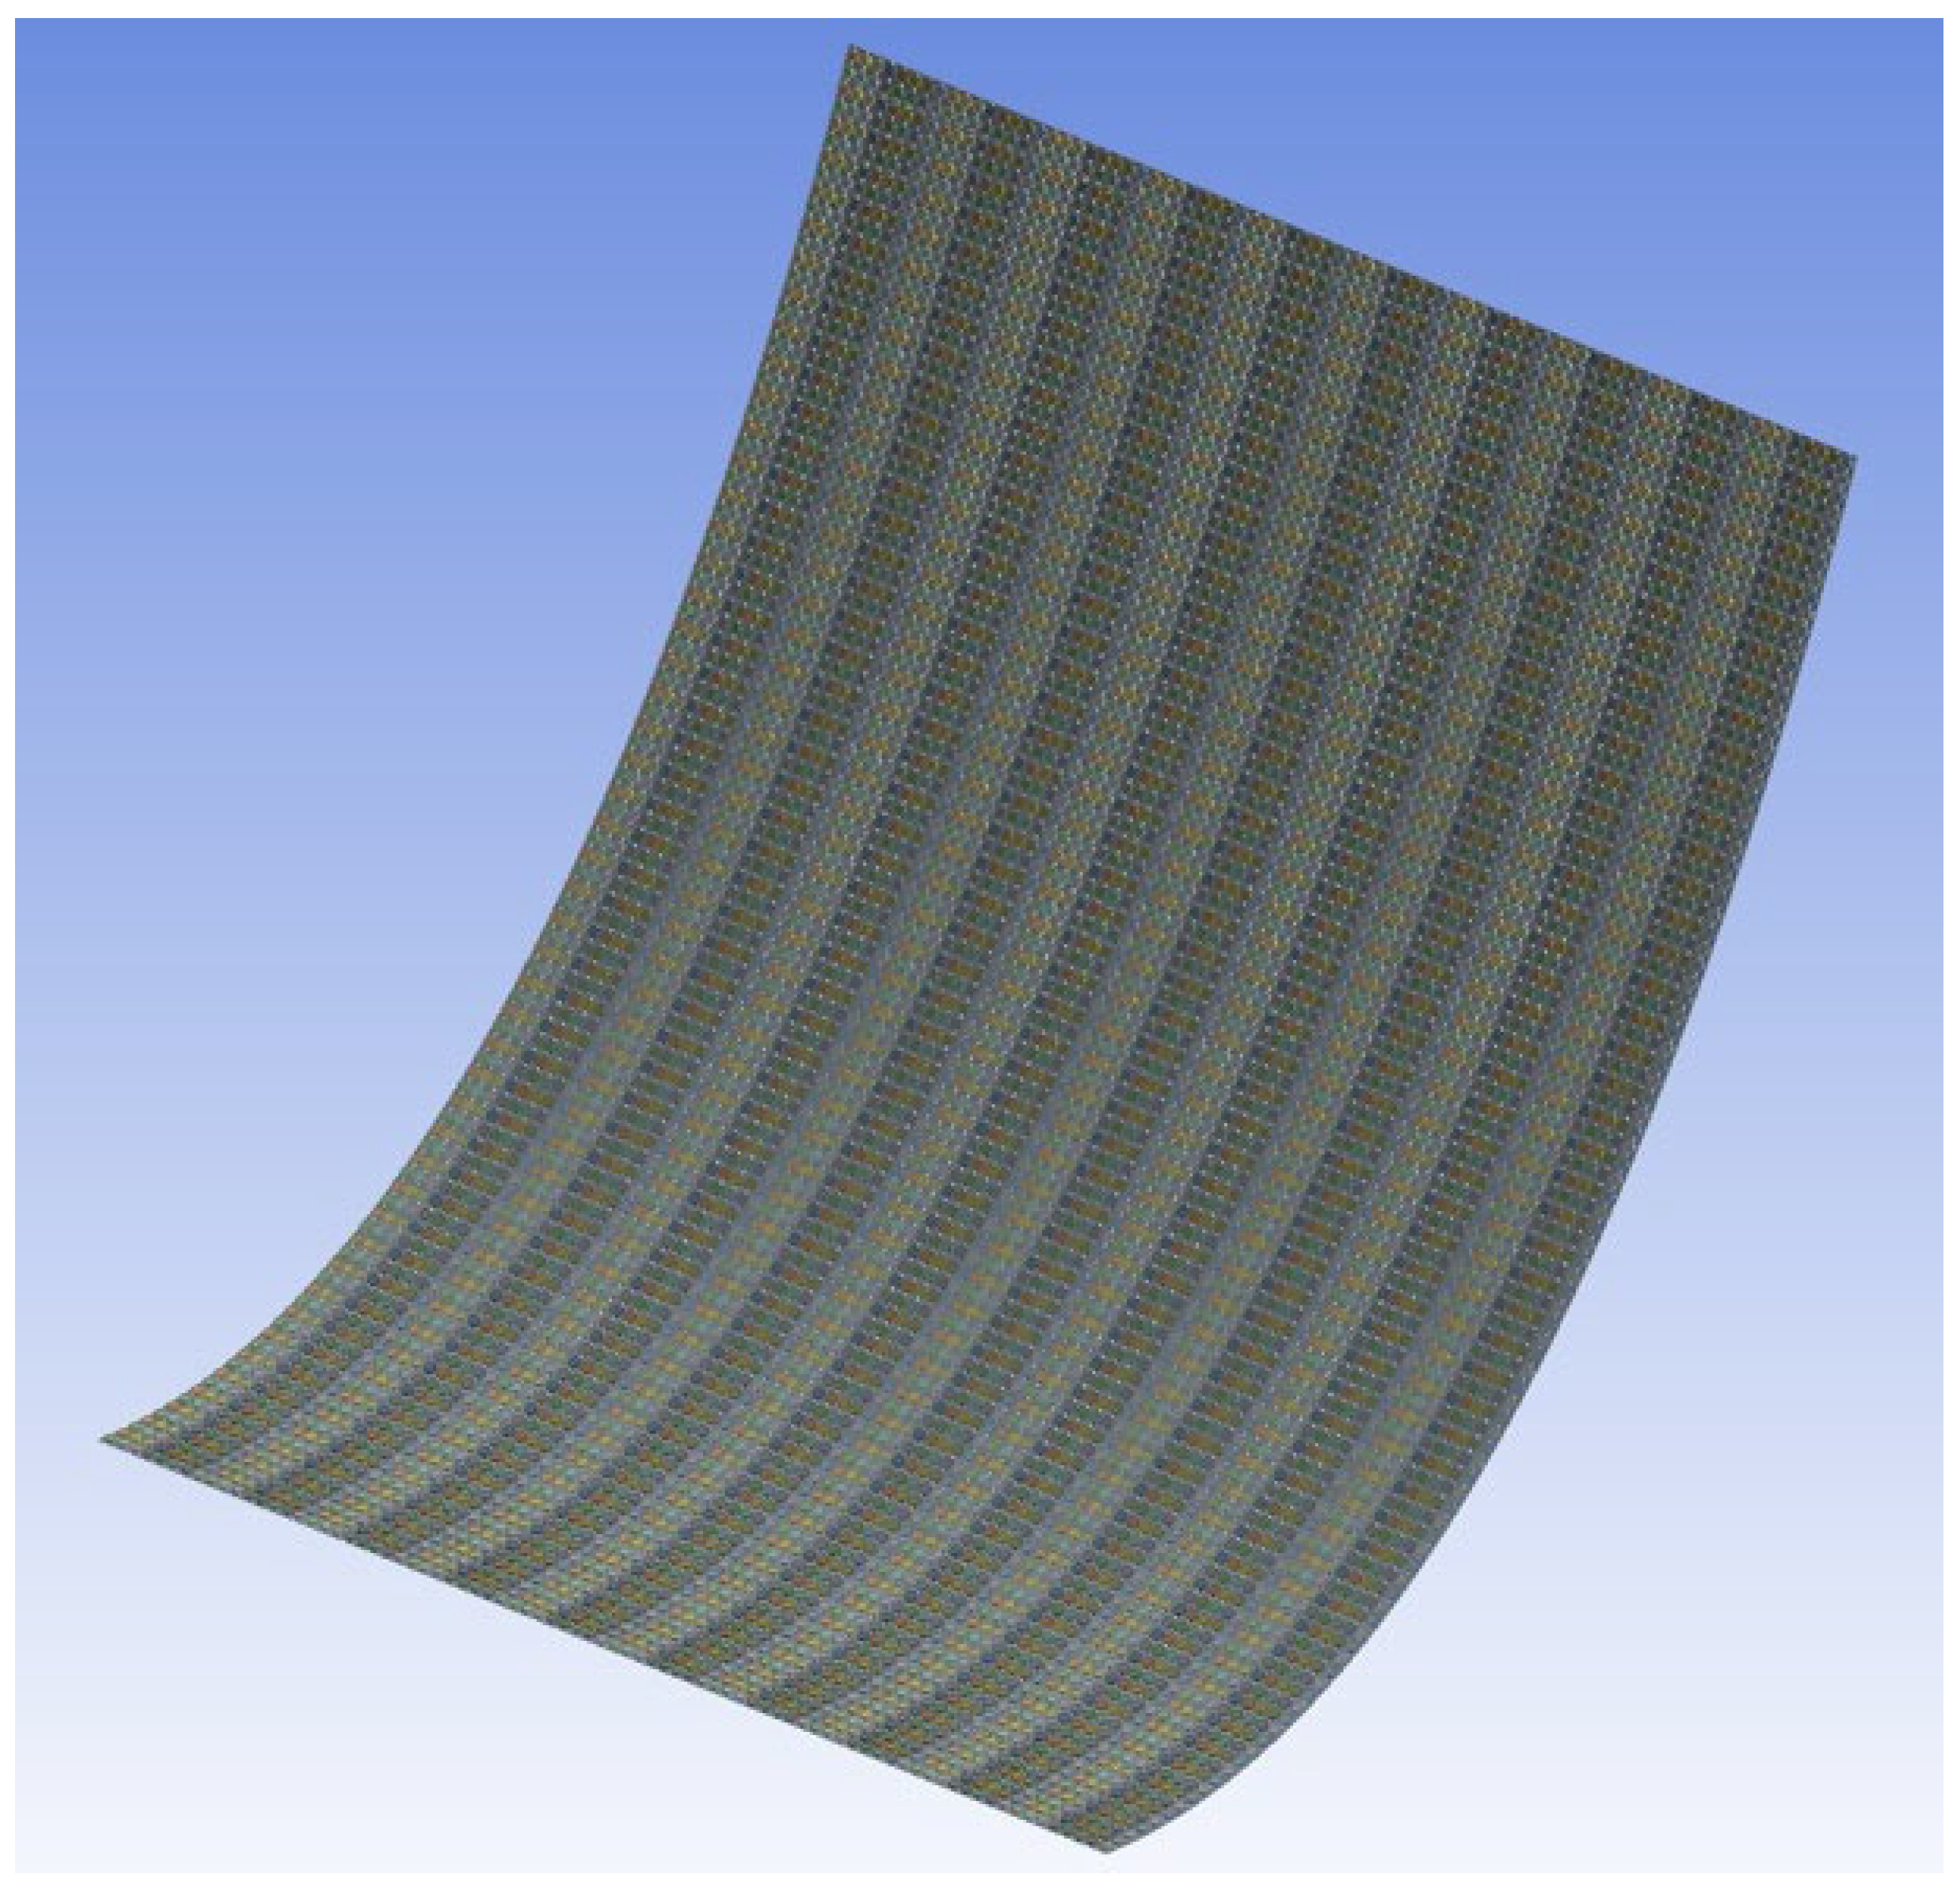
For geometric modeling, ANSYS DesignModeler is used to construct a three-dimensional structural model. Since a true catenary is a continuous curve, it is approximated as a segmented polyline consisting of 49 chords, each 1 m in length, to simplify modeling. This yields a 49 m-long mattress profile. Based on measured engineering data, the mattress width is defined as 40 m. The entire structure is composed of 49 connected planar segments, each measuring 40 m × 1 m, forming a large flexible mattress with a total area of 49 m × 40 m. Reinforcement strips are arranged longitudinally with a transverse spacing of 0.5 m, totaling 50 strips. Concrete ballast blocks are placed on the mattress surface in a grid pattern with 0.5 m spacing in both directions, totaling 2450 blocks. The layout structure is illustrated in Figure 11.
The connection methods among all components in the model strictly follow the actual engineering configurations. Reinforcement strips are sewn to the mattress fabric, while concrete ballast blocks are tied to the reinforcement strips using binding loops. Therefore, in the ANSYS Mechanical module, “bonded contact” was uniformly applied to all interfaces. Specifically, the reinforcement strips were defined as the contact body (line elements) and the mattress fabric as the target body (surface elements); the concrete ballast blocks were defined as the target body; and the mattress fabric was defined as the contact body. This approach effectively simulates a fully fixed interaction between components and prevents unrealistic relative sliding or separation during the simulation.
Regarding mesh generation, considering the large model size, complex structure, and limited computational resources, an element size of 0.1 m was selected. Automatic meshing with adaptive sizing was enabled to ensure a balance between quality and efficiency. The final mesh consists of 2,591,521 nodes and 582,720 elements, meeting the stability and accuracy requirements for subsequent computations.
In the structural analysis setup, fixed boundary conditions were applied to both the upper and lower edges of the model to represent the actual construction constraints—namely, the upper edge attached to the deployment vessel and the lower edge in close proximity to the riverbed. The loading conditions include gravity, buoyancy, and hydrodynamic impact. Gravity was applied using ANSYS’s built-in gravity field. Buoyancy was calculated separately for each component based on its actual volume. The buoyant force for the concrete ballast blocks was set to 980.66 Pa, while for the mattress fabric and reinforcement strips it was 12.748 Pa; these were applied as equivalent vertical upward pressure. The hydrodynamic force was simplified as a uniformly distributed vertical pressure on the external surfaces of the structure, based on the Morrison equation, expressed as:
F = 1 2 A C D ρ v 2 ,
where A is the projected area facing the flow, C d is the drag coefficient, ρ is the water density, and v is the flow velocity.
To simplify the computational process, the hydrodynamic force was decomposed along the principal direction and applied separately to the outer surfaces of the mattress and ballast blocks.
The three-dimensional finite element model established through the above procedure closely replicates the actual deployment scenario in terms of configuration, parameters, and boundary conditions. It is structurally reasonable and computationally precise, providing a reliable basis for analyzing the stress states and stability performance of flexible mattresses in deep-water flow fields under different working conditions. This model also serves as a robust numerical foundation for subsequent sensitivity analyses and optimization design studies.

3.2.2. Influence of Flow Velocity on Mattress Structural Stress

During the construction of flexible mattresses, upstream inflow and seasonal rainfall can lead to significant variations in flow velocity. To investigate the influence of flow velocity on mattress stress, this study utilizes the large-scale model (40 m × 49 m), with the angle between the flow direction and mattress surface fixed at 30°. On this basis, flow velocity is varied. Hydrodynamic force is calculated using the Morrison equation, and the specific scenario settings are listed in Table 4.
(1)
Distribution of stress throughout the entire flexible mattress structure
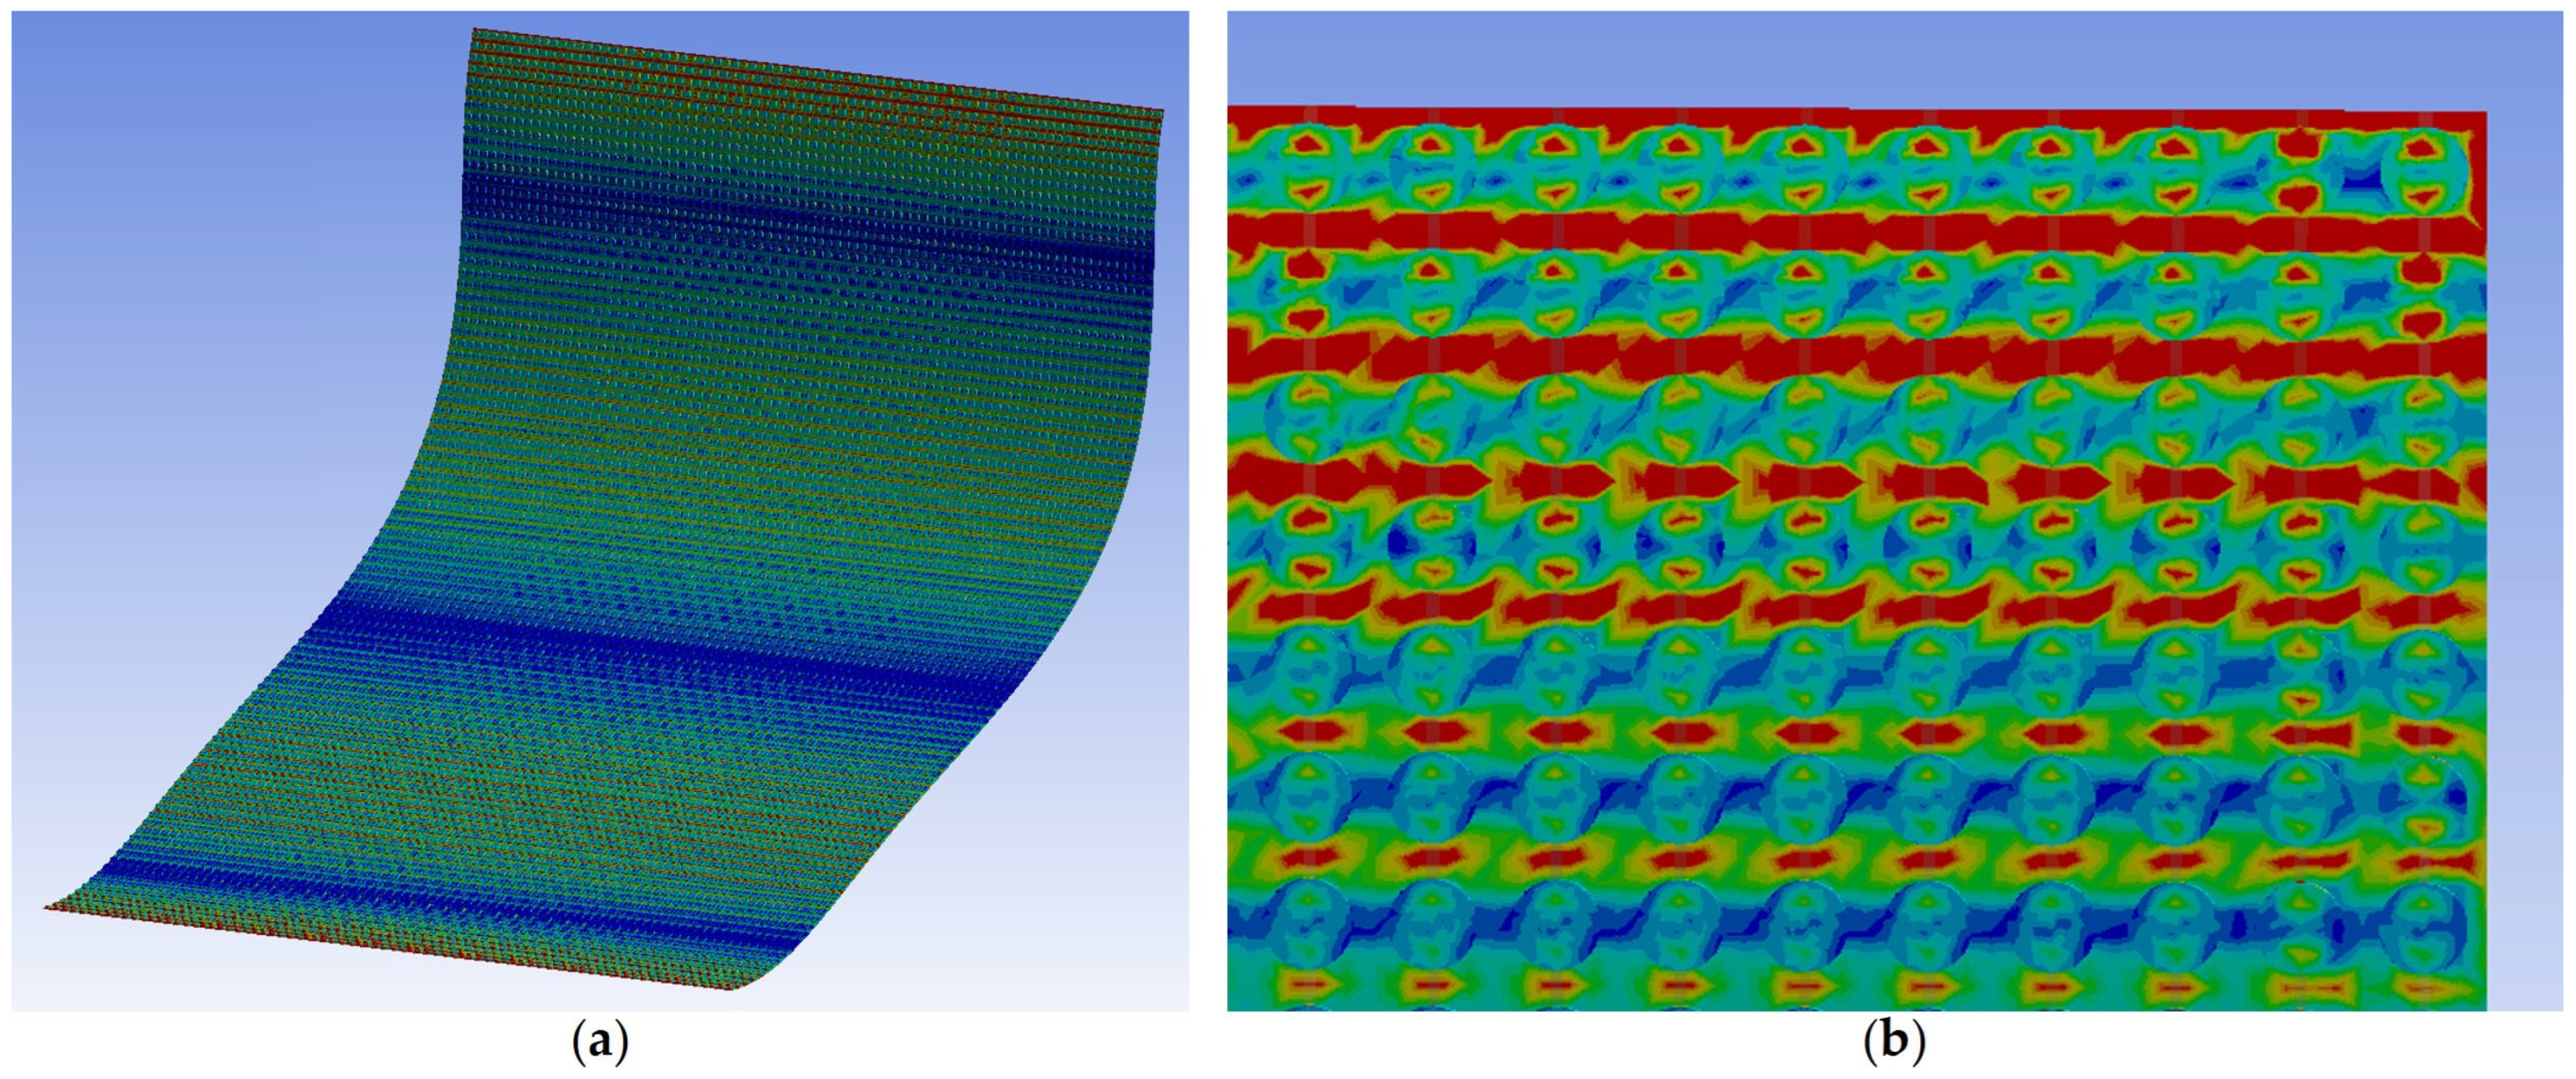
Finite element simulation results (Figure 12) indicate that the stress on the mattress surface is distributed in a lateral pattern of “high in the center (red), lower on both sides (blue), and slightly increased at the edges.” The upper edge of the mattress (near the vessel side) experiences the highest stress, followed by the lower edge. This distribution pattern remains consistent across all tested flow conditions, suggesting that the vessel-side edge is a high-risk zone for tearing. Therefore, it is of great significance to install stress monitoring devices in this area. Additionally, stress concentrations are commonly observed at the contact interfaces between the reinforcement strips and concrete ballast blocks, where detachment or rupture of stitches or ties may occur. In practice, the structural strength of these zones should be enhanced—e.g., by increasing the number of ties or optimizing stitching techniques.
As a reference, the material specifications of the D1-type flexible mattress used in this project are shown in Table 5.
(2)
Effect of Flow Velocity on Upper-Edge Stress of the Mattress
Based on the simulation results, the maximum (i.e., overall peak), minimum, and average stress values at the vessel-side edge of the mattress were plotted against different flow velocities, as shown in the figure below. It can be seen that as flow velocity increases, the stress at the upper edge of the mattress also increases. Moreover, as flow velocity increases uniformly, the stress growth rate accelerates, and the relationship between stress and flow velocity approximates a quadratic function. Through curve fitting, the relationship between upper-edge stress σ and flow velocity v can be expressed as:
σ m a x = 2.31 × 10 7 v 2 + 1.1 × 10 6 ,
σ m i n = 1.83 × 10 7 v 2 + 7.9 × 10 5 ,
σ a v g = 1.31 × 10 7 v 2 + 4.0 × 10 5 ,
where σ in Pa is the stress at the upper edge of the mattress and v in m/s is the flow velocity.
The error between the stress values calculated using this expression and those obtained from the simulation is shown in Table 6. It can be observed that, in most cases, the error is below 1%, with only a few instances slightly exceeding 2%. This demonstrates that the fitted equation accurately captures the relationship between flow velocity and upper-edge stress of the mattress.
Error analysis reveals that the deviation is minimal when flow velocity ranges between 1.4 m/s and 1.7 m/s. Therefore, in the following section, the flow velocity is fixed at 1.5 m/s to explore how the angle between flow direction and the mattress surface affects the parameters of the above-mentioned relationship. The scenario settings are listed in Table 7.
(3)
Effects of Flow Velocity Changes on the Resultant Force Acting on the Upper Edge of the Flexible Mattress
Table 7 presents the magnitude and orientation of the resultant force exerted on the upper edge of the flexible mattress under varying flow velocity conditions.
Table 7 also shows that with increasing flow velocity, the resultant force acting on the upper edge of the mattress increases significantly, and the rate of increase becomes more pronounced. At low flow velocities, the force is primarily dominated by gravity and buoyancy, with the resultant vector oriented nearly vertically. As the flow velocity increases, hydrodynamic force becomes dominant, and the direction of the resultant force shifts markedly, approaching the reverse direction of the water flow. Based on this analysis, construction activities should preferably be scheduled during low-flow dry seasons, when the applied forces are smaller and more stable. Conversely, during flood seasons, higher flow velocities result in increased forces and greater directional deflection, raising the likelihood of mattress tearing; thus, construction should be avoided under such conditions whenever possible.

4. Monitoring Equipment and Construction Plan

4.1. Analysis of Key Stress Monitoring Points

Structural force analysis shows that during vertical deployment in flowing water, the mattress’s self-weight generates a longitudinal tensile force transmitted back to the vessel. Hydrodynamic forces induce lateral tension, which, if the mattress is not aligned perpendicular to the flow, is transferred along the longitudinal reinforcement strips to the deployment vessel.
An analysis of mechanical loading on the deployment vessel components indicates that the longitudinal tensile force mainly affects the flip plate and mattress roller. As direct measurement of pressure on the flip plate is difficult, strain in the steel cable used for its deployment and retraction (Figure 13) is monitored as an indirect indicator. Similarly, since direct measurement of pressure and friction on the roller is unfeasible, strain gauges on the roller’s iron base are used to capture the combined effects during deployment.
During mattress release, once the roller stops, the clamping beam—featuring a high-friction rubber underside (Figure 13)—is lowered to press against the mattress. The longitudinal force is thus transmitted as static friction, which is indirectly measured via strain sensors installed on the beam’s base. As the steel cable, roller base, and clamping beam base are metallic with a linear stress–strain relationship, the measured strain effectively reflects the mechanical loads at each monitoring point.

4.2. Selection of Monitoring Equipment

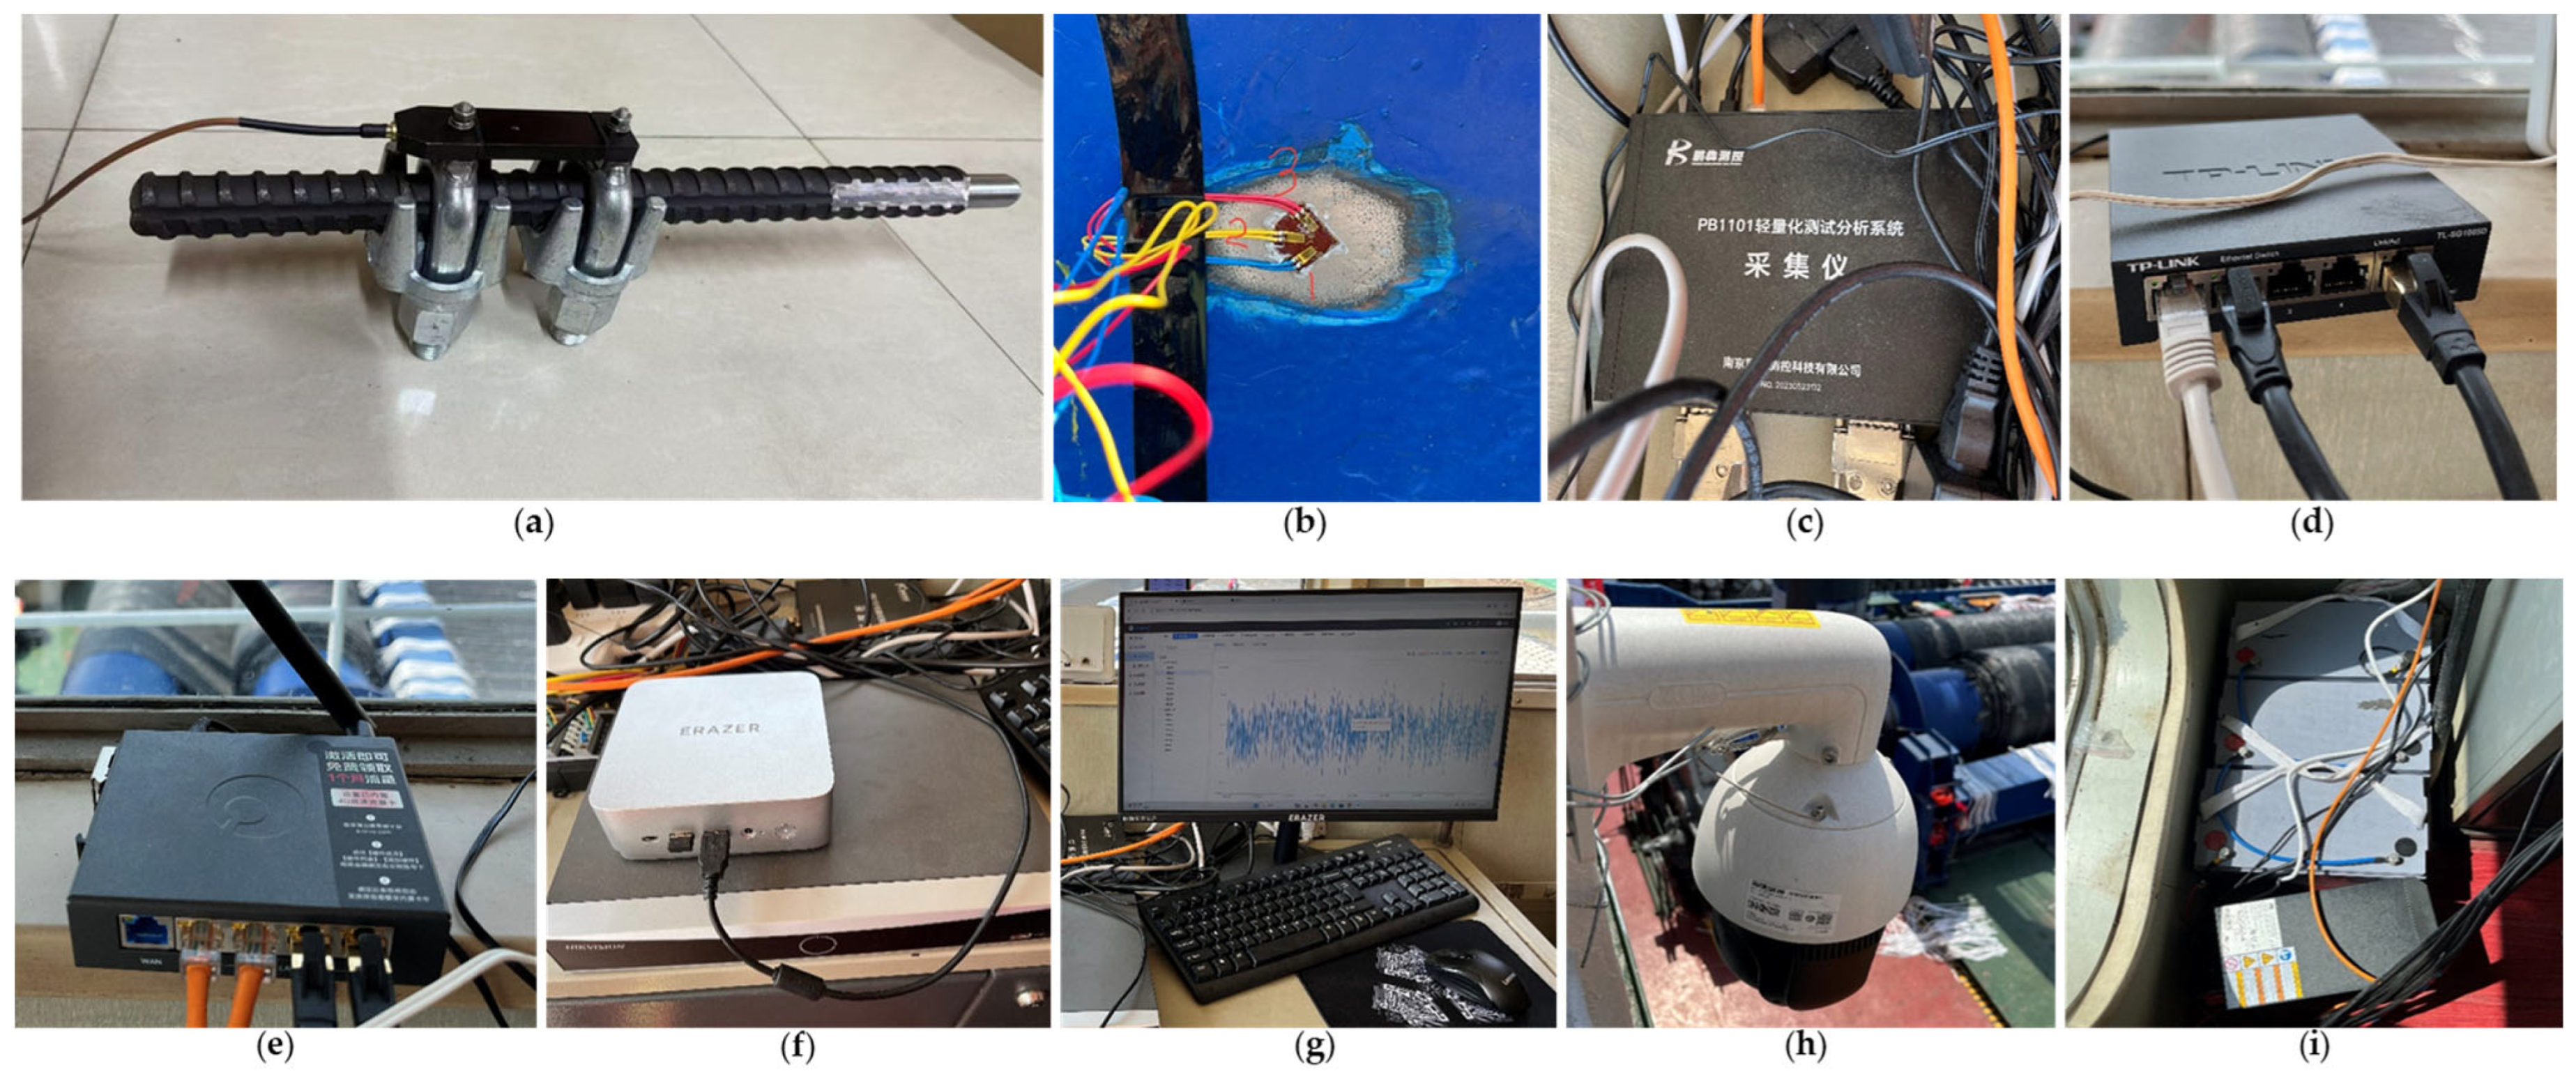
Considering the stress characteristics of the flexible mattress and the directional paths of force transmission during deployment, the project selected high-precision strain sensors and supporting equipment (Figure 14), including:
  • Tension Sensor: Model PB-530 (Nanjing Pengben Measurement & Control Technology Co., Ltd., Nanjing, Jiangsu, China), used to monitor tensile force values on the steel cable of the flip plate on the deployment vessel. It has a precision of 0.1 με and a response time of 0.01 s.
  • Three-Axis Strain Gauge: Model BE120-3CA-P300 (Nanjing Pengben Measurement & Control Technology Co., Ltd., Nanjing, Jiangsu, China), used to monitor three-directional stress and strain values at key structural points on the vessel. It has a precision of 0.1 με and a response time of 0.001 s.
  • Lightweight 8-Channel Data Acquisition Device (Nanjing Pengben Measurement & Control Technology Co., Ltd., Nanjing, Jiangsu, China), used for collecting strain signals.
  • Uninterruptible Power Supply (UPS): Model UPS2000-A-1KTTL (Huawei Digital Power Technology Co., Ltd., Shenzhen, Guangdong, China), ensures stable operation of the monitoring system in case of temporary power interruptions on the deployment vessel.
  • High-Definition Camera: Model iDS-2DE4423IW-DE (Hangzhou Hikvision Digital Technology Co., Ltd., Hangzhou, Zhejiang, China), supports WiFi connection and real-time cloud monitoring, enabling remote observation of construction activities.
  • Digital Video Recorder (DVR): Model DS-7608NX-K1 (Hangzhou Hikvision Digital Technology Co., Ltd., Hangzhou, Zhejiang, China), equipped with a storage hard drive, capable of real-time recording of both the camera’s video stream and monitoring data output from the acquisition system for physical backup purposes.
During the monitoring process, the frequency of data collection by the sensor is set at 50 Hz, and the average value of the data per second is taken to avoid abnormal fluctuations and errors in the sensor data. During the construction period, an online monitoring software system and cloud server were leased, with a supporting 4G router, enabling real-time upload of monitoring data, remote access and download of live data, and real-time push notifications for abnormal values as part of an early-warning system.

4.3. Layout and Design of Monitoring Facilities

A total of 6 sensor monitoring points were deployed for this experiment, with 14 data acquisition channels for strain measurements. The monitoring points were located at the root of the flip plate steel cable, the roller base, and the base of the clamping beam.
  • At the flip plate cable root, PB-530 tension sensors were installed, with each point collecting a single strain value.
  • At the roller and clamping beam bases, BE120-3CA-P300 three-axis strain gauges were installed, each collecting three orthogonal strain values per point.
  • Equipment was installed symmetrically on both the upstream and downstream sides of the deployment vessel.
Sensors were installed at designated points, and the system was initialized after zeroing the data acquisition device. Monitoring covered the entire deployment process of a flexible mattress, with data recording starting before the mattress head was fixed and continuing until the tail was fully submerged. High-definition video was used to identify each construction step, and sensor data were time-stamped accordingly. The complete dataset was then exported for analysis.

4.4. Monitoring Platform

The system installed in this study is equipped with both deployment monitoring and early-warning functions. Real-time data display and recording of sensor outputs are achieved through the EasyIoT online platform. Additionally, the platform provides an early-warning feature, supporting two types of alarm modes: “threshold alarm” and “fluctuation range alarm.” Each alarm mode can be configured with three risk levels: “warning value,” “alarm value,” and “danger value,” corresponding to progressively increasing degrees of operational risk. These settings enable the system to issue graded risk alerts accordingly. The specific threshold values for each risk level will be determined based on the data analysis results presented in Section 5.

5. Monitoring Data Acquisition and Risk Early-Warning Analysis

5.1. Monitoring Data Acquisition

During the construction process of flexible mattress deployment, a comprehensive monitoring and feature extraction workflow was designed to enable real-time monitoring of force states and early warning of potential risks. This workflow integrates multi-sensor deployment, data acquisition systems, and the EasyIoT online platform to achieve full-cycle management from signal sensing and data transmission to feedback and warning. The process includes the following components:
  • Sensor Deployment: Sensor nodes were installed at critical load-bearing positions on both sides of the deployment vessel, including the roller base, flip plate cable root, and clamping beam base. These positions are the core locations for stress transmission within the mattress structure. Tension strain sensors (PB-530) and three-axis strain gauges (BE120-3CA-P300) were symmetrically installed to ensure accurate detection of strain responses.
  • Data Acquisition and Transmission: Analog signals collected by the sensors were processed and digitized via a lightweight eight-channel data acquisition device (PB1101), then transmitted in real time to the central monitoring host through a network switch and 4G communication module. Two acquisition devices were deployed, corresponding to seven monitoring points located near the bow and the wheelhouse side of the vessel, providing a total of 14 data input channels. The collected data from each channel were stored in .csv format on the monitoring host, facilitating subsequent data export, batch analysis, and long-term archiving.
  • Data Visualization and Analysis: The platform provides a graphical interface for real-time data viewing and includes a “trend analysis” module for historical data visualization. Users can define specific analysis time intervals, and the platform will generate time series curves showing the maximum, minimum, and average values of each monitoring point, thereby enabling dynamic tracking and quantitative evaluation of stress evolution. Time granularity is adjustable to minute, hourly, daily, weekly, or monthly scales to meet various monitoring precision requirements.
  • Risk Early-Warning Mechanism: To ensure efficient safety alerts, the platform supports two warning modes: “threshold alarm” and “fluctuation range alarm.” For each monitoring point, users can set three levels of risk values: “warning value,” “alarm value,” and “danger value.” When incoming data meet or exceed these thresholds, the system automatically triggers a risk alert. Notification can be delivered via pop-up messages, sound alerts, emails, or WeChat to inform relevant construction personnel, assisting in the on-site risk assessment and response.
  • Power and System Reliability: To ensure stable system operation, the monitoring setup is equipped with an uninterruptible power supply (UPS2000-A-1KTTL) to prevent data loss or disconnection during brief power interruptions. Together, this monitoring framework forms a closed-loop system encompassing “critical strain response—multi-channel data acquisition—standardized storage—trend analysis and feature extraction—dynamic threshold early warning,” providing robust technical support for the safe deployment of flexible mattresses.

5.2. Stress Variation Patterns of Flexible Mattress During Deployment

During the construction process, two main types of strain sensors were utilized in the monitoring system: the PB-530 tension sensor, installed on the steel cable of the flip plate; and the BE120-3CA-P300 three-axis strain gauge, installed on the roller base and clamping beam base. A total of 28 mattress units were deployed in this project, and the monitoring devices continuously recorded strain data at each monitoring point throughout the entire deployment process.
(1)
Strain Variation on the Roller Base Caused by Flow-Induced Impact on the Mattress
Given the close proximity between the clamping beam base and the roller base, and the similarity in their data variation trends, a triaxial strain gauge (Model: E120-3CA-P300) mounted on the bow-side roller base was selected for analysis, with monitoring data at this location extracted accordingly (Figure 15a). The strain gauge follows the principle of “positive for tension, negative for compression.” When the tensile force in the mattress increases, the force transmitted to the base also increases, resulting in greater compressive stress at the monitoring point—therefore, the sensor output decreases. Conversely, if the tensile force decreases, the compressive stress on the base is reduced and the sensor output increases.
Monitoring data show that from 08:00 to 08:22, strain gradually decreased from approximately 1.115 µε to 1.110 µε (Δε = −0.005 µε, ≈ −0.45%). Around 08:22, the first short-term fluctuation occurred, with strain rising from the baseline of 1.110 µε to a peak of 1.122 µε (Δε = +0.012 µε, ≈ +1.08%), before returning to baseline. A second brief rise occurred around 08:42, from 1.110 µε to 1.118 µε (Δε = +0.008 µε, ≈ +0.72%), and quickly stabilized.
Both surges in strain correspond with field construction records. At approximately 08:25, a sudden increase in lateral water flow caused partial lifting of the mattress, counteracting part of its own weight and reducing the tensile force. According to the “positive-tension, negative-compression” principle, reduced tension leads to decreased compressive load on the base, resulting in an increased sensor output. The quantitative results match the observed site events closely, verifying the system’s sensitivity and effectiveness under dynamic loading conditions.
(2)
Influence of Flip Plate Angle Adjustment on Steel Cable Strain
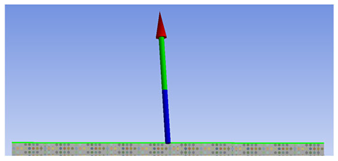
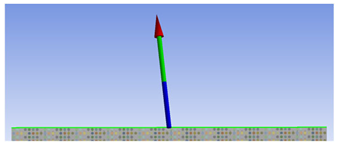
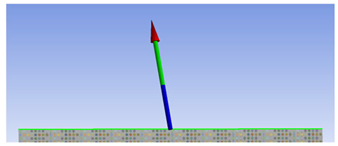
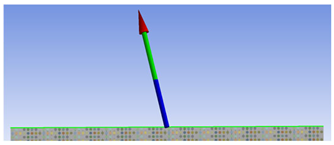
In the strain curve shown in Figure 14b, the PB-530 tension sensor recorded an average strain of approximately ε1 ≈ 559.78 με from 08:00 to 08:07, with a standard deviation of only about 0.02 με. Subsequently, as the flip plate angle was adjusted from an initial inclination of θ1 ≈ 3.5° to θ2 ≈ 10.6° (see Figure 16), the average strain during the 08:08–08:20 interval decreased to ε2 ≈ 559.25 με, resulting in Δε ≈ −0.53 με. Assuming a sensor calibration constant of K = 1 kN/με, the corresponding load reduction is approximately ΔF = K × Δε ≈ 0.53 kN.
This leads to an estimated flip plate strain sensitivity of approximately:
Δ ε Δ θ 0.07465 μ ε / °  
Which provides a quantitative basis for subsequent control of the flip plate angle during construction operations.
(3)
Effect of Flip Plate Loading on Steel Cable Strain
At approximately 08:43, the first placement of concrete interlocking blocks onto the flip plate was observed (Figure 17). At that moment (Figure 14b), the strain recorded by the sensor surged from the post-unloading baseline of ε2 ≈ 559.25 με to a peak of ε3 ≈ 559.95 με, corresponding to Δε ≈ +0.70 με (approximately 0.70 kN assuming K = 1 kN/με). The time lag between the block placement captured by video monitoring and the strain curve response was less than 10 s, indicating that both the sensor and its mounting base responded quickly and without noticeable delay.
From that point until 09:00, the strain curve exhibited 3–5 slow undulations, with each fluctuation ranging from Δε ≈ 0.15 to 0.25 με, corresponding to ΔF ≈ 0.15–0.25 kN, and occurring in cycles of approximately 120–300 s. Correlation with site records of alternating crane operations revealed that each crane’s unloading of a block caused a temporary reduction in load, producing a strain trough; when the crane lifted another block, the load recovered or slightly exceeded the prior level, resulting in a strain peak. Due to asynchronous crane operation cycles, their combined loading effects overlapped on the flip plate, producing multi-cycle, small-amplitude oscillations in the strain curve.
In summary, the flip plate steel cable strain during this construction process responded linearly and sensitively to both angle adjustments and initial loading events, and also accurately reflected small-scale load variations throughout ongoing operations. By analyzing the relationships between Δε and Δθ (angle change) as well as ΔF (load change), this monitoring provides reliable calibration parameters for optimizing flip plate angle control and crane operation rhythm.
(4)
Relationship Between Flip Plate Steel Cable Strain and Water Depth
To assess whether changes in the flip plate steel cable loading during mattress deployment are correlated with water depth variations, a synchronous analysis was conducted using data from two deployment days:
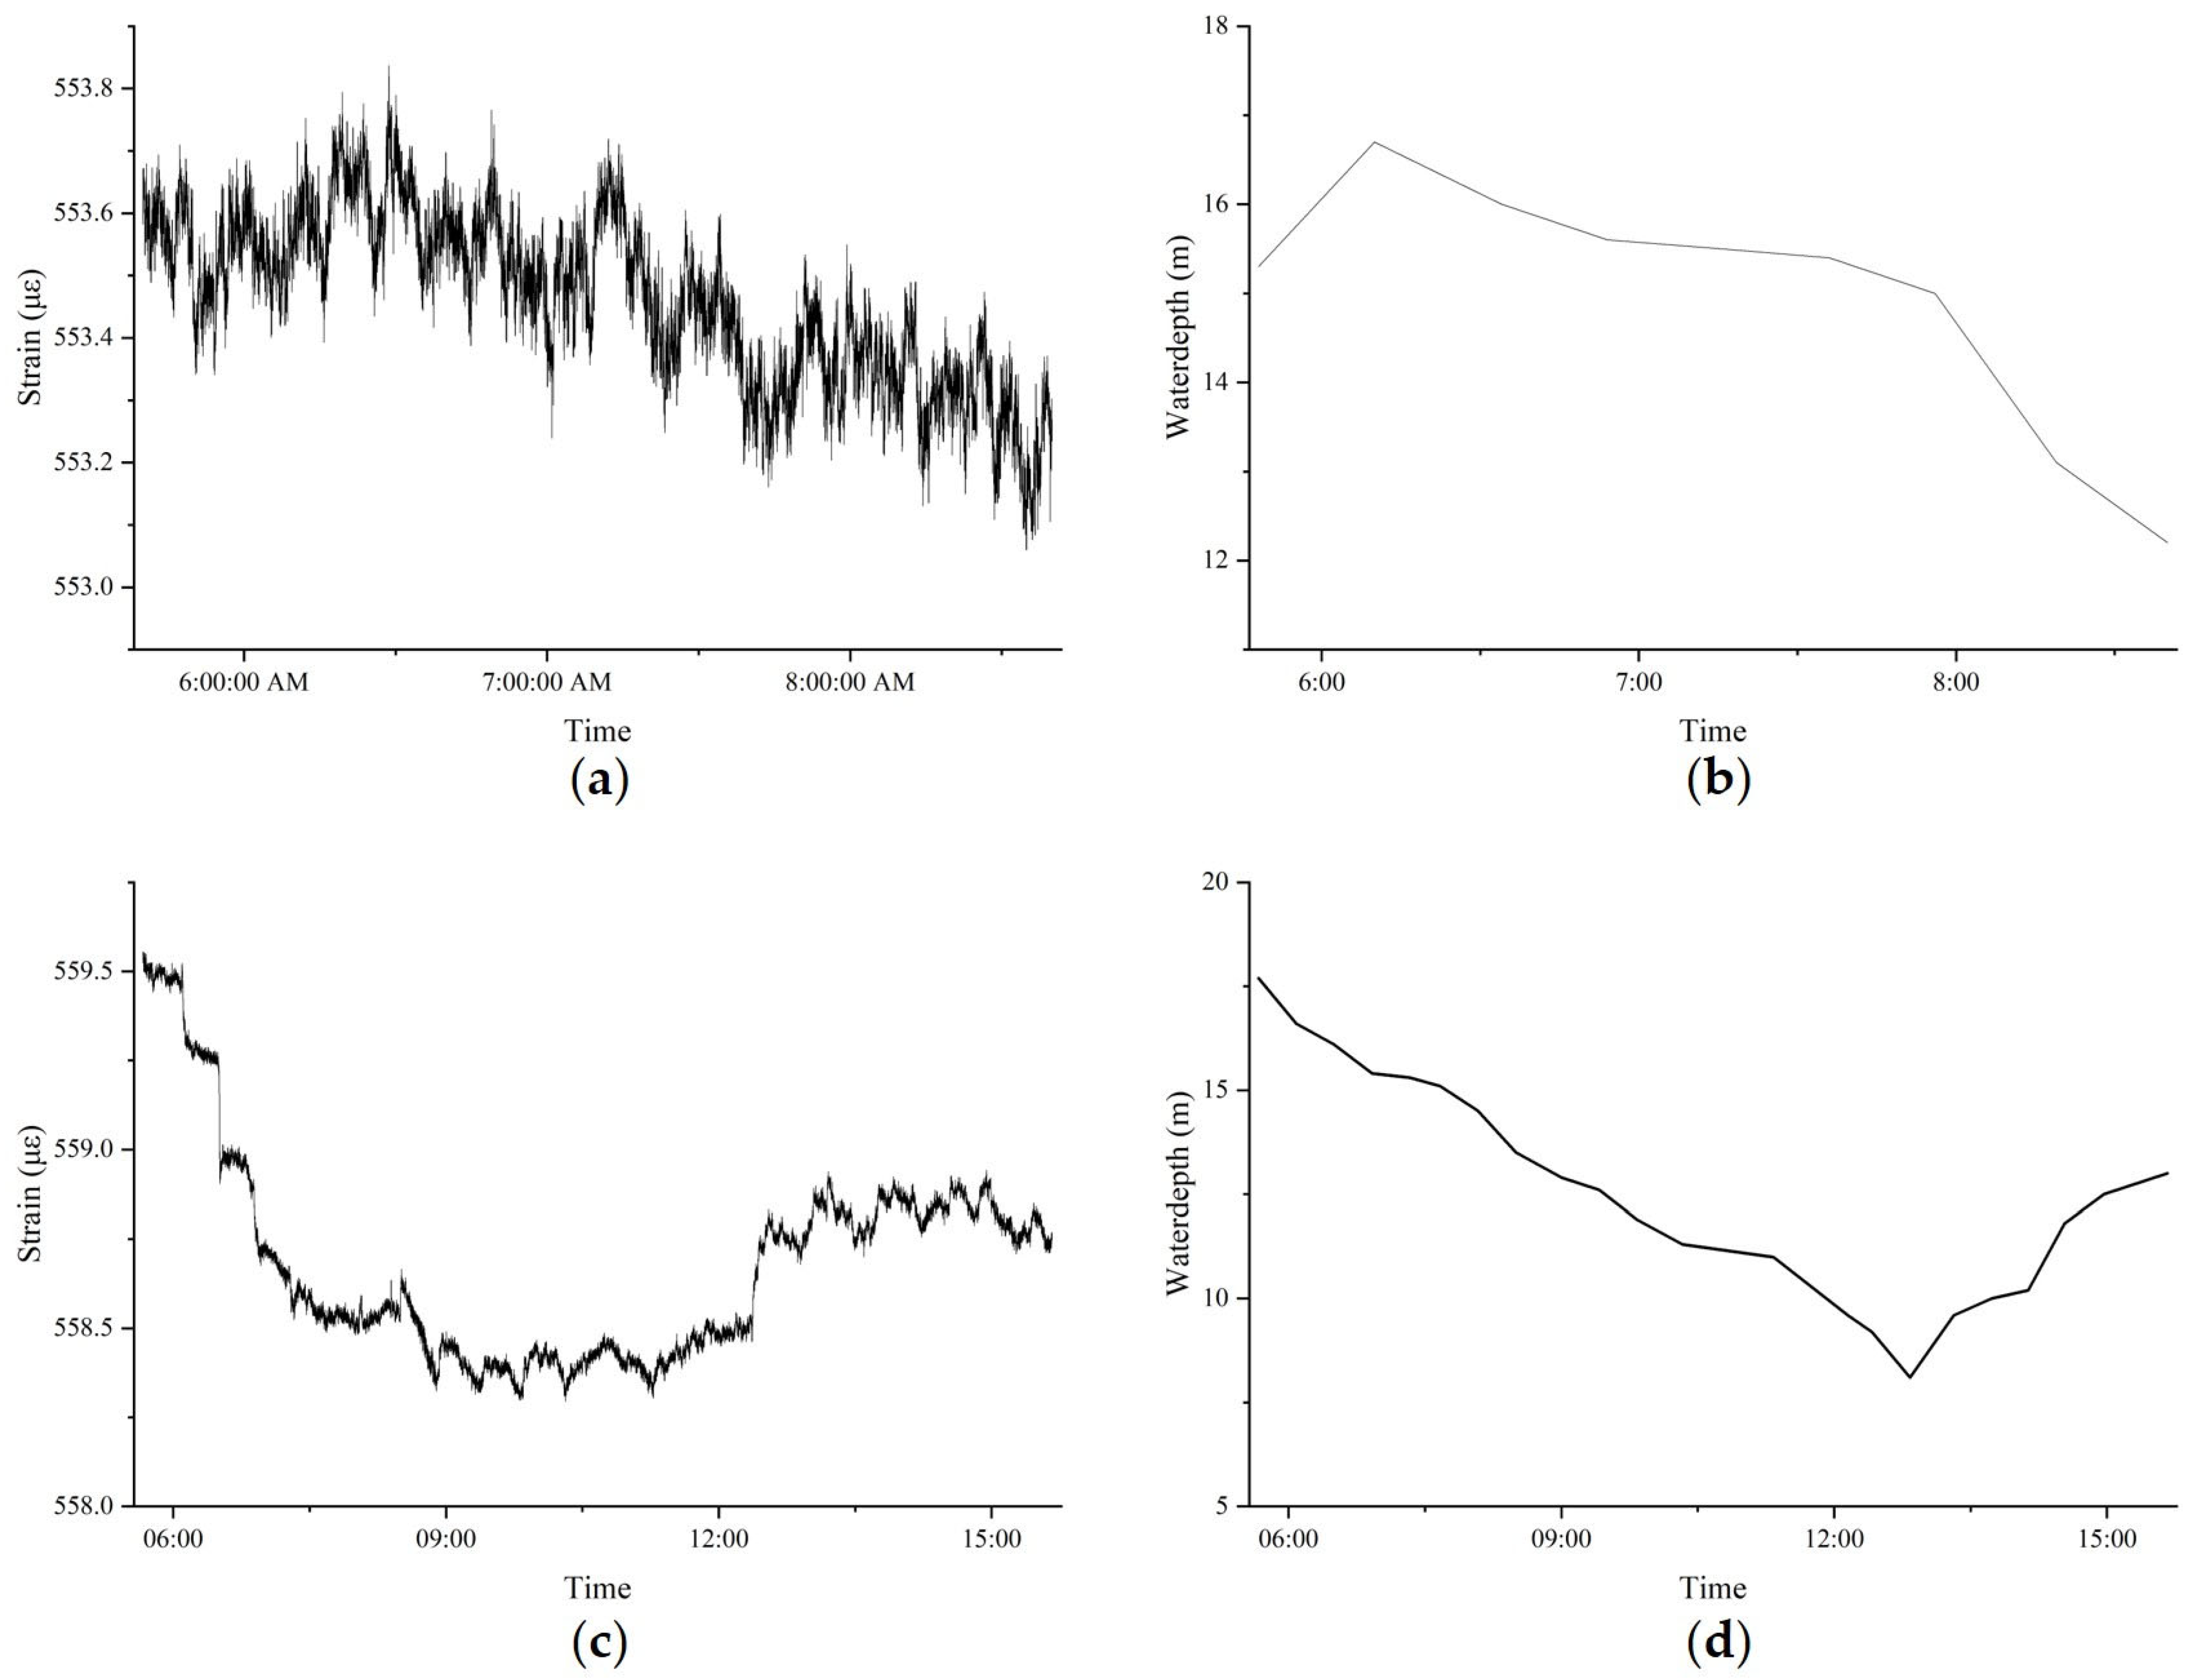
Period 1: 5:40–8:40 time window (Figure 18a,b), and
Period 2: 5:30–15:30 time window (Figure 18c,d).
Strain data were collected from the upstream flip plate steel cable, where changes in strain reflect load variations on the flip plate of the deployment vessel, which are, in turn, directly influenced by the forces acting on the mattress. The strain readings follow the “positive in tension, negative in compression” principle—i.e., an increase in cable tension results in an increase in strain value.
Table 8 illustrates the correspondence between water depth variations and steel cable strain across different time intervals, revealing a generally linear association between the two. In Figure 18a,b, strain exhibits a clear response to rising and falling water levels, with an initially high sensitivity (Δε/ΔH ≈ 0.33 με/m) that gradually decreases to 0.13 με/m. The overall regression slope is relatively low (Δε/ΔH ≈ 0.06 με/m), indicating non-uniform force responses. In Figure 18c,d, a strong linear relationship is observed during the 6:00–9:00 AM period (Δε/ΔH ≈ 0.19 με/m, r ≈ 0.92), while the strain remains nearly constant from 9:00 to 12:00 PM, with a sharp drop in correlation (r ≈ 0.12), suggesting a stabilized stress condition of the mattress structure at specific water depths. The overall regression result (Δε/ΔH ≈ 0.15 με/m, r ≈ 0.91) further confirms an approximately linear strain response to water depth variation within a certain range. However, temporal and segmental discrepancies in strain behavior are evident, likely influenced by flow disturbances and changes in structural pretension.
The above quantitative results are highly consistent with the mechanism of self-weight-induced loading. As water depth increases, the submerged length of the mattress increases, thereby increasing the total self-weight and the pitching moment exerted on the flip plate. This results in increased steel cable tension and correspondingly higher strain values. Conversely, when water depth decreases, the submerged length shortens, self-weight is reduced, and strain values drop accordingly. In particular, during periods of rapid water depth changes (e.g., 6:00–6:30 in Figure 18a, and 6:00–9:00 in Figure 18c), the strain sensitivity Δε/ΔH reaches 0.19–0.33 με/m, demonstrating that short-term depth variations have a more significant impact on flip plate loading. By contrast, during periods of slow or stable water depth changes (e.g., 9:00–12:00 in Figure 18c), the strain response tends to stabilize (Δε/ΔH ≈ 0.01 με/m), with a much lower Pearson correlation coefficient, suggesting the presence of additional influencing factors beyond water depth.
Across both representative cases, the strain sensitivity to water depth changes ranges between 0.06 and 0.33 με/m, with higher sensitivity observed during sharp depth transitions. In all cases, the Pearson correlation coefficient exceeds 0.8, confirming a significant linear correlation between steel cable strain and water depth. This quantitative relationship directly reflects how the self-weight of the mattress regulates the loading on the flip plate under varying water depth conditions. It provides a feasible parameter basis for real-time load monitoring and early warning in mattress deployment, and can further support the development of a water-depth-to-load prediction model to optimize flip plate control strategies.
It should be noted that although the overall trend of flip plate steel cable strain exhibits a strong correlation with water depth variation, the two are not strictly synchronous or perfectly matched. In both sets of construction data, local inconsistencies and fluctuations between strain and water depth were observed. The potential reasons for these discrepancies are analyzed as follows:
On the one hand, factors beyond water depth, such as variations in flow velocity and flow regime, can significantly affect the stress state of the flexible mattress. Given the complex hydrodynamics in the construction area, if upstream velocity increases or changes occur in flow direction or turbulence patterns during the deployment process, the direction and distribution of forces acting on the mattress will shift. This, in turn, alters the loading on the flip plate, causing fluctuations in the tensile force experienced by the steel cable—even in the absence of significant water depth changes. Particularly under conditions of localized velocity surges or instantaneous turbulent impacts, the mattress may undergo abrupt stress changes, independent of water depth.
On the other hand, the tension sensor connected to the flip plate steel cable has high sensitivity, capable of capturing stress variations on the order of microstrain (με). During deployment operations, vibrations of the vessel, equipment movements, or manual interventions may introduce localized disturbances to the sensor, manifesting as short-term strain fluctuations that do not necessarily reflect actual changes in structural loading.

5.3. Dynamic Risk Identification and Prediction During Construction

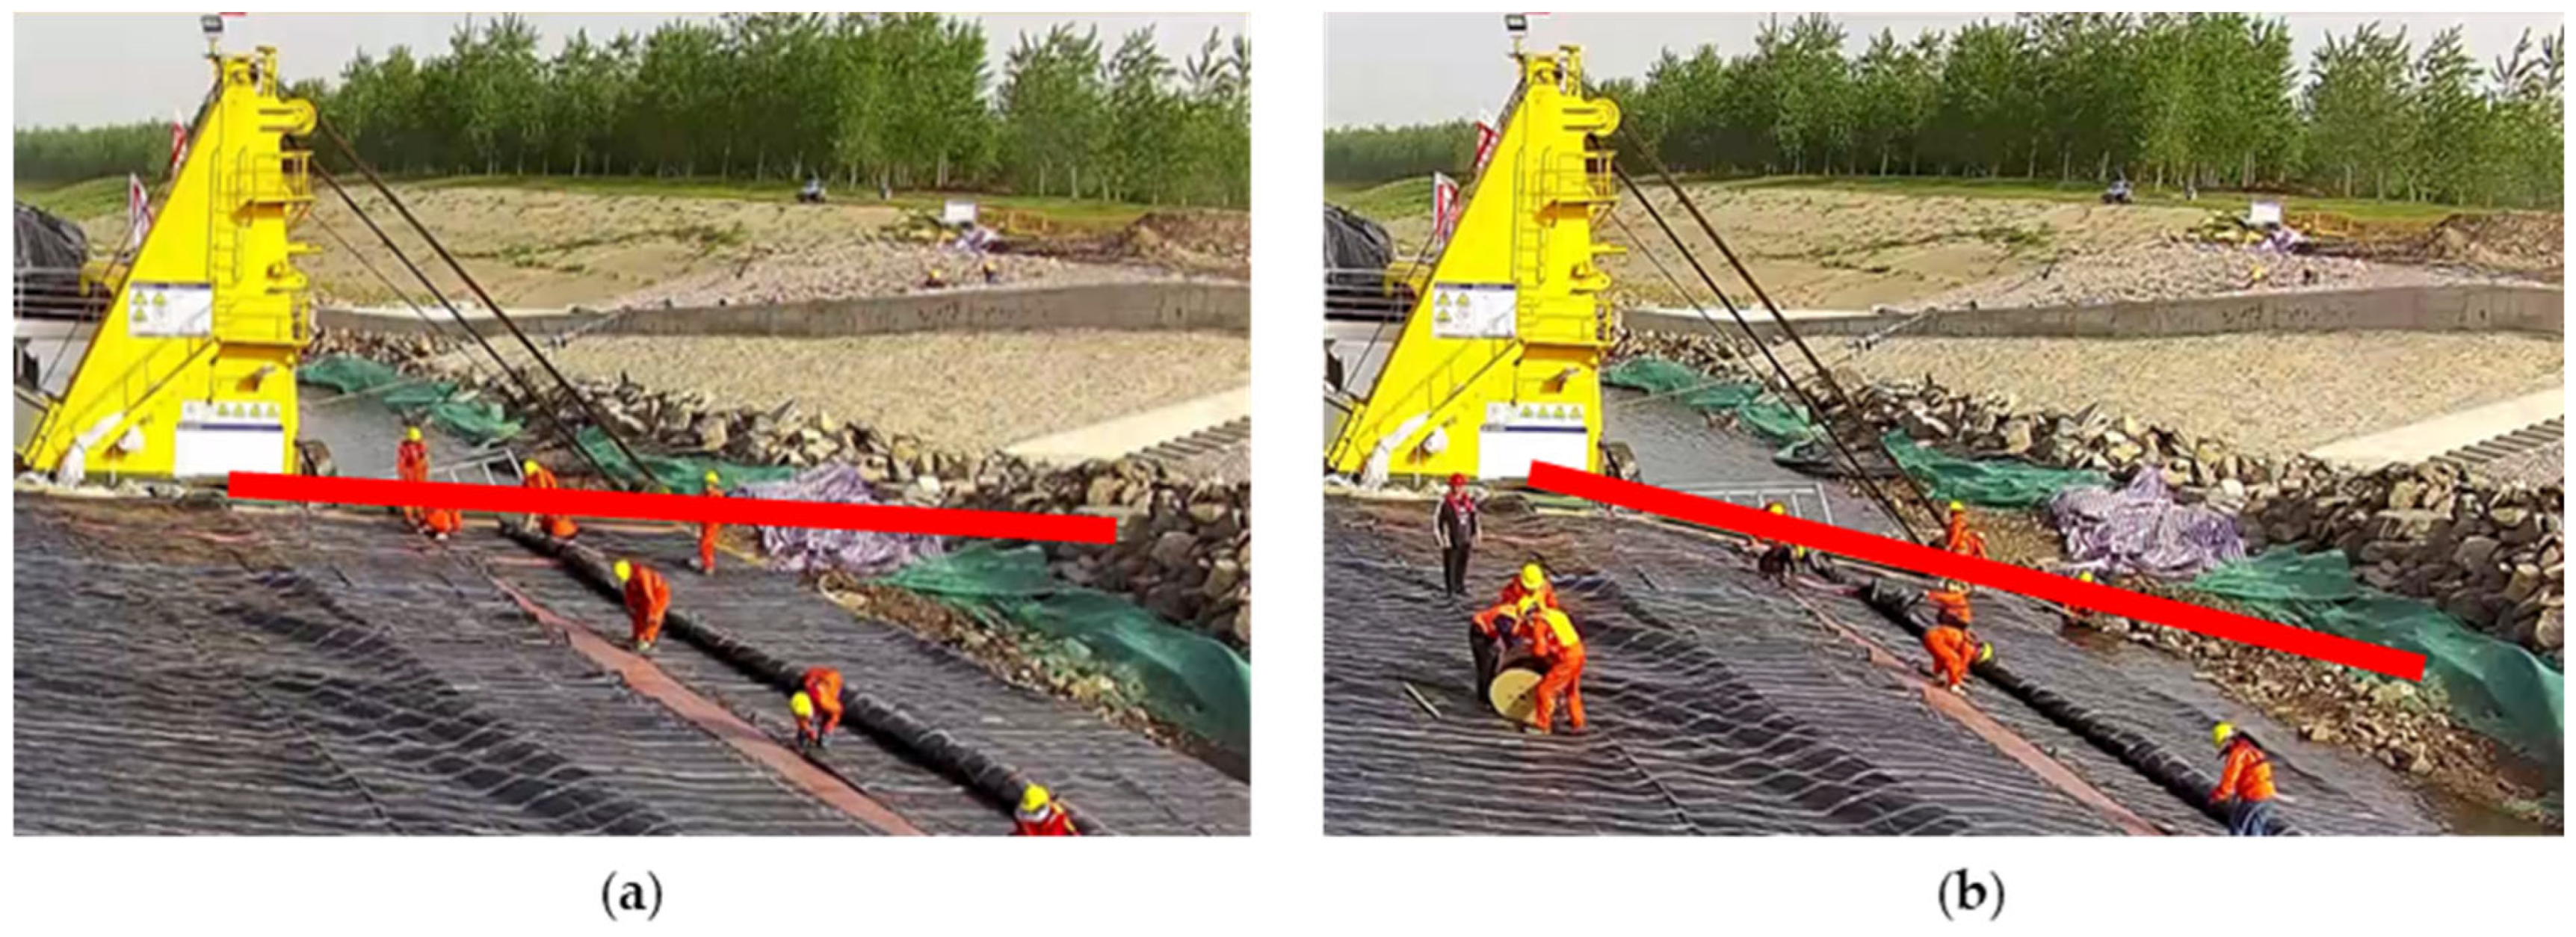
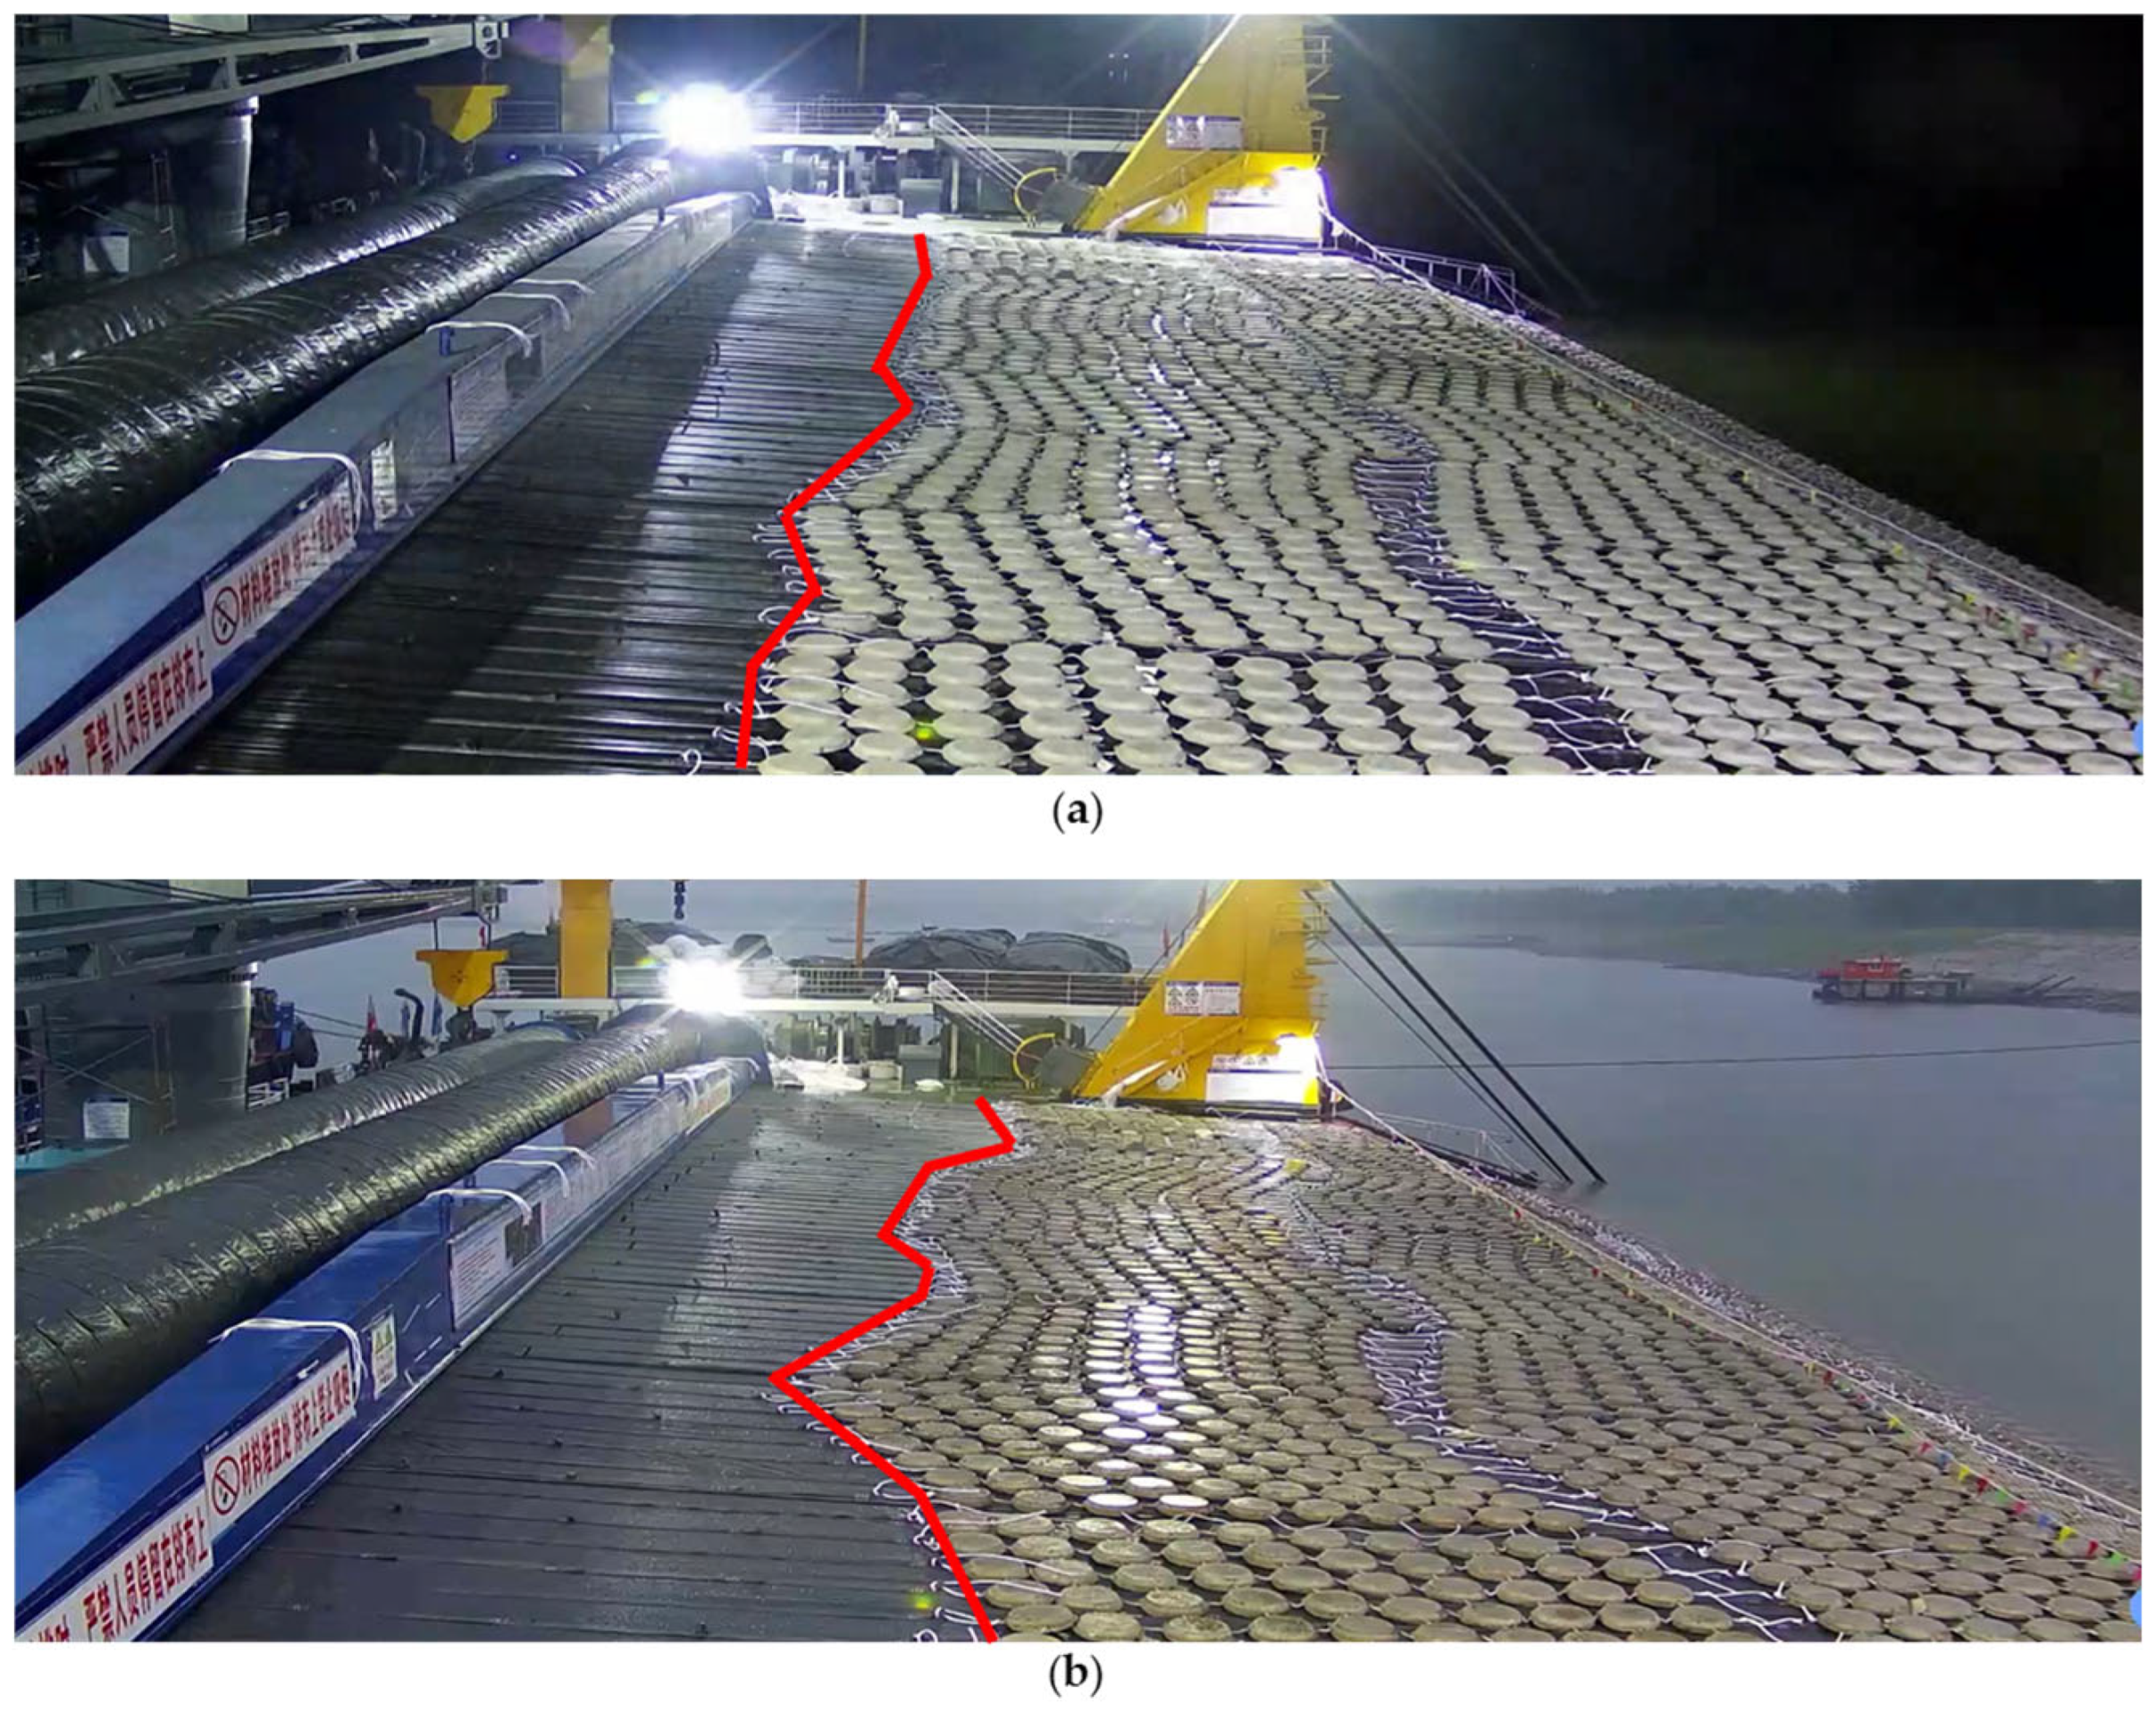
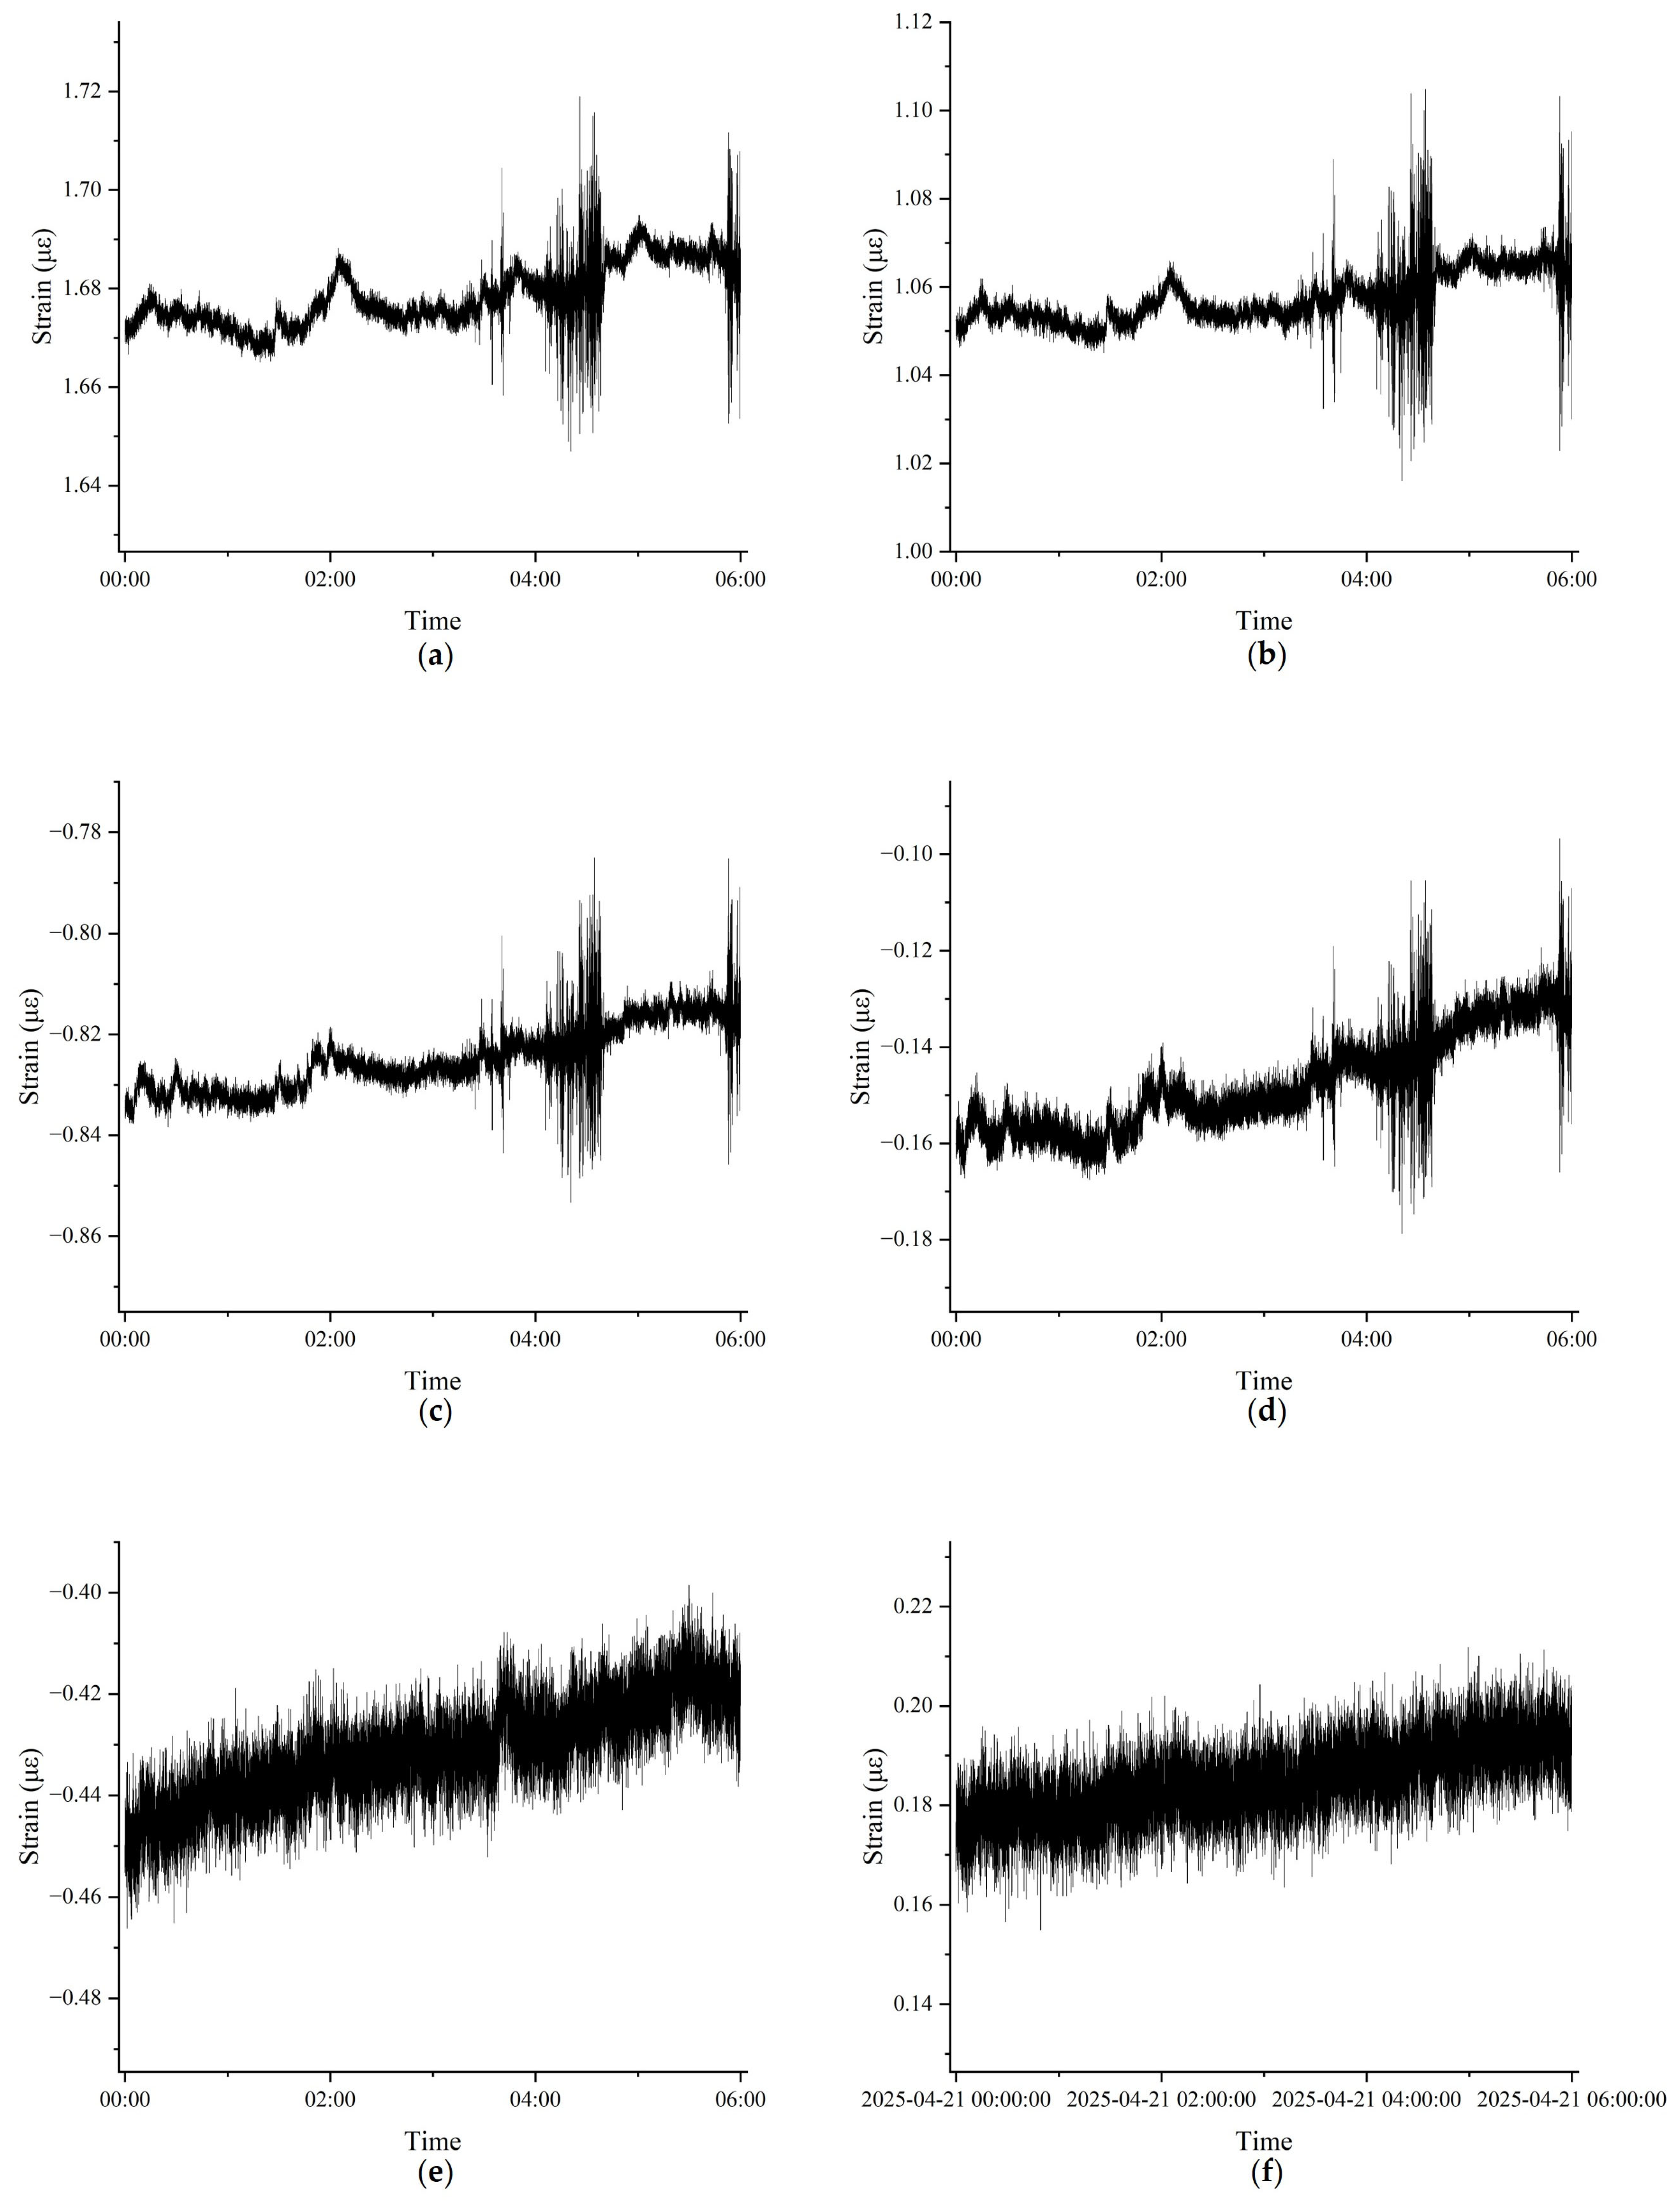
To further analyze the stress variation of the flexible mattress during deployment and its impact on structural bases, on-site surveillance images of the deployment vessel (Figure 19), strain data from the roller base and the clamping beam base were selected for the 00:00–06:00 time period of a construction day (Figure 20) for comprehensive analysis. On that day, the deployment vessel had paused operations with the mattress suspended, and the water depth at the site was approximately 15 m. Comparison between Figure 19a,b clearly shows a significant rightward displacement of the mattress, attributed to excessive loading. According to field construction records, during this incident the mattress experienced excessive tensile stress, resulting in partial structural damage. Deployment could only continue after adjustments were made to the mattress.
For monitoring points on the bow side (Figure 20a–d), during the pre-event phase (00:00–04:00), both the peak-to-valley strain difference (Δε) and standard deviation (σ) remained stable at Δε ≈ 0.02 με and σ ≈ (1.5–1.9) × 10−3 με (see Table 9), indicating stable structural loading with minimal fluctuation. However, starting from approximately 04:00, both Δε and σ increased sharply—by 175–300% and 331–433%, respectively—accompanied by pronounced high-frequency oscillations. This reflects a global shift of the mattress structure under combined gravitational and hydrodynamic forces, with the resultant load being transmitted longitudinally to the roller and clamping beam bases, inducing strong compressive stress responses.
In contrast, monitoring points on the stern side (Figure 20e–f) exhibited consistently smaller baseline fluctuations (Δε ≈ 0.03 με, σ ≈ 2 × 10⁻³ με, see Table 9), and post-event increases were limited to 17–30%, with only mild high-frequency oscillations—significantly lower than those observed at the bow. This discrepancy can be attributed to the bow side, facing upstream, bearing the brunt of initial hydrodynamic impact. Additionally, localized deformation likely caused the flexible mattress to deviate from the vessel’s longitudinal axis, further amplifying the tensile stress on the upstream side, while reducing the stress experienced downstream.
According to the JTS/T 148-2020 Technical Specification for the Application of Geosynthetics in Port and Waterway Engineering [32], the tensile safety factor for flexible mattresses during construction should be between two and three. Based on the monitoring data, we propose the following early-warning criterion:
When either the peak-to-valley strain difference or the standard deviation at any upstream monitoring point increases by more than 200% compared to its baseline, the condition is classified as high-risk, indicating potential mattress overloading or displacement instability, requiring immediate suspension of operations and on-site inspection. Experimental results confirm that, following the event, all bow-side monitoring points exhibited 200–300% increases, exceeding the high-risk threshold. This validates the high sensitivity and reliability of base strain monitoring in capturing stress variations and provides a critical basis for safety monitoring and early warning in subsequent mattress deployment operations.
6. Conclusions

This study is based on the Yaojv revetment reconstruction project, part of Phase II of the Jingjiang River regulation. A hydrodynamic model and a structural model of the flexible mattress were established to analyze the stress conditions during deployment. A stress monitoring and early-warning system was installed on the deployment vessel to identify potential risks in real time. Based on the monitoring data, early warnings were issued during the deployment process. The following conclusions were drawn:
A numerical force model for D1-type flexible mattresses was developed based on the hydrological conditions of a selected reach of the Jingjiang River. The simulation results revealed the stress distribution during vertical deployment against the flow, considering the combined effects of self-weight and hydrodynamic forces. The simulation results generally aligned well with field monitoring data. Where discrepancies occurred, they were likely due to the complex hydrodynamic environment, especially the difficulty in accurately characterizing vertical flow structures, which limited the model’s ability to fully reflect real-world conditions.
A multi-sensor monitoring and early-warning system was deployed at key stress points on the vessel, effectively capturing stress variations during mattress deployment. Under different construction and flow conditions, a strong correlation was observed between mattress stress and factors such as water depth, flow velocity, and operational procedures. Notably, when overloading occurred, bow-side sensors exhibited sharp increases in strain—often exceeding 150% of the baseline. Strain data from flip plate cables and structural bases proved to be reliable indicators of deployment risk.
Integrated with an online platform, the system enables real-time alerts for potential mattress folding or tearing, significantly reducing construction risks. Nonetheless, some data fluctuations could not be fully explained by measured external factors, suggesting the influence of localized flow complexity and equipment disturbances. Further research is needed to enhance the model’s accuracy and improve risk prediction under complex field conditions.
Looking ahead, the proposed modeling and monitoring framework holds strong potential for extension to more geometrically and environmentally complex scenarios, such as curved marine breakwaters and offshore mattress deployments. These environments are typically subject to multidirectional wave fields, non-uniform currents, and greater installation depths, all of which introduce additional stress regimes and deployment challenges. Enhancing the model to incorporate wave-induced loading, seabed heterogeneity, and dynamic mooring interactions could significantly expand its applicability. Furthermore, coupling the force model with advanced AI-driven data analytics may offer improved predictive capabilities and adaptive control strategies for real-time decision-making in offshore construction operations.
Author Contributions

Conceptualization, C.Z. and P.L.; methodology, Z.C. and K.W.; software, T.C. and Z.T.; validation, J.H., Z.C. and C.Z.; formal analysis, P.L. and Z.C.; investigation, K.W. and J.H.; resources, C.Z. and S.X.; data curation, T.C. and Z.T.; writing—original draft preparation, Z.C. and P.L.; writing—review and editing, Z.C. and C.Z.; visualization, J.H. and Z.C.; supervision, S.X. and P.L.; project administration, K.W., S.X. and J.H.; funding acquisition, S.X. All authors have read and agreed to the published version of the manuscript.

Funding

This research was funded by the National Natural Science Foundation of China, grant number 52271266.

Data Availability Statement

The original contributions presented in this study are included in the article. Further inquiries can be directed to the corresponding author.

Acknowledgments

The authors acknowledge the Changjiang Wuhan Waterway Engineering Bureau, Jingjiang Phase II Project Department, for the equipment, materials and support provided during the field observation and data collection.

Conflicts of Interest

The authors declare no conflicts of interest.

Abbreviations

The following abbreviations are used in this manuscript:
GISGeographic Information System
DFOSDistributed Fiber Optic Sensing
BiLSTM-CNNBidirectional Long Short-Term Memory—Convolutional Neural Network
FSIFluid–Structure Interaction

References

  1. Yang, H.; Lu, Y.; Zuo, L.; Yuan, C.; Lu, Y.; Zhu, H. Numerical analysis of interaction between flow characteristics and dynamic response of interlocked concrete block mattress during sinking process. Ocean Eng. 2023, 286, 115574. [Google Scholar] [CrossRef]
  2. Luo, Q.; Wang, M.; Xu, H.; Zhou, L.; Cai, J. Application effect analysis of flexible mattress revetment in the right branch inlet section of Bagua Island, Nanjing. Port Waterw. Eng. 2023, 7, 113–119. [Google Scholar] [CrossRef]
  3. Wu, J.; Chen, L.; Li, M.; XU, Y.; Lu, X.; Zhu, Y.; Feng, X. Study on force characteristics of unidirectional grating flexible mattress during down-stream sinking. Port Waterw. Eng. 2023, 4, 129–136. [Google Scholar] [CrossRef]
  4. Chen, D. Application study of key technologies in underwater flexible mattress revetment. Pearl River Water Transp. 2024, 2, 30–32. [Google Scholar] [CrossRef]
  5. Chen, H.; Ying, J. Construction method and quality control of underwater sand-rib flexible mattress in deep-water rapid-flow area. Shaanxi Water Resour. 2022, 2, 150–151. [Google Scholar] [CrossRef]
  6. Chang, L.; Wang, H.; Li, X.; Sun, W.; Zheng, J.; Li, P. Analysis on force characteristics of D-type flexible mattress during downstream sinking. Port Waterw. Eng. 2022, 3, 78–84. [Google Scholar] [CrossRef]
  7. Wei, X.; Liu, J.; Zuo, L.; Lu, Y.; Yuan, S.; Lu, Y.; Tang, H. Deformation monitoring and data denoising without clean data for sandbars protective flexible mattress in the Yangtze River. Measurement 2025, 242, 116185. [Google Scholar] [CrossRef]
  8. Wei, X.; Liu, J.; Zuo, L.; Lu, Y.; Huang, M.; Yuan, S. Framework design of deformation monitoring system for flexible mattress shoreline protection in inland waterways. Hydropower Energy Sci. 2024, 42, 185–189. [Google Scholar] [CrossRef]
  9. Yu, G. Application and improvement of side-scan sonar in underwater flexible mattress detection. Water Sci. Eng. Technol. 2022, 4, 82–85. [Google Scholar] [CrossRef]
  10. Jin, J. Application of real-time sonar detection technology in underwater flexible mattress installation quality inspection. China Water Transp. 2018, 1, 55–56. [Google Scholar] [CrossRef]
  11. Shi, J.; Wan, L. Improvement of real-time detection method for flexible mattress deployment quality. Port Technol. 2017, 12, 10–14. [Google Scholar]
  12. Yin, H.; Liu, J.; Wei, X.; Zhang, J.; Zuo, L.; Yang, H.; Zhou, B. Study on tail settlement monitoring method of flexible mattress under water flow scour. China Water Transp. 2024, 2418, 88–90. [Google Scholar]
  13. Tang, X.; Fu, G.; Li, W. Discussion on detection technology for flexible mattress in highly turbid estuarine conditions. Port Waterw. Eng. 2013, 03, 81–85+108. [Google Scholar] [CrossRef]
  14. Yichang Waterway Engineering Bureau of Yangtze River. First construction of concrete interlocking block flexible mattress. China Water Transp. Channel Technol. 2017, 25, 60. [Google Scholar]
  15. Zhong, C.; Wan, L. Quality control of underwater flexible mattress deployment in deep-water embankment construction. Port Technol. 2017, 01, 29–33+51. [Google Scholar]
  16. Gao, D.; Su, E. Manufacturing and deployment of ultra-deep and ultra-long flexible mattresses. Pearl River Water Transp. 2024, 7, 39–41. [Google Scholar] [CrossRef]
  17. Smyrnis, A. Stability of Block Mats Under Flow Conditions. Master’s Thesis, Delft University of Technology, Delft, The Netherlands, January 2017. [Google Scholar]
  18. Di Pietro, P. Research Study and New Evaluation Method for Pre-Filled Mattresses as Erosion Protection Systems of Berthing Structures against Jet Propeller Actions. In Proceedings of the 11th International Conference on Scour and Erosion, Copenhagen, Denmark, 17–21 September 2023. [Google Scholar]
  19. Genovese, N.A. Composite Rock Bag Solution for Scour Protection at a Very Exposed Location. In Proceedings of the 11th International Conference on Scour and Erosion, Copenhagen, Denmark, 17–21 September 2023. [Google Scholar]
  20. Tsubokawa, R.; Iida, Y.; Ushiwatari, Y.; Matsuda, T.; Ochi, M.; Miyatake, M.; Sassa, S. Coastal Road Slope Disasters Due to Scour and Erosion Surrounding a Retaining Wall. In Proceedings of the 11th International Conference on Scour and Erosion, Copenhagen, Denmark, 17–21 September 2023. [Google Scholar]
  21. Xie, S. Study on Downstream Mattress Sinking Construction Technology for the Navigation Channel Regulation Project of Heishazhou Waterway in the Lower Yangtze River. Master’s Thesis, Chongqing Jiaotong University, Chongqing, China, 2015. [Google Scholar]
  22. Huang, W.; Creed, M.; Chen, F.; Liu, H.; Ma, A. Scour around submerged spur dikes with flexible mattress protection. J. Waterw. Port Coast. Ocean Eng. 2018, 144, 04018013. [Google Scholar] [CrossRef]
  23. Yamini, O.A.; Mousavi, S.H.; Kavianpour, M. Experimental investigation of using geo-textile filter layer in articulated concrete block mattress revetment on coastal embankment. J. Ocean Eng. Mar. Energy 2019, 5, 119–133. [Google Scholar] [CrossRef]
  24. Yang, H.; Lu, Y.; Zuo, L.; Zhou, C.; Yin, H.; Lu, Y.; Huang, T.; Wei, X.; Xue, B.; Xia, J.; et al. Erosion mechanism of point bar retreat under the protection of a flexible mattress. Catena 2024, 239, 107939. [Google Scholar] [CrossRef]
  25. Cardoso, A.H.; Fael, C.M. Protecting vertical-wall abutments with riprap mattresses. J. Hydraul. Eng. 2009, 135, 457–465. [Google Scholar] [CrossRef]
  26. Garg, V.; Setia, B.; Singh, V.; Kumar, A. Scour protection around bridge pier and two-piers-in-tandem arrangement. J. Hydraul. Eng. 2021, 28, 251–263. [Google Scholar] [CrossRef]
  27. Hassan, M.A.; Gottesfeld, A.S.; Montgomery, D.R.; Tunnicliffe, J.; MacIsaac, E. Sediment transport and channel morphology of small, forested streams. JAWRA J. Am. Water Resour. Assoc. 2005, 41, 853–876. [Google Scholar] [CrossRef]
  28. Yang, Y.; Zheng, J.; Zhang, M.; Zhu, L.; Zhu, Y.; Wang, J.; Zhao, W. Sandy riverbed shoal under anthropogenic activities: The sandy reach of the Yangtze River, China. J. Hydrol. 2021, 603, 126861. [Google Scholar] [CrossRef]
  29. Melville, B.W.; Coleman, S.E. Bridge Scour; Water Resources Publications: Highlands Ranch, CO, USA, 2000. [Google Scholar]
  30. Lawson, C. Design and Performance of Geosynthetic Mattress Syst ems in River Engineering. In Proceedings of the 4th International Conference on Scour and Erosion (ICSE-4), Tokyo, Japan, 4–11 November 2008. [Google Scholar]
  31. Gier, J.; Charlier, R.H.; Li, J. Hydraulic and ecological performance of flexible mattress revetments in large rivers. J. Environ. Manag. 2012, 101, 18–25. [Google Scholar] [CrossRef]
  32. JTS/T 148-2020; Technical Specification for the Application of Geosynthetics in Port and Waterway Engineering. Ministry of Transport of the People’s Republic of China: Beijing, China, 2020.
Figure 1. Geographical location of the project.
Water 17 02333 g001
Figure 2. (a) Plan view of the D1-type flexible mattress (unit of length: mm); (b) Field photograph of the D1-type mattress during deployment.
Water 17 02333 g002
Figure 3. Failure schematic of mattress deployment under vertical flow: (a) Sliding and rolled mattress; (b) Mattress floating and tearing.
Water 17 02333 g003
Figure 4. Field photograph of mattress failure during construction. (a) Longitudinal tearing of the flexible mattress; (b) Transverse tearing of the flexible mattress.
Water 17 02333 g004
Figure 5. Bathymetric map of the study area.
Water 17 02333 g005
Figure 6. Illustrations of the spatial distribution of flow velocity under various conditions (ah), with each subfigure representing Scenario 1 to Scenario 8, respectively.
Water 17 02333 g006
Figure 7. Illustrations of the depth-averaged velocity profile along cross-section under various conditions (ah), with each subfigure representing Scenario 1 to Scenario 8, respectively. The cross-section corresponds to Section 5 in Figure 8c.
Water 17 02333 g007
Figure 8. Flow velocity vectors under different conditions and schematic of selected cross-section: (a) Condition 4; (b) Condition 8; (c) Schematic diagram of the selected cross-section.
Water 17 02333 g008
Figure 9. Velocity vector distributions at Cross-sections 1 and 2 under varying hydraulic conditions: (a) Section 3, Condition 4; (b) Section 3, Condition 8; (c) Section 5, Condition 4; (d) Section 5, Condition 8.
Water 17 02333 g009
Figure 10. Illustrations of different catenary profiles during the deployment.
Water 17 02333 g010
Figure 11. Structural schematic of the mattress.
Water 17 02333 g011
Figure 12. Stress distribution results: (a) Overall stress distribution; (b) Stress concentration at the reinforced zone.
Water 17 02333 g012
Figure 13. Schematic Diagram of Mattress Deployment under Vertical Flow.
Water 17 02333 g013
Figure 14. Early warning and monitoring equipment: (a) Tensile strain sensor (Model: PB-530); (b) Triaxial strain gauge (Model: BE120-3CA-P300); (c) Lightweight 8-channel data acquisition unit (Model: PB1101); (d) Network switch; (e) 4G routing module; (f) Monitoring computer host and hard drive enclosure for camera system; (g) Monitoring computer display; (h) Hikvision high-definition surveillance camera; (i) Uninterruptible power supply system (Model: UPS2000-A-1KTTL).
Water 17 02333 g014
Figure 15. Strain monitoring data at different locations during a specific time period during the mattress deployment: (a) Bow-side roller base; (b) Bow-side flap steel cable.
Water 17 02333 g015
Figure 16. Comparison of flip plate inclination angles at different time points. (a) Initial inclination; (b) Adjusted inclination.
Water 17 02333 g016
Figure 17. Comparison of loading conditions on the flip plate at different time points. (a) The concrete interlocking blocks are not seated on the plate, (b) The concrete interlocking blocks are properly seated on the plate.
Water 17 02333 g017
Figure 18. Trends of flap cable strain and water depth during mattress deployment: (a) Strain data of flap cable—Period 1; (b) Water depth—Period 1; (c) Strain data of flap cable—Period 2; (d) Water depth—Period 2.
Water 17 02333 g018
Figure 19. Displacement of the mattress body on the deck: (a) Displacement at 0:00 am; (b) Displacement at 6:00 am.
Water 17 02333 g019
Figure 20. Strain monitoring data of the base structures: (a) Bow-side roller base—Point 1; (b) Bow roller base—Point 2; (c) Bow clamping beam base—Point 1; (d) Bow clamping beam base—Point 2; (e) Stern roller base; (f) Stern clamping beam base.
Water 17 02333 g020
Table 1. Key Parameters and Values.
ParameterValue
Time Step30 s
Gravity9.81 m/s2
Water Density1000 kg/m3
Manning Roughness0.014
Median Sediment Diameter0.18 mm
Minimum Depth for Sediment Calculation0.2 m
Table 2. Simulation Settings for Typical Scenarios.
ScenarioPeriodInflow DischargeOutflow Water Level
1Dry Season7000 m3/s6 m
2Dry Season7000 m3/s5 m
3Dry Season7000 m3/s4 m
4Dry Season7000 m3/s3 m
5Normal Season15,000 m3/s11 m
6Normal Season15,000 m3/s10 m
7Normal Season15,000 m3/s9 m
8Normal Season15,000 m3/s8 m
Table 3. Simulated and measured water levels at representative cross-sections.
Cross-Section in Figure 8Measured Water Level (m)Simulated Water Level (m)Difference (m)
115.35515.347−0.008
215.29215.291−0.001
414.73814.7430.006
514.66414.6790.015
Table 4. Scenario Settings.
Flow Velocity (m/s)Resultant Flow Force (Pa)x-Direction Component (Pa)y-Direction Component (Pa)
0.523.7420.5611.87
0.860.7952.6530.39
1.1114.9299.5257.46
1.4186.16161.2293.08
1.7274.49237.72137.25
2.0379.91329.01189.96
2.3502.43435.12251.22
Table 5. Main Technical Specifications of Materials for D1-type Flexible Mattress.
MaterialSpecificationTensile StrengthEffective Aperture
Polypropylene woven fabric (UV-resistant)300 g/m2Longitudinal ≥ 3400 N/5 cm * Transverse ≥ 2800 N/5 cm *O95 ≤ 0.12 mm *
Polypropylene reinforcement strip (longitudinal)Width 7 cm, 80 g/m≥20 kN/piece *
Polypropylene reinforcement strip (transverse)Width 5 cm, 50 g/m≥11 kN/piece *
Braided polypropylene ropeΦ 12 mm, 60 g/m≥17 kN/piece *
UV resistanceUV exposure for 96 hResidual strength ≥ 90% of design requirement *
Data with * are mandatory indicators; other values are for reference, with a permissible deviation of ±5%. Φ is the diameter, O95 is the 95% effective aperture.
Table 6. Error Between Simulated and Calculated Stress Values at Different Flow Velocities.
Flow Velocity (m/s)Maximum Error (%)Mean Error (%)Minimum Error (%)
0.00.00−0.13−0.25
0.5−2.28−0.03−0.16
0.8−0.67−0.15−0.07
1.10.03−2.980.27
1.40.12−0.030.06
1.70.350.080.08
2.00.490.14−0.03
2.3−0.390.06−0.03
Table 7. Resultant Force on the Upper Edge at Different Flow Velocities.
Flow Velocity (m/s)Resultant Force on Upper Edge (N)Force Direction
0.01.150 × 106Water 17 02333 i001
0.51.159 × 106Water 17 02333 i002
0.81.174 × 106Water 17 02333 i003
1.11.200 × 106Water 17 02333 i004
1.41.235 ×106Water 17 02333 i005
1.71.285 × 106Water 17 02333 i006
2.01.351 × 106Water 17 02333 i007
2.31.437 × 106Water 17 02333 i008
Table 8. Strain–Water Depth Relationship.
PeriodTime PeriodΔH (m)Δε (με)ΔH/Δε (m/με)Correlation (r)
16:00–6:301.20.40.330.90
6:30–8:30−4.6−0.60.130.95
6:00–9:00−3.4−0.20.060.88
26:00–9:00−5.0−0.950.190.92
9:00–12:00−4.0−0.050.010.12
12:00–15:305.00.40.080.78
6:00–15:30−4.0−0.60.150.91
Table 9. Comparison of Key Indicator Changes at Monitoring Points.
LocationMonitoring PointIndicatorBefore EventAfter EventIncrease (%)
Bow SideRoller Base Point 1Δε (με)0.020.035+175%
σ (με)0.00150.008+433%
Roller Base Point 2Δε (με)0.020.06+200%
σ (με)0.00180.009+400%
Clamping Beam Base Point 1Δε (με)0.020.06+200%
σ (με)0.00170.0075+341%
Clamping Beam Base Point 2Δε (με)0.020.08+300%
σ (με)0.00190.0082+331%
Stern SideRoller Base PointΔε (με)0.030.035+17%
σ (με)0.0020.0026+30%
Clamping Beam Base PointΔε (με)0.030.038+27%
σ (με)0.0020.0026+30%
Disclaimer/Publisher’s Note: The statements, opinions and data contained in all publications are solely those of the individual author(s) and contributor(s) and not of MDPI and/or the editor(s). MDPI and/or the editor(s) disclaim responsibility for any injury to people or property resulting from any ideas, methods, instructions or products referred to in the content.