Abstract
Based on trade data from 2005 to 2020, this study investigates the driving forces behind China’s grain virtual water (VW) import trade, with a particular focus on the role of the Belt and Road Initiative (BRI). By incorporating economic distance (ED) and institutional distance (ID) into the gravity model framework and applying a high-dimensional fixed-effects Poisson pseudo-maximum likelihood estimation method, the study offers new empirical insights. The results indicate that ED is negatively associated with virtual water trade (VWT) in grains, while ID exhibits an inverted U-shaped relationship with VWT. Furthermore, the BRI significantly moderates the effects of ED and ID, weakening their influence on VWT. Additionally, the initiative demonstrates a clear trade creation effect, promoting increased VW imports. These findings contribute to a deeper understanding of the mechanisms shaping VWT and offer valuable policy guidance for enhancing international cooperation under the BRI framework.
1. Introduction
Water is essential for human survival. However, water shortages restrict the sustainable development of countries or regions, causing various social and political problems [1]. China has been one of the countries with the largest water consumption in the world [2], while its per capita renewable freshwater resources are only 3% to 4% of the world average. Among the many water-use sectors, agricultural production is the first to consume water resources [3]. China’s limited water resources pose a serious threat to its grain security and national economic development [4]. As a water-intensive product, the virtual water embedded in grain takes grain trade as a carrier to realize the flow of water resources between regions. Imported grain is imported water resources. It has become a common consensus to coordinate “two markets and two resources” under the background of double circulation to better safeguard national grain security [5]. In 2013, China launched the Belt and Road Initiative (BRI), aiming to strengthen cooperation with countries and international organizations along the route and promote connectivity. The BRI is an effective way to enrich grain import sources and reduce dependence on individual countries [6]. Since its implementation, the total trade volume of agricultural products and the virtual water flow momentum between China and the countries along the route have shown a significant growth trend, which not only helps to ensure China’s grain security but also provides a new perspective for the transnational flow of water resources. The virtual water strategy has changed the traditional way of solving the problem of water shortage through engineering technology and has built a bridge between water resource management and grain security [7].
Allan (1997) firstly proposed the concept of “virtual water” [8]. He believed that virtual water is the water consumed during the process of production and consumption in a virtual form. Over the past few decades, VWT has been used as a tool for managing water resources and maintaining global economic stability [9]. The calculation methods for virtual water mainly include the following two categories. One method is to calculate the direct water consumption of crops in the production process as the virtual water content according to the total transpiration in the growth period combined with the yield [10]. Another approach is to estimate virtual water flows and trade using the regional input-output methods. This method includes both the single-regional and multi-regional input-output method [11]. However, this method is not sufficiently accurate to estimate the virtual water content of crops, nor does it allow for continuous data collection from one year to the next.
The main theoretical basis of VWT is the theoretical system of comparative advantage in international trade, and VWT is the expansion and application of this theory. Scholars have often explored the influencing factors of virtual water from multiple perspectives based on comparative advantages [12]. The gravity model is one of the most commonly used methods for measuring the VWT flow [13]. The influence of unobservable factors on trade has gradually increased with the development of science and technology [14]. However, there is a relative lack of research on incorporating unobservable factors into the VWT. Among them, economic distance (ED) affects trade preference through overlapping demand [15], while institutional distance (ID) affects comparative advantage through transaction costs and the social division of labor, thereby affecting trade flows [16]. The trade effects generated by ED and ID cannot be ignored. However, the academia has not reached a consensus on their impact mechanism on VWT. Current research on the BRI lacks a comprehensive consideration of trade and water resources. Most studies only consider the BRI as the research background or consider the countries along the BRI as the sample countries to study the driving mechanism of trade [17]. There are few studies on the impact of BRI as a regulatory variable on unobservable factors on VWT, and there are few studies on the welfare effect of BRI.
Therefore, this study utilizes data on grain VWT between China and its major trading partners from 2005 to 2020 to include unobservable factors—ED, ID, and BRI in the study—and explores the moderating effect of BRI and unobservable factors on the relationship between grain virtual water import trade through high-dimensional fixed-effect Poisson pseudo maximum likelihood estimation (PPMLHDFE). Simultaneously, the trade effect of the BRI is analyzed using the difference-in-differences model to comprehensively examine the important role of the BRI in alleviating the shortage of water supply and maintaining grain security in China. The results show that the BRI has a moderating effect. It has a significant trade creation effect in virtual water import trade and increases China’s trade welfare. This study compensates for the lack of investigation of unobservable costs on current research and provides a theoretical basis for further ensuring grain and water security in China.
2. Theoretical Analysis and Research Hypotheses
In empirical research, the trade gravity model analyzes the factors affecting international trade flow from three aspects: demand potential of the importing country, trading costs between both countries, and exporting countries’ supply potential [18]. In the following section, the factors affecting China’s international trade in grain VW are analyzed from three aspects: demand, trade cost, and supply.
2.1. Demand Factors Affecting China’s International Trade in VW for Grains
Linder (1961) proposed the demand similarity theory in the study of trade and transformation, also known as the preference similarity theory or the overlapping demand theory, which attempts to explain trade patterns from the perspective of the difference in production function caused by the difference in demand [15]. This theory expounds on the relationship between demand factors and global trade from the perspective of demand; its basic view is that overlapping demand is an independent condition for the emergence of international trade. When the per capita incomes of the two countries are closer, the scope of the demand overlap will be larger, and the demand structure will be closer, so the foundation of trade between the two countries will be stronger, and the potential trade volume between them will be larger. Countries with similar income levels have closer trade relations and vice versa. Therefore, this study introduces the ED variable to explore the effect of demand similarity on the international trade of VW. ED is the absolute value of the difference between the two countries’ per capita GDP and is defined as follows:
and represent the per capita GDP of the country j and the per capita GDP of China, respectively.
Based on the above analysis, this study proposes research hypothesis H1:
H1:
ED negatively affects China’s grain VW import trade flow.
2.2. Cost Factors Affecting China’s International Trade in VW for Grains
With the continuous improvement of transportation facilities and revolution of transportation technology, the impact of trade resistance caused by geographical distance on bilateral trade has gradually reduced. Therefore, this study replaces the geographical distance factor in the traditional gravity model with ID, which is defined as the Mahalanobis distance between the institutional quality of the two countries. The measurement standard of ID is based on the score proposed by Kaufmann et al. (2010) for six dimensions of government quality: voice and accountability, political stability and non-violence/terrorism, government efficiency, regulatory quality, the rule of law, and corruption control [19]. The exact formula is shown in Equation (2).
where is a 6 × 1 vector representing bilateral differences in the six dimensions of WGI, is the covariance matrix, and is the inverse of the covariance matrix.
International trade leads to transaction costs because of institutional differences [20]. The smaller the ID between the trading parties, the more similar the institutional environments are, and the more familiar they are with each other’s institutional arrangements [21]. A similar institutional background reduces the cost of information collection to understand the market environment, thus reducing transaction costs in the process of trade [22]. In addition, similar institutional environments result in fewer differences in contractual activities between trading parties, which in turn reduces disputes between trading parties due to contractual issues. Therefore, the growth in the scale of bilateral trade is inhibited by an increase in ID, which increases the transaction costs of bilateral trade.
However, even under conditions of identical preferences and technological levels, the differences in the institutional environment will still produce comparative advantages in international trade [23]. The difference in ID between the countries reflects the difference in the level of economic development. Different systems are conducive to the development of their respective comparative advantages. The self-strengthening mechanism of institutional factors can continuously strengthen the advantages of each country in the commodities with comparative advantages. The greater the economic distance between the two countries, the greater the difference in comparative advantages and trade space.
Therefore, the impact of increasing ID depends on the balance between “the advantages and disadvantages of outsiders”. When ID, the negative effects of the increase in trade costs and trade disputes caused by ID are relatively small, and the positive effects of the comparative advantage and social division of labor on international trade dominate. When ID is too large, the increase in trade costs and trade frictions and disputes caused by ID seriously affect the normal development of international trade. The negative impact on international trade offsets the positive effect of ID. At this time, it adversely affects international trade.
Based on the above analysis, this study proposes the research hypothesis H2:
H2:
ID and China’s grain VW import trade flow have an inverted “U”-shaped relationship.
The actual impact of trade policy on trade volume should not be underestimated [24]. A good trade policy environment can stimulate a country’s trade activities and minimize the distortion of resource allocation, whereas a bad trade policy environment can easily cause trade friction, increase trade costs, and cause welfare losses in trading countries [25]. BRI is a key step in expanding China’s international influence, enhancing China’s international identity, and deepening international grain trade cooperation. It is an initiative that benefits the whole world, further improves China’s opening-up level, and plays a key role in fostering inter-regional trade cooperation [26]. BRI strives to build a community of common interests, responsibilities, and shared responsibilities. It plays a crucial role in maintaining regional and global grain security and in promoting the stable development of the local economy. The BRI proposal is conducive to breaking trade barriers and reducing tariff costs with member countries, as well as improving the openness of trade and promoting trade exchanges between the two sides.
Based on the above analysis, this study proposes the research hypothesis H3:
H3:
The BRI proposal has a positive correlation with China’s grain VW import trade flow.
2.3. Supply Factors Affecting International Trade of China’s Grain VW
Neoclassical trade theory believes that differences in factor endowments are important driving factors for agricultural trade, and numerous scholars have also conducted empirical tests on them. The carriers of VWT studied in this study are grains; therefore, the differences in factor endowments that affect grains should be analyzed. Grains are labor- and resource-intensive, and the main input factors in production include land, water, and labor resources. Technological progress is a key driver of international trade. Endogenous technological progress may be a key factor in promoting trade efficiency when there is no significant change in a country’s exogenous factor endowment structure. Trefler (1993) incorporated elements of technological progress into the theory of factor endowment and concluded that both technological progress and endowment jointly affect international trade [27].
Based on the above analyses, this study proposes the following research hypotheses from the perspectives of factor endowment and comparative advantage:
H4a:
The difference in per capita arable land area is positively correlated with the VW import trade flow.
H4b:
The difference in per capita renewable water resources is positively correlated with VW import trade flow.
H4c:
The difference in the agricultural labor force size is positively correlated with VW import trade flow.
H4d:
The difference in technological progress is positively correlated with VW import trade flow.
The new trade theory, which highlights increasing returns to scale, views economies of scale as a critical driver of international trade [28]. In an imperfectly competitive market, increasing demand leads to industry growth due to economies of scale, thereby providing a competitive advantage in global trade. In this study, we selected two variables—agricultural industry scale difference and overall economic scale difference—to measure economies of scale. The agricultural industry and overall economic scales should reflect the principle of increasing returns to scale, and there may be a positive correlation with China’s VWT in grains.
Based on the above analyses, this study proposes research hypotheses H5a and H5b.
H5a:
The scale of the agricultural industry is positively correlated with the VW import trade flow of China’s grain.
H5b:
The size of the economy is positively correlated with China’s VW import trade flow of grains.
2.4. Moderating Effect
The BRI’s proposal is conducive to breaking trade barriers with member countries, reducing tariff costs, improving trade openness, and promoting trade exchange between the two sides. This was mainly due to the negative regulation of the relationship between ED, ID, and VWT.
As the most populous nation globally, ensuring grain security is a huge challenge for China at present and for an extended period in the future [29]. Grains are a matter of national livelihood, and the importation of VW resources for grains is by no means a simple trade issue but a political and strategic issue that concerns national security and stability. Complex security factors are the biggest drivers of reduced cooperation and skepticism among multinational investors [30]. Compared with the traditional grain import source countries, the countries and regions along the BRI have stronger geographical advantages and political mutual trust in grain trade with China and have greater space to increase grain production [31]. Since the BRI was proposed, China has preferred to import grains from BRI countries to ensure grain security to a greater extent.
BRI, with the core idea of “mutual consultation, joint construction and sharing”, carries out top-level design through policy communication, takes facilities’ connectivity, unimpeded trade, and financial accommodation as the ability support, and provides public opinion support with people-to-people connectivity, effectively reducing trade frictions and intangible costs caused by institutional differences between China and BRI countries and improving trade flows and trade efficiency. This effectively reduces trade friction and intangible costs caused by institutional differences and improves trade flows and trade efficiency. Signed cooperation documents cover several fields. These projects combine infrastructure and cultural relations, can compensate for the lack of information between trade parties and increase exchanges between trade parties, help break trade barriers with member countries, reduce tariff costs, and reduce cost problems caused by trade uncertainty.
It can be seen that BRI weakens the negative impact of the ED of relevant countries on VWT imports from the perspective of demand preference and negatively adjusts the “U”-shaped relationship between ID and grain VWT from the perspective of transaction costs.
Based on the above analyses, this study proposes research hypotheses H6a and H6b.
H6a:
BRI weakens the negative effects of ED on VWT imports from relevant countries.
H6b:
BRI negatively moderates the inverted “U”-shaped relationship between ID and grain VWT.
3. Variable Selection and Model Construction
3.1. Variable Selection
3.1.1. Explained Variable: VW Content Calculation
In terms of unit VW content, this study draws on the methods of Sun and Wang (2020) [32] to set the unit VW content of grains as
In Equation (3), represents the VW content of area grain in [32]; represents the water demand of area grain in ; represents the yield of area grain in where approximates the cumulative evapotranspiration water during grain growth and development . The calculation of needs to be based on the grain coefficient (comprehensively measured by differences in physiological and physical factors between actual and ideal grains) and the product of cumulative evapotranspiration of the grains over the whole growing period . Considering the data availability and research purpose, this study draws on the VW content per unit of grain calculated by Wang and Hu (2018) in their study [33], which is as follows: wheat 11,800,000 , maize 4,500,000 , rice 1,014,000 , and soybean 2,300,000 .
The calculation formula for the hidden VW in the grain m imported from country j in year t in China is
where represents the hidden VW flow in grain m imported by China from country in year in , represents the quantity of grain m imported from country in year in , and represents the VW content per unit of grain in year in (Appendix A details the consideration of using fixed virtual water coefficients. Monte Carlo simulation results show that the use of fixed coefficients does not affect the robustness of the results).
The total amount of VW contained in grains imported by China from country j in year t is shown in Equation (5):
3.1.2. Explanatory Variables: Factors Affecting International Trade in VW for Grains
According to the theoretical analysis and research hypotheses, this study selected explanatory variables from four perspectives: demand similarity, trade costs, factor endowment, and economies of scale, as shown in Table 1.

Table 1.
Variable declaration.
This study used a gravity model to explore the factors influencing the VW import trade flow of grains in China. Since Tinbergen (1966) and Poyhomen (1963) proposed the trade gravity model [37,38], it has been widely used to explain the flow of international trade, demonstrating its considerable empirical robustness and explanatory power.
There is also a large amount of zero value in the VW import trade of grains in China, and the treatment of zero trade flow is a key issue to be solved using the trade gravity model. Santos Silva and Tenreyro (2006) proposed the Poisson Pseudo Maximum Likelihood (PPML) method for estimating gravity models [39]. Related Monte Carlo simulations have shown that, even with a large proportion of zero trade values, PPML performs very well [40]. Correia et al. (2020) further extended the traditional PPML estimation method by using an improved iterative reweighted least-squares algorithm to estimate (pseudo) Poisson regression models with multiple high-dimensional fixed effects [41], making the estimation results more robust.
In the presence of both heteroscedasticity and zero trade flow, this study refers to the panel gravity model proposed by Yotov et al. (2016) and incorporates the fixed effects of exporting countries and time-fixed effects into the traditional gravity model [42]. A nonlinear extended gravity model was used to index the expected trade flow, and a parameter estimation was performed using PPMLHDFE [41] to avoid the parameter estimation bias caused by a large amount of zero trade value. Its basic form is shown in Equation (6):
where is a non-negative value, representing the VW resources hidden in China’s imported grains from country in year , represents the set of all explanatory variables, is the coefficient set of corresponding variables in , is an individual fixed effect, and is a fixed time effect. Considering the error term and satisfying the null condition mean assumption , then
If and two sets in Equation (7), are specified, the regression model below can be obtained.
3.1.3. Main-Effects Model
This study builds upon the theories of Correia et al. (2020) and Yotov et al. (2016) and employs PPMLHDFE to estimate an exponential non-linear extended gravity model [41,42]. Model 1 only includes the ED () and its quadratic term () to examine the relationship between ED and VW import trade, as shown in Equation (8):
Model 2 is the addition of ID () and its quadratic term () and cubic term () to Model 1 to examine the effect of ID on the VW import trade, as shown in Equation (9):
Model 3 is based on Model 2 with the addition of a policy effect variable representing BRI effect (), in which if country joins BRI in year , and vice versa is set to zero, which is used to examine the impact of BRI effect on the trade in VW imports as shown in Equation (10):
Model 4 adds factor endowment-related variables based on Model 3 to examine the impact of factor endowment differences on VW import trade, as shown in Equation (11):
Model 5 adds economies of scale variables to Model 4 to examine the impact of economies of scale differences on VW import trade, as shown in Equation (12):
Model 6 adds the cross term of the BRI- and ED-related terms to Model 5 to investigate whether the BRI moderates the nonlinear relationship between ED and VW import trade flows, as shown in Equation (13):
Model 7 adds the cross term of the BRI and ID correlation term to Model 6 to investigate whether the BRI initiative regulates the nonlinear relationship between ID and VW import trade flow, as shown in Equation (14):
4. Results
4.1. VW Import Trade Analysis
This study builds on the methods of Sun et al. (2020) and Wang et al. (2018) [32,33]. Based on Equation (4), the implied import content of popular resources in the four grains is calculated over time. The total import volume of popular resources hidden in the grains is derived from Equation (5). According to Figure 1, it can be seen that in terms of the hidden VW resources in grains trade, the total amount of VW imported by China is generally on the rise. In 2020, the total VW resources imported was 3.77 times that of 2005, with VW resource flow accounting for the largest proportion of soybean import trade, accounting for over 92% of the total amount of VW resources imported over the years, and contributing the most to the flow of VW resources in China. The proportion of implied VW resources in the maize import trade is relatively low, both below 5%.
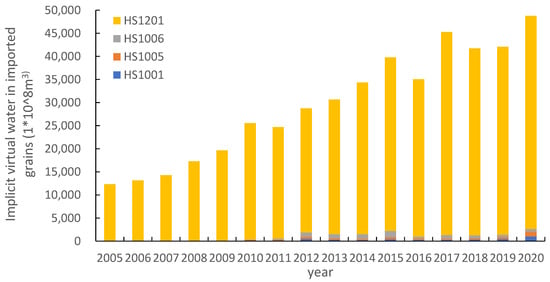
Figure 1.
Implied virtual water for grains imports (over 16 years). Note: the data in Figure 1 are calculated based on Equations (4) and (5).
Figure 2 shows the VW resource import volume of the four grains over time. The VW resource import volumes of wheat and maize were relatively low before 2009 but rapidly increased after 2009. The VW resource volume implied in wheat and maize import trade decreased significantly after 2013 and 2012, respectively, and showed a clear upward trend starting in 2019. Before 2010, the VW resources embedded in the rice import trade were relatively small, showing an upward trend between 2010 and 2015, and remained relatively stable after 2015. The trend of changes in implicit VW resources in imported soybeans is similar to that in the total amount of implicit VW in the grain import trade, showing a steady upward trend, increasing by more than twice compared to 2005. Among them, the amount of imported VW resources in the maize trade has grown the fastest. In 2020, the number of hidden VW resources in imported maize was 1214 times that in 2005, with an astonishing growth rate. The growth rate of wheat was the slowest, but it maintained an average annual growth rate of 5.48%. The average annual growth rates of rice and soybeans were 11.99% and 9.25%, respectively.
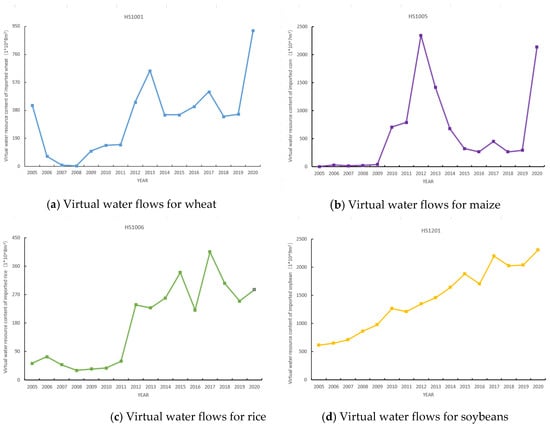
Figure 2.
Implied virtual water for imports of four grains (over 16 years).
4.2. Analysis of the VWT Effect of China’s Grain Imports
In the regression analysis, the explanatory and moderating variables were first centralized to construct a product term for the dual-factor interaction effect. Second, according to the model settings, explanatory variables, moderating variables, control variables, and interaction terms were added to the model for regression analysis. Additionally, the regression model was estimated using the PPMLHDFE method, and the welfare effect of the BRI was analyzed through the difference-in-differences model.
4.2.1. Main-Effects Analysis
Table 2 presents the hierarchical results of the main effects. The quadratic term of ED in Model 1 exhibits a nonlinear relationship with VW import trade at a significance level of 1%. This indicates an inverted “U”-shaped relationship between ED and VW import trade. Based on the range of ED values (≥0), the relationship is concentrated in the right range, where the inverted “U”-shaped distribution decreases monotonically. This suggests that ED significantly suppresses the growth of VW import trade flows while simultaneously increasing the absolute value of marginal VW. The negative relationship between ED and VW import trade validates the “Linder theorem,” which states that when the demand similarity between two countries is higher, the possibility of trade is greater, and when the demand similarity is lower, the possibility of trade is smaller. Therefore, Hypothesis 1 is validated.
Table 2.
Main-effect hierarchical regression results.
Model 2 incorporates ID (), and its quadratic terms () and cubic terms () are significantly correlated with VW import trade at 1%, 1%, and 10% levels, respectively. According to the value range of ID (), an inverted “U-shaped relationship” exists between ID and the VW import trade. When ID reaches the turning point, the VW import trade increases with an increase in ID. This is because most countries with similar ID to China are located in Central Asia and Southeast Asia, and these countries often have lower institutional quality than China. Although the “disadvantage of outsiders” brought about by ID inhibits the development of VWT, low ID also brings greater “advantages of outsiders”. Low institutional quality means low efficiency and frequent corruption and bribery in exporting countries, which hinders the normal progress of international trade. However, some studies have pointed out that institutional defects have a “lubricating effect”, and bureaucratic corruption can alleviate the obstacles brought by the system to some extent, improve the efficiency of economic operation, and promote the achievement of international trade [43]. At this stage, the “advantage of outsiders” generated by ID is higher than the “disadvantage of outsiders”, and the increase in ID actually promotes the development of VWT. When the ID reaches a turning point, its further increase means that there is greater trade uncertainty between the two countries, and the more unfamiliar business operation mode brings about an increase in adaptation and adjustment costs. Pre and post costs continue to increase, exacerbating the difficulty of international trade development. At this stage, the “disadvantage of outsiders” caused by the ID dominates. Therefore, countries with similar systems are more likely to engage in bilateral trade [21,43]. The VWT volume shows a decreasing trend with the increase in ID, and the absolute value of marginal VWT increases. Hypothesis 2 is validated.
From Model 3, it can be seen that the BRI significantly promoted the import of VW resources at the level of 5%. After the trade exporting countries joined BRI, the VW import trade flow increased by 84.594% ((), which shows that BRI is conducive to the trade parties to break down trade barriers and promote the VWT of grains. Hypothesis 3 is verified.
From Model 4, it can be seen that both the endowment of arable land resources and technological progress have promoted the import trade of VW resources for grains in China. The significance level of 1% in the endowment of arable land resources in exporting countries indicates that when the endowment of arable land resources increases by 1% compared to China, the VWT flow increases by 2.477%. The significance level of technological progress in exporting countries at 1% has been tested, indicating a 1% increase in technological progress compared to China and a 1.033% increase in VWT flow. However, the per capita freshwater resources and agricultural labor endowment have not passed the test. The reason why water resource endowment did not significantly promote the import of VW resources may be due to China’s unreasonable water price mechanism and low agricultural water efficiency. Although the coefficient of labor resource endowment is positive, it is not significant. The reason why it is not carried out according to comparative advantage may be that the deepening of technological progress has enhanced the substitution effect of technology on agricultural labor, and the impact of labor on VWT has decreased. Model 4 illustrates that factor endowment is an important driving factor for VWT in grains, and there is a positive relationship between cultivated land resource endowment and technological progress on VWT. Therefore, we assume H4a and H4d are validated while assuming H4b and H4c are not validated.
From Model 5, it can be seen that the scale of the agricultural industry has a positive promoting effect on VWT at a significance level of 5%. The comparative advantage of the agricultural industry scale has increased by 1%, and VWT has increased by 1.684%. It may be due to the greater driving effect of non-agricultural industries on economic development, resulting in a not synchronous growth rate of the overall economic scale and the development of the agricultural industry sector. Therefore, the overall economic scale has not shown a significant positive impact on VWT. Model 5 illustrates a positive relationship between agricultural industry scale and VWT among economies of scale factors, assuming that H5a is validated and H5b is not.
4.2.2. Regulatory Effect Analysis
Table 3 reports the regulatory effect analysis results of BRI. According to Model 6, the interaction coefficient between ED and BRI is positive (), and it is significant at the level of 1% (p < 0.01), indicating that the inhibitory effect of ED on BRI countries is less than that of non-BRI countries. The initiative negatively adjusts the relationship between ED and VW import trade. Countries along BRI are rich in agricultural resources and are important grains producing areas in the world. Compared with traditional grains import source countries, countries and regions along the BRI have stronger geographical advantages and political mutual trust with China in trade. Complementary advantages and win–win cooperation with countries along BRI are important ways to ensure China’s grains and water security. Therefore, BRI weakened the negative impact of the ED of relevant countries on the VWT import from the perspective of demand preference. Hypothesis 6a is verified.
Table 3.
Analysis results of the adjustment effect of BRI.
In Model 7, the coefficient of the interaction term between the cubic term of ID and BRI is positive (), and it is significant at the level of 5% (p < 0.05), indicating that BRI negatively regulates the inverted “U”-shaped relationship between ID and VW import trade. This may be because BRI has effectively reduced the transaction costs between China and BRI countries, thereby improving trade flows and trade efficiency and promoting the smooth progress of VWT. First, China and BRI countries have carried out various forms, which is conducive to enhancing recognition between the two sides and reducing the transaction costs caused by trade uncertainty. Secondly, the development of communication infrastructure cooperation and multi-form financial cooperation has improved the communication infrastructure of both sides of trade, provided financial support for international trade between countries, made up for the lack of information between the two sides of trade and increased trade exchanges, and alleviated information asymmetry. Finally, the BRI cooperation document signed by China and other countries is conducive to breaking trade barriers, reducing tariff costs and weakening the cost problems caused by trade uncertainty. Therefore, BRI has negatively adjusted the “U”-shaped relationship between ID and grain VWT from the perspective of transaction costs, assuming that h6b is verified.
4.2.3. Trade Diversion and Trade Creation
Linneman (1967) applied the gravity model to the evaluation of preferential trade agreements by setting a dummy variable for preferential trade agreements [37]. Additionally, endogeneity is an important issue to consider when using dummy variables in the gravity equation to estimate the effects of trade agreements. There is a general consensus among scholars on the existence of the endogeneity of trade effects [44] that the establishment of FTAs between countries is not a chance event [28]. Before the policy evaluation, if the endogenous problem caused by the different initial conditions between the treatment and the control groups is not solved, the model estimation results will not only include the trade effect but also be mixed with the “self-selection effect”, resulting in a large bias in the model estimation. This type of study has been criticized by many researchers, which tends to attribute most of the increase in regional trade since the signing of the agreement and ignores the impact of cultural and historical ties on high levels of trade and even the formation of RTAs [45], while the study tends to use cross-sectional data, which in turn leads to biased estimates.
Among the existing studies, instrumental variable estimation, Heckman two-stage estimation, fixed-effects modeling, and matching methods are the main approaches to address the endogeneity problem [46]. Since this study uses panel data, the method of including country-level individual fixed effects in the model is used to address the endogeneity problem.
This study adopts the asymmetric single-country model of 1 (China) x N (major trading countries). In order to evaluate the trade effect of BRI in China’s VW import trade, BRI strategy is regarded as a policy program. Additionally, the trade creation effect and trade diversion effect are decomposed according to the changes of grain trade inside and outside the free trade zone. The expected exponential gravity model is combined with the difference-in-differences model. Model 8 is set as Formula (15):
where denotes the total amount of grains VW imported by China from country in year , is a time trend term to capture trending factors such as global inflation and economic crises to attenuate the impact of external shocks, is a control variable that includes factor endowments and economies of scale related to logarithmic scales, and is the individual country-level fixed effects. represents the change in VW import trade between China and partner countries after the exporting country joins BRI, i.e., the trade creation effect generated by BRI. If the exporting country is a BRI partner country in year , = 1, and vice versa, it takes 0. indicates the change in the VW import trade between China and non-BRI partner countries. If the exporting country is a non-BRI country in year , is set to 1, and in other cases, it takes the value 0. According to the coefficients of and , we can judge the size of trade creation effect and trade diversion effect.
If is significant and positive, it means that BRI has not led to a decline in China’s VW import trade with non-member countries, and the growth of China’s VWT in imported grains mainly comes from the trade creation effect. If is significantly negative, it means that the trade diversion effect is significant, and the growth of China’s VWT in grains is at the expense of the decline of VWT in grains with non-member countries. The trade diversion effect leads to the loss of member countries’ welfare, and whether the welfare of member countries grows or declines depends on the relative sizes of the trade creation effect and the trade diversion effect. Table 4 identifies the sources of impact and welfare effects of BRI on China’s trade in the VW imports of grains under three scenarios, with TC and TD representing the trade creation and trade diversion effects.
Table 4.
Identification method of influence channel and welfare effect of BRI on VWT.
This study uses PPMLHDFE estimation method to regress Model 9. The estimation results are shown in Table 5. The coefficient of is significantly positive, while the coefficient of is insignificant, indicating that BRI has further released the signal that China adheres to the principle of joint consultation and joint construction and pursues win–win cooperation. BRI has a significant trade creation effect in the VW import trade and leads to an increase in welfare. China’s VW resources of grains imported from BRI countries increased by 189.225% ( × 100%).
Table 5.
Growth sources and welfare decomposition of VWT for grains.
In summary, BRI has significant trade creation effects and leads to welfare gains in VW import trade, further ensuring grains and water security in China.
4.3. Endogenous Test
As mentioned above, the BRI has greatly increased China’s virtual water imports. While the two-way fixed effect in the PPMLHDFE model helps address some endogenous issues, other potential issues of this nature are still worth discussing. To reduce bias caused by other potential endogenous problems affecting the conclusions of the research, this study conducts an endogenous test by adding a lag term to the explained variable and performing a survival analysis, as well as using PSM to correct the sample selection bias in the benchmark model. The results are presented in Table 6.
Table 6.
Endogenous test.
First, the lag term of the explained variable is added. The virtual water content of agricultural products imported by China from country may be affected by the import volume in previous periods. Therefore, this study incorporates a lag term into the model to capture the dynamic effect and alleviate the two-way causality. The empirical results are presented in Table 6, column 13. The results show that the coefficient of the lagged term is significantly positive but very small, indicating that the dynamic effect in the model is weak. The coefficient of remains significantly positive, consistent with that of the benchmark model.
Second, survival analysis was used to test reverse causality, i.e., is a country’s accession to the Belt and Road Initiative adversely affected by the virtual water trade of agricultural products? To test whether this precondition for using the multiplicative difference approach holds, this study refers to Beck et al. (2010) and sets up the following risk regression model [47]:
In Equation (16), is the survival time of country in year t during the study period (time trend term), is the amount of virtual water trade in agricultural products imported from country in year , and is the control variable affecting whether other countries j join the BRI. In the regression analysis, it is assumed that the survival time obeys a Weibull distribution, and the accelerated failure time model is used to estimate Equation (16). The estimated results shown in Table 6, column 13 indicate that the coefficient for the variable is not significant. This suggests that a country’s decision to join the BRI is not significantly correlated with the volume of virtual water traded for agricultural products and that there is no reverse causality in the benchmark model.
Third, the PSM method was used to correct the sample selection bias. Because the countries joining the Belt and Road Initiative do not occur simultaneously, this study uses the 17 countries joining the Belt and Road Initiative during the sample period as the treatment group and uses the PSM method to match the treatment group year by year according to the kernel matching method. After re-matching, the p values of the sample mean differences between the treatment and control groups of different variables were not significant at the 10% level, and the treatment and control group samples were balanced. At the same time, the regression results of the new samples based on the PSM method are shown in column 14 of Table 6, and the coefficient of the variable is still statistically significant at the 1% level.
The research conclusions are consistent with the benchmark regression results, further verifying the robustness of the research conclusions.
5. Discussion
This study explores the driving mechanism of China ‘s grain virtual water import trade, with particular attention to the role of the BRI. The research results demonstrate that virtual water trade is based on comparative advantages, which is consistent with the research of Akbostancı et al. (2023), Hirwa et al. (2023), Yin et al. (2024), and others [12,48,49]. However, the research hypothesis of water resource endowment and labor endowment has not been verified, which is mainly due to the low efficiency of agricultural water use and the substitution effect of technological progress on the labor force. The studies by Zhang et al. (2020a) and Zhang et al. (2022b) support this point [50,51]. This provides a clear policy focus for agricultural water-saving technology innovation and irrigation system transformation in China. With the change in industrial structure, the disconnection between the overall economic scale and the growth rate of agricultural industry development has led to a relatively weak connection between virtual water trade and economic scale [52]. Promoting the development of the agricultural industry and enhancing its connection with non-agricultural industries are the main ways to ensure grain security.
From the perspective of distance, this study incorporates ED and ID into the research framework and demonstrates the non-linear relationship between ED, ID, and VWT and the moderating effect of the BRI on the relationship between the ED and ID of VWT. It breaks through the thinking pattern of traditional research, which is limited to geographical distance and resource endowment, reveals the nonlinear constraint mechanism of demand similarity and institutional environment on the flow of resource elements, and provides a new theoretical perspective for global water resource governance. Research from the perspective of trade welfare confirms that the “Belt and Road” initiative has a significant trade creation effect and leads to an increase in China’s trade welfare. This is similar to the research perspective of Cao et al. (2024), which is a further expansion of the research on virtual water trade [53]. This research is of great significance for improving the efficiency of water resource allocation, maintaining grain security, and promoting sustainable development.
In this study, a fixed coefficient is used to measure the virtual water trade of grain. Although its rationality has been verified by Monte Carlo simulation, there are still some theoretical limitations. In the next step, we will attempt to build a dynamic virtual water coefficient library to provide more accurate raw data for grain VWT. Simultaneously, this study incorporated ED and ID into the research framework. In the future, we will further study the specific path of the “Belt and Road” initiative affecting virtual water trade to expand the depth of research, not limited to reducing trade barriers or transaction costs. This is one of the future research directions of this study. Some scholars have introduced the concept of the “virtual water paradox” in the study of virtual water. In the long run, this model is not conducive to the sustainable allocation of global water resources. Integrating China’s provincial virtual water trade into the global value chain framework and further exploring “virtual water paradox” of China and potential inequality are also future research directions of this study.
6. Conclusions
This study employed the evapotranspiration method to calculate the volume of VWT in China’s grain imports from 2005 to 2020. Through a detailed analysis of the flow of virtual water resources between China and its major trading partners, this study incorporates ED and ID into its analytical framework. The driving mechanisms of China’s virtual water import trade are explored using the PPMLHDFE model, and the welfare impact of the Belt and Road Initiative (BRI) is assessed using a difference-in-differences approach.
The key findings are as follows. First, the BRI is positively correlated with VWT in grain imports, whereas ED is negatively correlated. Moreover, there is an inverted “U”-shaped relationship between ID and VWT. Second, factors such as cultivated land endowment, technological advancement, and the scale of agricultural industries significantly promote VWT. However, per capita freshwater resources, agricultural labor endowment, and overall economic size do not align with the comparative advantage theory. Third, BRI moderates both the negative relationship with ED and the inverted “U”-shaped relationship with ID. Finally, the BRI has a notable trade-creation effect on virtual water imports and enhances China’s trade-related welfare. It also plays a crucial role in strengthening grain security. Building on the aforementioned conclusions, this study proposes the following recommendations. Firstly, local governments should steadfastly advance the implementation of comprehensive agricultural water pricing reforms, enhance the efficiency of agricultural water utilization through diverse approaches, and strengthen the cultivation of high-quality talents in the field of agriculture to improve agricultural labor productivity. Second, establish and improve infrastructure and information construction to reduce trade uncertainty caused by information asymmetry. Targeted measures should be implemented to promote “system integration innovation” and enhance the institutional environment. Finally, it is essential to further strengthen cooperation with BRI countries and encourage the diversification of VW import sources.
Author Contributions
Conceptualization, J.W. and H.J.; methodology, J.W. and H.J.; software, J.W.; validation, H.J., L.Y. and M.N.; formal analysis, L.Y.; resources, H.J.; data curation, M.N., H.J. and L.Y.; writing—original draft preparation, J.W.; writing—review and editing, H.J., M.N. and I.S.; visualization, J.W. and M.N.; supervision, H.J. and I.S.; project administration, H.J.; funding acquisition, H.J. All authors have read and agreed to the published version of the manuscript.
Funding
This work was supported by the Social Science Foundation of Shaanxi Province [grant number: 2022D040; 2024R072]; Fundamental Research Funds for the Central Universities [grant number: 2452024311]; Natural Science Foundation of Shaanxi Province [2025JC-YBMS-818]; Foundation of Shaanxi Federation of Social Sciences Associations [2025YB0363]; Humanities and Social Science Fund of Ministry of Education [2021XJC630014].
Data Availability Statement
Data are available from the corresponding author upon reasonable request.
Conflicts of Interest
The authors declare no conflicts of interest.
Abbreviations
The following abbreviations are used in this manuscript:
| VW | Virtual water |
| BRI | The Belt and Road Initiative |
| ED | Economic distance |
| ID | Institutional distance |
| PPMLHDFE | High-dimensional fixed-effect Poisson pseudo maximum likelihood estimation |
| PPML | Poisson pseudo maximum likelihood |
Appendix A. Consideration of Using Fixed Virtual Water Content Coefficient
In this study, a fixed virtual water content coefficient was used for the following reasons: First, data availability. It is difficult to obtain continuous panel data on crop water requirements, yield, and growth cycle coefficients of major grain-exporting countries in the world by variety and year, and relevant research data for many countries are lacking. Therefore, it is difficult to cover the entire sample of more than 30 countries involved in this study from 2005 to 2020. Second, research objectives. This study focuses on the impact of virtual water import trade on China’s food security and its substitution effect on China’s agricultural water use, rather than fine-grained tracking of country-specific technical differences. Third, comparability. The fixed coefficient ensures comparability across years and countries. Simultaneously, Liu et al. (2021), Cao (2023), and others used fixed coefficients for calculations in their studies, which also increases the comparability of the conclusions [54,55].
As agricultural practices and water-use efficiency change over time, this may affect the virtual water content of traded grain. To verify the influence of the fixed virtual water content coefficient on the research conclusion, this study uses the Monte Carlo simulation method, and the specific steps are as follows. First, the logarithmic normal distribution disturbance was applied to the virtual water content coefficient of the four types of crops in the form of exp(rnormal(0,1)). Second, 1000 independent iterations were performed, where the virtual water content coefficient after disturbance was generated in each iteration, and the PPMLHDFE model was used for estimation. Finally, the coefficient value and significance (p value) of each simulation were extracted and recorded. The final results showed that the 95% confidence interval of was [0.612, 1.351], and the p value was smaller than 0.1 in 99.4% of the simulations. The study confirms that although the fixed virtual water coefficient has theoretical limitations, the research conclusions are statistically and economically robust within a certain fluctuation range.
References
- Salehi, M. Global Water Shortage and Potable Water Safety; Today’s Concern and Tomorrow’s Crisis. Environ. Int. 2022, 158, 106936. [Google Scholar] [CrossRef] [PubMed]
- Zhang, L.; Ma, Q.; Zhao, Y.; Chen, H.; Hu, Y.; Ma, H. China’s Strictest Water Policy: Reversing Water Use Trends and Alleviating Water Stress. J. Environ. Manage. 2023, 345, 118867. [Google Scholar] [CrossRef] [PubMed]
- Liu, J.; Hertel, T.W.; Taheripour, F.; Zhu, T.; Ringler, C. Water Scarcity and International Agricultural Trade. In Proceedings of the 2013 Annual Meeting, Washington, DC, USA, 4–6 August 2013. [Google Scholar]
- Wang, H.; Zhang, M.; Cai, Y. Chapter 3—Problems, Challenges, and Strategic Options of Grain Security in China. In Advances in Agronomy; Sparks, D.L., Ed.; Advances in Agronomy; Academic Press: Cambridge, MA, USA, 2009; Volume 103, pp. 101–147. [Google Scholar]
- Zhou, L.; Tong, G. Research on the competitiveness and influencing factors of agricultural products trade between China and the countries along the “Belt and Road”. Alex. Eng. J. 2022, 61, 8919–8931. [Google Scholar] [CrossRef]
- Xia, W.; Chen, X.; Song, C.; Pérez-Carrera, A. Driving Factors of Virtual Water in International Grain Trade: A Study for Belt and Road Countries. Agric. Water Manag. 2022, 262, 107441. [Google Scholar] [CrossRef]
- Liu, A.; Lu, C.; Wang, Z. The roles of cultural and institutional distance in international trade: Evidence from China’s trade with the Belt and Road countries. China Econ. Rev. 2020, 61, 101234. [Google Scholar] [CrossRef]
- Ja, A. ’Virtual Water’: A Long-Term Solution for Water-Short Middle Eastern Economies? In Proceedings of the 1997 British Association Festival of Science, Water and Development Session, Leeds, UK, 9 September 1997. [Google Scholar]
- Wang, Z.; Li, T.; Liang, W.; Fu, B.; Li, J.; Yan, J. Uncovering the Structure and Evolution of Global Virtual Water and Agricultural Land Network. Sustain. Prod. Consum. 2024, 51, 599–611. [Google Scholar] [CrossRef]
- Roson, R.; Sartori, M. Virtual Water Trade in the Mediterranean: Today and Tomorrow. In The Water We Eat: Combining Virtual Water and Water Footprints; Antonelli, M., Greco, F., Eds.; Springer Water; Springer International Publishing: Cham, Switzerland, 2015; pp. 159–174. ISBN 978-3-319-16393-2. [Google Scholar]
- Zhang, W.; Fan, X.; Liu, Y.; Wang, S.; Chen, B. Spillover Risk Analysis of Virtual Water Trade Based on Multi-Regional Input-Output Model -A Case Study. J. Environ. Manage. 2020, 275, 111242. [Google Scholar] [CrossRef]
- Akbostancı, E.; Tunç, G.İ.; Türüt-Aşık, S. Virtual Water Flows of Turkey’s Agricultural Products: A Gravity Approach. J. Clean. Prod. 2023, 420, 138453. [Google Scholar] [CrossRef]
- Chen, R.; Adu, D.T.; Li, W.; Wilson, N.L.W. Virtual Water Trade: Does Bilateral Tariff Matter? Ecol. Econ. 2024, 222, 108216. [Google Scholar] [CrossRef]
- Wei, Z.; Deng, Z.; Dawood, M.; Yu, Y.; Wang, Z.; Huang, K. Reassessing China’s Virtual Water Trade with a Global Value Chain Framework: Participation, Inequality and Multi-Scenario Analysis. Resour. Conserv. Recycl. 2025, 212, 107904. [Google Scholar] [CrossRef]
- Linder, S.B. An Essay on Trade and Transformation. Ph.D. Thesis, Stockholm School of Economics, Stockholm, Sweden, 1961. [Google Scholar]
- Sameera, K.P.H. Does Institutional Distance Matter? A Meta-Analytic Review of the China’s Trade with the Belt & Road. SunText Rev. Econ. Bus. 2023, 4, 183. [Google Scholar]
- Ohashi, H. The Belt and Road Initiative (BRI) in the Context of China’s Opening-up Policy. J. Contemp. East Asia Stud. 2018, 7, 85–103. [Google Scholar] [CrossRef]
- Ball, R.J.H. Linnemann. An Econometric Study of International Trade Flows. Econ. J. 1967, 77, 366–368. [Google Scholar] [CrossRef]
- Kaufmann, D.; Kraay, A.; Mastruzzi, M. The Worldwide Governance Indicators: Methodology and Analytical Issues. Hague J. Rule Law 2011, 3, 220–246. [Google Scholar] [CrossRef]
- Xiong, X. Transaction costs in international trade. Nankai Econ. Stud. 1993, 3, 50–57. [Google Scholar]
- De Groot, H.L.F.; Linders, G.-J.; Rietveld, P.; Subramanian, U. The Institutional Determinants of Bilateral Trade Patterns. Kyklos 2004, 57, 103–123. [Google Scholar] [CrossRef]
- de Mendonça, T.G.; Lirio, V.S.; Braga, M.J.; Silva, O.M. da Institutions and Bilateral Agricultural Trade. Procedia Econ. Finance 2014, 14, 164–172. [Google Scholar] [CrossRef]
- Belloc, M. Institutions and International Trade: A Reconsideration of Comparative Advantage. J. Econ. Surv. 2006, 20, 3–26. [Google Scholar] [CrossRef]
- Goldberg, P.K.; Pavcnik, N. Distributional Effects of Globalization in Developing Countries. J. Econ. Lit. 2007, 45, 39–82. [Google Scholar] [CrossRef]
- Fugazza, M.; Nicita, A. The Direct and Relative Effects of Preferential Market Access. J. Int. Econ. 2013, 89, 357–368. [Google Scholar] [CrossRef]
- Cui, L.; Song, M. Economic evaluation of the Belt and Road Initiative from an unimpeded trade perspective. Int. J. Logist. Res. Appl. 2019, 22, 25–46. [Google Scholar] [CrossRef]
- Trefler, D. International Factor Price Differences: Leontief Was Right! J. Polit. Econ. 1993, 101, 961–987. [Google Scholar] [CrossRef]
- Krugman, P. The Move toward Free Trade Zones. Econom. Rev. 1991, 76, 5. [Google Scholar]
- Tang, H. China’s Grain Self-sufficiency Strategy in the New Situation. Issues Agric. 2014, 35, 4–10+110. [Google Scholar]
- Ling, L.H.M. Squaring the Circle: China’s “Belt and Road Initiative” (BRI) and the Ancient Silk Roads; Chong, A., Pham, Q.M., Eds.; Springer Nature: Singapore, 2020; pp. 23–40. [Google Scholar]
- Du, Y.; Liu, Y.; Hossain, M.A.; Chen, S. The Decoupling Relationship between China’s Economic Growth and Carbon Emissions from the Perspective of Industrial Structure. Chin. J. Popul. Resour. Environ. 2022, 20, 49–58. [Google Scholar] [CrossRef]
- Sun, C.; Wang, Z. Driving factors for virtual water trade of agricultural products between China and countries along “Belt and Road”. J. Econ. Water Resour. 2020, 38, 1–7+28+85. [Google Scholar]
- Wang, X.; Hu, J. Research on the international trade of China’s grain virtual water—Based on the data from 2001 to 2015. Shandong Soc. Sci. 2018, 2, 117–122. [Google Scholar]
- Zhong, Q.; Pan, J.; Lin, Z.; Li, Y.; Mo, X.; He, P.; Cao, X.; Liang, S. Structural Characteristics of Global Virtual Water Network Driven by Food Consumption in the Belt and Road Initiative Region. Resour. Conserv. Recycl. 2025, 215, 108128. [Google Scholar] [CrossRef]
- Hou, S.; Wang, T.; Qiao, D.; Xu, D.J.; Wang, A.; Feng, X.; Khan, W.A.; Ruan, J. Temporal-Spatial Fuzzy Deep Neural Network for the Grazing Behavior Recognition of Herded Sheep in Triaxial Accelerometer Cyber-Physical Systems. IEEE Trans. Fuzzy Syst. 2024, 33, 338–349. [Google Scholar] [CrossRef]
- Su, H.; Foster, T.; Hogeboom, R.J.; Luna-Gonzalez, D.V.; Mialyk, O.; Willaarts, B.; Wang, Y.; Krol, M.S. Nutrient Production, Water Consumption, and Stresses of Large-Scale versus Small-Scale Agriculture: A Global Comparative Analysis Based on a Gridded Crop Model. Glob. Food Secur. 2025, 45, 100844. [Google Scholar] [CrossRef]
- Leibenstein, H.; Tinbergen, J. Shaping the World Economy: Suggestions for an International Economic Policy. Econ. J. 1966, 76, 92. [Google Scholar] [CrossRef]
- Poyhonen, P. A Tentative Model for the Volume of Trade between Countries. Welltwirtschaftliches Arch. 1963, 90, 93–100. [Google Scholar]
- Silva, J.M.C.S.; Tenreyro, S. The Log of Gravity. Rev. Econ. Stat. 2006, 88, 641–658. [Google Scholar] [CrossRef]
- Sun, L. Estimation of Gravity Model Presenting Zero Trade Flows. J. Quant. Technol. Econ. 2011, 28, 152–160. [Google Scholar]
- Correia, S.; Guimaraes, P.; Zylkin, T. PPMLHDFE: Fast Poisson Estimation with High-Dimensional Fixed Effects. arXiv 2019, arXiv:1903.01690. [Google Scholar]
- Yotov, Y.V.; Piermartini, R.; Monteiro, J.-A.; Larch, M. An Advanced Guide to Trade Policy Analysis: The Structural Gravity Model; WTO: Geneva, Switzerland, 2016; ISBN 978-92-870-4368-9. [Google Scholar]
- Yang, S.; Martinez-Zarzoso, I. A Panel Data Analysis of Trade Creation and Trade Diversion Effects: The Case of ASEAN–China Free Trade Area. China Econ. Rev. 2014, 29, 138–151. [Google Scholar] [CrossRef]
- Baier, S.L.; Bergstrand, J.H. Do Free Trade Agreements Actually Increase Members’ International Trade? J. Int. Econ. 2007, 71, 72–95. [Google Scholar] [CrossRef]
- Magee, C.S.P. New Measures of Trade Creation and Trade Diversion. J. Int. Econ. 2008, 75, 349–362. [Google Scholar] [CrossRef]
- Gauto, V.F. An Econometric Analysis of Trade Creation and Trade Diversion in Mercosur: The Case of Paraguay. In Proceedings of the 2012 Conference, Foz do Iguacu, Brazil, 18–24 August 2012. [Google Scholar]
- Beck, T.; Levine, R.; Levkov, A. Big Bad Banks? The Winners and Losers from Bank Deregulation in the United States. J. Finance 2010, 65, 1637–1667. [Google Scholar] [CrossRef]
- Hirwa, H.; Li, F.; Measho, S.; Chen, G.; Muhirwa, F.; Zhang, Q.; Kayiranga, A.; Qiao, Y.; Leng, P.; Tian, C.; et al. Understanding Grain Virtual Water Flux Dynamics and Drivers from a Socio-Ecohydrological Perspective: A Case Study of Landlocked Developing Countries of Africa. J. Clean. Prod. 2023, 413, 137555. [Google Scholar] [CrossRef]
- Yin, X.; Yang, L.; Gao, T.; Liu, Y.; Gao, Z.; Tan, Y.; Wang, J. Non-Inferior Solutions for Virtual Water Strategies: Model Development and a Case Study in Northern China. J. Hydrol. 2024, 634, 131124. [Google Scholar] [CrossRef]
- Zhang, Y.; Diao, X. The Changing Role of Agriculture with Economic Structural Change—The Case of China. China Econ. Rev. 2020, 62, 101504. [Google Scholar] [CrossRef]
- Zhang, F.; Xiao, Y.; Gao, L.; Ma, D.; Su, R.; Yang, Q. How Agricultural Water Use Efficiency Varies in China—A Spatial-Temporal Analysis Considering Unexpected Outputs. Agric. Water Manag. 2022, 260, 107297. [Google Scholar] [CrossRef]
- Yin, C.; Su, X.; Wang, W.; Cui, Y. Structural Imbalance and Integrated Economic Development of RCEP Countries on Perspective of Industrial Network. Technol. Forecast. Soc. Change 2024, 209, 123728. [Google Scholar] [CrossRef]
- Cao, Y.; She, Y.; Wang, Q.; Lin, J.; Chen, W.; Qu, S.; Liu, Z. Redefining Virtual Water Allocation in China Based on Economic Welfare Gains from Environmental Externalities. J. Clean. Prod. 2024, 434, 140243. [Google Scholar] [CrossRef]
- Liu, H.; Sheng, G.; Yang, J.; Wu, W.; Sun, J. Quantitative assessment of the impact of China’s soybean import tariff adjustment on global water and farmland. J. Nat. Resour. 2021, 36, 1535–1544. [Google Scholar] [CrossRef]
- Cao, C. Regional difference and distribution dynamic evolution of virtual cultivated land resources flow in China’s grain trade. Sci. Technol. Rev. 2023, 41, 32–43. [Google Scholar]
Disclaimer/Publisher’s Note: The statements, opinions and data contained in all publications are solely those of the individual author(s) and contributor(s) and not of MDPI and/or the editor(s). MDPI and/or the editor(s) disclaim responsibility for any injury to people or property resulting from any ideas, methods, instructions or products referred to in the content. |
© 2025 by the authors. Licensee MDPI, Basel, Switzerland. This article is an open access article distributed under the terms and conditions of the Creative Commons Attribution (CC BY) license (https://creativecommons.org/licenses/by/4.0/).