Abstract
With the rapid advances of global climate change and urbanization, urban flooding is causing greater losses. Existing urban flood control and drainage engineering design standards are often applied to single projects. This paper proposes a set of urban flood model-driven optimization of flood control and drainage engineering solutions. Applied to Shenzhen’s Shawan interception project, the preferred option demonstrates significant improvements, such as the following: a 25% reduction ratio of the maximum designed water depth at key points of the Shawan River main stream, a 0.26% reduction in the maximum submerged area of the urban surface, a 3.27% reduction in the full pipe rate of drainage pipe, and a 10.81% reduction in the overflow rate of inspection wells. The comprehensive flood control and drainage benefits are the best, and they achieve the solution of problems within the basin. Aiming at the shortage of comprehensive consideration of project scale, combination mode, and control scheme in urban flood control planning and design, this simulation scheme proposes a set of detailed design technologies of urban flood control engineering based on a flood numerical model. The analysis results show that the ideas proposed in this paper can provide a reference for the design of urban flood control and drainage engineering.
1. Introduction
Urban flooding has emerged as a critical challenge exacerbated by global climate change and rapid urbanization, particularly in densely populated coastal cities like Shenzhen, China. The increasing frequency and intensity of extreme weather events have heightened the vulnerability of urban areas to flood risks, resulting in significant economic losses and threats to public safety [1,2]. Traditional flood control measures often change the natural state of flood through the combination of structural and non-structural methods. Reduce flood disasters and improve urban flood control and drainage capacity [3,4,5].
With the acceleration of urbanization and the gradual improvement of flood control construction standards, various flood control projects have become an important part of regional flood control work. In order to solve the problem of urban flooding, scholars have carried out extensive and in-depth research. Developed countries’ research on resisting urban flooding started earlier and has developed part of the experience. Low Impact Development (LID) was proposed by the United States, and the Australian government proposed the Water Sensitive Urban Design (WSUD) in 2004 [6,7,8,9]. The WSUD and the Sustainable Drainage System (SUDS) developed in the United Kingdom are both reliable engineering design concepts to solve the problem of urban flooding [10,11]. Many studies have been performed by previous researchers on urban flood management as the main tool, using different data and methods achieved specific results. Park et al. (2024) used the Gangnam area of Seoul as an example, and The Deep Tunnel Sewer System (DTSS) was studied as a robust gray infrastructure solution for enhancing urban flood resilience, revealing how highly engineered solutions can enhance cities’ flood defenses, but they may still face challenges in extreme rainstorms with frequencies of 80 years or more [12]. Sörensen et al. (2016) proposed a new flood management system based on an analysis of urban flood resilience: a system of active civil society, effective urban water governance, and multiple stakeholders working together to develop multi-purpose solutions [13]. He et al. (2024) analyzed the causes of Urban underground space (UUS) flood and the characteristics of above-ground flood, and introduced three flood defense lines in engineering practice, including the facade design of the entrance, levee, and drainage system. A special focus is given to five research hotspots aimed at enhancing the UUS flood protection capability [14]. Estelaji et al. (2024) identified urban assets based on leveling criteria, spatial mapping using GIS technology, flood management in Hamadan city using HEC-RAS, and LISREL modeling [15]. Gebremedhin et al. (2020), using OpenStreetMap as a data platform, analyzed the level of improvement obtained through the application of participatory modeling and mapping methods in the most vulnerable areas of Dar es Salaam, Tanzania, as an example, which demonstrates its value in hydrodynamic model development and its potential for application in data-scarce areas prone to urban flooding [16]. Afriani (2021) utilized the hydrological data from 2009 to 2015 to obtain a more detailed description of the hydrological conditions, so as to be able to manage or control the floods in the Bandar Nampung urban area best [17].
For urban flood control and drainage problems, China has also put forward many management programs, usually in accordance with the principle of “upper storage, middle diversion, lower drainage, appropriate stagnation”, the overall framework of urban flood control and drainage. Commonly used measures include the construction of flood control reservoirs [18,19], flooding (drainage) river improvement or new construction [20,21], drainage system capacity enhancement [20], the construction of sponge cities [22,23,24], the use of urban rivers and lakes to store flood water [25], the construction of drainage pumping stations [26,27], and other measures. In addition, the Ministry of Housing and Urban-Rural Development (MOHURD) issued the Technical Guidelines for Sponge City Construction—Low Impact Development Rainwater System Construction (Trial) in 2014, and three ministries and commissions, namely the Ministry of Housing and Construction (MOHURD), the Ministry of Finance (MOF), and the Ministry of Water Resources (MWR), jointly initiated the first batch of sponge city construction pilot projects across the country, to construct a new type of urban water circulation system through a combination of natural and manmade measures, and to carry out sponge city The common measures include green roofs, rain gardens, and permeable paving. Foreign research and practice of urban stormwater management started earlier, especially in the United States, the United Kingdom, and Australia. It is mainly developed countries that have formed a more complete rainwater management system: LID, WSUD, SUDS, and other theories as a technical support. China has more than 470 cities to carry out the construction of sponge cities, and the construction of 30 pilot cities to achieve the expected goals is gradually improving China’s urban flooding problems [28,29,30].
At present, the design of urban flood control and drainage projects is mainly based on relevant standards and specifications or empirical formulas to carry out flood control and drainage scheme design, and it is difficult to give the preferred scheme for the design scale, combination and regulation of flood control and drainage projects [31]. However, these methods are often only applicable to a single project, for the existence of more interconnected multiple flood control and drainage projects or the need to basin as a unit of systematic analysis of the situation, it is difficult to give the design scale of flood control and drainage projects, the combination of engineering, scheduling programs, scientific, fine program. In recent years, with the quality and accuracy of the basic geography of the city, water conservancy business data and information continue to improve, and the construction of fine numerical models of urban flooding is becoming more mature. In view of this, this paper focuses on the study of urban flood model-driven optimization of flood control and drainage engineering solutions, for urban flood control and drainage engineering scheme design to provide decision-making support.
2. Materials and Methods
2.1. Study Area
The target watershed was the Shawan River Basin in Shenzhen (Figure 1). Shenzhen City is located in the southeast coastal area of China and suffers from frequent heavy rainfall and flooding. Among them, the Shenzhen Reservoir is located in the lower reaches of the Shawan River, which carries 70% of Hong Kong’s and 43% of Shenzhen’s water supply. During the flood season, pollutants from the surface and pipeline network in the Shawan River Basin enter the river with rainfall, and the rainwater then enters the Shenzhen Reservoir, resulting in water source pollution, which in turn affects the safety of water supply to Hong Kong and Shenzhen. In addition, with the completion of the Dongshen Water Supply Phase IV Project, the Dongshen Water Supply Channal-Shawan River is no longer the channel through which the Shenzhen Reservoir draws water from the Dongjiang River, and the function of the river has been changed; however, there is still no corresponding adjustment to the secondary protection zone of the Shenzhen Reservoir, and the area has not yet been scientifically planned at present.
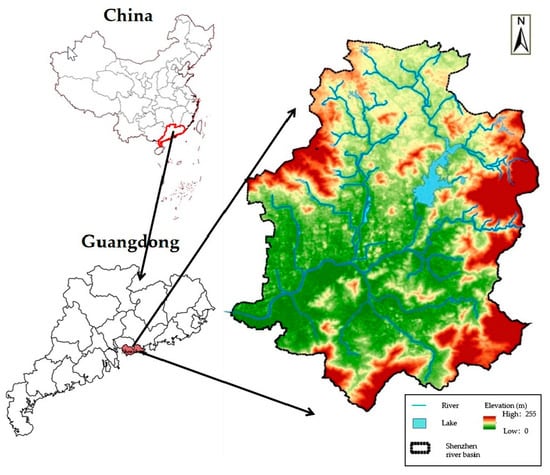
Figure 1.
Map of the Shenzhen River basin.
Shawan River is located in the upper reaches of Shenzhen Reservoir, a first-class tributary of the Shenzhen River, the river length of 10.5 km, the river drop of 4.6‰, flowing through the Longgang District, Shenzhen City, the streets of the South Bay and Pinghu Street, and finally through the Shawan Gate into the Shenzhen Reservoir. Shawan River is located in the southern low-latitude coastal area, and typhoons frequently land in Guangdong. From April to October, frontal rain, typhoon rain, heavy rainfall, flooding, waterlogging, and tidal disasters often occur, and with the rapid development of the economy in the accelerated process of urbanization and construction, the two sides of the river are frequently subject to flood inundation.
2.2. Method
This paper analyzes the current problems of flood control and drainage from three aspects: flood control, waterlogging control, and pipe network drainage. It combines the current problems and relevant standards, according to the city’s socioeconomic development and related planning, categorizes the construction goals; sorts out urban flood control and drainage project classification and construction standards, combined with the actual situation of the project area to determine the preliminary design scheme; uses the flood numerical model to build the scheme of different types, different sizes, different layouts, and other combinations of urban flood control and drainage project flood analysis models, simulations, and analyses of the scheme after the implementation of a variety of working conditions flood control and drainage indicators; and finally, evaluates the flood control and drainage benefits of each scheme from three aspects: flood control benefits, drainage benefits, and waterlogging benefits, and provides the recommended scheme under the perspective of flood control and drainage benefits. Based on the flood numerical model of urban flood control and the drainage engineering scheme, the fine design technology research includes analysis of current problems, construction goal determination, scheme preliminary analysis, scheme deepening research, flood control and drainage benefit assessment, and other aspects of the technical route shown in Figure 2.

Figure 2.
Technology route.
- Analysis of current problems. From the urban flood control, waterlogging control, and pipe network drainage aspects, sorting out the existing problems of urban flood control and drainage.
- Construction goal determination. For the above three types of urban flood control and drainage problems, combined with the relevant standards [32,33,34], according to the microeconomics development of the study city and related planning, from the urban flood control, waterlogging control, pipe network drainage aspects of the development of the corresponding construction standards, categorized to determine the construction objectives.
- Preliminary design of the scheme. Flood control and drainage projects include the upper storage, middle diversion, lower drainage, internal regulation, and other projects. The upper storage (interception) project mainly relies on the construction of intercepting rivers and flood control reservoirs to realize the capacity of intercepting; the middle diversion project relies on the new construction and reconstruction of urban drainage rivers, drainage pipe networks and drainage pumping stations to realize the enhancement of the drainage capacity of rivers and pipe networks; the lower drainage project increases the drainage capacity through the construction of new or renovation of the flooding rivers and other channels; and the internal regulation project mainly relies on the rational urban rainwater management through stormwater pipelines, river-lake-pond systems, and sponge city initiatives. According to the construction objectives, combined with the current conditions of the study object, the flood control and drainage measures are given (one or more combinations), and the construction standards of the flood control and drainage projects are determined. The specific measures and project scale of the above urban flood control and drainage projects are shown in Table 1
 Table 1. Classification of urban flood control and drainage engineering and comparison of construction standards.
 - Deepening research on the scheme. Make full use of urban flood numerical models to further deepen the research based on the preliminary design scheme. Urban flood models are typically composed of surface rainfall-runoff models, two-dimensional surface models, one-dimensional river models, one-dimensional pipe network models, and water project operation models. For the preliminary design of the scheme to determine the different flood control and drainage engineering schemes to build the corresponding flood analysis model, a common urban flood control and drainage engineering flood analysis model construction method is shown in Table 2. We constructed different design scenarios of the scheme (engineering design scale (flood control standard/drainage standard/design capacity/design flow/design level, etc.)/engineering combination (series/parallel/tandem-parallel, etc.)/engineering regulation scheme (control of leakage regulation/split-flood regulation/peak-shaving regulation, etc.)), and the flood analysis model was used to perform calculations and analyses for different design scenarios of the scheme, simulating flood control and drainage information after project implementation (surface pounding/river flooding/pipe network drainage, etc.). Based on the construction objectives (urban flood control/waterlogging control/pipe network drainage), the calculation results of each scenario are compared, and the recommended design scenario for the preliminary design scheme is provided.
 Table 2. List of flood analysis model construction schemes for urban flood control and drainage projects.
 - Assessment of flood prevention and drainage benefits. After the scheme deepening study gives the recommended design conditions of each preliminary design scheme, the recommended design scenarios of each scheme are further assessed for their flood control and drainage benefits, including flood control benefits, waterlogging benefits, and drainage benefits in three aspects. (1) The reduction rate of the designed water depth at the key sections of the river is adopted as the flood control benefit assessment index, which refers to the proportion of the reduction in water depth at the key sections of the river under the design standard conditions to the original designed water depth. (2) The reduction rate of surface inundation area is adopted as the assessment index for flood drainage benefits, which refers to the proportion of the reduction in surface area (water depth ≥5 cm) to the original inundation area (water depth ≥ 5 cm). (3) The full pipe reduction rate of the pipeline network and the overflow reduction rate of inspection wells are adopted as the drainage benefit assessment indicators. The full pipe reduction rate of the pipeline network refers to the proportion of decrease in the designed full pipe rate compared with the current full pipe rate, and the overflow reduction rate of inspection wells refers to the proportion of decrease in the designed overflow rate of inspection Wells compared with the current overflow rate of inspection wells. The weights of the full pipe rate and the overflow rate are calculated in a 1:1 ratio. Finally, combined with the actual situation, the index weights of flood control benefit, drainage benefit and drainage benefit (a + b + c = 1) are given, the comprehensive assessment value is calculated, and the optimal scheme of flood control and drainage benefit is given and the flood control and drainage efficiency assessment indexes are shown in Table 3.
 Table 3. Evaluation index of flood control and drainage benefit.
3. Data Use
3.1. Data Collection
We collected basic geographic information data, drainage facility data, structure and project scheduling information, and hydrometeorological information in the study area (Figure 3).
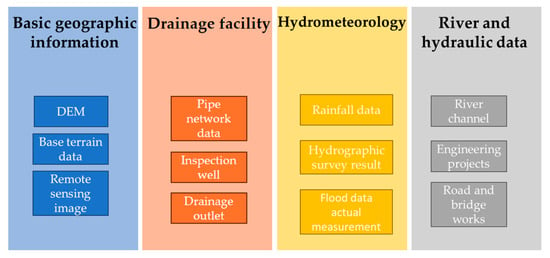
Figure 3.
Data collection.
3.2. Uncertainty and Error Analysis
Uncertainty and error analysis are crucial components of any flood modeling study. In this research, uncertainties primarily arise from the following sources:
Data Uncertainty: The accuracy of the flood model is highly dependent on the quality of input data, including rainfall data, topography, and drainage system parameters. To minimize data uncertainty, we used high-resolution digital elevation models (DEMs) and reliable rainfall data from local meteorological stations. Additionally, we conducted sensitivity analyses to assess the impact of data variability on model outputs.
Model Uncertainty: The flood numerical model (DHM Urban) used in this study has inherent limitations due to its assumptions and simplifications. To solve the uncertainty of the model, it should be compared with the measured data corresponding to the model results or the data in the relevant government report planning.
4. Flood Numerical Model
DHM Urban is a distributed hydrodynamic model for urban rainstorm and flood risk assessment, which is mainly used to analyze and predict flood risk in urban areas. It can better adapt to the availability of data and improve the capability of the distributed hydrodynamic model for urban flood risk assessment. This model is a distributed hydrodynamic model proposed by Zhang et al. [35] for urban rainstorm flood assessment in order to solve the difficulty of the low availability of complete sewer data in the actual urban rainstorm flood risk assessment.
4.1. Model Construction Content
The flood analysis model of the Shawan Interception Scheme includes water project operation models and one-dimensional river models (Figure 4). Among them, the one-dimensional river modeling includes Shenzhen Reservoir, Liantang River, Shawan River, Shenzhen Reservoir Flood Discharge River, Jiankeng River, Lilang River, and other rivers, and the water works include Shenzhen Reservoir, Zhengkeng Reservoir, Henglikou Reservoir, Xianhu Reservoir, Huangniu Lake Reservoir, and Shawan Gate.
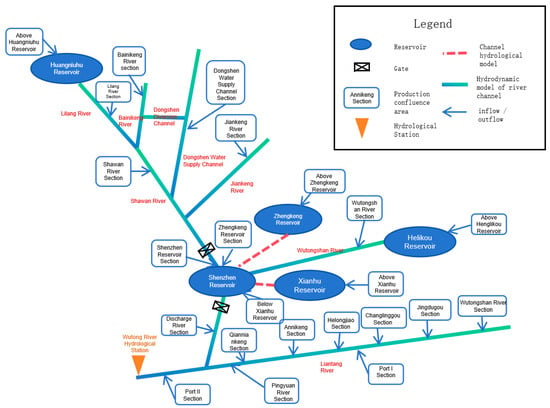
Figure 4.
Shawan Interception Scheme flood analysis model structure.
4.2. Boundary Condition
4.2.1. Upper Boundary Condition
The area of 60.5 km2 above the Shenzhen reservoir is covered by 24 h of rainfall, which occurs once in 50 years.
4.2.2. Inner Boundary Condition
According to the Plan of Shenzhen Reservoir, the initial water level of Shenzhen Reservoir is 27.786 m. According to the current operation of Shawan Gate, when the water level in front of Shawan Gate reaches 29.31 m, Shawan Gate will be opened and Shawan River will discharge flood to Shenzhen Reservoir.
4.2.3. Lower Boundary Condition
The lower boundary is the discharge process of the Spillway Gate of Shenzhen Reservoir. According to the Plan of Shenzhen Reservoir, when the water level of Shenzhen Reservoir does not reach the limit water level of 28.186 m, the discharge flow shall be controlled below 50 m3/s. When the reservoir water level is higher than 28.186 m and lower than the 100-year flood level of 29.416 m, the spillway controls discharge of 270 m3/s. When the flood is large, the water level of the reservoir is higher than 29.416 m, and the gate is fully opened to ensure the safety of the dam.
4.3. Model Rationality
To address model uncertainty, we combined the results of “Shenzhen Flood and Tide Protection Planning Revision and River Improvement Planning” (2014–2020) (hereinafter referred to as “Planning”) to analyze the reasonableness of the flood analysis model of the Shawan Interception Scheme, and the calculation results and the results of the “Planning” against the information shown in Table 4, and the relative error of the flood peak flow is not more than 0.23%. The relative error of the flood peak flow was found to be within acceptable limits, indicating the model’s reliability.

Table 4.
Comparison table between the calculation results of the river channel model and planning results under current working conditions.
5. Application and Results
5.1. Analysis of Current Status Issues
5.1.1. Current Flood Protection Capacity
According to the relevant Plan of Shenzhen, the flood control standard for the main stream of the Shawan River is set at a 100-year return period, while the standards for its tributaries—Lilang River, Dongshen Channel, Jianzhu River, and Bainikeng River—are set at a 50-year return period. Based on flood calculations, the design peak flow for a 100-year flood event at the Shawan Gate is determined to be 385.86 m3/s. As the primary tributaries of the Shawan River, the design peak flows at the confluences of Lilang River, Dongshen Channel, Jianzhu River, and Bainikeng River are 127.72 m3/s, 33.87 m3/s, 122.49 m3/s, and 58.39 m3/s, respectively.
5.1.2. Current Drainage Capacity
According to the relevant Plan of Shenzhen, with the overflow of inspection wells serving as the evaluation criterion, the current drainage capacity of the sewer system in the Shawan River Basin is presented in Table 5.

Table 5.
Evaluation of the drainage capacity of the current drainage network in the Shawan River Basin.
5.2. Construction Objective Determination
For the current situation of flood control and drainage in the Shawan River, the objective is defined as enhancing the flood control and waterlogging prevention capacity of the Shawan River Basin through interception projects. This will be achieved by constructing decentralized stormwater storage lakes within the basin to regulate and attenuate peak flows, and by utilizing an interception tunnel system to increase discharge capacity. Upon project implementation, the goal is to achieve zero impact on the flood control and waterlogging prevention of downstream river channels.
This study is a comprehensive consideration of the Shawan interception project construction objective: when the Shawan River encounters a 50-year return period flood, the water level in front of the Shawan Gate shall not exceed 29.31 m.
5.3. Preliminary Scheme Analysis
The Shenzhen Reservoir’s starting water level is 27.786 m, the design level is 29.416 m, and the Shenzhen Reservoir encountered a 100-year flood maximum discharge of 270 m3/s. With the implementation of the interceptor discharge project, the Shawan River Basin flood water does not enter the Shenzhen Reservoir due to the interception of drainage into the reservoir after the reduction in the flood, according to the results of the flood control algorithm, the Shenzhen Reservoir encountered a flood with a maximum of one in 100 years of flood discharge adjusted to 150 m3/s. For ensure that the implementation of the Shawan interception project does not increase the downstream flood control pressure in Shenzhen Reservoir, determine the maximum flow rate of the new Shawan discharge tunnel (flood discharge from the Shawan River Basin to the downstream of Shenzhen Reservoir flood discharge tunnel) is 270 m3/s − 150 m3/s = 120 m3/s.
Based on the results of the assessment of the current flood control and drainage capacity of the Shawan River Basin, combined with reference to the relevant domestic engineering examples, the study initially designed four sets of engineering schemes for the deficiencies in the upstream drainage capacity of the Shawan River as well as for the need to realize zero impact on the downstream Shenzhen Reservoir:
(1) From the perspective of the internal storage scheme: Construct a new underground reservoir and flood discharge tunnel bypassing the Shenzhen Reservoir, with the regulation mode being “First diversion, then storage”. Upstream reservoirs first play a role in retention, and downstream of the new tunnel, to share part of the flood pressure.
(2) From the perspective of the lower drainage scheme: Build a new tunnel east discharge into the sea before Shenzhen Reservoir, replacing the original Shenzhen Reservoir discharge. Part of the flood water will be diverted to the sea tunnel, and the original tunnel to complete the task of flood discharge, effectively enhancing the means of downstream drainage.
(3) From the perspective of the lower drainage and middle diversion scheme: Divide part of the former Shenzhen Reservoir to be placed in the reservoir.
(4) From the perspective of internal storage and lower drainage scheme: Construct four new regulating reservoirs to achieve peak reduction through internal storage, with the remaining flood volume discharged through both newly built tunnels and existing tunnels. The locations of the reservoirs and their series-parallel connections significantly influence the effectiveness of flood peak reduction.
Through the above perspectives, four sets of preliminary schemes are proposed in Table 6.

Table 6.
Preliminary scheme of truncation setting.
For the four preliminary schemes presented in the previous section, the regulation approach of each scheme is investigated with the help of a refined urban flooding numerical modeling simulation scheme.
5.3.1. Flood Analysis Model Construction
Based on the current model of flood control and drainage in the Shawan River, according to the four preliminary design schemes proposed in the previous section, further construction of each option of the Shawan interception of flood analysis model details could be found in Supplementary Materials, the model update content as shown in Figure 5.
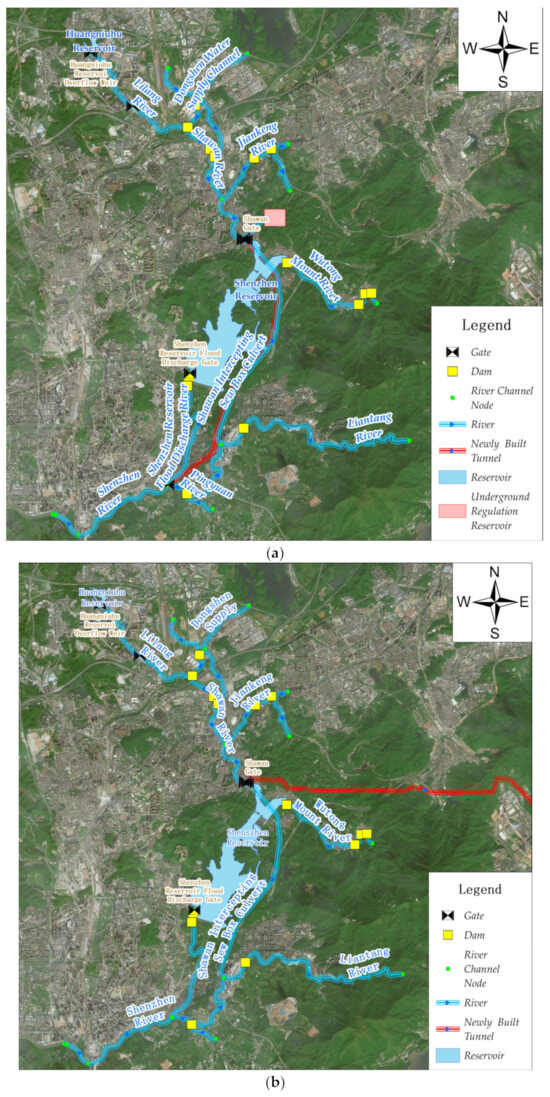
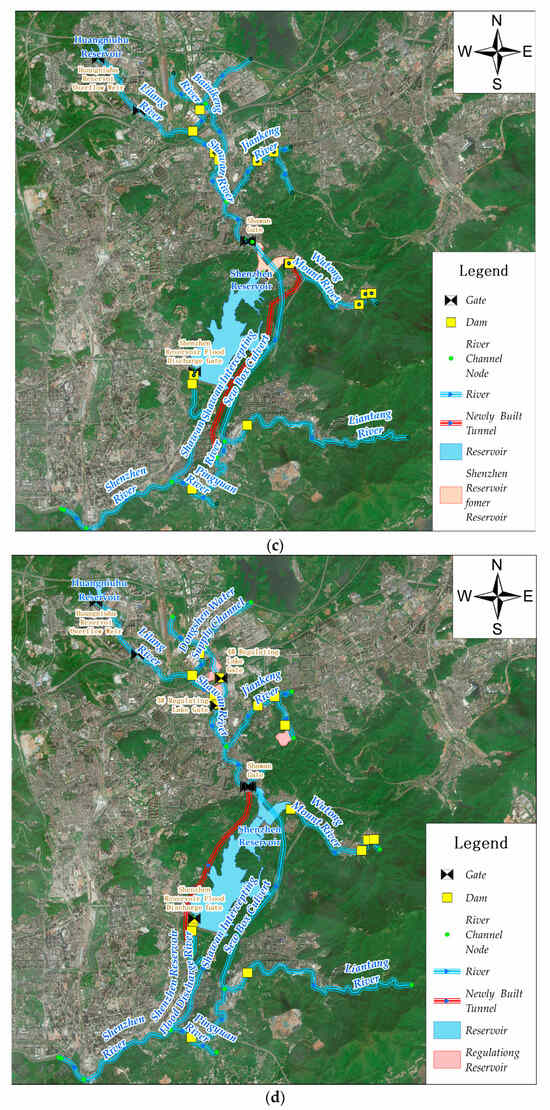
Figure 5.
Diagram of the flood analysis model of Shawan Interception Schemes. (a) Diagram of the flood analysis model for Scheme I. (b) Diagram of the flood analysis model for Scheme II. (c) Diagram of the flood analysis model for Scheme III. (d) Diagram of the flood analysis model for Scheme IV.
5.3.2. Shawan Interception Scheme I Study
(1) Calculation scheme to determine. Ensure that the current discharge gate control flow for 25 m3/s, the new discharge gate control flow for 120 m3/s conditions, respectively, to set up an underground storage reservoir inlet overflow weir elevation of 25 m (Scenario 1), 25.5 m (Scenario 2), 26 m (Scenario 3), 26.5 m (Scenario 4), 27 m (Scenario 5) for five different scenarios.
(2) Analysis of calculation results. Using the flood analysis model of Shawan Interception Scheme I, the above five scenarios are calculated, and the statistical information of the calculation results of each scheme is shown in Supplementary Materials.
To ensure that the Shawan River Basin suffered a 50-year flood event, the water level in front of the Shawan Gate does not exceed 29.31 m. Considering that the model calculates the river channel from the dry bed, the comprehensive analysis recommends Scenario 2 as the preferred scenario of the Shawan Interception Scheme I. Scenario 2’s discharge tunnel drainage process, the flow hydrograph of underground storage reservoir, and the Shenzhen Reservoir results are shown in Figure 6.
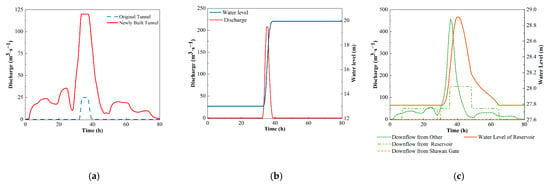
Figure 6.
Scheme I. Scenario 2 Result. (a) Discharge tunnel drainage process line; (b) Flow hydrograph of underground storage reservoir; (c) Flow hydrograph of Shenzhen Reservoir.
5.3.3. Shawan Interception Scheme II Study
(1) Calculation scheme determination. Maintain the original discharge gate maximum discharge of 25 m3/s, use the Shawan Gate and Shenzhen Reservoir to maintain the status quo regulation, set the maximum discharge of different newly built discharge gate, respectively, 270 m3/s (Scenario 1), 280 m3/s (Scenario 2), 290 m3/s (Scenario 3), 300 m3/s (Scenario 4), 305 m3/s Scenario 5), 310 m3/s (Scenario 6), 315 m3/s (Scenario 7), and 320 m3/s (Scenario 8).
(2) Analysis of calculation results. Using the flood analysis model of Shawan Interception Scheme II, the above eight scenarios are calculated, and the statistical information of the calculation results of each scheme is shown in the Supplementary Materials.
To ensure that the Shawan River Basin does not suffer a 50-year flood event, the water level in front of the Shawan Gate does not exceed 29.31 m. Considering that the model calculates the river channel from the dry bed, the comprehensive analysis recommends Scenario 5 as the preferred scenario of the Shawan Interception Scheme II. Scenario 5’s discharge tunnel drainage process and the flow hydrograph of the Shenzhen Reservoir results are shown in Figure 7.
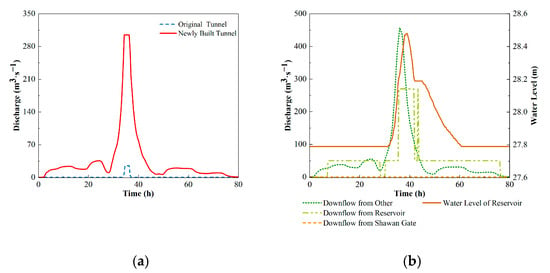
Figure 7.
Scheme II. Scenario 5 results. (a) Discharge tunnel drainage process line; (b) Flow hydrograph of Shenzhen Reservoir.
5.3.4. Shawan Interception Scheme III Study
(1) Calculation scheme determination. The new discharge tunnel proposed in Scheme III is calculated under different flood diversion conditions. The model by changing the buried depth of the new discharge tunnel and entrance gate parameters, respectively, to realize the Shenzhen Reservoir front reservoir began to share the flood when the reservoir water level of 20 m to 29 m, the new discharge tunnel to achieve the maximum discharge peak of 120 m3/s.
(2) Analysis of calculation results. After several trial calculations of the model, when the water level of the former reservoir is 21.216 m, it is the best scenario to start flood diversion. Shawan River Basin suffered a 50-year flood, the front reservoir level of 29.416 m, Shawan River flood for the main reservoir into the Shenzhen Reservoir. Shenzhen Reservoir front reservoir water level of 21.216 m when the start of flood diversion, 26.4 m to reach the maximum discharge flow of 120 m3/s, make full use of the front reservoir 26.4 m above the flood control peak dissipation of the reservoir capacity, about 1.2 million m3. At this time, flow hydrograph of Shenzhen Reservoir former reservoir and in Shenzhen Reservoir main part shown in Figure 8.
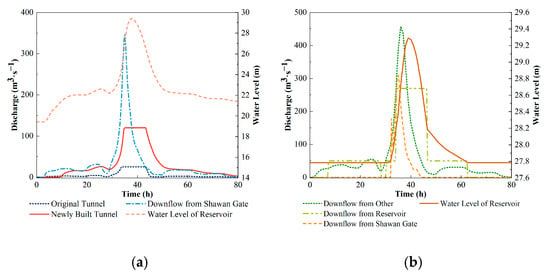
Figure 8.
Scheme III Result. (a) Flow hydrograph of Shenzhen Reservoir former reservoir; (b) Flow hydrograph of Shenzhen Reservoir main part.
5.3.5. Shawan Interception Scheme IV Study
(1) Calculation scheme determination. The calculation scheme for setting up Shawan Interception Scheme IV is shown in the Supplementary Materials.
(2) Analysis of calculation results. Using the flood analysis model of Shawan Interception Scheme IV, the above 15 scenarios are calculated, and the statistical information of the calculation results of each scenario is shown in the Supplementary Materials.
To ensure that the Shawan River Basin does not suffer a 50-year flood event, the water level in front of the Shawan Gate does not exceed 29.31 m. Considering that the model calculates the river channel from the dry bed, the comprehensive analysis recommends Scenario 12 as the preferred scenario of the Shawan Interception Scheme IV. Scenario 12’s discharge tunnel drainage process, the flow hydrograph of Shenzhen Reservoir, and the regulating lakes results are shown in Figure 9.

Figure 9.
Scheme IV. Scenario 12 result. (a) Discharge tunnel drainage process line; (b) Flow hydrograph of Shenzhen Reservoir; (c) Flow hydrograph of Regulating Lakes.
5.4. Evaluation of Flood Control and Drainage Benefits
Combined with the optimal scenario among the various scenarios in deepening research on the scheme, Scheme I Scenario 2, Scheme II Scenario 5, Scheme III, and Scheme IV Scenario 12, the evaluation is carried out in three aspects: flood control benefits, waterlogging benefits, and drainage benefits.
5.4.1. Assessment of Flood Control Benefits
The flood control benefits of the Shawan Interception Schemes were evaluated using the design water depth reduction rate as the index. When the Shawan River Basin encounters a 50-year flood event, the highest water surface profiles of the main stream under the four Shawan Interception Schemes and the current condition are shown in Figure 10. This study selected the location upstream of the Shawan Gate (at 4000 m) as the key point. The water level profiles along the course at this point are illustrated in Figure 10, and the water depths at the key point are listed in Table 7. Among them, Scheme II exhibits the highest designed maximum water depth reduction ratio at the key point.
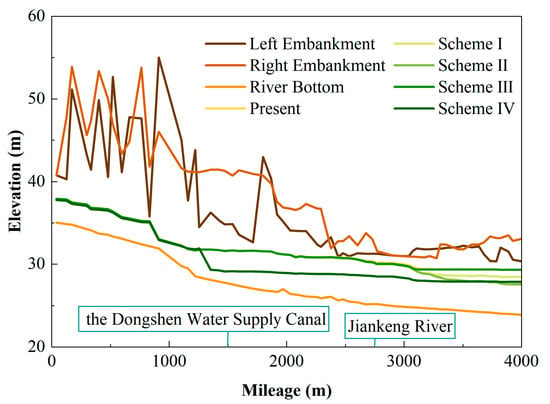
Figure 10.
Map of maximum water level along the main stream of the Shawan River and Shawan Interception Schemes.

Table 7.
Water level of the Shawan River before Shawan Gate (Mileage 4000 m).
5.4.2. Assessment of Drainage Benefit
The waterlogging benefits of the Shawan Interception Schemes were evaluated using the maximum surface inundated area reduction ratio as the index. When the Shawan River Basin encounters a 50-year flood event, the inundation of the four Shawan Interception Schemes and the current conditions of the Shawan River are shown in Table 8, of which Scheme IV has the highest reduction ratio of the maximum inundated area on the surface.

Table 8.
Statistical table of inundation extent of Shawan River Basin (unit: m2).
5.4.3. Drainage Benefit Assessment
The drainage benefits of the Shawan Interception Schemes were evaluated using the reduction ratio of the pipe fullness and overflow rate reduction ratio as the index. When the Shawan River Basin encounters a 50-year flood event, the pipe fullness and overflow of check wells of the drainage pipe network of the four Shawan Interception Schemes and the current condition of the Shawan River are shown in Table 9. Among them, Scheme IV is the highest in both pipe fullness reduction ratio and overflow rate reduction ratio.

Table 9.
Statistical table of information of full pipe and overflow inspection well (or rainwater outlet) of the drainage network of each Shawan Interception Scheme.
6. Discussion
The results of the evaluation of the optimal scenarios, flood control, and drainage benefits of each scheme are shown in Table 10. Scheme IV Scenario 12 scores the highest, taking into account that while every scheme needs to meet the construction objectives of the Shawan Interception Project, Scheme I, obviously reduces the Shenzhen Reservoir flood river flood pressure but does not increase the pressure of other rivers downstream; however, it impacts local flood discharge in the Shenzhen River, with significant coordination challenges from Hong Kong. In Scheme II, the Shawan River Basin flood water is not discharged downstream; there is a maximum reduction in Shenzhen River basin flood pressure, but untreated sewage is discharged directly into the sea, affecting the marine environment. In Scheme III, the effective flood control reservoir capacity of the front reservoir is small, and the front reservoir flood storage will affect the Shenzhen Reservoir water quality safety, which, in turn, affects Shenzhen and Hong Kong’s water safety. Scheme IV, compared to other schemes, has a Shawan River water level that is the most reduced, and the basin flood waterlogging and drainage benefit is optimal. It does not adversely affect the flood discharge capacity of the downstream river channel of Shenzhen Reservoir or reduce the Shenzhen Reservoir flood discharge river (upstream of the exit of the newly built tunnel) of the flooding pressure, and the watershed problem is solved in the watershed, not outside the watershed. After a comprehensive analysis, we recommended Scheme IV Scenario 12 as the preferred option.

Table 10.
Evaluation table of the flood control and drainage benefits of the Shawan River interception plan.
The findings of this study are in line with the general trend observed in other urban flood management research. For instance, the application of numerical models to optimize flood control and drainage engineering solutions has been widely recognized as an effective approach. Our study further extends this by integrating a comprehensive assessment framework that evaluates flood control benefits, waterlogging benefits, and drainage benefits simultaneously. This holistic approach is similar to the multi-criteria decision-making process used in other studies, where various engineering schemes are evaluated based on multiple performance indicators.
The optimization and evaluation technology of urban flood control and drainage project design based on flood numerical model proposed in this paper gives the optimal flood control and drainage project layout, combination of projects, design scale of each project and project scheduling scheme of Shenzhen Shawan Interceptor Drainage Project, which effectively supports the pre-demonstration and construction of Shawan Interceptor Drainage Project.
In comparison with the work of Park et al. [12], who explored optimal deep tunnel sewer systems to enhance urban flood resilience, our study focuses on a broader range of flood control measures, including upper storage, middle diversion, and lower drainage projects. While both studies aim to improve urban flood resilience, our research provides a more detailed analysis of different engineering schemes and their combinations, offering a more comprehensive solution for urban flood management.
7. Conclusions
In urban flood control and drainage engineering planning and design, generally, there is a lack of comprehensive consideration of the project scale and a combination of methods and regulation schemes. This paper proposes a flood numerical modeling based on the urban flood control and drainage engineering scheme fine design techniques, and uses the Shenzhen City Shawan Interception Project as an example to carry out the application of demonstration. The main conclusions are as follows:
This paper puts forward the urban flood model-driven optimization of flood control and drainage engineering solutions from the aspects of the current problem analysis, construction goal determination, preliminary design of the scheme, deepening research on the scheme, and assessment of flood prevention and drainage benefits.
For the Shenzhen Shawan Interception Project, four sets of preliminary design schemes and more than 50 detailed design scenarios are proposed, and the flood analysis model of the Shawan Interception Scheme is constructed to assess the flood control and drainage benefits of the recommended scenarios of each design scheme, and give the optimal engineering design scheme under the perspective of flood control and drainage—Scenario 12 of Scheme IV. At present, the Shenzhen Shawan River Basin has entered the construction stage, and the research results of this paper effectively support the preliminary demonstration and engineering design of the Shawan Interception Project.
In conclusion, the fine design scheme of the urban flood control project based on the flood numerical model proposed in this paper can be used as a support for urban flood management, and has a certain popularization prospect. While this approach effectively identified the optimal engineering design scheme in terms of flood control and drainage benefits, it did not fully consider other crucial aspects such as the difficulty of project implementation, cost, and environmental impact. These factors are also significant in real-world engineering projects and can greatly influence the feasibility and sustainability of the proposed solutions. In addition, the research was conducted based on the specific case of the Shenzhen Shawan Interception Project. Although the findings and the proposed methodology have shown potential for broader application, the unique characteristics of this case, such as the local hydrological conditions, urban planning, and existing infrastructure, may limit the direct applicability of the results to other regions without necessary adaptations. The generalizability of the study outcomes to other urban areas with different contexts needs to be further explored and validated.
Future research should address these limitations to enhance the comprehensiveness and applicability of the research. A multi-criteria decision-making framework that integrates technical, economic, environmental, and social factors should be developed to provide a more holistic evaluation of urban flood control and drainage engineering solutions. This would allow for a better balance between engineering effectiveness and practical feasibility, leading to more sustainable and implementable strategies. Moreover, further studies should be conducted to explore the transferability of the proposed methodology to other urban areas with varying characteristics.
Supplementary Materials
The following supporting information can be downloaded at: https://www.mdpi.com/article/10.3390/w17111705/s1, Table S1: Scheme I model update specification. Table S2: Scheme II model update specification; Table S3: Scheme III model update specification; Table S4: Scheme IV model update specification; Table S5: Scheme I statistical table of the results of each calculation scenario; Table S6: Scheme II statistical table of the results of each calculation scenario; Table S7: Scheme IV statistical table of the details of each calculation scenario; Table S8: Scheme IV statistical table of the results of each calculation scenario.
Author Contributions
Conceptualization, Y.L.; Methodology, Y.L. and W.Z.; Formal analysis, Y.L.; Investigation, X.L.; Resources, X.L.; Writing—original draft, Y.L.; Writing—review & editing, W.Z.; Visualization, B.L.; Supervision, B.L.; Project administration, F.C.; Funding acquisition, W.Z. and F.C. All authors have read and agreed to the published version of the manuscript.
Funding
This research received no external funding.
Data Availability Statement
The data presented in this study are available on request from the corresponding author.
Conflicts of Interest
Author Liu X. was employed by the company Shenzhen Guanghuiyuan Environmental Water Co., Ltd. The remaining authors declare that the research was conducted in the absence of any commercial or financial relationships that could be construed as a potential conflict of interest.
References
- Chen, X.; Zhang, H.; Chen, W.; Huang, G. Urbanization and Climate Change Impacts on Future Flood Risk in the Pearl River Delta under Shared Socioeconomic Pathways. Sci. Total Environ. 2021, 762, 143144. [Google Scholar] [CrossRef] [PubMed]
- Wang, L.; Cui, S.; Li, Y.; Huang, H.; Manandhar, B.; Nitivattananon, V.; Fang, X.; Huang, W. A Review of the Flood Management: From Flood Control to Flood Resilience. Heliyon 2022, 8, e11763. [Google Scholar] [CrossRef] [PubMed]
- Meng, X.; Chang, J.; Wang, X.; Wang, Y.; Wang, Z. Flood Control Operation Coupled with Risk Assessment for Cascade Reservoirs. J. Hydrol. 2019, 572, 543–555. [Google Scholar] [CrossRef]
- Haghbin, S.; Mahjouri, N. Quantifying and Improving Flood Resilience of Urban Drainage Systems Based on Socio-Ecological Criteria. J. Environ. Manag. 2023, 339, 117799. [Google Scholar] [CrossRef]
- Lee, E.; Kim, J.; Choo, Y.; Jo, D. Application of Flood Nomograph for Flood Forecasting in Urban Areas. Water 2018, 10, 53. [Google Scholar] [CrossRef]
- Eckart, K.; McPhee, Z.; Bolisetti, T. Multiobjective Optimization of Low Impact Development Stormwater Controls. J. Hydrol. 2018, 562, 564–576. [Google Scholar] [CrossRef]
- Koc, K.; Ekmekcioğlu, Ö.; Özger, M. An Integrated Framework for the Comprehensive Evaluation of Low Impact Development Strategies. J. Environ. Manag. 2021, 294, 113023. [Google Scholar] [CrossRef]
- Lu, W.; Qin, X.S.; Jun, C. A Parsimonious Framework of Evaluating WSUD Features in Urban Flood Mitigation. J. Environ. Inform. 2018, 33, 17–27. [Google Scholar] [CrossRef]
- Wu, W.; Jamali, B.; Zhang, K.; Marshall, L.; Deletic, A. Water Sensitive Urban Design (WSUD) Spatial Prioritisation through Global Sensitivity Analysis for Effective Urban Pluvial Flood Mitigation. Water Res. 2023, 235, 119888. [Google Scholar] [CrossRef]
- Ramos, H.M.; Besharat, M. Urban Flood Risk and Economic Viability Analyses of a Smart Sustainable Drainage System. Sustainability 2021, 13, 13889. [Google Scholar] [CrossRef]
- Wang, S.; Wang, H. Extending the Rational Method for Assessing and Developing Sustainable Urban Drainage Systems. Water Res. 2018, 144, 112–125. [Google Scholar] [CrossRef] [PubMed]
- Park, S.; Kim, J.; Kang, J. Exploring Optimal Deep Tunnel Sewer Systems to Enhance Urban Pluvial Flood Resilience in the Gangnam Region, South Korea. J. Environ. Manag. 2024, 357, 120762. [Google Scholar] [CrossRef] [PubMed]
- Sörensen, J.; Persson, A.; Sternudd, C.; Aspegren, H.; Nilsson, J.; Nordström, J.; Jönsson, K.; Mottaghi, M.; Becker, P.; Pilesjö, P.; et al. Re-Thinking Urban Flood Management—Time for a Regime Shift. Water 2016, 8, 332. [Google Scholar] [CrossRef]
- He, R.; Tiong, R.L.K.; Yuan, Y.; Zhang, L. Enhancing Resilience of Urban Underground Space under Floods: Current Status and Future Directions. Tunn. Undergr. Space Technol. 2024, 147, 105674. [Google Scholar] [CrossRef]
- Estelaji, F.; Zahedi, R.; Gitifar, A.; Naseri, A.; Yari, M.H.; Asl, B.R.; Abedi, B. Integrating HEC-RAS, GIS, and LISREL for Assessing and Enhancing Urban Building Resilience against Flood Threats: Comprehensive Model and Analysis. Heliyon 2024, 10, e39463. [Google Scholar] [CrossRef]
- Gebremedhin, E.T.; Basco-Carrera, L.; Jonoski, A.; Iliffe, M.; Winsemius, H. Crowdsourcing and Interactive Modelling for Urban Flood Management. J. Flood Risk Manag. 2020, 13, e12602. [Google Scholar] [CrossRef]
- Afriani, L. Effect of Hydrological Data on Flood Management in Urban Areas. Eur. J. Eng. Technol. Res. 2021, 6, 164–168. [Google Scholar]
- Zhou, L.; Kang, L.; Hou, S.; Guo, J. Research on Flood Risk Control Methods and Reservoir Flood Control Operation Oriented towards Floodwater Utilization. Water 2023, 16, 43. [Google Scholar] [CrossRef]
- Pan, Z.; Chen, L.; Teng, X. Research on Joint Flood Control Operation Rule of Parallel Reservoir Group Based on Aggregation–Decomposition Method. J. Hydrol. 2020, 590, 125479. [Google Scholar] [CrossRef]
- Mugume, S.N.; Melville-Shreeve, P.; Gomez, D.; Butler, D. Multifunctional Urban Flood Resilience Enhancement Strategies. Proc. Inst. Civ. Eng. Water Manag. 2017, 170, 115–127. [Google Scholar] [CrossRef]
- Skublics, D.; Blöschl, G.; Rutschmann, P. Effect of River Training on Flood Retention of the Bavarian Danube. J. Hydrol. Hydromech. 2016, 64, 349–356. [Google Scholar] [CrossRef]
- Li, Y.; Li, H.X.; Huang, J.; Liu, C. An Approximation Method for Evaluating Flash Flooding Mitigation of Sponge City Strategies e A Case Study of Central Geelong. J. Clean. Prod. 2020, 257, 120525. [Google Scholar] [CrossRef]
- Xin, Z.; Chenyi, Z.; Hao, L.; Xiaoyu, Z.; Zhile, S.; Lijun, J.; Zelin, W.; Zheng, F. Study on the Risk of Rainstorm Waterlogging Disaster in Hilly Cities Based on Sponge City Construction-Liking Suining. Urban Clim. 2024, 53, 101829. [Google Scholar] [CrossRef]
- Mei, C.; Liu, J.; Wang, H.; Yang, Z.; Ding, X.; Shao, W. Integrated Assessments of Green Infrastructure for Flood Mitigation to Support Robust Decision-Making for Sponge City Construction in an Urbanized Watershed. Sci. Total Environ. 2018, 639, 1394–1407. [Google Scholar] [CrossRef]
- Furumai, H.; Jinadasa, H.K.P.K.; Murakami, M.; Nakajima, F.; Aryal, R.K. Model Description of Storage and Infiltration Functions of Infiltration Facilities for Urban Runoff Analysis by a Distributed Model. Water Sci. Technol. 2005, 52, 53–60. [Google Scholar] [CrossRef]
- Wei, C.-C.; Hsu, N.-S.; Huang, C.-L. Two-Stage Pumping Control Model for Flood Mitigation in Inundated Urban Drainage Basins. Water Resour. Manag. 2014, 28, 425–444. [Google Scholar] [CrossRef]
- Won, Y.-M.; Lee, J.-H.; Moon, H.-T.; Moon, Y.-I. Development and Application of an Urban Flood Forecasting and Warning Process to Reduce Urban Flood Damage: A Case Study of Dorim River Basin, Seoul. Water 2022, 14, 187. [Google Scholar] [CrossRef]
- Yu, K.; Li, D.; Yuan, H.; Fu, W.; Qiao, Q.; Wang, S. “Sponge City”: Theory and Practice. City Plan. Rev. 2015, 39, 26–36. [Google Scholar]
- Guo, L.; Jiao, L. Research progress of sponge city construction. Water Wastewater Eng. 2017, 53, 170–173. [Google Scholar]
- Wu, J.; Xu, J.; Yin, H.; Shen, Z.; Ming, H.; Zeng, J. Urban adaptive planning methods based on simulation of stormwater process and evaluation of sponge construction suitability in the upper Ting River basin in Changting county. Acta Ecol. Sin. 2024, 44, 7051–7062. [Google Scholar]
- De Almeida, G.A.M.; Bates, P.; Ozdemir, H. Modelling Urban Floods at Submetre Resolution: Challenges or Opportunities for Flood Risk Management? J. Flood Risk Manag. 2018, 11, S855–S865. [Google Scholar] [CrossRef]
- GB 50201-2014; Flood Control Standards. China Plan Publishing House: Beijing, China, 2014.
- GB 50014-2021; Standard for Design of Outdoor Wastewater Engineering. China Planning Press: Beijing, China, 2021.
- CB 51222-2017; Technical Specification for Urban Waterlogging Control. China Planning Press: Beijing, China, 2017.
- Zhang, H.; Wu, W.; Hu, C.; Hu, C.; Li, M.; Hao, X.; Liu, S. A Distributed Hydrodynamic Model for Urban Storm Flood Risk Assessment. J. Hydrol. 2021, 600, 126513. [Google Scholar] [CrossRef]
Disclaimer/Publisher’s Note: The statements, opinions and data contained in all publications are solely those of the individual author(s) and contributor(s) and not of MDPI and/or the editor(s). MDPI and/or the editor(s) disclaim responsibility for any injury to people or property resulting from any ideas, methods, instructions or products referred to in the content. |
© 2025 by the authors. Licensee MDPI, Basel, Switzerland. This article is an open access article distributed under the terms and conditions of the Creative Commons Attribution (CC BY) license (https://creativecommons.org/licenses/by/4.0/).