Next Issue
Volume 9, January
Previous Issue
Volume 8, November


Atmosphere, Volume 8, Issue 12 (December 2017) – 28 articles

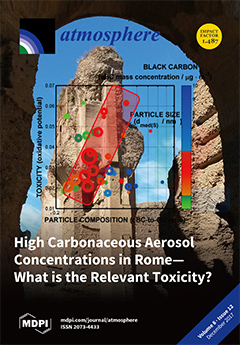
Cover Story (view full-size image): The carbonaceous aerosol is suspected of being more toxic than other PM10 constituents. Here, we show that the toxicological effects associated with this aerosol type are higher for smaller particle sizes—in the ultrafine particle size range (diameter < 100 nm)—that typically occur at low particle mass concentrations, and only for certain combinations of particle size and composition. View this paper
  • Issues are regarded as officially published after their release is announced to the table of contents alert mailing list.
  • You may sign up for e-mail alerts to receive table of contents of newly released issues.
  • PDF is the official format for papers published in both, html and pdf forms. To view the papers in pdf format, click on the "PDF Full-text" link, and use the free Adobe Reader to open them.
Order results
Result details
Section
Select all
Export citation of selected articles as:
4766 KiB  
Article
The Use of a Spectral Nudging Technique to Determine the Impact of Environmental Factors on the Track of Typhoon Megi (2010)
by Xingliang Guo and Wei Zhong
Atmosphere 2017, 8(12), 257; https://doi.org/10.3390/atmos8120257 - 20 Dec 2017
Cited by 9 | Viewed by 3517
Abstract
Sensitivity tests based on a spectral nudging (SN) technique are conducted to analyze the effect of large-scale environmental factors on the movement of typhoon Megi (2010). The error of simulated typhoon track is effectively reduced using SN and the impact of dynamical factors [...] Read more.
Sensitivity tests based on a spectral nudging (SN) technique are conducted to analyze the effect of large-scale environmental factors on the movement of typhoon Megi (2010). The error of simulated typhoon track is effectively reduced using SN and the impact of dynamical factors is more significant than that of thermal factors. During the initial integration and deflection period of Megi (2010), the local steering flow of the whole and lower troposphere is corrected by a direct large-scale wind adjustment, which improves track simulation. However, environmental field nudging may weaken the impacts of terrain and typhoon system development in the landfall period, resulting in large simulated track errors. Comparison of the steering flow and inner structure of the typhoon reveals that the large-scale circulation influences the speed and direction of typhoon motion by: (1) adjusting the local steering flow and (2) modifying the environmental vertical wind shear to change the location and symmetry of the inner severe convection. Full article
(This article belongs to the Special Issue Tropical Cyclones and Their Impacts)
Show Figures

Figure 1

10354 KiB  
Article
Different Characteristics of New Particle Formation Events at Two Suburban Sites in Northern China
by Yan Peng, Yan Dong, Xingmin Li, Xiaodong Liu, Jin Dai, Chuang Chen, Zipeng Dong, Chuanli Du and Zhaosheng Wang
Atmosphere 2017, 8(12), 258; https://doi.org/10.3390/atmos8120258 - 19 Dec 2017
Cited by 7 | Viewed by 3552
Abstract
The formation of new atmospheric aerosol particles and their subsequent growth have been observed under different environmental conditions globally; such observations are few over northwest China. Here, we present an analysis of some case studies for new particle formation (NPF) events from two [...] Read more.
The formation of new atmospheric aerosol particles and their subsequent growth have been observed under different environmental conditions globally; such observations are few over northwest China. Here, we present an analysis of some case studies for new particle formation (NPF) events from two distinct suburban locations in northern China during May and June of two consecutive years, and provide more information to understand the characteristics of NPF events in North China. Particle number size distribution was measured at suburbs of Beijing (39.75° N, 116.96° E) during 1 June to 2 July 2013 and at suburbs of Xi’an (34.09° N, 108.55° E) during 1 to 25 May 2014. The average of total particle number concentration in the similar size range of 10–487 nm at the suburbs of Beijing (9.0 × 103 cm−3) was about two times higher than those observed at Xi’an (4.7 × 103 cm−3), and the mean particle mode diameter at Beijing was 1.4-fold higher than that at Xi’an. The estimated total condensation sink (CS) at Beijing (3.11 × 10⁻² s−1) was also higher than at Xi’an (1.13 × 10⁻² s−1). The frequency of NPF events at suburb of Beijing was 24%, lower than that in Xi’an (50%), and also lower than urban site of Beijing (35% in June) and another suburb of Beijing (over 50% in June). The NPF events with (Class I) or without (Class II) subsequent growth were both observed at the two suburb sites. The derived GR at the suburb of Beijing (range from 4.6 to 8.6 nm h−1) was a little higher than that at Xi’an (range from 3.3 to 6.7 nm h−1), which are generally comparable to typical values in mid-latitude reported in previous studies. The air masses coming from north or northwest China favor the occurrence of NPF event under low condensation sink and clear days. The number size distributions of freshly nucleated particles showed clear bimodal distributions on both sites. Additionally, Mode Dp of nucleated particles at the two sites was 17 ± 1 nm and 22 ± 4 nm, respectively during the periods with NPF events. The case study of NPF events at the two suburb sites shows that the surface area concentration and total scattering coefficient (SC) was significant decreased during the NPF events at both sites. High temperature, low condensation sink and low relative humidity furthered the occurrence of NPF events, and wind direction shifts were important for the subsequent growth of particles. NPF events in the suburbs of Beijing usually occurred when relative humidity (RH) < 55%, CS < 0.02 s−1, or 55% < RH < 68%, CS < 0.01 s−1. However, there is no clear range for Xi’an. Furthermore, we observed that some NPF events occurred at higher RH and very low CS in this study on both sites, which means that low CS may be more important than low RH for the particle formation on clear days. Full article
(This article belongs to the Special Issue Urban Particulate Matters: Composition, Sources, and Exposure)
Show Figures

Figure 1

12286 KiB  
Article
Diagnosis of the Tropical Moisture Exports to the Mid-Latitudes and the Role of Atmospheric Steering in the Extreme Precipitation
by Mengqian Lu and Xiaotian Hao
Atmosphere 2017, 8(12), 256; https://doi.org/10.3390/atmos8120256 - 19 Dec 2017
Cited by 18 | Viewed by 4146
Abstract
Three river basins, i.e., the Yangtze river, the Mississippi river and the Loire river, were presented as case studies to explore the association among atmospheric circulations, moisture exports and extreme precipitations in the mid-latitudes. The major moisture source regions in the tropics for [...] Read more.
Three river basins, i.e., the Yangtze river, the Mississippi river and the Loire river, were presented as case studies to explore the association among atmospheric circulations, moisture exports and extreme precipitations in the mid-latitudes. The major moisture source regions in the tropics for the three river basins are first identified using the Tropical Moisture Exports (TMEs) dataset. The space-time characteristics of their respective moisture sources are presented. Then, the trajectory curve clustering analysis is applied to the TMEs tracks originating from the identified source regions during each basin’s peak TMEs activity and flood seasons. Our results show that the moisture tracks for each basin can be categorized into 3 or 4 clusters with distinct spatial trajectory features. Our further analysis on these clustered trajectories reveals that the contributions of moisture release from different clusters are associated with their trajectory features and travel speeds. In order to understand the role of associated atmospheric steering, daily composites of the geopotential heights anomalies and the vertical integral of moisture flux anomalies from 7 days ahead to the extreme precipitation days (top 5%) are examined. The evolutions of the atmospheric circulation patterns and the moisture fluxes are both consistent with the TMEs tracks that contribute more moisture releases to the study regions. The findings imply that atmospheric steering plays an important role in the moisture transport and release, especially for the extreme precipitations. We also find that the association between TMEs moisture release and precipitation is nonlinear. The extreme precipitation is associated with high TMEs moisture release for all of the three study regions. Full article
(This article belongs to the Special Issue Water Vapor in the Atmosphere)
Show Figures

Figure 1

573 KiB  
Article
Tourists, Weather and Climate. Official Tourism Promotion Websites as a Source of Information
by María Belén Gómez-Martín, Xosé Antón Armesto-López and Emilio Martínez-Ibarra
Atmosphere 2017, 8(12), 255; https://doi.org/10.3390/atmos8120255 - 17 Dec 2017
Cited by 15 | Viewed by 4710
Abstract
On the basis of the establishment and analysis of 29 indicators, this article analyses the quality of the climate and meteorological information that is provided to tourists on the websites of the bodies responsible for promoting Spanish tourist destinations at a state and [...] Read more.
On the basis of the establishment and analysis of 29 indicators, this article analyses the quality of the climate and meteorological information that is provided to tourists on the websites of the bodies responsible for promoting Spanish tourist destinations at a state and regional level. Official tourism promotion websites are a prominent source of information for tourists, so it is necessary to control the quality levels of the information contained in them. The objective is to detect weaknesses that can be corrected to achieve the improvement of the public service that is offered by these websites. The results indicate that the weather information provided on the institutional websites does not meet the information needs of tourists in the different phases of the travel experience, and as a result contributes little to tactical and strategic decision-making regarding the various activities for tourists, in which the weather or climate are relevant factors. This could make it more difficult for them to interact and integrate with the destination and worsen the quality of their tourist experience. Full article
(This article belongs to the Section Biometeorology)
4336 KiB  
Article
Modeling the Spatial and Temporal Variability of Precipitation in Northwest Iran
by Mohammad Arab Amiri and Mohammad Saadi Mesgari
Atmosphere 2017, 8(12), 254; https://doi.org/10.3390/atmos8120254 - 17 Dec 2017
Cited by 21 | Viewed by 5585
Abstract
Spatial and temporal variability analysis of precipitation is an important task in water resources planning and management. This study aims to analyze the spatial and temporal variability of precipitation in the northeastern corner of Iran using data from 24 well-distributed weather stations between [...] Read more.
Spatial and temporal variability analysis of precipitation is an important task in water resources planning and management. This study aims to analyze the spatial and temporal variability of precipitation in the northeastern corner of Iran using data from 24 well-distributed weather stations between 1991 and 2015. The mean annual rainfall, precipitation concentration index (PCI), and their coefficients of variation were mapped to examine the spatial variability of rainfall. An artificial neural network (ANN) in association with the inverse distance weighted (IDW) method was proposed as a hybrid interpolation method to map the spatial distribution of the detected trends of mean annual rainfall and PCI over the study region. In addition, principal component analysis (PCA) was applied to annual precipitation time series in order to verify the results of the analysis using the mean annual rainfall and PCI data sets. Results show high variation in inter-annual precipitation in the west, and a moderate to high intra-annual variability over the whole region. Irregular year-to-year precipitation concentration is also observed in the northeastern and northwestern parts. All in all, the highest variations in inter-annual and intra-annual precipitation occurred over the western and northern parts, while the lowest variability was observed in the eastern part (i.e., the coastal region). Full article
(This article belongs to the Special Issue Precipitation: Measurement and Modeling)
Show Figures

Figure 1

7351 KiB  
Letter
On the Precipitation and Precipitation Change in Alaska
by Gerd Wendler, Telayna Gordon and Martin Stuefer
Atmosphere 2017, 8(12), 253; https://doi.org/10.3390/atmos8120253 - 15 Dec 2017
Cited by 30 | Viewed by 9557
Abstract
Alaska observes very large differences in precipitation throughout the state; southeast Alaska experiences consistently wet conditions, while northern Arctic Alaska observes very dry conditions. The maximum mean annual precipitation of 5727 mm is observed in the southeastern panhandle at Little Port Arthur, while [...] Read more.
Alaska observes very large differences in precipitation throughout the state; southeast Alaska experiences consistently wet conditions, while northern Arctic Alaska observes very dry conditions. The maximum mean annual precipitation of 5727 mm is observed in the southeastern panhandle at Little Port Arthur, while the minimum of 92 mm occurs on the North Slope at Kuparuk. Besides explaining these large differences due to geographic and orographic location, we discuss the changes in precipitation with time. Analyzing the 18 first-order National Weather Service stations, we found that the total average precipitation in the state increased by 17% over the last 67 years. The observed changes in precipitation are furthermore discussed as a function of the observed temperature increase of 2.1 °C, the mean temperature change of the 18 stations over the same period. This observed warming of Alaska is about three times the magnitude of the mean global warming and allows the air to hold more water vapor. Furthermore, we discuss the effect of the Pacific Decadal Oscillation (PDO), which has a strong influence on both the temperature and precipitation in Alaska. Full article
(This article belongs to the Special Issue Global Precipitation with Climate Change)
Show Figures

Figure 1

7234 KiB  
Article
The Exceptionally Cold January of 2017 over the Balkan Peninsula: A Climatological and Synoptic Analysis
by Christina Anagnostopoulou, Konstantia Tolika, Georgia Lazoglou and Panagiotis Maheras
Atmosphere 2017, 8(12), 252; https://doi.org/10.3390/atmos8120252 - 15 Dec 2017
Cited by 37 | Viewed by 4554
Abstract
An exceptionally cold episode occurred in January 2017 over the Balkan Peninsula. Analysis of historical records showed that it was one of the coldest extreme episodes. Even though the low temperatures of January 2017 did not break previous low records for all stations, [...] Read more.
An exceptionally cold episode occurred in January 2017 over the Balkan Peninsula. Analysis of historical records showed that it was one of the coldest extreme episodes. Even though the low temperatures of January 2017 did not break previous low records for all stations, the long duration was quite extreme, resulting in strong socioeconomic impacts in the region of interest. The 10-year to 100-year return values of minimum temperatures were calculated based on block maxima method and the maximum likelihood estimates. The estimated return periods of the absolute minimum temperature are approximately 15 or 20 years for almost all stations. For only one station, the absolute minimum temperature of January 2017 might happen once in every 300 years according to the return level results. Moreover, the extreme cold episode over the Balkans during the period of 5 January 2017 to 12 January 2017 was associated with a significant outbreak of arctic air masses into eastern–central Europe and the Balkans and a cutoff low at the level of 500 hPa over the region. Full article
(This article belongs to the Special Issue Temperature Extremes and Heat/Cold Waves)
Show Figures

Figure 1

167998 KiB  
Article
An Evaluation of the CHIMERE Chemistry Transport Model to Simulate Dust Outbreaks across the Northern Hemisphere in March 2014
by Bertrand Bessagnet, Laurent Menut, Augustin Colette, Florian Couvidat, Mo Dan, Sylvain Mailler, Laurent Létinois, Véronique Pont and Laurence Rouïl
Atmosphere 2017, 8(12), 251; https://doi.org/10.3390/atmos8120251 - 13 Dec 2017
Cited by 11 | Viewed by 6460
Abstract
Mineral dust is one of the most important aerosols over the world, affecting health and climate. These mineral particles are mainly emitted over arid areas but may be long-range transported, impacting the local budget of air quality in urban areas. While models were [...] Read more.
Mineral dust is one of the most important aerosols over the world, affecting health and climate. These mineral particles are mainly emitted over arid areas but may be long-range transported, impacting the local budget of air quality in urban areas. While models were extensively used to study a single specific event, or make a global analysis at coarse resolution, the goal of our study is to simultaneously focus on several affected areas—Europe, North America, Central Asia, east China and the Caribbean area—for a one-month period, March 2014, avoiding any parameter fitting to better simulate a single dust outbreak. The simulation is performed for the first time with the hemispheric version of the CHIMERE model, with a high horizontal resolution (about 10 km). In this study, an overview of several simultaneous dust outbreaks over the Northern Hemisphere is proposed to assess the capability of such modeling tools to predict dust pollution events. A quantitative and qualitative evaluation of the most striking episodes is presented with comparisons to satellite data, ground based particulate matter and calcium measurements. Despite some overestimation of dust concentrations far from emission source areas, the model can simulate the timing of the arrival of dust outbreaks on observational sites. For instance, several spectacular dust storms in the US and China are rather well captured by the models. The high resolution provides a better description and understanding of the orographic effects and the long-range transport of dust plumes. Full article
(This article belongs to the Section Air Quality)
Show Figures

Graphical abstract

5609 KiB  
Article
Calibrating Radar Data in an Orographic Setting: A Case Study for the Typhoon Nakri in the Hallasan Mountain, Korea
by Jung Mo Ku and Chulsang Yoo
Atmosphere 2017, 8(12), 250; https://doi.org/10.3390/atmos8120250 - 13 Dec 2017
Cited by 3 | Viewed by 3691
Abstract
The Typhoon Nakri passed the Jeju Island in Korea (1–3 August 2014) and recorded one-day rainfall of 1182 mm at Witse-Oreum (a place name where a small volcanic cone is) of the Hallasan Mountain, Korea. This one-day rainfall amount was the highest rainfall [...] Read more.
The Typhoon Nakri passed the Jeju Island in Korea (1–3 August 2014) and recorded one-day rainfall of 1182 mm at Witse-Oreum (a place name where a small volcanic cone is) of the Hallasan Mountain, Korea. This one-day rainfall amount was the highest rainfall that was ever recorded in Korea. As the altitude of Witse-Oreum is 1673 m, it was believed that the orographic effect enhanced the rainfall depth significantly. It was also argued that the maximum rainfall could be recorded in some other locations in the Hallasan Mountain. In this study, the rainfall event due to the Typhoon Nakri in the Jeju Island was analyzed using the radar and rain gauge data that were collected during this rainfall event. Fortunately, two radars are available on the eastern and western side of the Jeju Island. The entire Hallasan Mountain is covered by these two radars. A total of 23 rain gauges are also available in the Jeju Island. As a first step, independent ground-level Z-R relations were derived for every 250 m interval from the sea-level. Each Z-R relation was then applied to the corresponding-altitude radar reflectivity data to generate the rain rate field over the Jeju Island. Finally, the generated radar rain rate data were examined fully to evaluate the orographic effect in the Hallasan Mountain, also to locate the point where the maximum rain rate was recorded. This result shows that the maximum one-day rainfall amount could be up to 1500 mm, which was about 30% higher than the rain gauge measurement. Full article
(This article belongs to the Section Meteorology)
Show Figures

Figure 1

13063 KiB  
Article
First Results of the “Carbonaceous Aerosol in Rome and Environs (CARE)” Experiment: Beyond Current Standards for PM10
by Francesca Costabile, Honey Alas, Michaela Aufderheide, Pasquale Avino, Fulvio Amato, Stefania Argentini, Francesca Barnaba, Massimo Berico, Vera Bernardoni, Riccardo Biondi, Giampietro Casasanta, Spartaco Ciampichetti, Giulia Calzolai, Silvia Canepari, Alessandro Conidi, Eugenia Cordelli, Antonio Di Ianni, Luca Di Liberto, Maria Cristina Facchini, Andrea Facci, Daniele Frasca, Stefania Gilardoni, Maria Giuseppa Grollino, Maurizio Gualtieri, Franco Lucarelli, Antonella Malaguti, Maurizio Manigrasso, Mauro Montagnoli, Silvia Nava, Cinzia Perrino, Elio Padoan, Igor Petenko, Xavier Querol, Giulia Simonetti, Giovanna Tranfo, Stefano Ubertini, Gianluigi Valli, Sara Valentini, Roberta Vecchi, Francesca Volpi, Kay Weinhold, Alfred Wiedensohler, Gabriele Zanini, Gian Paolo Gobbi and Ettore Petraliaadd Show full author list remove Hide full author list
Atmosphere 2017, 8(12), 249; https://doi.org/10.3390/atmos8120249 - 12 Dec 2017
Cited by 58 | Viewed by 8849
Abstract
In February 2017 the “Carbonaceous Aerosol in Rome and Environs (CARE)” experiment was carried out in downtown Rome to address the following specific questions: what is the color, size, composition, and toxicity of the carbonaceous aerosol in the Mediterranean urban background area of [...] Read more.
In February 2017 the “Carbonaceous Aerosol in Rome and Environs (CARE)” experiment was carried out in downtown Rome to address the following specific questions: what is the color, size, composition, and toxicity of the carbonaceous aerosol in the Mediterranean urban background area of Rome? The motivation of this experiment is the lack of understanding of what aerosol types are responsible for the severe risks to human health posed by particulate matter (PM) pollution, and how carbonaceous aerosols influence radiative balance. Physicochemical properties of the carbonaceous aerosol were characterised, and relevant toxicological variables assessed. The aerosol characterisation includes: (i) measurements with high time resolution (min to 1–2 h) at a fixed location of black carbon (eBC), elemental carbon (EC), organic carbon (OC), particle number size distribution (0.008–10 μ m), major non refractory PM1 components, elemental composition, wavelength-dependent optical properties, and atmospheric turbulence; (ii) 24-h measurements of PM10 and PM2.5 mass concentration, water soluble OC and brown carbon (BrC), and levoglucosan; (iii) mobile measurements of eBC and size distribution around the study area, with computational fluid dynamics modeling; (iv) characterisation of road dust emissions and their EC and OC content. The toxicological assessment includes: (i) preliminary evaluation of the potential impact of ultrafine particles on lung epithelia cells (cultured at the air liquid interface and directly exposed to particles); (ii) assessment of the oxidative stress induced by carbonaceous aerosols; (iii) assessment of particle size dependent number doses deposited in different regions of the human body; (iv) PAHs biomonitoring (from the participants into the mobile measurements). The first experimental results of the CARE experiment are presented in this paper. The objective here is to provide baseline levels of carbonaceous aerosols for Rome, and to address future research directions. First, we found that BC and EC mass concentration in Rome are larger than those measured in similar urban areas across Europe (the urban background mass concentration of eBC in Rome in winter being on average 2.6 ± 2.5 μ g · m 3 , mean eBC at the peak level hour being 5.2 (95% CI = 5.0–5.5) μ g · m 3 ). Then, we discussed significant variations of carbonaceous aerosol properties occurring with time scales of minutes, and questioned on the data averaging period used in current air quality standard for PM 10 (24-h). Third, we showed that the oxidative potential induced by aerosol depends on particle size and composition, the effects of toxicity being higher with lower mass concentrations and smaller particle size. Albeit this is a preliminary analysis, findings reinforce the need for an urgent update of existing air quality standards for PM 10 and PM 2.5 with regard to particle composition and size distribution, and data averaging period. Our results reinforce existing concerns about the toxicity of carbonaceous aerosols, support the existing evidence indicating that particle size distribution and composition may play a role in the generation of this toxicity, and remark the need to consider a shorter averaging period (<1 h) in these new standards. Full article
(This article belongs to the Special Issue Carbonaceous Aerosols in Atmosphere)
Show Figures

Figure 1

9776 KiB  
Article
Numerical Study on the Generation and Transport of Spume Droplets in Wind over Breaking Waves
by Shuai Tang, Zixuan Yang, Caixi Liu, Yu-Hong Dong and Lian Shen
Atmosphere 2017, 8(12), 248; https://doi.org/10.3390/atmos8120248 - 12 Dec 2017
Cited by 16 | Viewed by 4039
Abstract
Sea spray droplets play an important role in the momentum, heat and mass transfer in the marine atmospheric boundary layer. We have developed a new direct numerical simulation method to study the generation and transport mechanisms of spume droplets by wind blowing over [...] Read more.
Sea spray droplets play an important role in the momentum, heat and mass transfer in the marine atmospheric boundary layer. We have developed a new direct numerical simulation method to study the generation and transport mechanisms of spume droplets by wind blowing over breaking waves, with the wave breaking process taken into account explicitly. In this new computational framework, the air and water are simulated as a coherent system on fixed Eulerian grid with the density and viscosity varying with the fluid phase. The air-water interface is captured accurately using a coupled level-set and volume-of-fluid method. The trajectories of sea spray droplets are tracked using a Lagrangian particle-tracking method. The generation of droplets is captured by comparing the fluid particle velocity of water and the phase speed of the wave surface. From the simulation data, we obtain for the first time a detailed description of the instantaneous distribution of droplets at different stages of wave breaking. Furthermore, the time histories of the droplet number and its generation and disappearance rates are analyzed. Simulation cases with different parameters are performed to study the effects of wave age and wave steepness. The flow and droplet fields obtained from simulation provided a detailed physical picture of the problem of interest. It is found that plunging breakers generate more droplets than spilling breakers. Droplets are generated near the wave crest at young and intermediate wave ages, but at old wave ages, droplets are generated both near and behind the wave crest. It is also elucidated that the large-scale spanwise vortex induced by the wave plunging event plays an important role in suspending droplets. Our simulation result of the vertical profile of sea spray concentration is consistent with laboratory measurement reported in the literature. Full article
(This article belongs to the Section Biosphere/Hydrosphere/Land–Atmosphere Interactions)
Show Figures

Figure 1

6335 KiB  
Article
Urban Roughness Estimation Based on Digital Building Models for Urban Wind and Thermal Condition Estimation—Application of the SkyHelios Model
by Yu-Cheng Chen, Dominik Fröhlich, Andreas Matzarakis and Tzu-Ping Lin
Atmosphere 2017, 8(12), 247; https://doi.org/10.3390/atmos8120247 - 10 Dec 2017
Cited by 18 | Viewed by 4664
Abstract
Roughness length is a critical parameter for estimation of wind conditions, and it is therefore also relevant for the estimation of human thermal conditions in urban areas. The high density of buildings in urban areas causes large changes in land coverage, thereby increasing [...] Read more.
Roughness length is a critical parameter for estimation of wind conditions, and it is therefore also relevant for the estimation of human thermal conditions in urban areas. The high density of buildings in urban areas causes large changes in land coverage, thereby increasing surface roughness. This influence atmospheric flow and also leads to a reduction in urban air ventilation, thus increasing the risk of human thermal stress. In this study, a digital building model of Tainan city was used to calculate roughness length using an approach based on Voronoi cells by applying the microclimate model, SkyHelios. The model was also used to estimate the wind conditions, including the wind speed and wind direction. For estimation of the thermal conditions, this study obtained meteorological data for air temperature, relative humidity, globe temperature, wind speed, and wind direction on two specific days (31 July 2015 and 21 January 2016). To quantify the thermal stress, the physiologically equivalent temperature (PET) was used to represent the thermal conditions. The wind conditions results obtained from the model indicate that even microscale conditions with vortices and corner flow can be represented with high precision and resolution. The thermal conditions results demonstrate that different created environments and microclimate conditions affect the thermal environment. The difference in PET can be up to 3 °C. This study confirmed that comparison of microclimate thermal conditions based on measurements and obtained from modeling using SkyHelios are in sufficient agreement and can be used in urban planning in the future. Full article
(This article belongs to the Section Biometeorology)
Show Figures

Figure 1

10981 KiB  
Article
Utilization of Global Precipitation Datasets in Data Limited Regions: A Case Study of Kilombero Valley, Tanzania
by Alexander J. Koutsouris, Jan Seibert and Steve W. Lyon
Atmosphere 2017, 8(12), 246; https://doi.org/10.3390/atmos8120246 - 07 Dec 2017
Cited by 13 | Viewed by 4050 | Correction
Abstract
This study explored the potential for bias correction of global precipitation datasets (GPD) to support streamflow simulation for water resource management in data limited regions. Two catchments, 580 km2 and 2530 km2, in the Kilombero Valley of central Tanzania were [...] Read more.
This study explored the potential for bias correction of global precipitation datasets (GPD) to support streamflow simulation for water resource management in data limited regions. Two catchments, 580 km2 and 2530 km2, in the Kilombero Valley of central Tanzania were considered as case studies to explore three GPD bias correction methods: quantile mapping (QM), daily percentages (DP) and a model based (ModB) bias correction. The GPDs considered included two satellite rainfall products, three reanalysis products and three interpolated observed data products. The rainfall-runoff model HBV was used to simulate streamflow in the two catchments using (1) observed rain gauge data; (2) the original GPDs and (3) the bias-corrected GPDs as input. Results showed that applying QM to bias correction based on limited observed data tends to aggravate streamflow simulations relative to not bias correcting GPDs. This is likely due to a potential lack of representativeness of a single rain gauge observation at the scale of a hydrological catchment for these catchments. The results also indicate that there may be potential benefits in combining streamflow and rain gauge data to bias correct GPDs during the model calibration process within a hydrological modeling framework. Full article
(This article belongs to the Special Issue Precipitation Variability and Change in Africa)
Show Figures

Graphical abstract

2676 KiB  
Article
Modeling the Stepping Process of Negative Lightning Stepped Leaders
by Vernon Cooray and Liliana Arevalo
Atmosphere 2017, 8(12), 245; https://doi.org/10.3390/atmos8120245 - 07 Dec 2017
Cited by 14 | Viewed by 5072
Abstract
A physical model based on the mechanism observed in experimental investigations is introduced to describe the formation of negative leader steps. Starting with a small length of a space leader located at the periphery of the negative streamer system of the stepped leader, [...] Read more.
A physical model based on the mechanism observed in experimental investigations is introduced to describe the formation of negative leader steps. Starting with a small length of a space leader located at the periphery of the negative streamer system of the stepped leader, the model simulates the growth and the subsequent formation of the leader step. Based on the model, the step length, the step forming time, and the propagation speed of stepped leaders as a function of the prospective return stroke peak current are estimated. The results show that the step length and the leader speed increase with increasing prospective return stroke current. The results also show that the speed of the stepped leader increases as it approaches the ground. For prospective return stroke currents in the range of 15 kA–60 kA, the step lengths lie within the range 5 m–100 m, the step forming times lie within the range 10 μs–250 μs, and the leader speed lies within the range 105 m/s −1.5 × 10⁶ m/s. The results obtained are in reasonable agreement with the experimental observations. Full article
Show Figures

Figure 1

2675 KiB  
Article
Energy Distribution of X-rays Produced by Meter-Long Negative Discharges in Air
by Pasan Hettiarachchi, Vernon Cooray, Mahbubur Rahman and Joseph Dwyer
Atmosphere 2017, 8(12), 244; https://doi.org/10.3390/atmos8120244 - 06 Dec 2017
Cited by 8 | Viewed by 6000
Abstract
The energy deposited from X-rays generated by 1 m long laboratory sparks in air created by 950 kV negative lightning impulses on scintillated detectors was measured. Assuming the X-ray energy detected in such sparks results from the accumulation of multiple photons at the [...] Read more.
The energy deposited from X-rays generated by 1 m long laboratory sparks in air created by 950 kV negative lightning impulses on scintillated detectors was measured. Assuming the X-ray energy detected in such sparks results from the accumulation of multiple photons at the detector having a certain energy distribution, an experiment was designed in such a way to characterize their distribution parameters. The detector was screened by a copper shield, and eight series of fifteen impulses were applied by stepwise increasing the copper shield thickness. The average deposited energy was calculated in each series and compared with the results from a model consisting of the attenuation of photons along their path and probable photon distributions. The results show that the energy distribution of X-ray bursts can be approximated by a bremsstrahlung spectrum of photons, having a maximum energy of 200 keV to 250 keV and a mean photon energy around 52 keV to 55 keV. Full article
Show Figures

Figure 1

2153 KiB  
Article
Inter-Comparison of Carbon Content in PM2.5 and PM10 Collected at Five Measurement Sites in Southern Italy
by Adelaide Dinoi, Daniela Cesari, Angela Marinoni, Paolo Bonasoni, Angelo Riccio, Elena Chianese, Giuseppina Tirimberio, Attilio Naccarato, Francesca Sprovieri, Virginia Andreoli, Sacha Moretti, Daniel Gullì, Claudia R. Calidonna, Ivano Ammoscato and Daniele Contini
Atmosphere 2017, 8(12), 243; https://doi.org/10.3390/atmos8120243 - 06 Dec 2017
Cited by 56 | Viewed by 5318
Abstract
A field campaign was performed simultaneously at five measurement sites, having different characteristics, to characterize the spatial distribution of the carbonaceous content in atmospheric aerosol in Southern Italy during the winter season. Organic carbon (OC) and elemental carbon (EC) were measured at urban [...] Read more.
A field campaign was performed simultaneously at five measurement sites, having different characteristics, to characterize the spatial distribution of the carbonaceous content in atmospheric aerosol in Southern Italy during the winter season. Organic carbon (OC) and elemental carbon (EC) were measured at urban (Naples), suburban (Lecce), coastal/marine (Lamezia Terme and Capo Granitola), and remote (Monte Curcio) locations. OC and EC mass concentrations were quantified by the thermal-optical transmission (TOT) method, in 24-h PM10 and PM2.5 samples collected on quartz fiber filters, from 25 November 2015 to 1 January 2016. The different sites showed marked differences in the average concentrations of both carbonaceous species. Typically, OC average levels (±standard deviation) were higher at the sites of Naples (12.8 ± 5.1 and 11.8 ± 4.6 μg/m3) and Lecce (10.7 ± 5.8 and 9.0 ± 4.7 μg/m3), followed by Lamezia Terme (4.3 ± 2.0 and 4.0 ± 1.9 μg/m3), Capo Granitola (2.3 ± 1.2 and 1.7 ± 1.1 μg/m3), and Monte Curcio (0.9 ± 0.3 and 0.9 ± 0.3 μg/m3) in PM10 and PM2.5, respectively. Similarly, EC average levels (±standard deviation) were higher at the urban sites of Naples (2.3 ± 1.1 and 1.8 ± 0.5 μg/m3) and Lecce (1.5 ± 0.8 and 1.4 ± 0.7 μg/m3), followed by Lamezia Terme (0.6 ± 0.3 and 0.6 ± 0.3 μg/m3), Capo Granitola (0.3 ± 0.3 and 0.3 ± 0.2 μg/m3), and Monte Curcio (0.06 ± 0.04 and 0.05 ± 0.03 μg/m3) in PM10 and PM2.5, respectively. An opposite trend was observed for the OC/EC ratios ranging from 6.4 to 15.9 in PM10 and from 6.4 to 15.5 in PM2.5 with lower values in urban sites compared to remote sites. Different OC-EC correlations, 0.36 < R2 < 0.90, were found in four observation sites. This behavior suggests the contributions of similar sources and common atmospheric processes in both fractions. No correlations were observed between OC and EC at the site of Naples. The average secondary organic carbon (SOC) concentrations, quantified using the minimum OC/EC ratio method, ranged from 0.4 to 7.6 μg/m3 in PM10 and from 0.4 to 7.2 μg/m3 in PM2.5, accounting from 37 to 59% of total OC in PM10 and from 40 to 57% in PM2.5 with higher percentages in the urban and suburban sites of Naples and Lecce. Full article
(This article belongs to the Special Issue Carbonaceous Aerosols in Atmosphere)
Show Figures

Graphical abstract

7280 KiB  
Article
Analysis of the Long-Term Variability of Poor Visibility Events in the UAE and the Link with Climate Dynamics
by Amal Aldababseh and Marouane Temimi
Atmosphere 2017, 8(12), 242; https://doi.org/10.3390/atmos8120242 - 04 Dec 2017
Cited by 40 | Viewed by 6148
Abstract
The goal of this study is to investigate the variability of poor visibility events occurring hourly in the UAE and their relationship to climate dynamics. Hourly visibility observation data spanning more than three decades from ten stations across the country were used. Four [...] Read more.
The goal of this study is to investigate the variability of poor visibility events occurring hourly in the UAE and their relationship to climate dynamics. Hourly visibility observation data spanning more than three decades from ten stations across the country were used. Four intervals of low visibility, between 0.10 km and 5.0 km, were considered. Poor visibility records were analyzed under wet and dry weather conditions. The Mann–Kendall test was used to assess the inferred trends of low visibility records. The relationships between poor visibility measurements and associated meteorological variables and climate oscillations were also investigated. Results show that Fujairah city has the highest average visibility values under wet weather conditions, while Abu Dhabi city has the lowest average visibility values under both wet and dry conditions. Wet weather conditions had a greater impact than dry weather conditions on visibility deterioration in seven out of the ten stations. Results confirm that fog and dust contribute significantly to the deterioration of visibility in the UAE and that Abu Dhabi has been more impacted by those events than Dubai. Furthermore, the numbers of fog and dust events show steep increasing trends for both cities. A change point in poor visibility records triggered by fog and dust events was detected around the year 1999 at Abu Dhabi and Dubai stations after the application of the cumulative sum method. Increasing shifts in the means and the variances were noticed in the total annual fog events when Student’s t-test and Levene’s test were applied. In Abu Dhabi, the mean annual number of dust events was approximately 112.5 before 1999, increasing to 337 dust events after 1999. In Dubai, the number of dust events increased from around 85.5 to 315.6 events. The inferred fog and dust trends were compared to four climate indices. Results showed a significant correlation (positive and negative) between four climate indices and the occurrence of fog and dust events in the UAE. Full article
(This article belongs to the Section Meteorology)
Show Figures

Figure 1

5720 KiB  
Article
Enhanced MODIS Atmospheric Total Water Vapour Content Trends in Response to Arctic Amplification
by Dunya Alraddawi, Philippe Keckhut, Alain Sarkissian, Olivier Bock, Abdanour Irbah, Slimane Bekki, Chantal Claud and Mustapha Meftah
Atmosphere 2017, 8(12), 241; https://doi.org/10.3390/atmos8120241 - 02 Dec 2017
Cited by 10 | Viewed by 5147
Abstract
In order to assess the strength of the water vapour feedback within Arctic climate change, 15 years of the total column-integrated density of water vapour (TCWV) from the moderate resolution imaging spectrometer (MODIS) are analysed. Arctic TCWV distribution, trends, and anomalies for the [...] Read more.
In order to assess the strength of the water vapour feedback within Arctic climate change, 15 years of the total column-integrated density of water vapour (TCWV) from the moderate resolution imaging spectrometer (MODIS) are analysed. Arctic TCWV distribution, trends, and anomalies for the 2001–2015 period, broken down into seasons and months, are analysed. Enhanced local spring TCWV trends above the terrestrial Arctic regions are discussed in relation to land snow cover and vegetation changes. Upward TCWV trends above the oceanic areas are discussed in lien with sea ice extent and sea surface temperature changes. Increased winter TCWV (up to 40%) south of the Svalbard archipelago are observed; these trends are probably driven by a local warming and sea ice extent decline. Similarly, the Barents/Kara regions underwent wet trends (up to 40%), also associated with winter/fall local sea ice loss. Positive late summer TCWV trends above the western Greenland and Beaufort seas (about 20%) result from enhanced upper ocean warming and thereby a local coastal decline in ice extent. The Mackenzie and Siberia enhanced TCWV trends (about 25%) during spring are found to be associated with coincident decreased snow cover and increased vegetation, as a result of the earlier melt onset. Results show drier summers in the Eurasia and western Alaska regions, thought to be affected by changes in albedo from changing vegetation. Other TCWV anomalies are also presented and discussed in relation to the dramatic decline in sea ice extent and the exceptional rise in sea surface temperature. Full article
(This article belongs to the Special Issue Water Vapor in the Atmosphere)
Show Figures

Figure 1

3154 KiB  
Article
Influence of Raindrop Size Distribution on Throughfall Dynamics under Pine and Birch Trees at the Rainfall Event Level
by Katarina Zabret, Jože Rakovec, Matjaž Mikoš and Mojca Šraj
Atmosphere 2017, 8(12), 240; https://doi.org/10.3390/atmos8120240 - 02 Dec 2017
Cited by 29 | Viewed by 4465
Abstract
Part of precipitation is intercepted by forest canopies, while the rest reaches the ground as throughfall or stemflow. This process is influenced by various meteorological variables, of which we have mainly focused on drop diameter and velocity. Rainfall in the open and throughfall [...] Read more.
Part of precipitation is intercepted by forest canopies, while the rest reaches the ground as throughfall or stemflow. This process is influenced by various meteorological variables, of which we have mainly focused on drop diameter and velocity. Rainfall in the open and throughfall under birch and pine trees have both been measured since 2014 in Ljubljana, Slovenia. The results demonstrate that the total throughfall during 3.5 years was 73% and 53% of rainfall under birch and pine trees, respectively. During the 236 analysed events, the median volume diameter was 1.8 mm (±1.7 mm), and kinetic energy between 0.01 mJ/cm2 and 23.3 mJ/cm2 was recorded. We closely analysed the effect of rainfall microstructure on throughfall under pine and birch trees during three specific rainfall events. The increase in drop diameter and fall velocity during a rainfall event instantaneously increased throughfall under pine trees between 25% and 47%, whereas no such changes were observed under birch trees. This may be the consequence of different tree properties of the two species. Additionally, in the case of a saturated canopy, throughfall under pine trees exceeded rainfall in the open after an onset of larger and faster drops. Full article
Show Figures

Figure 1

1618 KiB  
Article
Concentration and Size Distribution of Culturable Bacteria in Ambient Air during Spring and Winter in Gliwice: A Typical Urban Area
by Ewa Brągoszewska, Anna Mainka and Jozef S. Pastuszka
Atmosphere 2017, 8(12), 239; https://doi.org/10.3390/atmos8120239 - 01 Dec 2017
Cited by 49 | Viewed by 6030
Abstract
The concentrations and size distributions of culturable bacterial aerosols were measured during spring and winter in outdoor air in Gliwice, Upper Silesia, Poland. This research on culturable bacteria was carried over a period of two years. The samples were collected using a six-stage [...] Read more.
The concentrations and size distributions of culturable bacterial aerosols were measured during spring and winter in outdoor air in Gliwice, Upper Silesia, Poland. This research on culturable bacteria was carried over a period of two years. The samples were collected using a six-stage Andersen cascade impactor (with aerodynamic cut-off diameters of 7.0, 4.7, 3.3, 2.1, 1.1, and 0.65 μm). The results showed that the average concentration of culturable bacterial aerosol was 355 CFU m−3 in spring, which was four times higher than during winter (65 CFU m−3). Bacterial aerosol concentrations showed the unimodal size distribution with the highest range of 3.3–4.7 μm particles. The seasonal distributions of bacterial aerosol grain clearly indicate that, in winter, the size distribution of particles <7 μm is more “flattened” and is characterized by an increased share of fine fractions and a decreased share of coarse ones. Environmental parameters, such as temperature, UV radiation, relative humidity, wind velocity, as well as PM10 and PM2.5 concentrations, were measured in order to analyse whether environmental factors had any effect on bacterial aerosols. Statistically, the most important meteorological factors in the viability of airborne bacteria were temperature and UV radiation. Full article
(This article belongs to the Special Issue Biological Particles in Atmosphere)
Show Figures

Figure 1

1964 KiB  
Article
An Effective Surrogate Tracer Technique for S. aureus Bioaerosols in a Mechanically Ventilated Hospital Room Replica Using Dilute Aqueous Lithium Chloride
by Marco-Felipe King, Miller Alonso Camargo-Valero, Adriana Matamoros-Veloza, P. Andrew Sleigh and Catherine J. Noakes
Atmosphere 2017, 8(12), 238; https://doi.org/10.3390/atmos8120238 - 01 Dec 2017
Cited by 5 | Viewed by 4362
Abstract
Finding a non-pathogenic surrogate aerosol that represents the deposition of typical bioaerosols in healthcare settings is beneficial from the perspective of hospital facility testing, general infection control and outbreak analysis. This study considers aerosolization of dilute aqueous lithium chloride (LiCl) and sodium chloride [...] Read more.
Finding a non-pathogenic surrogate aerosol that represents the deposition of typical bioaerosols in healthcare settings is beneficial from the perspective of hospital facility testing, general infection control and outbreak analysis. This study considers aerosolization of dilute aqueous lithium chloride (LiCl) and sodium chloride (NaCl) solutions as surrogate tracers capable of representing Staphylococcus aureus bioaerosol deposition on surfaces in mechanically ventilated rooms. Tests were conducted in a biological test chamber set up as a replica hospital single patient room. Petri dishes on surfaces were used to collect the Li, Na and S. aureus aerosols separately after release. Biological samples were analyzed using cultivation techniques on solid media, and flame atomic absorption spectroscopy was used to measure Li and Na atom concentrations. Spatial deposition distribution of Li tracer correlated well with S. aureus aerosols (96% of pairs within a 95% confidence interval). In the patient hospital room replica, results show that the most contaminated areas were on surfaces 2 m away from the source. This indicates that the room’s airflow patterns play a significant role in bioaerosol transport. NaCl proved not to be sensitive to spatial deposition patterns. LiCl as a surrogate tracer for bioaerosol deposition was most reliable as it was robust to outliers, sensitive to spatial heterogeneity and found to require less replicates than the S. aureus counterpart to be in good spatial agreement with biological results. Full article
(This article belongs to the Special Issue Indoor Air Pollution)
Show Figures

Figure 1

1108 KiB  
Article
Integrated Regional Enstrophy and Block Intensity as a Measure of Kolmogorov Entropy
by Andrew D. Jensen, Anthony R. Lupo, Igor I. Mokhov, Mirseid G. Akperov and DeVondria D. Reynolds
Atmosphere 2017, 8(12), 237; https://doi.org/10.3390/atmos8120237 - 29 Nov 2017
Cited by 13 | Viewed by 3275
Abstract
Enstrophy in a fluid relates to the dissipation tendency in a fluid that has use in studying turbulent flows. It also corresponds to vorticity as kinetic energy does to velocity. Earlier work showed that the integrated regional enstrophy (IRE) was related to the [...] Read more.
Enstrophy in a fluid relates to the dissipation tendency in a fluid that has use in studying turbulent flows. It also corresponds to vorticity as kinetic energy does to velocity. Earlier work showed that the integrated regional enstrophy (IRE) was related to the sum of the positive Lyapunov exponents. Lyapunov exponents are the characteristic exponent(s) of a dynamic system or a measure of the divergence or convergence of system trajectories that are initially close together. Relatively high values of IRE derived from an atmospheric flow field in the study of atmospheric blocking was identified with the onset or demise of blocking events, but also transitions of the large-scale flow in general. Kolmogorv–Sinai Entropy (KSE), also known as metric entropy, is related to the sum of the positive Lyapunov exponents as well. This quantity can be thought of as a measure of predictability (higher values, less predictability) and will be non-zero for a chaotic system. Thus, the measure of IRE is related to KSE as well. This study will show that relatively low (high) values of IRE derived from atmospheric flows correspond to a more stable (transitioning) large-scale flow with a greater (lesser) degree of predictability and KSE. The transition is least predictable and should be associated with higher IRE and KSE. Full article
(This article belongs to the Section Meteorology)
Show Figures

Figure 1

2128 KiB  
Article
Estimating Uncertainty in Global Mercury Emission Source and Deposition Receptor Relationships
by Francesco De Simone, Ian M. Hedgecock, Francesco Carbone, Sergio Cinnirella, Francesca Sprovieri and Nicola Pirrone
Atmosphere 2017, 8(12), 236; https://doi.org/10.3390/atmos8120236 - 29 Nov 2017
Cited by 11 | Viewed by 3790
Abstract
Establishing mercury (Hg) source-receptor (SR) relationship matrices provides a tool to improve the understanding of the geographic relationship between regions of Hg release and its eventual deposition. SR relationship matrices are therefore a useful starting point for the development of policies aimed at [...] Read more.
Establishing mercury (Hg) source-receptor (SR) relationship matrices provides a tool to improve the understanding of the geographic relationship between regions of Hg release and its eventual deposition. SR relationship matrices are therefore a useful starting point for the development of policies aimed at reducing the impact of Hg emissions from anthropogenic activities (Hganthr) on sensitive ecosystems and areas potentially at risk of Hg contamination. A global Chemical Transport Model (CTM) has been used to simulate the emission, transport and fate of Hganthr from 12 source regions, considering a range of uncertainty in the modelled chemical and physical processes. This ensemble of simulations gives an estimate of the Hg deposition which derives from each source region, as well as an estimate of the uncertainty of the calculated deposition flux. The uncertainty has been calculated using the bootstrap method to estimate this uncertainty in terms of the normalised confidence interval amplitude of the mean (NCIAM). Within the calculated confidence ranges, for almost all regions the contribution to the Hg deposition flux from remote sources is greater than that from domestic sources. Europe and South Asia, where the contributions are statistically indistinguishable, are exceptions, as is East Asia, with local sources dominating the Hg deposition flux. East Asia is the single most important remote source region for most receptor regions. The results yield such high uncertainties in the deposition flux for many receptor regions that the results are unlikely to be taken into consideration by policy makers. This uncertainty is particularly relevant when considering the “domestic” contribution to regional deposition, highlighting the need for more studies to resolve remaining uncertainties in the atmospheric Hg cycle, and Hganthr emission inventories. Full article
(This article belongs to the Special Issue Atmospheric Metal Pollution)
Show Figures

Figure 1

1417 KiB  
Communication
MJO Modulating the Activity of the Leading Mode of Intraseasonal Variability in South America
by Mariano S. Alvarez, Carolina S. Vera and George N. Kiladis
Atmosphere 2017, 8(12), 232; https://doi.org/10.3390/atmos8120232 - 28 Nov 2017
Cited by 25 | Viewed by 5793
Abstract
Intraseasonal (IS) variability in South America is efficiently described through the first empirical orthogonal function of filtered precipitation or outgoing longwave radiation (OLR) anomalies. In the 30–90-day band, the leading OLR pattern between October and April is a dipole with centers of action [...] Read more.
Intraseasonal (IS) variability in South America is efficiently described through the first empirical orthogonal function of filtered precipitation or outgoing longwave radiation (OLR) anomalies. In the 30–90-day band, the leading OLR pattern between October and April is a dipole with centers of action in the South Atlantic Convergence Zone (SACZ) and southeastern South America (SESA). The Madden Julian Oscillation (MJO) was shown to have an impact on the rainfall in South America, with greater influence during the austral warm season. The aim of this study is therefore to assess the modulation of the MJO in the activity of the leading pattern of variability in South America, named the 3090-Seasonal-Intraseasonal (SIS) pattern. It was found that the most intense periods of activity of the SIS pattern appear to be related to intense MJO events with coherent eastward propagation. Furthermore, positive 3090-SIS phases, associated with enhanced (inhibited) convection over the SESA (SACZ) region generally occur during MJO progression from the eastern Indian Ocean to the Western Pacific (i.e., Maritime Continent sector). On the contrary, negative 3090-SIS phases, associated with enhanced (inhibited) convection over SACZ (SESA) are observed when the MJO active phase locates between the Western Pacific and the western Indian Ocean (African sector). The 3090-SIS pattern modulation by the MJO opens the opportunity to develop skillful subseasonal prediction tools in South America. Full article
(This article belongs to the Special Issue Madden-Julian Oscillation)
Show Figures

Figure 1

3350 KiB  
Article
North Atlantic and Indian Ocean links with Iraq Climate
by Jasim Al-Khalidi, Mihai Dima, Petru Vaideanu and Sabina Stefan
Atmosphere 2017, 8(12), 235; https://doi.org/10.3390/atmos8120235 - 26 Nov 2017
Cited by 6 | Viewed by 5831
Abstract
We investigate the connections of the North Atlantic and Indian Ocean sectors with Iraq winter/summer temperature and precipitation. Canonical Correlation Analyses (CCAs) are performed in order to identify potential links between Iraq climate and the atmospheric circulation over these two regions. Regression maps [...] Read more.
We investigate the connections of the North Atlantic and Indian Ocean sectors with Iraq winter/summer temperature and precipitation. Canonical Correlation Analyses (CCAs) are performed in order to identify potential links between Iraq climate and the atmospheric circulation over these two regions. Regression maps of 200 hPa and 500 hPa geopotential height and sea level pressure fields on the time series derived through CCAs are constructed in order to infer the physical mechanisms connecting the North Atlantic and Indian Ocean regions with Iraq climate. The winter temperature in this country is linked with the North Atlantic Scandinavian pattern, whereas the winter precipitation is associated with the North Atlantic Oscillation. In the free atmosphere, the connection with Iraq temperature is provided by Rossby waves, while the winter precipitation is linked to a more zonal structure. At surface, the air advection is a relevant mechanism through which North Atlantic modes appear to affect Iraq climate. Full article
(This article belongs to the Section Meteorology)
Show Figures

Figure 1

1291 KiB  
Article
Annual Variability of Black Carbon Concentrations Originating from Biomass and Fossil Fuel Combustion for the Suburban Aerosol in Athens, Greece
by Evangelia Diapouli, Athina-Cerise Kalogridis, Christina Markantonaki, Stergios Vratolis, Prodromos Fetfatzis, Cristina Colombi and Konstantinos Eleftheriadis
Atmosphere 2017, 8(12), 234; https://doi.org/10.3390/atmos8120234 - 25 Nov 2017
Cited by 59 | Viewed by 5184
Abstract
The objective of this work was to assess the yearly contribution of fossil fuel combustion (BCff) and wood burning (BCwb) to equivalent black carbon (eBC) concentrations, in Athens, Greece. Measurements were conducted at a suburban site from March 2013 [...] Read more.
The objective of this work was to assess the yearly contribution of fossil fuel combustion (BCff) and wood burning (BCwb) to equivalent black carbon (eBC) concentrations, in Athens, Greece. Measurements were conducted at a suburban site from March 2013 to February 2014 and included absorption coefficients at seven wavelengths and PM2.5 chemical composition data for key biomass burning markers, i.e., levoglucosan, potassium (K) and elemental and organic carbon (EC, OC). A well-documented methodology of corrections for aethalometer attenuation coefficients was applied with a resulting annual dataset of derived absorption coefficients for the suburban Athens’ atmospheric aerosol. The Aethalometer model was applied for the source apportionment of eBC. An optimum Ångström exponent for fossil fuel (αff) was found, based on the combined use of the model with levoglucosan data. The measured eBC concentrations were equal to 2.4 ± 1.0 μg m−3 and 1.6 ± 0.6 μg m−3, during the cold and the warm period respectively. The contribution from wood burning was significantly higher during the cold period (21 ± 11%, versus 6 ± 7% in the warm period). BCff displayed a clear diurnal pattern with a morning peak between 8 and 10 a.m. (during morning rush hour) and a second peak during the evening and night hours, due to the shallowing of the mixing layer. Regression analysis between BCwb concentrations and biomass burning markers (levoglucosan, K and OC/EC ratio) supported the validity of the results. Full article
(This article belongs to the Special Issue Carbonaceous Aerosols in Atmosphere)
Show Figures

Figure 1

6629 KiB  
Article
Drop Size Distribution Climatology in Cévennes-Vivarais Region, France
by Sahar Hachani, Brice Boudevillain, Guy Delrieu and Zoubeida Bargaoui
Atmosphere 2017, 8(12), 233; https://doi.org/10.3390/atmos8120233 - 25 Nov 2017
Cited by 20 | Viewed by 4618
Abstract
Mediterranean regions are prone to heavy rainfall, flash floods, and erosion issues. Drop size distribution (DSD) is a key element for studying these phenomena through the hydrological variables which can be derived from it (rainfall rates and totals, kinetic energy fluxes). This paper [...] Read more.
Mediterranean regions are prone to heavy rainfall, flash floods, and erosion issues. Drop size distribution (DSD) is a key element for studying these phenomena through the hydrological variables which can be derived from it (rainfall rates and totals, kinetic energy fluxes). This paper proposes a five-year (2012–2016) DSD climatology, summarized by scaling parameters for concentration, size, and shape. The DSD network is composed of two longitudinal transects of three OTT Parsivel optical disdrometers each, across the Mediterranean Cevennes–Vivarais region. The influence of several factors are analysed: location (distance from the sea, orographic environment), season, daily synoptic weather situation (derived from geopotential heights, at 700 and 1000 hPa), rainfall type (analysed from 5 min radar data), as well as some combinations of these factors. It was found and/or confirmed that the orographic environment, season, weather patterns associated with the exposure to low level atmospheric flows, and rainfall types influenced the microphysical processes, leading to rainfall, measured at the ground. Consequently, the DSD characteristics, as well as the relationships between the rainfall rate and reflectivity factor, are influenced by these factors. Full article
(This article belongs to the Section Meteorology)
Show Figures

Figure 1

1047 KiB  
Article
Practical Field Calibration of Portable Monitors for Mobile Measurements of Multiple Air Pollutants
by Chun Lin, Nicola Masey, Hao Wu, Mark Jackson, David J. Carruthers, Stefan Reis, Ruth M. Doherty, Iain J. Beverland and Mathew R. Heal
Atmosphere 2017, 8(12), 231; https://doi.org/10.3390/atmos8120231 - 23 Nov 2017
Cited by 23 | Viewed by 5474
Abstract
To reduce inaccuracies in the measurement of air pollutants by portable monitors it is necessary to establish quantitative calibration relationships against their respective reference analyser. This is usually done under controlled laboratory conditions or one-off static co-location alongside a reference analyser in the [...] Read more.
To reduce inaccuracies in the measurement of air pollutants by portable monitors it is necessary to establish quantitative calibration relationships against their respective reference analyser. This is usually done under controlled laboratory conditions or one-off static co-location alongside a reference analyser in the field, neither of which may adequately represent the extended use of portable monitors in exposure assessment research. To address this, we investigated ways of establishing and evaluating portable monitor calibration relationships from repeated intermittent deployment cycles over an extended period involving stationary deployment at a reference site, mobile monitoring, and completely switched off. We evaluated four types of portable monitors: Aeroqual Ltd. (Auckland, New Zealand) S500 O3 metal oxide and S500 NO2 electrochemical; RTI (Berkeley, CA, USA) MicroPEM PM2.5; and, AethLabs (San Francisco, CA, USA) AE51 black carbon (BC). Innovations in our study included: (i) comparison of calibrations derived from the individual co-locations of a portable monitor against its reference analyser or from all the co-location periods combined into a single dataset; and, (ii) evaluation of calibrated monitor estimates during transient measurements with the portable monitor close to its reference analyser at separate times from the stationary co-location calibration periods. Within the ~7 month duration of the study, ‘combined’ calibration relationships for O3, PM2.5, and BC monitors from all co-locations agreed more closely on average with reference measurements than ‘individual’ calibration relationships from co-location deployment nearest in time to transient deployment periods. ‘Individual’ calibrations relationships were sometimes substantially unrepresentative of the ‘combined’ relationships. Reduced quantitative consistency in field calibration relationships for the PM2.5 monitors may have resulted from generally low PM2.5 concentrations that were encountered in this study. Aeroqual NO2 monitors were sensitive to both NO2 and O3 and unresolved biases. Overall, however, we observed that with the ‘combined’ approach, ‘indicative’ measurement accuracy (±30% for O3, and ±50% for BC and PM2.5) for 1 h time averaging could be maintained over the 7-month period for the monitors evaluated here. Full article
(This article belongs to the Section Air Quality)
Show Figures

Figure 1

Previous Issue
Next Issue
Back to TopTop