Abstract
Drought–flood abrupt alternation (DFAA) events have emerged as a critical type of compound climate extreme under ongoing climate change, posing increasing risks to water resources and ecosystems in Southwest China. This study investigated the spatiotemporal evolution of DFAA events during the historical period (1995–2024) and the future period (2025–2064), as well as their relationships with evapotranspiration. Daily precipitation was simulated using a CMIP6 multi-model ensemble mean (MME) combined with Delta downscaling, while station observations were used to identify DFAA events and evapotranspiration. Model performance was evaluated using Taylor diagrams and simulation relative bias. The results showed that the downscaled MME substantially improved the simulation of precipitation, evapotranspiration, and cumulative DFAA event occurrences, with relative bias in most regions controlled within ±3%. Compared with the historical period, both drought-to-flood (DTF) and flood-to-drought (FTD) events showed overall increases during 2025–2064. Specifically, under the four SSP scenarios, DTF events increased by 165, 133, 180, and 140 occurrences, respectively, while FTD events increased by 130, 147, 114, and 79 occurrences, respectively. The regional mean trends of DTF events during the near-term period were −0.21, 0.16, −0.45, and 1.24 times·5a−1, whereas the corresponding trends of FTD events were 1.82, 1.17, 0.05, and −1.03 times·5a−1 under the four scenarios. Spatial analyses revealed pronounced regional heterogeneity, with enhanced signals mainly concentrated in eastern Sichuan, Chongqing, and parts of Guizhou. Lagged correlation analyses further indicated significant monthly lag effects between DFAA events and evapotranspiration during the flood season; DTF events generally showed positive correlations with subsequent evapotranspiration, whereas FTD events exhibited predominantly negative correlations. Overall, this study clarifies the future spatiotemporal evolution of DFAA events in Southwest China and highlights the important role of land–atmosphere hydrothermal processes in regulating compound drought–flood extremes.
1. Introduction
Under the combined influence of climate change and intensified human activities, extreme hydrometeorological events, such as droughts and floods, have increased significantly in both frequency and intensity worldwide, presenting growing risks to ecosystems, agricultural production, and socio-economic systems [1]. In recent years, there has been a surge in research on compound climate events, which arise from the interaction or sequential occurrence of multiple climatic drivers or hazards. The Intergovernmental Panel on Climate Change (IPCC) first introduced the concept of compound events in its Special Report during the Fifth Assessment Report, marking an important milestone in climate risk research [2]. Unlike single-hazard events, compound events tend to produce amplified impacts and more complex disaster chains, leading to substantially higher overall risk levels [3,4].
Among various types of compound events, Drought–flood abrupt alternation (DFAA) events represent a particularly destructive form. These events are characterized by a rapid transition from drought to flood or from flood to drought within a short period in the same region [5]. Such abrupt hydrological shifts can severely disrupt water resource management, agricultural systems, and disaster mitigation strategies. Recent catastrophic events, including the prolonged drought followed by extreme rainfall in São Paulo State during 2013–2014 and the pronounced DTF transition in northern China during the summer of 2023, underscore the significant socio-economic consequences of DFAA events. These events highlight the urgent need for better understanding of their mechanisms and future evolution under climate change.
Early research on DFAA events primarily focused on the development of quantitative indices to characterize abrupt drought–flood transitions. Long-cycle and short-cycle DFAA indices were proposed to describe such events at monthly or seasonal time scales. Later studies incorporated soil moisture and standardized indicators to address the limitations of precipitation-threshold-based methods [6]. With the increasing availability of high-resolution daily datasets, recent studies have extended DFAA event identification to daily scales using indices such as the dry–wet abrupt alternation index, revealing pronounced seasonal variability and regional heterogeneity in DFAA events [7,8,9]. Furthermore, advancements in machine learning and hybrid modeling frameworks have improved the identification and prediction capabilities of DFAA events at finer spatial and temporal resolutions [10].
The Coupled Model Intercomparison Project Phase 6 (CMIP6) offers a comprehensive framework for assessing future climate change and associated extreme events under various socioeconomic pathways. CMIP6-based studies have been widely applied to investigate droughts, floods, heat extremes, and compound events [11,12,13,14]. However, previous research has shown that climate models that perform well in simulating single extremes may not necessarily reproduce compound events with comparable accuracy, underscoring the necessity of model evaluation and ensemble approaches before application [15]. Although recent CMIP6-based studies suggest potential intensification of DFAA events in several major river basins of China, comprehensive regional-scale assessments remain limited [14,16].
Evapotranspiration plays a critical role in regulating soil moisture availability, agricultural drought, and ecosystem resilience, as it is a fundamental component of land–atmosphere water and energy exchanges. It not only governs surface water depletion but also influences atmospheric humidity and the energy balance, indirectly affecting precipitation patterns. DFAA events are inherently linked to evapotranspiration through drought-induced soil moisture depletion and post-flood water redistribution. Despite increasing recognition of the role of evapotranspiration in extreme hydroclimatic events, the coupling between DFAA events and evapotranspiration—particularly at monthly time scales within a compound-event framework—remains insufficiently explored [17].
Southwest China is characterized by highly complex topography and climate conditions, influenced by the Tibetan Plateau and multiple monsoon systems, which lead to significant hydroclimatic variability and a high sensitivity to DFAA events. While previous studies have documented the spatial and temporal characteristics of DFAA events in this region, integrated studies combining CMIP6-based future projections, multi-model ensemble approaches, and evapotranspiration responses are still scarce [18,19,20]. To fill this gap, this study aims to: (1) evaluate the applicability of a CMIP6 multi-model ensemble approach for simulating DFAA events in Southwest China; (2) assess the spatiotemporal evolution of DFAA events under four Shared Socioeconomic Pathway (SSP) scenarios (SSP1-2.6, SSP2-4.5, SSP3-7.0, and SSP5-8.5) during 2025–2064; and (3) examine the monthly relationships between DFAA event frequency and evapotranspiration. By integrating future climate projections with an analysis of evapotranspiration–DFAA relationships, this study provides new insights into the behavior of compound drought–flood events in Southwest China. In particular, the study highlights the regional characteristics of DFAA events in a complex terrain and monsoon-influenced environment, evaluates their potential future evolution under multiple climate scenarios, and explores their statistical associations with evapotranspiration. These aspects help to better reveal the hydroclimatic dynamics of compound extremes in Southwest China under climate change. The results are expected to provide scientific insights into future compound drought–flood risks and improve understanding of land–atmosphere interactions under climate change.
2. Materials and Methods
2.1. Study Areas
The study area of Southwest China includes Yunnan Province, Sichuan Province, Guizhou Province, Chongqing Municipality, and the Guangxi Zhuang Autonomous Region, spanning from 20°54′ to 34°19′ N and from 97°21′ to 112°04′ E. This region is characterized by highly complex topography, serving as a transitional zone where plateaus, mountains, and basins intersect, with elevations ranging from approximately −20 m to 5260 m above sea level. The combined dynamic and thermodynamic influences of the Tibetan Plateau, along with multiple monsoon circulation systems, create a climate that exhibits pronounced spatial heterogeneity and temporal variability. The complex mountainous terrain leads to distinct vertical climate gradients [21]. Due to the influence of the monsoon system, the regional distribution of heat and moisture is highly uneven, resulting in a sharp contrast between the dry and wet seasons, which is often accompanied by frequent meteorological disasters. The mean annual precipitation in the region ranges from 800 to 2000 mm, while the mean annual temperature varies between 14 and 22 °C [22]. Precipitation is primarily concentrated during the flood season from May to September, driven mainly by the Bay of Bengal monsoon and the western Pacific subtropical high, making the region particularly susceptible to DFAA events. Figure 1 shows the geographical location of the study area, the digital elevation model (DEM), and the spatial distribution of meteorological stations.
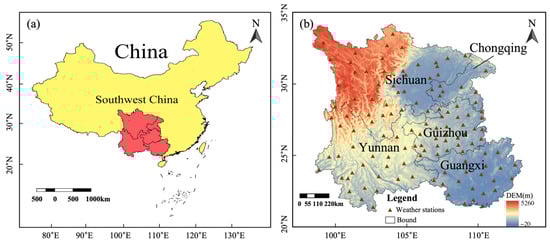
Figure 1.
Geographical location (a), DEM and spatial distribution of meteorological stations (b) in Southwest China. In panel (a), yellow indicates China, and red indicates Southwest China.
2.2. Data Sources
Daily precipitation and evapotranspiration data from 124 meteorological stations across Southwest China for the period 1995–2024 were obtained from the China Surface Climate Daily Dataset (V3.0), provided by the National Meteorological Science Data Center (https://data.cma.cn). For all selected stations, the proportion of missing observations was less than 7%. Missing values were filled using the long-term daily climatological mean corresponding to each calendar day. All datasets underwent stringent quality control and homogenization procedures to ensure their accuracy and reliability. Based on previous evaluations of CMIP6 model performance over Southwest China conducted by our research group [22,23,24,25,26], five CMIP6 global climate models with relatively good regional applicability and complete daily precipitation outputs were selected (Table 1). Model data were sourced from the Earth System Grid Federation (“https://esgf-node.llnl.gov/search/cmip6/ (accessed on 25 March 2025)”), including simulations for the historical baseline period (1995–2014) and two future periods, the near-term period (2025–2044) and the long-term period (2045–2064), under four SSP scenarios (SSP1-2.6, SSP2-4.5, SSP3-7.0, and SSP5-8.5). These scenarios represent low-, medium-, high-, and very high-emission pathways under different socioeconomic development trajectories and are widely utilized in climate change impact assessments [27]. To ensure spatial consistency between observational data and model outputs, the station-based precipitation and evapotranspiration observations from the 124 meteorological stations were first interpolated onto a uniform grid of 0.25° × 0.25°. Subsequently, all CMIP6 precipitation and evapotranspiration data were interpolated to the same spatial resolution using bilinear interpolation.

Table 1.
Basic information of the five selected CMIP6 climate models.
2.3. Methods
2.3.1. Identification of Drought–Flood Abrupt Alternation Events
DFAA events in Southwest China were identified using the daily-scale drought–flood abrupt alternation index (DSDFAAI) proposed by Shan et al. [7]. The index is defined as:
where DSDFAAI denotes the daily drought–flood abrupt alternation index; SPAbefore and SPAafter represent the standardized precipitation anomalies (SPAs) before and after the transition, respectively; and SAPI0 denote the standardized antecedent precipitation index (SAPI) anomalies for the i-th day of the subsequent period and the final day of the preceding period, respectively; n is the length of the subsequent period; is a weighting coefficient; and K represents the cumulative slope of daily relative to SAPI0 during the later period.
Given the distinct temporal dynamics of drought and flood processes, the durations of the drought and flood periods are treated separately. Previous studies have demonstrated that the influence of antecedent precipitation on drought or flood occurrence follows an exponential decay, with precipitation from 44 days prior contributing less than 0.1% to the current conditions [28]. Consequently, the drought period was set to 44 days. In contrast, flooding events are typically brief and sudden; assigning an overly long duration to the flood period may neutralize the drought–flood alternation. Considering the climatic characteristics of Southwest China and practical considerations, the flood period was set to 10 days. The degrees of “abruptness” and “alternation” in DFAA events were quantified using specific parameters and , respectively. The typical range for the parameter a is between 0.8 and 3.0 [8], and based on a review of relevant literature and the specific conditions in Southwest China, this study adopted a = 1.0. A DFAA event was identified when the absolute value of the DSDFAAI was greater than or equal to 10 [20]. For consecutive days meeting this criterion, the day corresponding to the maximum absolute DSDFAAI was defined as the event occurrence date.
To improve the reliability of event identification, a verification procedure based on the daily Standardized Precipitation Evapotranspiration Index (SPEI) was applied. After preliminary identification using DSDFAAI, events were retained only when the SPEI during the drought phase was ≤−0.5 and the SPEI during the flood phase was ≥0.5.
2.3.2. Evaluation of CMIP6 Model Performance
The performance of CMIP6 precipitation and evapotranspiration simulations was evaluated using Taylor diagrams and the relative bias metric (SRB). Taylor diagrams provide a concise statistical summary of the agreement between simulated and observed datasets by comparing the standard deviation (RD), correlation coefficient (CC), and root mean square error (RMSE) [29]. An RSD value close to 1 indicates that the variability between simulations and observations is similar; a CC value close to 1 reflects strong linear agreement; and a smaller RMSE indicates higher simulation accuracy [30].
The SRB metric was used to assess the long-term mean bias between simulated and observed precipitation fields. An SRB value near zero indicates good agreement between the climatological means of simulations and observations [31]. The formulations for SD, CC, RMSE, and SRB are as follows:
where x and y denote simulated and observed datasets, respectively; xi and yi represent the i-th samples; and are the corresponding means; and n is the sample size.
2.3.3. Delta Downscaling Analysis
Climate model simulations often contain systematic biases that should be corrected before being applied at the regional scale. Following previous studies [32], a Delta downscaling method was employed to bias-correct CMIP6 precipitation outputs. This approach establishes a statistical relationship between modeled and observed climatological means during the baseline period and applies this relationship to future simulations, thereby reducing systematic bias. The Delta-corrected precipitation series is expressed as:
where is the bias-corrected precipitation series, Pma is the modeled precipitation series, Pmb is the multi-year mean modeled precipitation during the baseline period, and Po is the multi-year mean observed precipitation during the same period (mm) [33]. The bias-corrected datasets were then used to identify and project future DFAA events.
2.3.4. Morlet Wavelet Analysis
Wavelet analysis was applied to investigate the periodic characteristics and temporal evolution of DFAA events under different future scenarios. Unlike traditional spectral analysis methods, wavelet analysis allows for the simultaneous examination of both time and frequency (scale) domains, making it particularly suited for non-stationary climate time series. The Morlet wavelet consists of a sinusoidal carrier modulated by a Gaussian envelope, and its continuous wavelet transform yields complex coefficients.
The modulus of the wavelet coefficients reflects the signal’s amplitude or energy intensity at specific time-frequency locations, while the phase information describes the temporal evolution of oscillatory behavior. This method facilitates the identification of dominant periodicities and their temporal variability in DFAA event series [34].
2.3.5. Correlation Analysis Between Evapotranspiration and DFAA Events
To quantify the statistical linkage between land surface hydrothermal processes (evapotranspiration) and compound hydroclimatic extremes, this study calculated the Pearson correlation coefficients between monthly evapotranspiration and the occurrence frequency of DFAA events, accompanied by statistical significance testing. The Pearson correlation coefficient is widely used to measure the degree of linear association between two variables that follow normal or approximately normal distributions. The calculation of the is presented in Equation (4), where represents the monthly cumulative occurrences of DFAA events, denotes the corresponding evapotranspiration values, and represent the sample means of the two variables, and is the sample size. To evaluate the statistical significance of the correlation coefficients, a two-tailed Student’s t-test was applied, with significance levels defined at , and .
Furthermore, considering that the interaction between evapotranspiration and DFAA events may involve delayed responses in land–atmosphere processes, lead–lag correlation analyses were conducted by shifting the evapotranspiration series forward or backward by one month relative to the DFAA event series. This analysis was used to examine whether evapotranspiration anomalies may exert antecedent influences on the occurrence of DFAA events or represent lagged responses following the transitions.
3. Results
3.1. Evaluation of CMIP6 Model Performance and Delta Downscaling During the Baseline Period
The simulation performance of CMIP6 models over Southwest China during the baseline period (1995–2014) was initially assessed using Taylor diagrams, followed by an evaluation of the effectiveness of Delta downscaling in reducing biases in the simulated cumulative occurrences of DFAA events. Figure 2 presents the Taylor diagrams comparing observed and simulated annual mean precipitation and evapotranspiration based on five individual CMIP6 models and their equally weighted multi-model ensemble mean (MME).
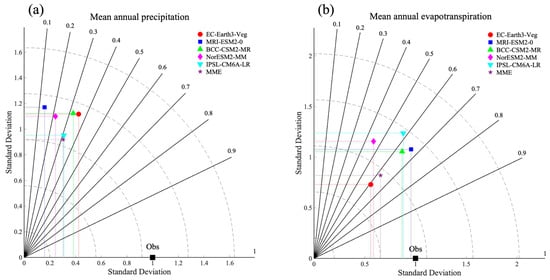
Figure 2.
Taylor diagrams of mean annual precipitation and mean annual evapotranspiration simulated by CMIP6 models over Southwest China during the baseline period (1995–2014). (a) Mean annual precipitation; (b) Mean annual evapotranspiration.
For mean annual precipitation (Figure 2a), the individual models exhibited considerable dispersion in both SD and CC, with CC values ranging from 0.10 to 0.40 and RMSE values between 1.15 and 1.71 mm. In contrast, the MME showed the lowest RMSE (1.15 mm), an SD closer to observations (0.31 mm), and a relatively higher CC (0.32), indicating that ensemble averaging effectively reduced random errors and enhanced the robustness of precipitation simulations. For mean annual evapotranspiration (Figure 2b), overall simulation performance was notably better than that for precipitation. The CCs of individual models ranged from 0.40 to 0.70, and the MME again outperformed all single models, with an RMSE of 0.93 mm, an SD of 0.75 mm, and a CC of 0.62. These results suggest that the MME captured both the magnitude and variability of evapotranspiration more reliably than individual CMIP6 models.
Overall, Figure 2 demonstrates that the MME provided the most consistent and stable simulations of both precipitation and evapotranspiration over Southwest China during the baseline period. Based on the superior performance of the MME, Delta downscaling was applied to the baseline-period MME precipitation data to further improve the simulation of DFAA events. Figure 3 presents the spatial distribution of the SRB between the simulated and observed annual mean cumulative occurrences of DFAA events, both before and after applying Delta downscaling.
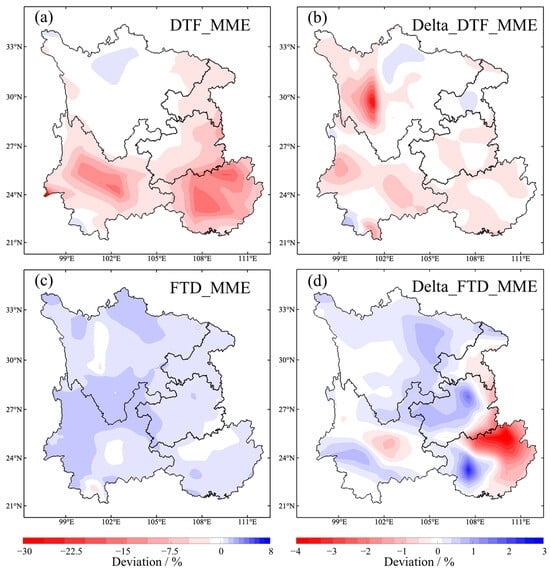
Figure 3.
Spatial distribution of the SRB between simulated and observed annual mean cumulative occurrences of DFAA events in Southwest China during the baseline period before and after Delta downscaling based on the MME (DTF denotes drought-to-flood events, FTD denotes flood-to-drought events, and SRB denotes simulation relative bias). (a) DTF_MME; (b) Delta_DTF_MME; (c) FTD_MME; (d) Delta_FTD_MME.
Prior to downscaling (Figure 3a,c), both DTF and FTD events exhibited predominantly negative SRB values across Southwest China, indicating a systematic underestimation of event frequencies by the raw MME simulations. For DTF events, pronounced negative biases were particularly evident in the southern Sichuan Basin, eastern Yunnan, and parts of Guangxi. After applying Delta downscaling (Figure 3b), the spatial pattern of SRB for DTF events became noticeably more homogeneous, with most regions showing SRB values near zero, and large negative biases were substantially reduced.
A similar improvement was observed for FTD events. Before downscaling (Figure 3c), SRB values were relatively uniform but remained predominantly negative, reflecting an overall underestimation of FTD transitions. Following Delta downscaling (Figure 3d), the magnitude of SRB was significantly reduced across most of the study area, with deviations generally constrained within ±2%. However, localized positive biases appeared in parts of southeastern Guangxi. This indicates that while Delta downscaling effectively reduced regional-scale systematic bias, it also enhanced the representation of local spatial variability.
In summary, the combined evidence from Figure 2 and Figure 3 demonstrated that the CMIP6 MME significantly outperformed individual models in simulating baseline precipitation and evapotranspiration. Additionally, Delta downscaling further enhanced the reliability of simulated DFAA event frequencies by substantially reducing systematic spatial biases. These results established a solid foundation for subsequent analyses of future DFAA events.
3.2. Temporal Variations in DFAA Events
Based on the Delta-downscaled MME precipitation data, DFAA events in Southwest China during the period 1995–2064 were identified using the DSDFAAI. The temporal variations analyzed in this section represent the cumulative occurrences of DFAA events aggregated over the entire study region. Temporal variations in the annual cumulative occurrences of DFAA events were analyzed for the historical period (1995–2024) as well as for the future near-term (2025–2044) and long-term (2045–2064) periods under four different scenarios (Figure 4), along with their corresponding trends (Figure 5).
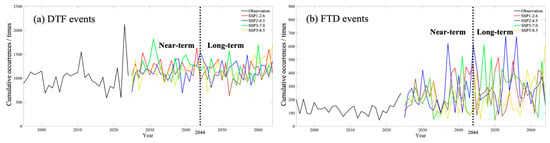
Figure 4.
Temporal variations in cumulative occurrences of DFAA events in Southwest China during different periods from 1995 to 2064. (a) DTF events; (b) FTD events.
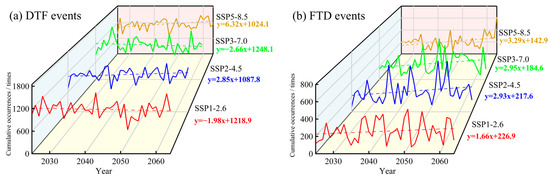
Figure 5.
Trends in cumulative occurrences of DFAA events in Southwest China under different scenarios during 2025–2064. (a) DTF events; (b) FTD events.
As shown in Figure 4 and Figure 5, the mean annual cumulative occurrence of DTF events during the historical period was 1013. Under the four future scenarios, the cumulative occurrences of DTF events during 2025–2064 varied from 636 (in 2052 under SSP1-2.6) to 1823 (in 2031 under SSP3-7.0). The annual mean cumulative occurrences of DTF events over 2025–2064 were 1178 under SSP1-2.6, 1146 under SSP2-4.5, 1193 under SSP3-7.0, and 1153 under SSP5-8.5, representing increases of 165, 133, 180, and 140 events, respectively, compared with the historical period. Trend analysis indicated that the cumulative occurrences of DTF events exhibited increasing trends under SSP2-4.5 and SSP5-8.5, while decreasing trends were observed under SSP1-2.6 and SSP3-7.0 during the future 40-year period. During the historical period, the annual mean cumulative occurrences of FTD events were 131. For the period 2025–2064, the cumulative occurrences of FTD events under the four scenarios ranged from 45 (in 2050 under SSP3-7.0) to 678 (in 2053 under SSP2-4.5). The corresponding annual mean cumulative occurrences were 261 under SSP1-2.6, 278 under SSP2-4.5, 245 under SSP3-7.0, and 210 under SSP5-8.5, which were higher than the historical period by 130, 147, 114, and 79 events, respectively. The trend analysis further revealed that the annual mean cumulative occurrences of FTD events increased under all four scenarios over the future 40-year period.
3.3. Periodicity Analysis of DFAA Events
The Morlet wavelet transform was applied to the cumulative annual occurrences of DFAA events in Southwest China during the period 2025–2064 under different scenarios. For DTF events, the real part of the wavelet coefficients (Figure 6) and the corresponding wavelet variance (Figure 7) were analyzed, while for FTD events, the real part of the wavelet coefficients (Figure 8) and the wavelet variance (Figure 9) were examined. The real part of the wavelet coefficients was used to characterize the relative intensity of DFAA events, with positive (negative) values indicating above-average (below-average) occurrences, while the dominant periods were identified based on the peaks in the wavelet variance spectra.
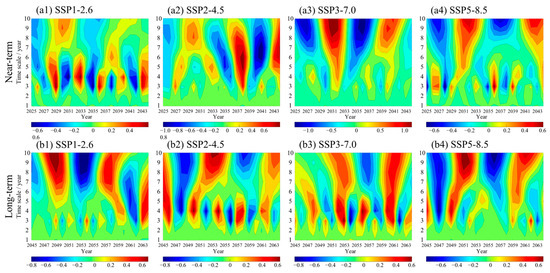
Figure 6.
Real part of the Morlet wavelet coefficients for annual cumulative occurrences of DTF events under different scenarios during the future near-term and long-term periods in Southwest China. (a1) Near-term SSP1-2.6; (a2) Near-term SSP2-4.5; (a3) Near-term SSP3-7.0; (a4) Near-term SSP5-8.5; (b1) Long-term SSP1-2.6; (b2) Long-term SSP2-4.5; (b3) Long-term SSP3-7.0; (b4) Long-term SSP5-8.5.
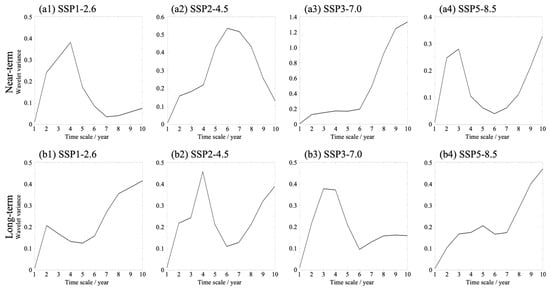
Figure 7.
Wavelet variance of annual cumulative occurrences of DTF events under different scenarios during the future near-term and long-term periods in Southwest China. (a1) Near-term SSP1-2.6; (a2) Near-term SSP2-4.5; (a3) Near-term SSP3-7.0; (a4) Near-term SSP5-8.5; (b1) Long-term SSP1-2.6; (b2) Long-term SSP2-4.5; (b3) Long-term SSP3-7.0; (b4) Long-term SSP5-8.5.
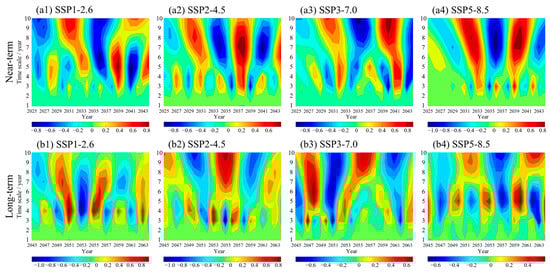
Figure 8.
Real part of the Morlet wavelet coefficients for annual cumulative occurrences of FTD events under different scenarios during the future near-term and long-term periods in Southwest China. (a1) Near-term SSP1-2.6; (a2) Near-term SSP2-4.5; (a3) Near-term SSP3-7.0; (a4) Near-term SSP5-8.5; (b1) Long-term SSP1-2.6; (b2) Long-term SSP2-4.5; (b3) Long-term SSP3-7.0; (b4) Long-term SSP5-8.5.
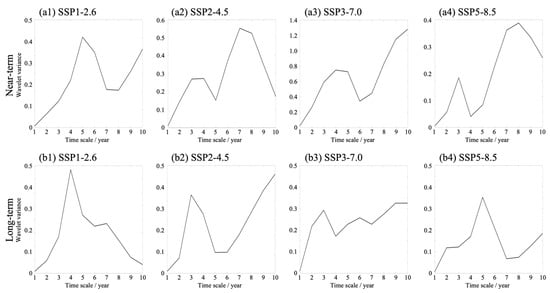
Figure 9.
Wavelet variance of annual cumulative occurrences of FTD events under different scenarios during the future near-term and long-term periods in Southwest China. (a1) Near-term SSP1-2.6; (a2) Near-term SSP2-4.5; (a3) Near-term SSP3-7.0; (a4) Near-term SSP5-8.5; (b1) Long-term SSP1-2.6; (b2) Long-term SSP2-4.5; (b3) Long-term SSP3-7.0; (b4) Long-term SSP5-8.5.
3.3.1. DTF Events
For future near-term DTF events, distinct scale-dependent characteristics were identified across the four scenarios (Figure 6). Under SSP1-2.6, the cumulative annual occurrences of DTF events exhibited weak and irregular oscillations at scales shorter than 3 years. In contrast, pronounced and well-defined oscillations occurred at the 3–7-year scale, corresponding to approximately 5.5 alternating cycles from high to low occurrences. At scales longer than 7 years, oscillations weakened, with about 2.5 cycles characterized by transitions from low to high occurrences. Under SSP2-4.5, oscillations at scales shorter than 4 years were relatively weak, whereas pronounced variability was observed at the 4–6-year scale, corresponding to about 4.0 alternating cycles from low to high occurrences. At the 6–10-year scale, approximately 3.0 low-to-high alternating cycles were evident. Under SSP3-7.0, no clear periodicity was detected at scales shorter than 3 years. Variability intensified at the 3–5-year scale, with approximately 6.0 low-to-high alternating cycles, while strong oscillations persisted at scales longer than 5 years, characterized by about 2.5 alternating cycles. Under SSP5-8.5, no evident periodic structure was observed at scales shorter than 2 years. Strong oscillations emerged at the 2–6-year scale, corresponding to approximately 7.0 low-to-high alternating cycles, and persisted at scales longer than 6 years, with about 2.0 alternating cycles.
For future long-term DTF events, the scale-dependent variability also differed among scenarios. Under SSP1-2.6, oscillations were weak at scales shorter than 2 years, while clearer periodic behavior appeared at the 2–4-year scale, with approximately 6.0 low-to-high alternating cycles. At scales longer than 4 years, oscillations intensified, with about 3.0 alternating cycles. Notably, the contour lines indicating increased occurrences did not close by 2064, suggesting that the increasing tendency may continue beyond this period. Under SSP2-4.5, pronounced oscillations were observed at the 2–6-year scale, with approximately 5.0 alternating cycles from high to low occurrences. At scales longer than 6 years, about 2.5 high-to-low alternating cycles were evident, and the non-closure of the increasing-occurrence contours by 2064 indicated that the upward tendency may persist beyond the study period. Under SSP3-7.0, no distinct periodicity was identified at scales shorter than 2 years. Strong oscillations occurred at the 2–6-year scale, corresponding to approximately 7.5 high-to-low alternating cycles. At scales longer than 6 years, the oscillation intensity slightly weakened, with about 3.0 alternating cycles. The non-closure of decreasing-occurrence contours by 2064 suggested a potential continuation of the declining tendency. Under SSP5-8.5, oscillations were weak at scales shorter than 3 years, while strong variability appeared at the 3–7-year scale, with approximately 4.0 high-to-low alternating cycles. At scales longer than 7 years, oscillations remained pronounced, characterized by about 2.0 low-to-high alternating cycles.
The wavelet variance spectra (Figure 7) further revealed the dominant periodicities of DTF events. For the future near-term period, the primary periods were 4 years (SSP1-2.6), 6 years (SSP2-4.5), 4 years (SSP3-7.0), and 3 years (SSP5-8.5), ranging between 3 and 6 years. For the future long-term period, the primary periods were 2 years (SSP1-2.6), 4 years (SSP2-4.5), 3 years (SSP3-7.0), and 5 years (SSP5-8.5), ranging between 2 and 5 years.
3.3.2. FTD Events
For the future near-term period, Figure 8 illustrates the wavelet characteristics of the cumulative annual occurrences of FTD events under different scenarios. Under SSP1-2.6, strong oscillations without clear regularity were observed at scales shorter than 2 years. More coherent periodic behavior emerged at the 2–4-year scale, corresponding to approximately 6.0 alternating cycles from low to high occurrences. At the 4–7-year scale, oscillations remained strong, with about 4.0 low-to-high alternating cycles, while at scales longer than 7 years, approximately 2.0 low-to-high alternating cycles were identified. Under SSP2-4.5, pronounced oscillations occurred at scales shorter than 5 years, with about 6.0 low-to-high alternating cycles. Strong variability persisted at the 5–10-year scale, corresponding to approximately 3.0 low-to-high alternating cycles. Under SSP3-7.0, no distinct periodicity was detected at scales shorter than 3 years. At the 3–6-year scale, oscillations intensified, with approximately 4.5 low-to-high alternating cycles, while strong oscillations at scales longer than 6 years corresponded to about 2.5 low-to-high alternating cycles. Under SSP5-8.5, strong oscillations were observed at scales shorter than 4 years, with approximately 5.5 low-to-high alternating cycles. At the 4–10-year scale, oscillations remained pronounced, characterized by about 3.0 high-to-low alternating cycles.
For the future long-term period, the scale-dependent characteristics of FTD events also varied across scenarios. Under SSP1-2.6, oscillations were weak and irregular at scales shorter than 2 years, while strong and coherent oscillations emerged at the 2–5-year scale, corresponding to approximately 5.0 low-to-high alternating cycles. At the 5–10-year scale, oscillations weakened slightly, with about 3.0 low-to-high alternating cycles. Under SSP2-4.5, no clear periodic structure was identified at scales shorter than 2 years. Strong oscillations appeared at the 2–5-year scale, characterized by approximately 5.5 high-to-low alternating cycles, while at scales longer than 5 years, about 2.5 high-to-low alternating cycles were evident. Under SSP3-7.0, oscillations were weak at scales shorter than 2 years. Strong periodic behavior was observed at the 2–4-year scale, with approximately 6.0 low-to-high alternating cycles, and persisted at the 4–8-year scale with about 4.0 low-to-high alternating cycles. At scales longer than 8 years, oscillations weakened, corresponding to approximately 2.5 high-to-low alternating cycles. Notably, the contour lines indicating increased occurrences did not close by 2064, suggesting that the increasing tendency may persist beyond the study period. Under SSP5-8.5, oscillations were weak at scales shorter than 3 years, while pronounced variability emerged at the 3–7-year scale, with approximately 4.5 high-to-low alternating cycles. At scales longer than 7 years, oscillations weakened, characterized by about 2.0 low-to-high alternating cycles. The non-closure of the increasing-occurrence contours by 2064 indicated a possible continuation of the increasing tendency beyond this period.
The wavelet variance spectra (Figure 9) further revealed the dominant periodicities of FTD events. For the future near-term period, the primary periods were 5 years (SSP1-2.6), 7 years (SSP2-4.5), 4 years (SSP3-7.0), and 8 years (SSP5-8.5), spanning a range of 4 to 8 years. For the future long-term period, the corresponding primary periods were 4 years (SSP1-2.6), 3 years (SSP2-4.5), 9 years (SSP3-7.0), and 5 years (SSP5-8.5), spanning a broader range of 3 to 9 years. Overall, the variability in the dominant periods of FTD events across scenarios was larger than that of DTF events.
3.4. Spatial Variation in DFAA Events
Figure 10 and Figure 11 illustrate the spatial distributions of changes in the multi-year cumulative occurrences of DTF and FTD events relative to the baseline period across Southwest China under different scenarios during the future near-term and long-term periods, respectively.
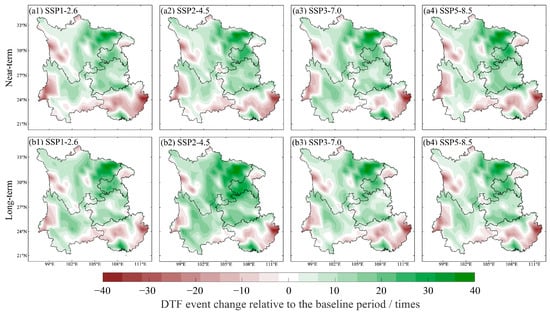
Figure 10.
Spatial distribution of changes in the multi-year cumulative occurrences of DTF events relative to the baseline period during the future near-term and long-term periods under different scenarios in Southwest China. (a1) Near-term SSP1-2.6; (a2) Near-term SSP2-4.5; (a3) Near-term SSP3-7.0; (a4) Near-term SSP5-8.5; (b1) Long-term SSP1-2.6; (b2) Long-term SSP2-4.5; (b3) Long-term SSP3-7.0; (b4) Long-term SSP5-8.5.
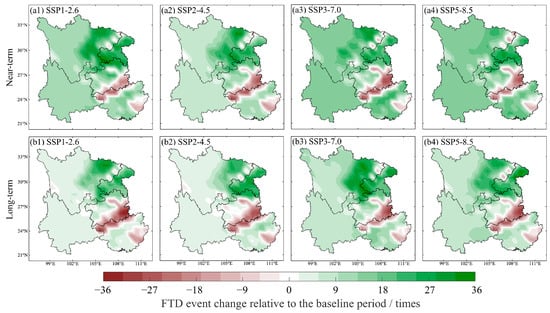
Figure 11.
Spatial distribution of changes in the multi-year cumulative occurrences of FTD events relative to the baseline period during the future near-term and long-term periods under different scenarios in Southwest China. (a1) Near-term SSP1-2.6; (a2) Near-term SSP2-4.5; (a3) Near-term SSP3-7.0; (a4) Near-term SSP5-8.5; (b1) Long-term SSP1-2.6; (b2) Long-term SSP2-4.5; (b3) Long-term SSP3-7.0; (b4) Long-term SSP5-8.5.
As shown in Figure 10, the spatial patterns of DTF event changes exhibited a high degree of consistency between the future near-term and long-term periods under all scenarios. The changes in DTF events displayed a pronounced central enhancement pattern surrounded by relatively lower changes, with positive and negative anomalies interwoven across the study area, indicating strong spatial heterogeneity. This spatial configuration remained generally stable across the four scenarios and both future periods. From the regional mean perspective, the average changes in the cumulative occurrences of DTF events were predominantly positive under all scenarios, suggesting an overall increasing tendency that was consistent with the temporal trends described in Section 3.2. Specifically, under the SSP1-2.6 scenario, the mean changes during the future near-term and long-term periods were 3.64 and 4.15 times, respectively. Under SSP2-4.5, the corresponding values were 3.82 and 4.20 times; under SSP3-7.0, they were 4.12 and 3.89 times; and under SSP5-8.5, they were 3.71 and 3.66 times. These results indicated that although the magnitude of DTF event changes varied among emission scenarios and between periods, the overall regional-scale tendency remained relatively stable. Inter-scenario comparison further revealed that DTF event changes were sensitive to temporal scale. During the future near-term period, the largest magnitude of change occurred under SSP3-7.0, while the smallest change was observed under SSP1-2.6. In contrast, during the future long-term period, SSP2-4.5 showed the largest change, whereas SSP5-8.5 exhibited relatively smaller variations. Despite the overall increasing tendency indicated by the regional mean values, the spatial distribution of DTF event changes remained highly uneven. Areas with increasing DTF events were mainly concentrated in eastern Sichuan, northern Yunnan, western Chongqing, and parts of Guizhou, whereas decreasing regions were primarily located in western Sichuan, western Yunnan, and parts of Guangxi. This spatial pattern might be associated with the combined influence of complex regional topography, moisture transport pathways, and land–atmosphere interactions across Southwest China.
As shown in Figure 11, similar to the DTF events, the spatial patterns of changes in the multi-year cumulative occurrences of FTD events relative to the baseline period exhibited strong consistency between the future near-term and long-term periods under different scenarios. The spatial distribution of FTD event changes was characterized by patchy mosaics of positive and negative anomalies, indicating pronounced regional variability. This spatial configuration remained relatively stable across all scenarios and future periods. From the regional mean perspective, FTD events showed a significant overall increase under all emission scenarios and during both future periods. Specifically, under the SSP1-2.6, SSP2-4.5, SSP3-7.0, and SSP5-8.5 scenarios, the mean changes in the cumulative occurrences of FTD events during the future near-term and long-term periods were 7.10 and 5.77 times, 6.83 and 5.61 times, 7.72 and 6.91 times, and 7.69 and 6.78 times, respectively. Inter-scenario comparison indicated that the magnitude of FTD event changes was sensitive to emission forcing. In both future periods, the largest increase occurred under the SSP3-7.0 scenario, whereas relatively smaller changes were observed under SSP2-4.5. Although the regional mean values suggested an overall increasing tendency, the spatial distribution of FTD event changes still exhibited pronounced heterogeneity. Areas with increasing FTD events were mainly concentrated in Sichuan Province, Chongqing Municipality, and northern Guizhou, whereas decreasing regions were primarily located along the border between Guizhou and Guangxi and in parts of eastern Guangxi. This spatial pattern might be associated with the combined influence of regional topography, atmospheric circulation, and moisture transport processes across Southwest China.
Figure 12 and Figure 13 present the spatial trends of DTF and FTD events in Southwest China under different emission scenarios during the future near-term and long-term periods, respectively.
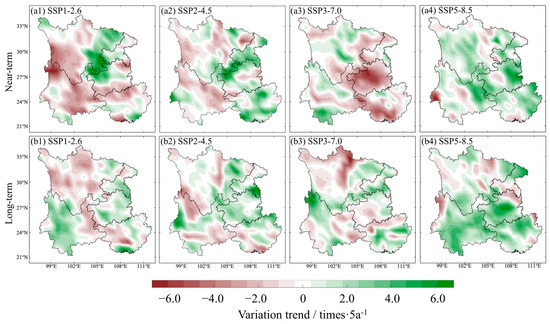
Figure 12.
Spatial trends in the multi-year cumulative occurrences of DTF events during the future near-term and long-term periods under different scenarios in Southwest China. (a1) Near-term SSP1-2.6; (a2) Near-term SSP2-4.5; (a3) Near-term SSP3-7.0; (a4) Near-term SSP5-8.5; (b1) Long-term SSP1-2.6; (b2) Long-term SSP2-4.5; (b3) Long-term SSP3-7.0; (b4) Long-term SSP5-8.5.
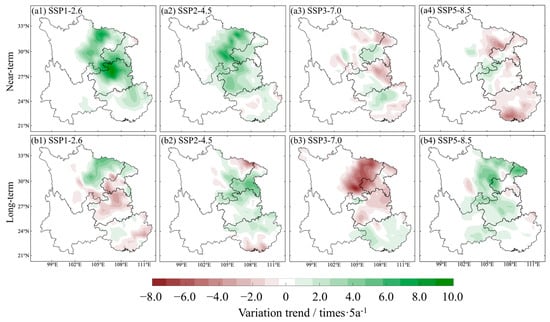
Figure 13.
Spatial trends in the multi-year cumulative occurrences of FTD events during the future near-term and long-term periods under different scenarios in Southwest China. (a1) Near-term SSP1-2.6; (a2) Near-term SSP2-4.5; (a3) Near-term SSP3-7.0; (a4) Near-term SSP5-8.5; (b1) Long-term SSP1-2.6; (b2) Long-term SSP2-4.5; (b3) Long-term SSP3-7.0; (b4) Long-term SSP5-8.5.
As shown in Figure 12, the spatial trends of DTF events exhibited a pronounced scenario-dependent characteristic. Under the same scenario, the spatial patterns remained generally consistent between the future near-term and long-term periods, while marked differences were evident in both the direction and magnitude of trends among different scenarios. During the future near-term period, the spatial trends of DTF events showed clear divergence across emission scenarios. Under the SSP1-2.6 and SSP3-7.0 scenarios, most regions of Southwest China experienced decreasing trends in the cumulative occurrences of DTF events per 5-year interval, while increasing trends prevailed under SSP2-4.5 and SSP5-8.5. The corresponding regional mean trend values were −0.21, 0.16, −0.45, and 1.24 times·5a−1 for SSP1-2.6, SSP2-4.5, SSP3-7.0, and SSP5-8.5, respectively, indicating substantial inter-scenario differences in trend direction at the regional scale. Spatially, areas exhibiting increasing trends in DTF events were primarily located in eastern Sichuan and northern Guizhou under SSP1-2.6, Chongqing and most of Guangxi under SSP2-4.5, central-western Sichuan and northern Yunnan under SSP3-7.0, and across most of Southwest China under SSP5-8.5. In contrast, decreasing trends were observed in southern Sichuan and central-eastern Yunnan (SSP1-2.6), central Sichuan and central-eastern Yunnan (SSP2-4.5), southern Guizhou and southern Guangxi (SSP3-7.0), and limited areas of Southwest China under SSP5-8.5.
During the future long-term period, the spatial trend patterns of DTF events generally maintained the same scenario-based grouping observed in the near-term period. Decreasing trends continued to dominate under SSP1-2.6 and SSP3-7.0, while increasing trends remained prevalent under SSP2-4.5 and SSP5-8.5. The corresponding regional mean trend values were −0.05, 0.23, −0.10, and 1.41 times·5a−1, respectively, suggesting that the increasing tendency of DTF events was further intensified under high-emission scenarios in the long term, while trend magnitudes weakened under low- and some intermediate-emission scenarios. In terms of spatial distribution, regions with increasing trends during the future long-term period were mainly located in most parts of Yunnan and Guizhou (SSP1-2.6), Guizhou and eastern Sichuan (SSP2-4.5), Chongqing and northern Yunnan (SSP3-7.0), and most regions of Southwest China (SSP5-8.5). Conversely, areas with decreasing trends were primarily distributed across most of Sichuan and eastern Yunnan (SSP1-2.6), northwestern and southeastern Yunnan (SSP2-4.5), northwestern Sichuan and eastern Yunnan (SSP3-7.0), and limited regions in Southwest China under SSP5-8.5.
As illustrated in Figure 13, the spatial trend characteristics of FTD events differed notably from those of DTF events and exhibited more pronounced regional structural heterogeneity rather than clear scenario-based grouping. While the spatial configurations of FTD event trends under each scenario were broadly similar between the future near-term and long-term periods, the intensity of trends varied markedly across regions. During the future near-term period, FTD event trends were generally weak and insignificant across western Southwest China under all scenarios, while the eastern part of the region displayed a clear southeast-to-northeast increasing gradient. The regional mean trend values under SSP1-2.6, SSP2-4.5, SSP3-7.0, and SSP5-8.5 were 1.82, 1.17, 0.05, and −1.03 times·5a−1, respectively. Among these, SSP1-2.6 exhibited the strongest increasing trend, whereas SSP5-8.5 showed the weakest trend, indicating that the magnitude of FTD event trends during the near-term period generally weakened with increasing radiative forcing. Spatially, areas of increasing trends during the future near-term period were primarily concentrated in eastern Sichuan, Chongqing, most parts of Guizhou, and northwestern Guangxi under SSP1-2.6 and SSP2-4.5; in south-central Chongqing and northern Guangxi under SSP3-7.0; and in northwestern Guizhou and south-central Sichuan under SSP5-8.5. Decreasing trends were observed primarily in northeastern Chongqing (SSP1-2.6), western and eastern Guangxi (SSP2-4.5), northern Chongqing, northeastern Guizhou, and southern Guangxi (SSP3-7.0), as well as eastern Southwest China under SSP5-8.5, while trends in other regions remained generally close to zero.
During the future long-term period, the overall spatial structure of FTD event trends remained similar to the near-term period, characterized by weak changes in the western regions and pronounced trend signals in the eastern and particularly the northeastern parts of Southwest China. The regional mean trend values under SSP1-2.6, SSP2-4.5, SSP3-7.0, and SSP5-8.5 were −0.12, 0.37, −1.25, and 0.93 times·5a−1, respectively. Further analysis revealed that the regions exhibiting the largest trend magnitudes under all scenarios were consistently located in eastern Sichuan and most parts of Chongqing, corresponding to the northeastern part of Southwest China. The mean trend values in this region were 2.13, 2.25, −3.72, and 2.68 times·5a−1 for the four scenarios, respectively, indicating a high sensitivity of FTD event trends to emission scenarios in this area. Accordingly, increasing trend areas during the future long-term period were mainly distributed in eastern Sichuan, northern Chongqing, and northern Guangxi (SSP1-2.6); most of Chongqing, central–eastern Guizhou, and northern Guangxi (SSP2-4.5); most parts of Guangxi (SSP3-7.0); and eastern Sichuan, northern Chongqing, and most of Guizhou (SSP5-8.5). In contrast, decreasing trend regions were primarily located in southern Chongqing, most of Guizhou, and southern Guangxi (SSP1-2.6); southern Guangxi and northeastern Sichuan (SSP2-4.5); eastern Sichuan, Chongqing, and most of Guizhou (SSP3-7.0); and southeastern Chongqing and northeastern Guangxi (SSP5-8.5), with trends in other regions remaining close to zero.
3.5. Correlation Analysis Between DFAA Events and Evapotranspiration
Based on monthly observational data from 124 meteorological stations during the historical period (1995–2024) and the flood season (May–September), Table 2 presents the Pearson correlation coefficients between the monthly cumulative occurrences of DFAA events and evapotranspiration in Southwest China, aiming to quantify the statistical linkage between DFAA events and land surface hydrothermal processes. Overall, DFAA events did not exhibit a clear synchronous relationship with evapotranspiration; instead, significant lagged correlations were observed at the monthly scale, indicating that the interaction between evapotranspiration and DFAA events may involve delayed responses. Moreover, notable differences in both correlation direction and statistical significance were identified among different types of DFAA events.
Table 2.
Pearson correlation coefficients between monthly cumulative DFAA event occurrences and evapotranspiration during the flood season of the historical period (1995–2024).
For DTF events, the correlation results indicated the coexistence of antecedent suppressing effects and subsequent enhancing effects with respect to evapotranspiration. Specifically, a significant positive correlation was identified between DTF events in August and evapotranspiration in September (CC = 0.39, p < 0.05), suggesting that soil moisture replenishment induced by abrupt heavy rainfall following drought conditions may provide sufficient water supply to enhance evapotranspiration in the subsequent month. This finding reflected a lagged response of land surface evapotranspiration to post-drought wetting conditions associated with DTF transitions. Conversely, a significant negative correlation was observed between DTF events in July and evapotranspiration in June (CC = −0.23, p < 0.05), implying that enhanced evapotranspiration during the preceding month may accelerate soil moisture depletion and thereby suppress the abrupt transition from drought to flood conditions. This negative relationship suggested that evapotranspiration processes, mediated by vegetation cover, soil water-holding capacity, and surface energy partitioning, may partially regulate the background conditions under which DTF transitions occur.
In comparison to DTF events, the correlations between FTD events and evapotranspiration exhibited more distinct stage-dependent characteristics in both direction and significance. The results showed a significant positive correlation between FTD events in July and evapotranspiration in June (CC = 0.22, p < 0.05), indicating that elevated evapotranspiration during the antecedent period may intensify soil moisture depletion, thereby facilitating a rapid transition from flood to drought conditions following flood cessation. This positive relationship highlighted the amplifying role of evapotranspiration in post-flood soil water loss. In contrast, a highly significant negative correlation was detected between FTD events in July and evapotranspiration in August (CC = −0.38, p < 0.001), suggesting that after the completion of FTD transitions, actual evapotranspiration is substantially constrained by insufficient soil moisture availability, even under meteorological conditions favorable for evaporation. This negative correlation reflected the pronounced water stress state of the land surface system following FTD events and underscored the dominant control of soil moisture on evapotranspiration processes.
Overall, the correlations between DFAA events and evapotranspiration exhibited pronounced monthly lag effects and strong event-type dependency. DTF events tended to exert an enhancing influence on evapotranspiration following their occurrence, whereas FTD events displayed bidirectional regulatory effects on evapotranspiration before and after the transition. These results indicated that evapotranspiration served not only as a critical hydrothermal background condition for the occurrence of DFAA events but also as an important response variable reflecting post-event adjustments in land surface moisture status.
Figure 14 illustrates the spatial distribution of Pearson correlation coefficients between the monthly cumulative occurrences of DFAA events and evapotranspiration in Southwest China during the flood season (May–September) of the historical period (1995–2024), with the strongest lagged correlation month for each event type considered. Overall, pronounced spatial heterogeneity was evident across different months and event types, reflecting a spatial pattern jointly modulated by topography and land surface conditions.
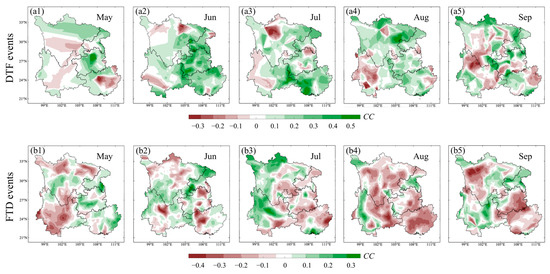
Figure 14.
Spatial distribution of CCs between monthly cumulative DFAA event occurrences and evapotranspiration for the most strongly associated month during the flood season in the historical period. Panels (a1–a5) represent DTF events, including (a1) May, (a2) June, (a3) July, (a4) August, and (a5) September. Panels (b1–b5) represent FTD events, including (b1) May, (b2) June, (b3) July, (b4) August, and (b5) September.
For DTF events, the correlations with evapotranspiration during the most strongly associated months were predominantly positive, with the spatial distribution of these positive correlations exhibiting clear regional clustering. High positive correlation coefficients were primarily concentrated in the Sichuan Basin and its eastern margins, the Chongqing region, and northern Guizhou. These regions showed relatively stable positive correlations throughout the flood season, particularly from June to August. Characterized by basin and low-hill terrain, relatively dense vegetation, and deep soils with strong water-holding capacity, these areas were able to maintain elevated evapotranspiration levels following abrupt heavy rainfall after drought conditions. As a result, DTF events in these regions exhibited significant positive correlations with subsequent evapotranspiration at the statistical level. In contrast, weaker correlations between DTF events and evapotranspiration were observed in western Yunnan, the western Sichuan Plateau, and parts of the southern Yunnan–Guizhou Plateau, where local correlations were close to zero or even weakly negative. These areas are marked by complex terrain, high elevations, and relatively shallow soils, making them prone to rapid loss of precipitation-induced soil moisture through runoff or percolation. Consequently, evapotranspiration responses to sudden increases in precipitation were constrained, resulting in less pronounced positive correlation signals.
In comparison to DTF events, the spatial correlation patterns between FTD events and evapotranspiration were dominated by negative correlations, showing a strong seasonal dependence. During the period from July to September, regions with high negative correlations between FTD events and subsequent evapotranspiration were primarily located across central and southern Yunnan, the southwestern mountainous areas of Sichuan, and the southern margins of the Yunnan–Guizhou Plateau. These regions exhibited coherent negative correlation patches across multiple flood-season months, suggesting a consistent suppression of evapotranspiration following FTD events. From a physical perspective, these areas are characterized by rugged terrain, steep slopes, sparse vegetation cover, and limited soil water retention capacity. After flood conditions subside, soil moisture is quickly depleted through runoff and evaporation. Additionally, during the late flood season, these regions are often influenced by subtropical high-pressure systems, leading to hot and dry conditions with enhanced atmospheric evaporative demand. However, constrained by insufficient soil moisture availability, actual evapotranspiration is markedly reduced, leading to statistically significant negative correlations between FTD events and evapotranspiration. Conversely, in the Sichuan Basin, Chongqing, and northern Guizhou, the correlations between FTD events and evapotranspiration are generally weak, with some areas exhibiting near-zero or weakly positive correlations. This suggests that in regions with relatively favorable moisture conditions, the suppressive effect of FTD transitions on evapotranspiration is less pronounced.
Overall, the spatial correlations between monthly cumulative DFAA event occurrences and evapotranspiration during the historical flood season revealed clear regional differentiation across Southwest China. Positive correlations associated with DTF events were mainly concentrated in basin and low-hill regions with relatively flat terrain and strong soil water retention capacity, while negative correlations related to FTD events were predominantly found in plateau and mountainous regions characterized by complex topography, weak soil water retention, and a high susceptibility to rapid moisture depletion. These contrasting spatial patterns underscore the region-dependent responses of land surface hydrothermal processes to different types of DFAA events.
4. Discussion
This study assessed the simulation performance of five individual CMIP6 models and their MME in simulating mean annual precipitation and mean annual evapotranspiration over Southwest China. Additionally, Delta downscaling was applied to improve the reliability of future projections of DFAA events. The results demonstrated that the MME outperformed individual models in simulating historical precipitation, evapotranspiration, and DFAA events, confirming the advantages of the MME in reducing systematic biases and internal variability inherent in single models.
However, it is important to acknowledge the inherent uncertainties within CMIP6 projections. Variations in physical process representations, parameterization schemes, spatial resolution, and data assimilation methods across models can influence the simulation of DFAA events. Although the MME significantly reduced random errors, it assumed equal model credibility, which may, to some extent, mask valuable information contained in higher-performing models [35]. Future research could enhance regional prediction accuracy by adopting weighted ensemble methods based on model performance metrics or integrating machine learning-based bias correction techniques.
Delta downscaling substantially reduced systematic biases in simulated DFAA event occurrences and improved the spatial consistency with observed data. While differences in downscaling methods may introduce some variation in results, the alignment of this study’s conclusions with those of previous research suggested that bias correction is an essential step in studying regional compound extreme events [18,36]. Future work could further constrain uncertainties by applying a range of downscaling methods and evaluation metrics.
The findings indicated that the annual cumulative occurrences of both DTF and FTD events in Southwest China would increase substantially during 2025–2064 compared to the historical period, pointing to an overall rise in DFAA risks. DTF events displayed clear scenario-dependent trends, while FTD events showed a more consistent increase across all scenarios, highlighting the greater sensitivity of FTD transitions to future climate variability.
No significant temporal differences were observed between the future near-term and long-term periods, indicating that the evolution of DFAA events was not solely linearly enhanced over time but was more strongly influenced by emission scenarios. This result was consistent with previous studies by Liu et al. [18] and Qiu et al. [37], which also emphasized the critical role of emission pathways in determining the future evolution of compound extreme events at the regional scale. Spatial analysis revealed considerable regional heterogeneity in DFAA event changes and trends across Southwest China. DTF events showed a pronounced west–east contrast, while FTD events exhibited more complex regional structural features, especially in eastern Sichuan and Chongqing. These spatial patterns remained relatively stable across scenarios and periods, underscoring the long-term control of topography and surface conditions on DFAA event evolution.
The observed spatial heterogeneity can be attributed to the combined effects of topography, vegetation cover, and soil water retention capacity. Regions with relatively flat terrain and deeper soils, such as the Sichuan Basin, are more likely to maintain higher soil moisture levels following DTF transitions, while plateau and mountainous areas are more prone to rapid moisture depletion after flooding, thus favoring FTD transitions. These findings are consistent with those of Sun et al. [19], who highlighted the role of land surface conditions in regulating compound hydrological extremes.
The wavelet analysis further revealed that the variability of compound drought–flood events was not governed by a single characteristic timescale, but rather arose from the superposition of multiple scale bands, exhibiting clear regional differences across Southwest China. In addition to the expected annual cycle, pronounced interannual variability (typically within the 2–7-year band) was identified in the wavelet power spectra. This suggested that a portion of the variance in these compound events might be organized at frequencies comparable to large-scale ocean–atmosphere climate modes. While it should be noted that wavelet power itself does not imply direct causal attribution, this scale decomposition offered a valuable framework for linking the temporal organization of compound drought–flood events with potentially predictable components of climate variability.
Furthermore, the wavelet perspective helped explain why analyses relying solely on precipitation variability might overlook crucial processes driving drought–flood transitions. Land surface processes can accumulate and retain hydrological anomalies on weekly to monthly timescales, thereby embedding a form of “memory” into the climate system. Evapotranspiration plays a pivotal role in integrating this memory by coupling soil moisture availability with atmospheric evaporative demand. Consequently, the repeated co-variability between evapotranspiration and compound drought–flood events at specific temporal scales provided indirect evidence that land–atmosphere feedbacks likely contributed to sustaining drought anomalies and modulating the region’s susceptibility to subsequent intense wet events. This interpretation aligned well with the conceptual frameworks proposed in previous studies, which emphasize the synergistic influence of large-scale circulation triggers and land surface preconditioning in shaping abrupt drought–flood transitions [6].
Evapotranspiration was confirmed as a key variable linking land surface processes and DFAA events in this study. Correlation analysis revealed significant monthly lag effects and strong event-type dependence: DTF events were generally positively correlated with subsequent evapotranspiration, reflecting enhanced soil moisture availability following DTF transitions, whereas FTD events were predominantly negatively correlated with subsequent evapotranspiration, especially in plateau and mountainous regions, indicating strong soil moisture constraints after flooding cessation.
The spatial consistency between DFAA event changes, trend patterns, and evapotranspiration correlations underscored the crucial role of land–atmosphere coupling processes in modulating compound drought–flood extremes. The response of evapotranspiration to DFAA events varied considerably across different terrain and surface conditions, reflecting the region-dependent nature of land–atmosphere interactions. This study provided a systematic understanding of the future DFAA risks in Southwest China, emphasizing the dual role of evapotranspiration in regulating these events. The findings offer critical scientific support for water resource management, disaster early warning, and climate adaptation strategies in the region.
Nevertheless, some limitations remained. This study primarily relied on statistical analysis and precipitation-driven event identification, without explicitly modeling the physical processes of atmospheric circulation, soil moisture dynamics, and vegetation responses. Future work should incorporate high-resolution land surface models and dynamic vegetation schemes to better elucidate the physical mechanisms linking evapotranspiration and DFAA events while also considering the impacts of human activities, such as irrigation and land-use changes.
5. Conclusions
This study systematically explored the spatiotemporal evolution of DFAA events in Southwest China during the historical period (1995–2024) and future period (2025–2064), along with their relationships with evapotranspiration, through the integration of a CMIP6 MME, Delta downscaling, and station-based observational data. The main conclusions are as follows:
- (1)
- The evaluation results for the baseline period demonstrated that the CMIP6 MME outperformed individual models in simulating mean annual precipitation and evapotranspiration over Southwest China. The MME showed lower RMSE, more realistic variability, and higher correlation with observations, confirming its superiority in simulating regional hydroclimatic variables. After applying Delta downscaling, systematic biases in the simulated cumulative occurrences of DFAA events were significantly reduced, and spatial consistency between simulations and observations was markedly improved. These results confirm the reliability of the downscaled MME for analyzing DFAA events in Southwest China.
- (2)
- Temporal analyses indicated that both DTF and FTD events exhibited increased annual cumulative occurrences during 2025–2064 relative to the historical period. However, their temporal evolution varied across scenarios. DTF events displayed clear scenario-dependent trends, with increasing cumulative occurrences under SSP2-4.5 and SSP5-8.5 and decreasing trends under SSP1-2.6 and SSP3-7.0. In contrast, FTD events demonstrated a more consistent increase across all scenarios, suggesting a higher sensitivity of FTD transitions to future climate variability.
- (3)
- Wavelet analysis revealed distinct multi-scale periodic characteristics of DFAA events under different emission scenarios. The dominant periods for DTF events were concentrated in the 2–6-year range, while those for FTD events spanned a broader 3–9-year range. The variability of dominant periods was generally higher for FTD events than for DTF events, indicating more complex temporal dynamics in FTD transitions. Differences between the future near-term and long-term periods further suggested that emission forcing affected not only the cumulative occurrences but also the temporal organization of DFAA events.
- (4)
- Spatial analyses revealed pronounced regional heterogeneity in both the changes and trends of DFAA event cumulative occurrences across Southwest China. The changes in DTF events generally exhibited a central enhancement pattern with interwoven positive and negative anomalies, while FTD event changes showed patchy mosaics of positive and negative anomalies, indicating strong spatial variability. In terms of trends, DTF events displayed clear scenario-dependent characteristics, whereas FTD events exhibited stronger regional structural heterogeneity, with relatively weak changes in western Southwest China but more pronounced trend signals in the eastern and northeastern regions, particularly in eastern Sichuan and Chongqing. Overall, these spatial patterns remained broadly consistent between the near-term and long-term periods.
- (5)
- Correlation analyses based on historical station observations showed that DFAA events were significantly associated with evapotranspiration through clear monthly lag effects and strong event-type dependence. DTF events were generally positively correlated with subsequent evapotranspiration, reflecting enhanced land surface moisture conditions following abrupt DTF transitions. In contrast, FTD events were predominantly negatively correlated with subsequent evapotranspiration, especially in plateau and mountainous regions, indicating strong soil moisture constraints after the cessation of flooding. The spatial consistency between DFAA event changes, trend patterns, and evapotranspiration correlations emphasized the critical role of land surface hydrothermal processes in modulating compound drought–flood extremes.
Overall, this study systematically revealed the spatiotemporal evolution of DFAA events in Southwest China during the past and future periods and clarified their coupling relationships with evapotranspiration. These findings enhance the understanding of compound extreme events in regions with complex terrain and provide valuable scientific insights for regional water resource management, agricultural adaptation, and climate risk mitigation under future climate change.
Author Contributions
S.L.: data curation, investigation, software, code, methodology, and writing—original draft; X.L.: conceptualization, data curation, visualization, writing (original draft), funding acquisition, supervision, and writing—review draft; X.W. and L.W.: conceptualization, supervision, and writing—review draft. All authors have read and agreed to the published version of the manuscript.
Funding
This work was financially supported by the Sichuan Science and Technology Program (2025NSFSC2045).
Institutional Review Board Statement
Not applicable.
Informed Consent Statement
Not applicable.
Data Availability Statement
The original contributions presented in the study are included in the article, further inquiries can be directed to the corresponding author.
Conflicts of Interest
The authors declare no conflicts of interest.
References
- Legg, S. IPCC, 2021: Climate change 2021: The physical science basis. Interaction 2021, 49, 44–45. [Google Scholar]
- Seneviratne, S.I.; Nicholls, N.; Easterling, D.; Goodess, C.M.; Kanae, S.; Kossin, J.; Luo, Y.; Marengo, J.; McInnes, K.; Rahimi, M.; et al. Changes in climate extremes and their impacts on the natural physical environment. In Managing the Risks of Extreme Events and Disasters to Advance Climate Change Adaptation; A Special Report of Working Groups I and II of the Intergovernmental Panel on Climate Change (IPCC); Cambridge University Press: Cambridge, UK; New York, NY, USA, 2012; pp. 109–230. [Google Scholar]
- Jakob, Z.S.I.S.; Seth, W.M.L.; Bart, J.J.M.; Philip, J.W.; Pitman, A.; Aghakouchak, A.; Bresch, D.N.; Leonard, M.; Wahl, T.; Zhang, X.B. Future climate risk from compound events. Nat. Clim. Change 2018, 8, 469–477. [Google Scholar]
- Zscheischler, J.; Martius, O.; Westra, S.; Bevacqua, E.; Raymond, C.; Horton, R.M.; Hurk, B.V.D.; AghaKouchak, A.; Jézéquel, A.; Mahecha, M.D.; et al. A typology of compound weather and climate events. Nat. Rev. Earth Environ. 2020, 1, 333–347. [Google Scholar] [CrossRef]
- He, X.; Sheffield, J. Lagged compound occurrence of droughts and pluvials globally over the past seven decades. Geophys. Res. Lett. 2020, 47, e2020GL087924. [Google Scholar] [CrossRef]
- Bai, X.; Zhao, C.; Tang, Y.; Zhang, Z.; Yang, B.; Wang, Z. Identification, physical mechanisms and impacts of drought-flood abrupt alternation: A review. Front. Earth Sci. 2023, 11, 1203603. [Google Scholar] [CrossRef]
- Shan, L.J.; Zhang, L.P.; Song, J.Y.; Zhang, Y.J.; She, D.X.; Xia, J. Characteristics of dry-wet abrupt alternation events in the middle and lower reaches of the Yangtze River Basin and the relationship with ENSO. J. Geogr. Sci. 2018, 28, 1039–1058. [Google Scholar] [CrossRef]
- Zhao, D.S.; Zhang, J.C.; Deng, S.Q.; Guo, C.B. Spatio-temporal variation characteristics of drought-flood abrupt alternation in Southwest China from 1960 to 2018. Sci. Geogr. Sin. 2021, 41, 2222–2231. [Google Scholar]
- Son, H.J.; Kim, J.E.; Kim, L.T.W. Monitoring and evaluating the severity of drought-flood abrupt alternation events using daily standardized precipitation index. KSCE J. Civ. Eng. 2024, 28, 1002–1010. [Google Scholar] [CrossRef]
- Elbeltagi, A.; Srivastava, A.; Ehsan, M.; Sharma, G.; Yu, J.; Khadke, L. Advanced stacked integration method for forecasting long-term drought severity: CNN with machine learning models. J. Hydrol. Reg. Stud. 2024, 53, 101759. [Google Scholar] [CrossRef]
- Ukkola, A.M.; De-Kauwe, M.G.; Roderick, M.L. Robust future changes in meteorological drought in CMIP6 projections despite uncertainty in precipitation. Geophys. Res. Lett. 2020, 47, e2020GL087820. [Google Scholar] [CrossRef]
- Vogel, M.M.; Hauser, M.; Seneviratne, S.I. Projected changes in hot, dry and wet extreme events’ clusters in CMIP6 multi-model ensemble. Environ. Res. Lett. 2020, 15, 094021. [Google Scholar] [CrossRef]
- Sherman, P.; Lin, H.; McElroy, M. Projected global demand for air conditioning associated with extreme heat and implications for electricity grids in poorer countries. Energ. Build. 2022, 268, 112198. [Google Scholar] [CrossRef]
- Wang, R.; Li, X.; Zhang, Q.; Cheng, J.; Li, J.; Zhang, D.; Liu, Y. Projection of drought-flood abrupt alternation in a humid subtropical region under changing climate. J. Hydrol. 2023, 624, 129875. [Google Scholar] [CrossRef]
- Ridder, N.N.; Ukkola, A.M.; Pitman, A.J.; Perkins-Kirkpatrick, S.E. Increased occurrence of high-impact compound events under climate change. npj Clim. Atmos. Sci. 2022, 5, 3. [Google Scholar] [CrossRef]
- Meng, C.; Dong, Z.; Wang, Y.; Zhang, Y.; Zhong, D. Evolution characteristics of drought-flood abrupt alternation events in the Yangtze River basin and its socio-economic exposure. J. Hydroelectr. Eng. 2024, 43, 34–49. [Google Scholar]
- Chen, H.; Wang, S.; Zhu, J.; Zhang, B. Projected changes in abrupt shifts between dry and wet extremes over China through an ensemble of regional climate model simulations. J. Geophys. Res. Atmos. 2020, 125, e2020JD033894. [Google Scholar] [CrossRef]
- Liu, T.; Zhu, X.; Tang, M.; Guo, C.; Lu, D. Multi-model ensemble bias-corrected precipitation dataset and its application in identification of drought-flood abrupt alternation in China. Atmos. Res. 2024, 307, 107481. [Google Scholar] [CrossRef]
- Sun, J.H.; Su, B.D.; Wang, D.F.; Huang, J.L.; Wang, B.W.; Dai, R.; Jiang, T. Temporospatial characteristics of drought-flood abrupt alteration abrupt events in China. Water Resour. Hydropower Eng. 2024, 55, 13–23. [Google Scholar]
- Li, X.H.; Li, S.R.; Wang, L.; Wang, X.J.; Huang, J. Spatiotemporal variability of drought-flood abrupt alternation events in Southwest China during 1961 to 2024. Theor. Appl. Climatol. 2026, 157, 96. [Google Scholar] [CrossRef]
- Wu, D.; Pei, Y.S.; Zhao, Y.; Xiao, W.H. Numerical simulations of climate change under IPCC A1B scenario in southwestern China. Prog. Geogr. 2012, 31, 275–284. [Google Scholar]
- Huang, X.Y.; Li, X.H. Future projection of rainstorm and flood disaster risk in Southwest China based on CMIP6. J. Appl. Meteorol. Sci. 2022, 33, 231–243. [Google Scholar]
- Li, X.H.; Chen, Z.F.; Wang, L.; Liu, H. Future projections of extreme temperature events in Southwest China using nine models in CMIP6. Front. Earth Sci. 2022, 10, 942781. [Google Scholar] [CrossRef]
- Li, X.H.; Chen, Z.F.; Wang, L. Spatiotemporal variations and future projections of extreme precipitation events in southwestern China. Appl. Ecol. Environ. Res. 2023, 21, 5389–5414. [Google Scholar] [CrossRef]
- Xue, Y.T.; Li, X.H.; Jia, H.J. Future projection of drought risk in southwestern China based on CMIP6 models. Res. Soil Water Conserv. 2023, 30, 247–255. [Google Scholar]
- Yao, Y.; Li, X.H.; Wang, L.; Li, H.Y. Future projection of rainstorm and flood disaster risk in the Sichuan-Chongqing region under different climate change scenarios of CMIP6. Plateau Meteorol. 2025, 44, 943–960. [Google Scholar]
- Zhang, L.X.; Chen, X.L.; Xin, X.G. Short commentary on CMIP6 Scenario Model Intercomparison Project (ScenarioMIP). Clim. Change Res. 2019, 15, 519–525. [Google Scholar]
- Lu, E. Determining the start, duration, and strength of flood and drought with daily precipitation: Rationale. Geophys. Res. Lett. 2009, 36, L12707. [Google Scholar] [CrossRef]
- Taylor, K.E. Summarizing multiple aspects of model performance in a single diagram. J. Geophys. Res. Atmos. 2001, 106, 7183–7192. [Google Scholar] [CrossRef]
- Jiang, Y.M.; Wu, H.M.; Bureau, L.M. Simulation capabilities of 20 CMIP5 models for annual mean air temperatures in Central Asia. Progress. Inquisitiones Mutat. Clim. 2013, 9, 110–116. [Google Scholar]
- Chang, S.T.; Qu, Z.Y.; Wang, B.; Su, Y.Q.; Wang, J.Y. Prediction of Future Down-scaled Summer Precipitation in Liaoning Based on CMIP6 Models. Henan Sci. 2023, 41, 1469–1478. [Google Scholar]
- Du, Y. Climate Projection of Dongjiang River Basin Based on Statistical Downscaling Methods. Pearl River 2023, 44, 40–50. [Google Scholar]
- Xing, H.J.; Yang, L.A.; Yuan, X.T.; Shang, X.Q.; Zhou, S.C.; Xue, J. Prediction of Spatial and Temporal Variability of Precipitation in Henan Province Based on CMIP6 Multi-model SSP Scenarios. Chin. J. Agrometeorol. 2025, 46, 446–458. [Google Scholar]
- Yin, L.; Wang, L.; Keim, B.D.; Konsoer, K.; Zheng, W. Wavelet Analysis of Dam Injection and Discharge in Three Gorges Dam and Reservoir with Precipitation and River Discharge. Water 2022, 14, 567. [Google Scholar] [CrossRef]
- Jiang, S.; Jiang, Z.; Li, W.; Shen, Y. Evaluation of the extreme temperature and its trend in China simulated by CMIP5 models. Adv. Clim. Change Res. 2017, 13, 11. [Google Scholar]
- Dou, S.Q.; Zhang, H.B.; Xu, Y.; Wen, Y.; Zhang, N. Research on Downscaling and Correction of TRMM Data in the Yangtze River Basin. Chin. J. Agrometeorol. 2021, 42, 377–389. [Google Scholar]
- Qiu, J.X.; He, C.X.; Liu, X.P.; Gao, L.; Tan, G.; Wang, X.H.; Kong, D.D.; Wigneron, J.P.; Chen, D.L.; Xia, J. Projecting dry-wet abrupt alternation across China from the perspective of soil moisture. npj Clim. Atmos. Sci. 2024, 7, 269. [Google Scholar] [CrossRef]


Disclaimer/Publisher’s Note: The statements, opinions and data contained in all publications are solely those of the individual author(s) and contributor(s) and not of MDPI and/or the editor(s). MDPI and/or the editor(s) disclaim responsibility for any injury to people or property resulting from any ideas, methods, instructions or products referred to in the content. |
© 2026 by the authors. Licensee MDPI, Basel, Switzerland. This article is an open access article distributed under the terms and conditions of the Creative Commons Attribution (CC BY) license.