1. Introduction
The increase in the urban population further complicated the thermodynamic balance [
1,
2,
3,
4]. Urban commuting pollution, coupled with the necessity to construct increasingly taller buildings, collectively resulted in deficits within these urban infrastructures concerning climate change adaptation and urban climate resilience [
5,
6,
7,
8]. Coimbra, a city marked by dynamic urban development and climatic variations, experienced heightened heat stress and thermal discomfort during extreme heat waves. In this context, we observe that in this city, concerns regarding climate change have gained more prominence [
9,
10]. The city’s increasing urbanization, sealing, and adoption of unsustainable urban morphologies raise doubts about the effectiveness of urban mitigation strategies amidst rising temperatures [
11,
12,
13,
14].
As you might expect, Urban Heat Islands (UHIs) present substantial challenges in urban settings, and Coimbra, amid increasing urbanization, is no exception to amplified thermal stresses [
15,
16,
17,
18,
19]. Urban climatology, particularly the study of UHIs, mitigation strategies, and climate resilience, has garnered attention due to its significant implications for urban planning and public health [
20,
21]. Previous research has highlighted the intricate nature of UHI effects, emphasizing the pivotal role of urban green spaces and the built environment in regulating temperatures [
22,
23,
24,
25].
Rather than adopting the classical urban–rural heat island framework, this study deliberately focuses on intra-urban thermal heterogeneity. This choice is motivated by the growing recognition that heat exposure and vulnerability are unevenly distributed within cities and that adaptation planning re-quires spatially explicit information at neighborhood and street scales. Green spaces within cities are not thermally equivalent to peri-urban or rural environments, and densely built urban sectors may exhibit distinct microclimatic regimes depending on morphology, orientation, ventilation, and surface composition. By analyzing thermal contrasts within the urban fabric, itself, this work aligns urban climatology with the operational needs of urban planning and public space design, where adaptation measures must be deployed selectively within heterogeneous urban landscapes rather than between idealized urban and rural categories.
In general, cities have grappled with this issue, prompting urban policies to increasingly focus on available solutions and their implementation. The green infrastructure of a city emerges as an urban amenity space where temperatures tend to be lower, marking the commencement of urban mitigation efforts [
26,
27,
28,
29]. The city’s re-transformation begins when solutions are sought, with Nature-Based Solutions (NBSs) emerging as a distinguishing element that aims to leverage existing green infrastructure solutions and enhance them [
30,
31,
32,
33].
This article aims to demonstrate that there are several UHIs in Coimbra and that they vary throughout the day in terms of their location, size and intensity. Temperature fluctuations also differ based on the typology of the building, interaction with the green structure and proximity to a river [
34,
35]. Understanding these temperature variations can aid urban planners and policymakers in implementing strategies to mitigate UHIs by prioritizing green spaces, incorporating vegetation, and improving air circulation in densely built areas [
36].
This study investigates intra-urban thermal heterogeneity in the city of Coimbra through an event-based, high-resolution field campaign designed to capture microclimatic contrasts under thermally anomalous conditions. Specifically, it aims to (i) quantify near-surface air temperature differences across contrasting urban typologies (compact built-up areas, green spaces, riparian environments, and elevated sectors), (ii) test the statistical significance of thermal contrasts between these urban typologies, and (iii) examine the explanatory role of morphological, topographical, and green–blue infrastructure attributes in shaping pedestrian-level heat exposure. Methodologically, the study advances beyond conventional urban–rural UHI frameworks by adopting a dense, mobile in situ measurement design coupled with spatially explicit analysis, enabling the identification of multiple intra-urban thermal hotspots and cooling refugia. While acknowledging the event-based nature of the dataset, this approach provides process-oriented insights into how urban form and nature-based solutions modulate extreme heat exposure at fine spatial scales. The results are therefore intended not only to validate known UHI mechanisms in a Southern European context, but also to offer transferable, operationally relevant evidence to inform spatially targeted climate adaptation strategies and the prioritization of green–blue infrastructure in compact, topographically complex cities.
2. Materials and Methods
2.1. Definition of the Study Area
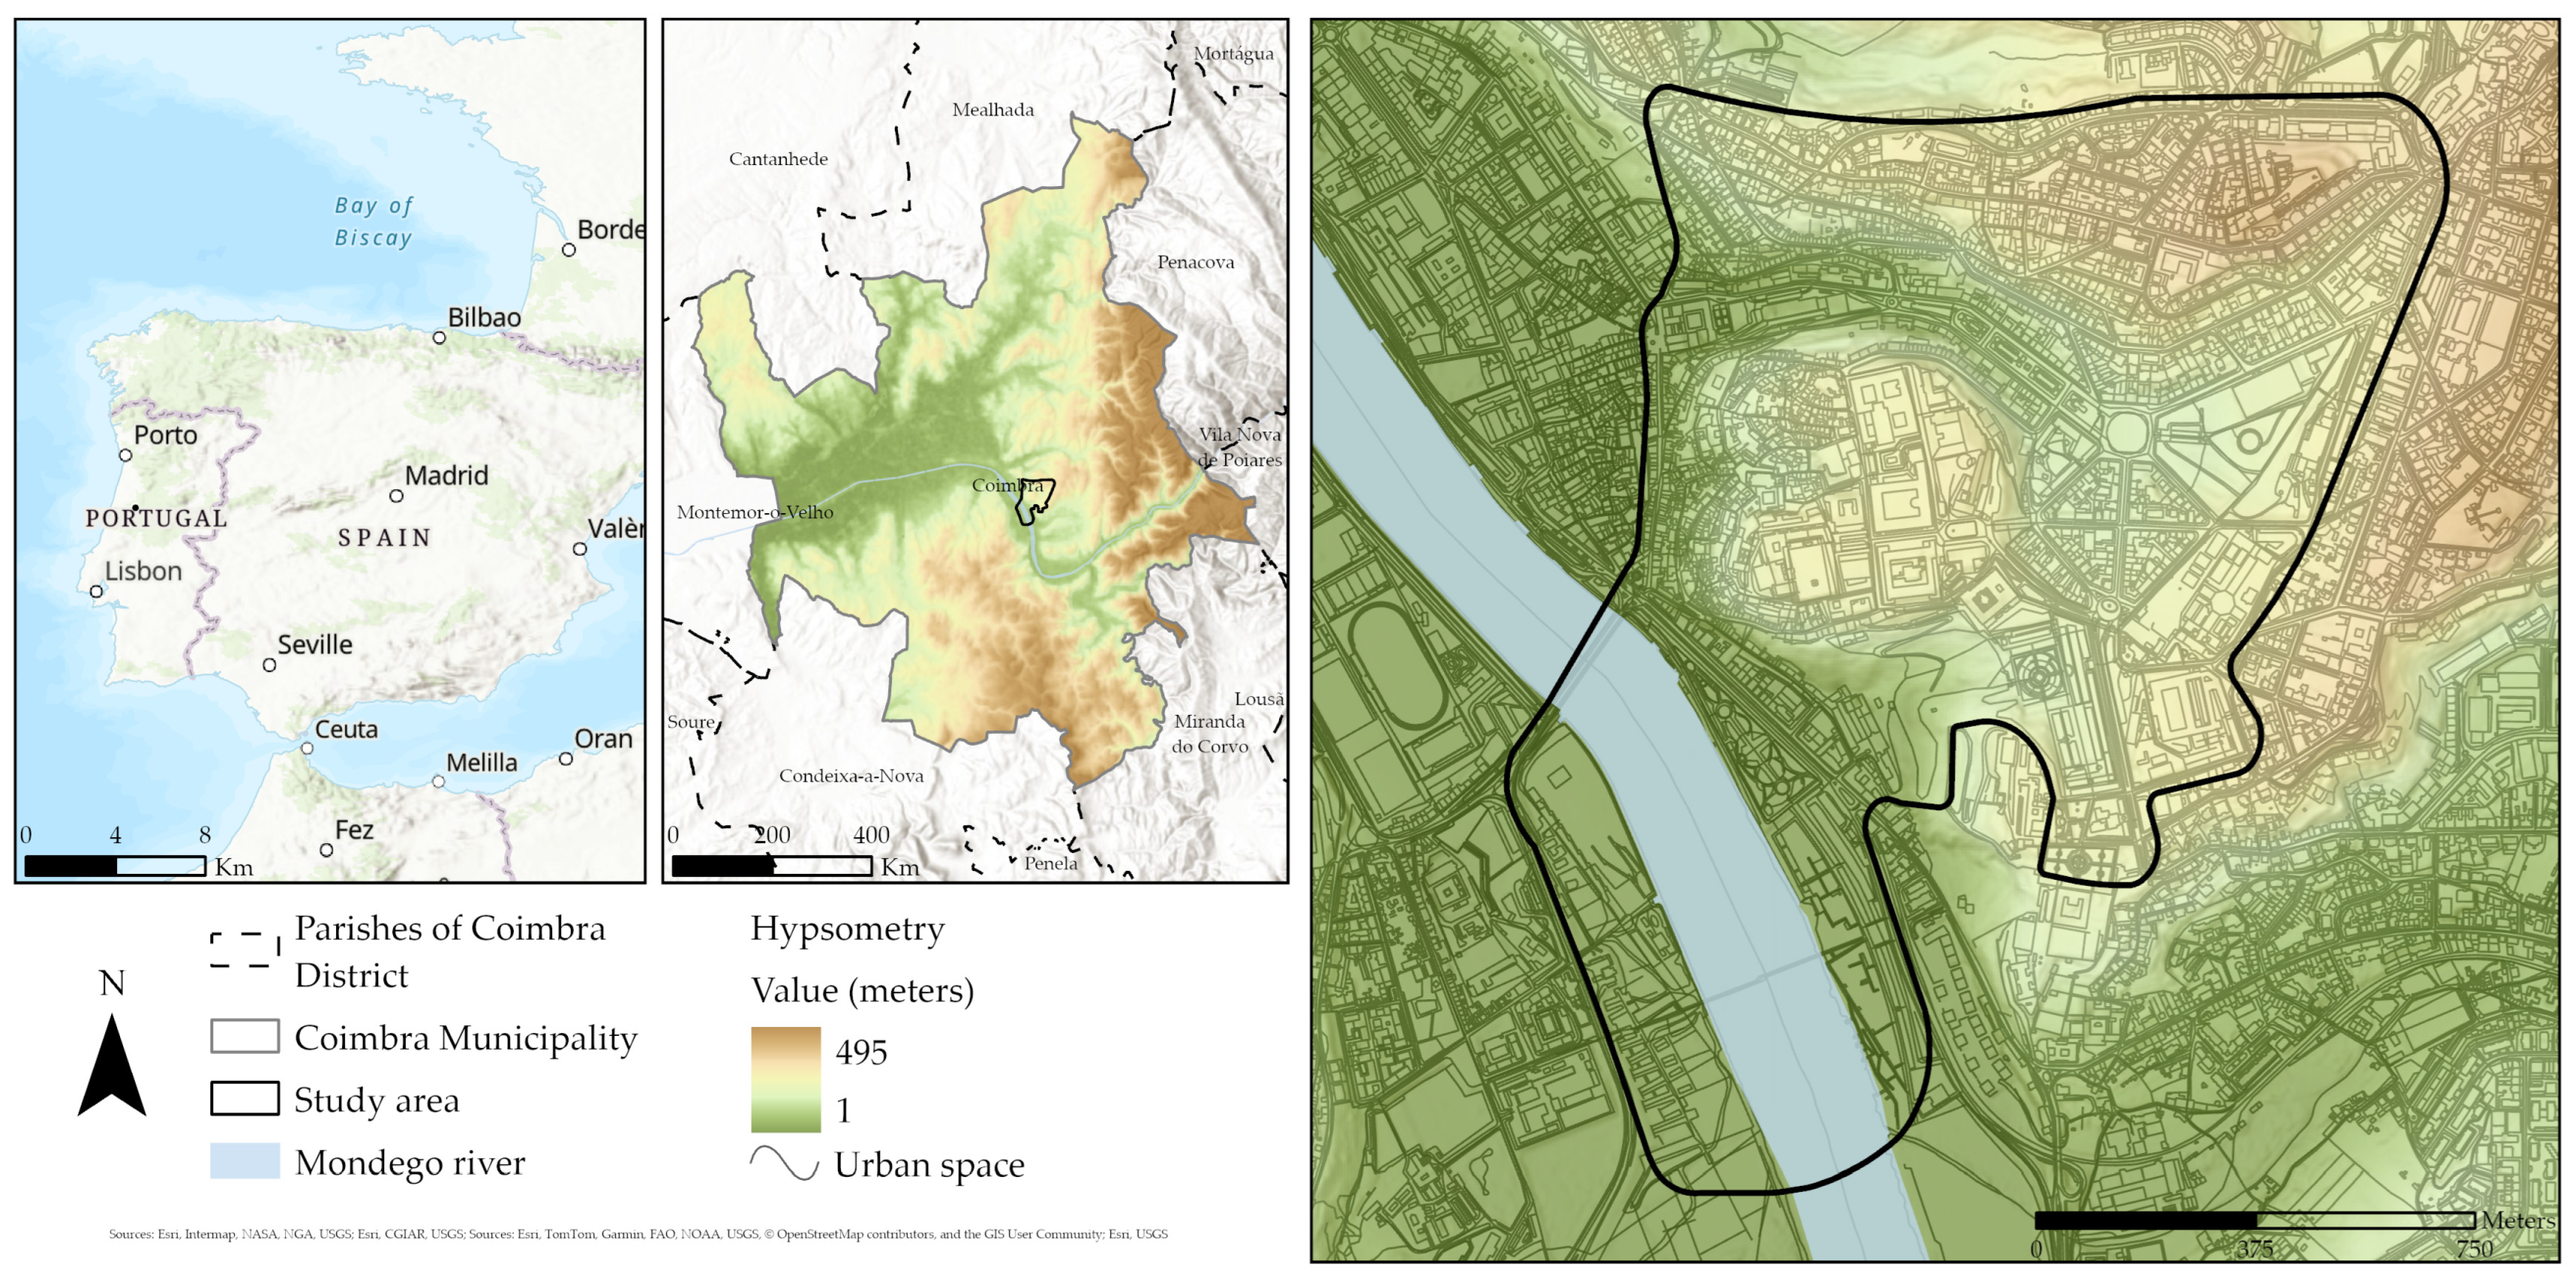
Coimbra, a city known for its topographical diversity (
Figure 1), provided an ideal backdrop for this investigation [
37]. To capture a comprehensive understanding of UHI effects under extreme heat episodes, this study incorporated three distinct data collection periods: 28 February 2022, 11 May 2022, and 8 July 2022. The selection of the three survey days was based on the identification of thermally anomalous conditions relative to the local climatological background of Coimbra. Specifically, each field campaign was conducted on days in which maximum air temperatures exceeded the long-term monthly mean values reported for the 1991–2020 climatological normal, and were associated with synoptic-scale heat advection patterns documented in regional meteorological records. While these days do not necessarily correspond to formally defined heatwave episodes according to WMO criteria, they represent positive thermal anomalies that are climatically relevant for assessing urban heat exposure under demanding atmospheric conditions. This event-based sampling strategy was intentionally adopted to investigate urban thermal behavior under stress scenarios, which are particularly critical from a climate adaptation and public health perspective.
These strategically chosen dates enabled the examination of temperature variations across different seasonal contexts, thereby enhancing the robustness of our findings.
This study follows an analytical approach established and published in prior research [
38,
39,
40], aimed at identifying potential locations within the city where high temperatures during extreme heat episodes contribute to the UHI effect. From 1998 [
41,
42] until the present day, this research has focused on elucidating the spatial reality of UHIs, specifically determining areas most impacted during periods of extreme heat, revealing several hotspots across the city. By incorporating data from three distinct periods, our study provided a temporal perspective on UHI dynamics, allowing for the identification of consistent hotspots as well as seasonal variations in thermal stress.
The identification of these specific locations holds significant importance in shaping Coimbra’s urban dynamics, particularly in the context of enhancing urban resilience to climate change-induced extreme heat events. The temporal approach adopted in this study underscores the urgency of implementing adaptive urban strategies, as these heat episodes pose severe implications for public health, urban comfort, and overall well-being.
The study area was chosen based on earlier research focused on the city of Coimbra, including work by the authors of [
41,
42] and a more recent study by the authors of [
43,
44,
45,
46,
47,
48,
49], which highlighted the presence of UHIs in established urban zones.
The empirical dataset is derived from three intensive field campaigns conducted under thermally anomalous conditions rather than from continuous long-term monitoring. This design does not aim to provide a climatological characterization of the urban heat island in Coimbra, but rather to capture process-oriented microclimatic contrasts under extreme heat exposure scenarios. Event-based field campaigns are widely used in urban climatology to resolve fine-scale thermal gradients that are often smoothed out in long-term station-based datasets.
Although this approach limits temporal generalization, it enhances spatial resolution and diagnostic capacity at pedestrian level, allowing for a detailed examination of how urban morphology, vegetation structure, and proximity to water bodies modulate heat exposure during critical thermal episodes. These field campaigns are part of a broader monitoring effort conducted over the last eight years, within which the present dataset represents a particularly illustrative case study under well-defined anomalous thermal conditions. Future work combining these intensive campaigns with continuous multi-day or seasonal monitoring would further strengthen the temporal robustness of the findings.
Our study area (
Figure 1) ranges in elevation from 20 to 125 m and features a distinct topographic division, with two prominent elevated sectors clearly standing out from the surrounding lower-lying areas.
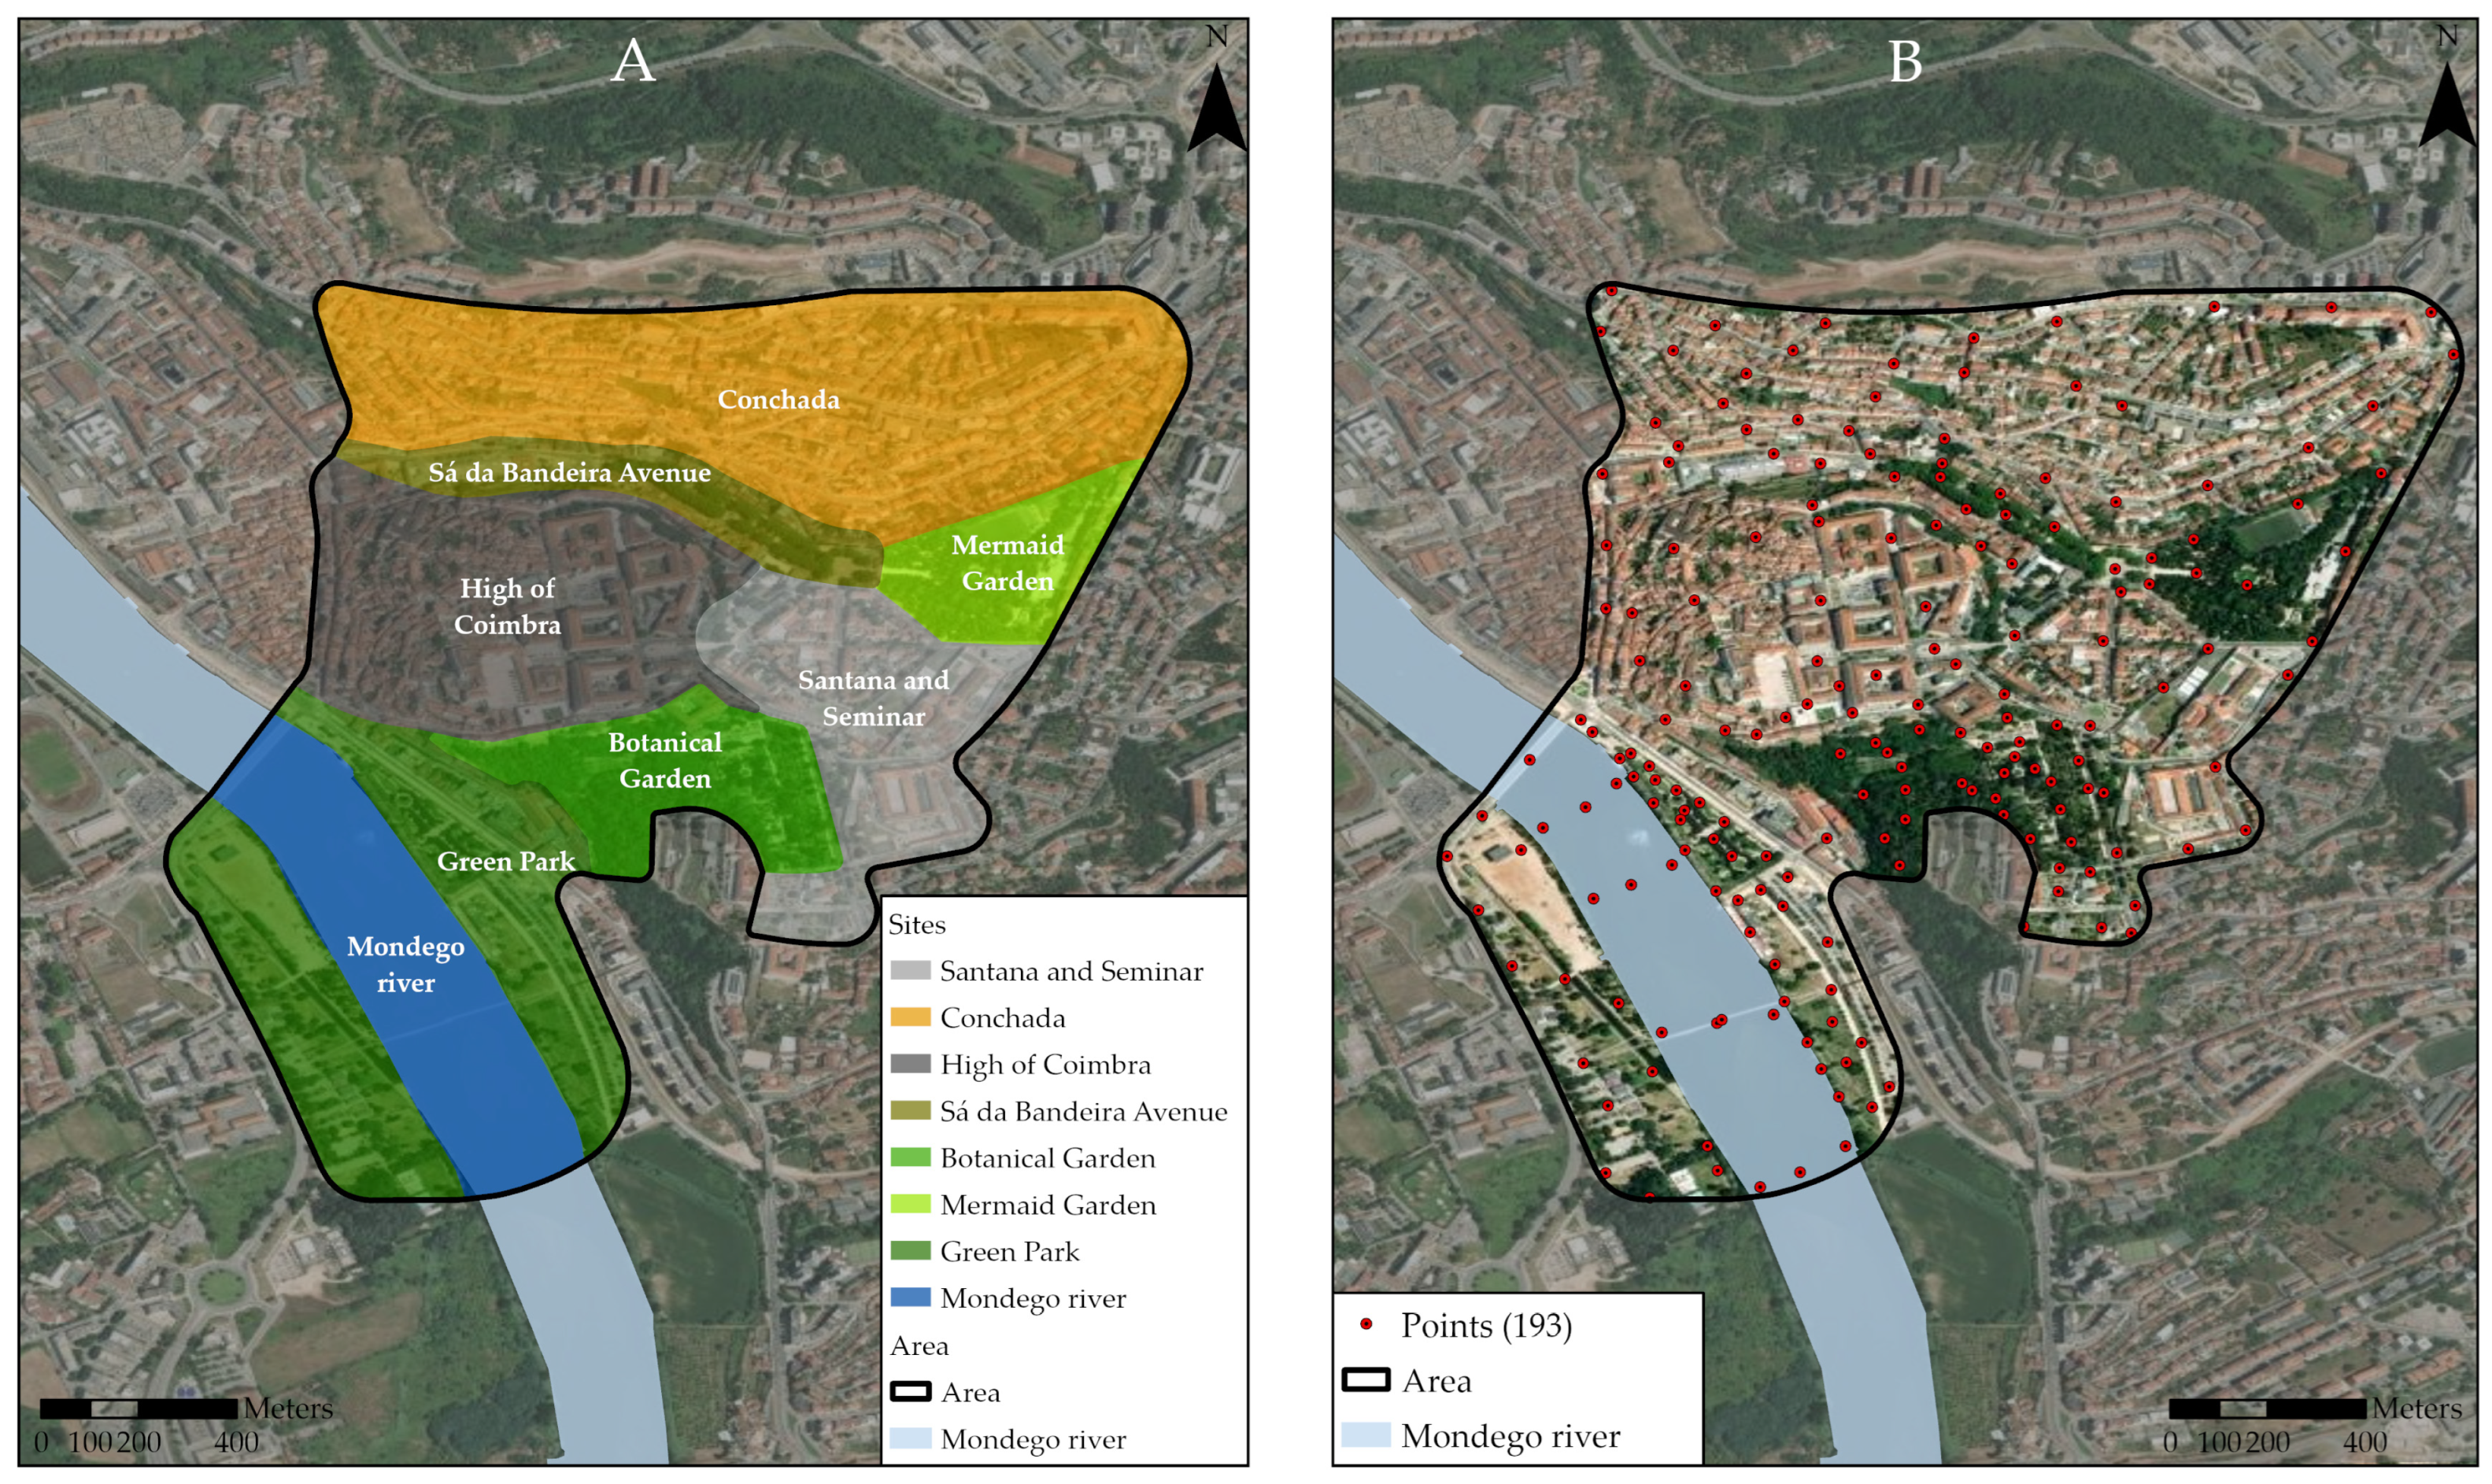
The study encompassed varied sites within the city, ranging from densely built-up areas characterized by towering structures and minimal greenery to verdant spaces such as parks, botanical gardens, and regions adjacent to the Mondego River. The collection of data from locations (
Figure 2A) like Santana and Seminar (SS), Conchada (CH), High of Coimbra (HC), Sá da Bandeira Avenue (SB), Botanical Garden (BG), Mermaid Garden (MG), Green Park (GP), and the Mondego River (MR) facilitated a comprehensive assessment of temperature fluctuations across contrasting urban landscapes.
Our study area was selected to discern temperature variations between urban green spaces and their adjacent urban areas, with the specific objective of delineating UHIs and determining their precise locations within the urban landscape. Methodically, this area was subdivided into multiple heterogeneous sectors, each possessing distinct characteristics, enabling a dynamic comparison and interaction among them.
We included three primary green spaces within the city of Coimbra: The Botanical Garden of the University of Coimbra, characterized by a walled garden hosting several tree species, including centenary trees. This area features diverse tree mosaics and a prevailing dense tree canopy, along with small lakes. The MG presents an open setting adjacent to main traffic-concentrated streets, featuring a medium-low-sized lake and trees spaced farther apart compared to the BG, encompassing a smaller area. The GP, known for its centenary trees, offers a blend of grassy gardens and proximity to the MR. This open space promotes increased air circulation. Additionally, the mixed-use area of SB boasts a green corridor adorned with deciduous trees, situated amidst a varied collection of buildings and streets paved with sidewalks and asphalt.
Conversely, we identified areas characterized by substantial built-up space, such as CH. Situated on an elevated ridge with a south-facing slope, CH is densely urbanized, featuring tall buildings that impede air circulation, resulting in restricted airflow. The narrow streets further hinder wind movement, contributing to air strangulation. The abundance of tall buildings in this area leads to heat retention, while direct and diffuse reflection of sunlight is prevalent; in the HC, a flat-topped hill houses historic buildings, integral to the University of Coimbra’s heritage. This area exhibits a blend of direct and indirect sun exposure. The layout and orientation of these buildings directly affect the local thermodynamics, influencing the distribution of shade. Notably, the southern part of the hill, due to its altitude, receives continuous sun exposure throughout the day, contributing to its unique climatic characteristics; SSs’ significance lies in its position between the BG and the MG. This location plays a pivotal role in comprehending the impact of these green areas in an urbanized setting characterized by structures of varying sizes, limited airflow, direct and indirect sun exposure, asphalt roads, and specific areas entirely exposed to sunlight throughout the day. Additionally, the section of the MR flanked by the city’s left and right banks, constituting the GP, serves as a significant area for temperature measurements. This region serves as a distinctive element contributing to the thermal equilibrium and acts as a natural regulator of air temperatures.
2.2. Research Methods
This study employed a comprehensive methodological approach to capture real-time temperature variations across three distinct periods of the day, morning (09:30 a.m.), afternoon (03:30 p.m.), and night (09:30 p.m.), lasting 85 min each time. To enhance the robustness of our findings, data collection measurements were strategically carried out on three different dates, 28 February 2022, 11 May 2022, and 8 July 2022, representing late winter, late spring, and midsummer conditions, respectively. The selection of these specific dates was not arbitrary. Each of them corresponded to days in which air temperatures exceeded the climatological mean values expected for the respective season in the city of Coimbra. The February observation occurred during an atypically warmer day within the winter cycle, enabling the analysis of early onset warming and highlighting infrastructural thermal retention even under normally cooling seasonal conditions. The May measurement coincided with the first significant rise in late spring temperatures, thereby capturing the transitional amplification of urban heat accumulation just before the seasonal peak. Lastly, the July campaign was intentionally scheduled during a period in which temperatures were markedly above average for summer, representing a scenario of intensified urban heat stress.
This approach ensured that measurements were taken under thermally demanding atmospheric contexts, thereby maximizing the sensitivity of the dataset to detect contrasts between densely urbanized corridors and vegetated or hydrologically influenced environments. By purposefully selecting days with positive temperature anomalies relative to climatological norms, the study enhanced its capacity to evaluate how the built environment and green infrastructure respond under heat-stress regimes rather than average conditions. This strengthens the applicability of the findings to urban planning and climate resilience strategies, as it reflects realistic heat exposure episodes experienced by populations during seasonal extremes.
To avoid ambiguity, here “measurement points” refer to distinct sampling locations distributed across the study area (
n = 193;
Figure 2B). During each time slot (09:30 a.m., 03:30 p.m., and 09:30 p.m.), the seven synchronized temperature sensors were sequentially deployed along the same predefined route and in the same location order, yielding 193 location-based observations per time slot. This resulted in 579 location–time observations per sampling campaign (193 locations × 3 time slots), and 1737 observations across the three campaigns (February, May, and July). To ensure comparability across dates, the route, deployment sequence, and operational procedure were replicated in all campaigns, and inter-site contrasts were evaluated within each time slot to minimize temporal confounding while resolving fine-scale spatial heterogeneity.
Our temperature points were collected with 7 temperature sensors (Tinytag Plus 2-TGP-4020, Chichester, West Sussex, UK), which were all units tested and calibrated in a laboratory environment prior to deployment. Calibration procedures involved cross-validation against a certified reference thermometer and co-location testing between sensors to assess instrument offsets and linearity over the range of expected ambient temperatures. This approach ensured traceability and minimized potential biases. This analysis method integrates a previously utilized methodology [
44,
45,
46,
47,
48], which recorded air temperature measurements were performed at a height of 1.5 m above ground level. This measurement height was deliberately chosen to represent the thermal conditions experienced by pedestrians and urban users, as it closely corresponds to the typical human breathing zone during outdoor activities such as walking or sitting on urban furniture. While standard meteorological observations are conventionally conducted at 2.0 m, urban microclimate and thermal comfort research frequently adopts lower measurement heights to better capture near-ground thermal gradients and human thermal exposure. This approach is particularly relevant in urban environments, where surface materials, vegetation, shading, and urban morphology generate pronounced vertical temperature variations at pedestrian level, establishing linkages between different analysis zones to create intermediate points for comparative analysis.
When acquiring data from the MR, measurements were obtained from a boat at a consistent height of 1.5 m above the water surface, with readings taken away from direct sunlight.
During post-processing, the recorded datasets were subjected to synchronization adjustments and quality control procedures. These included the removal of anomalous spikes attributable to transient effects (e.g., sudden shading, incidental contact with vegetation or droplets near the MR), as well as alignment of timestamps across sensors. While these corrective steps slightly attenuated the strict uniformity of the nominal 60 s interval, they remained fully contained within the prescribed temporal envelope. In other words, adjustments did not extend the temporal window represented by each reading, preserving the intended temporal granularity while ensuring high data reliability.
A shorter recording interval (e.g., 1–10 s) was considered but rejected due to two practical limitations: (i) increased campaign duration and storage demands, which would have exceeded the logistical scope of the project; (ii) diminished feasibility of maintaining spatial synchronization across the seven monitored points. We therefore acknowledge as a methodological limitation that our design cannot resolve sub-minute meteorological events, although these are not typical in the open urban environments investigated.
The adopted setup (≈1 min interval; 85 min per period; three dates representing anomalously warm seasonal conditions) provided a robust dataset for analyzing urban thermal gradients. Corrections made during processing remained within the nominal time window of the records and did not degrade the capacity to detect inter-site differences. For future campaigns, complementary continuous multiday monitoring could further characterize temporal persistence, while dedicated radiation shields or aspirated probes could refine measurement fidelity under peak solar loading.
In accordance with the metrological requirements for microclimate measuring instruments specified in ISO 7726:2025 [
50], all air-temperature values reported in this manuscript (both measured and EBK-interpolated/predicted) are expressed to one decimal place (0.1 °C).
Subsequently, the raw temperature datasets underwent statistical, graphical and spatial post-processing, culminating in the development of thematic geospatial maps illustrating the spatial gradients and thermal heterogeneity across the study area. All spatial interpolation procedures were conducted using ArcGIS Pro 3.5 (ESRI-Redlands, California), applying the Empirical Bayesian Kriging (EBK) algorithm to generate continuous temperature surfaces from point-based measurements [
44,
45,
46,
47,
48]. The choice of EBK over conventional methods (such as Ordinary Kriging, IDW, or Spline interpolation) was motivated by its enhanced capacity to quantify and incorporate local uncertainty arising from sparse point distributions and heterogeneous spatial structures—conditions characteristic of urban microclimatic datasets. Model performance was evaluated using the ArcGIS Pro 3.5 cross-validation outputs, confirming that interpolation errors remained within acceptable bounds for high-resolution microclimatic mapping of intra-urban thermal gradients. EBK is particularly advantageous in urban climatology applications because it automatically models the semivariogram through iterative simulation, thereby avoiding assumptions of strict stationarity. By repeatedly estimating and updating local semivariogram parameters, EBK yields robust interpolations without requiring manual variogram fitting, which is a known limitation of classical kriging approaches when applied to complex urban environments.
These variations aligned with the hottest month recorded in Coimbra [
41,
42,
46,
47,
48], and our survey day was consistent with the anomalously warm conditions recorded during that period. The combination of intra-daily sampling (morning, afternoon, night) and supra-seasonal sampling (winter–spring–summer) provided a robust temporal framework, enabling us to assess not only short-term diurnal dynamics but also medium-term seasonal transitions. This design allowed fine-scale identification of microclimatic divergences, demonstrating how spatial characteristics—such as vegetation cover, altitude, and surface impermeability—mediate temperature fluctuations throughout the year. Intra-urban thermal hotspots were identified based on consistent relative ranking and recurrence of elevated temperatures across time slots and/or campaigns, allowing the mapping of locations that repeatedly exhibited the highest near-surface air-temperature levels under anomalously warm conditions.
This methodological strategy therefore ensured the acquisition of temperature data capable of revealing spatially contrasted thermal behaviors, offering a reliable foundation for understanding the microclimatic functioning of green spaces and densely urbanized sectors, particularly in the context of urban heat island processes and climate adaptation planning.
3. Results
3.1. Statistical Analysis of Temperature Variability During Extreme Heat Waves in Coimbra: Seasonal and Spatial Variability by Month
The statistical analysis of temperature data collected during extreme heat waves in Coimbra across the months of February, May, and July revealed clear seasonal progressions in temperature patterns. The results demonstrated not only the expected seasonal warming trend but also distinct site-specific thermal behaviors, which suggest the influence of microclimatic factors, land use characteristics, and UHI effects. These patterns provide a comprehensive understanding of the temperature distribution across different locations and time periods. The assessment focused on minimum values, quartiles, interquartile ranges (IQR), maximum values, and mean temperatures at different locations and time periods (morning, afternoon, and night).
3.1.1. February
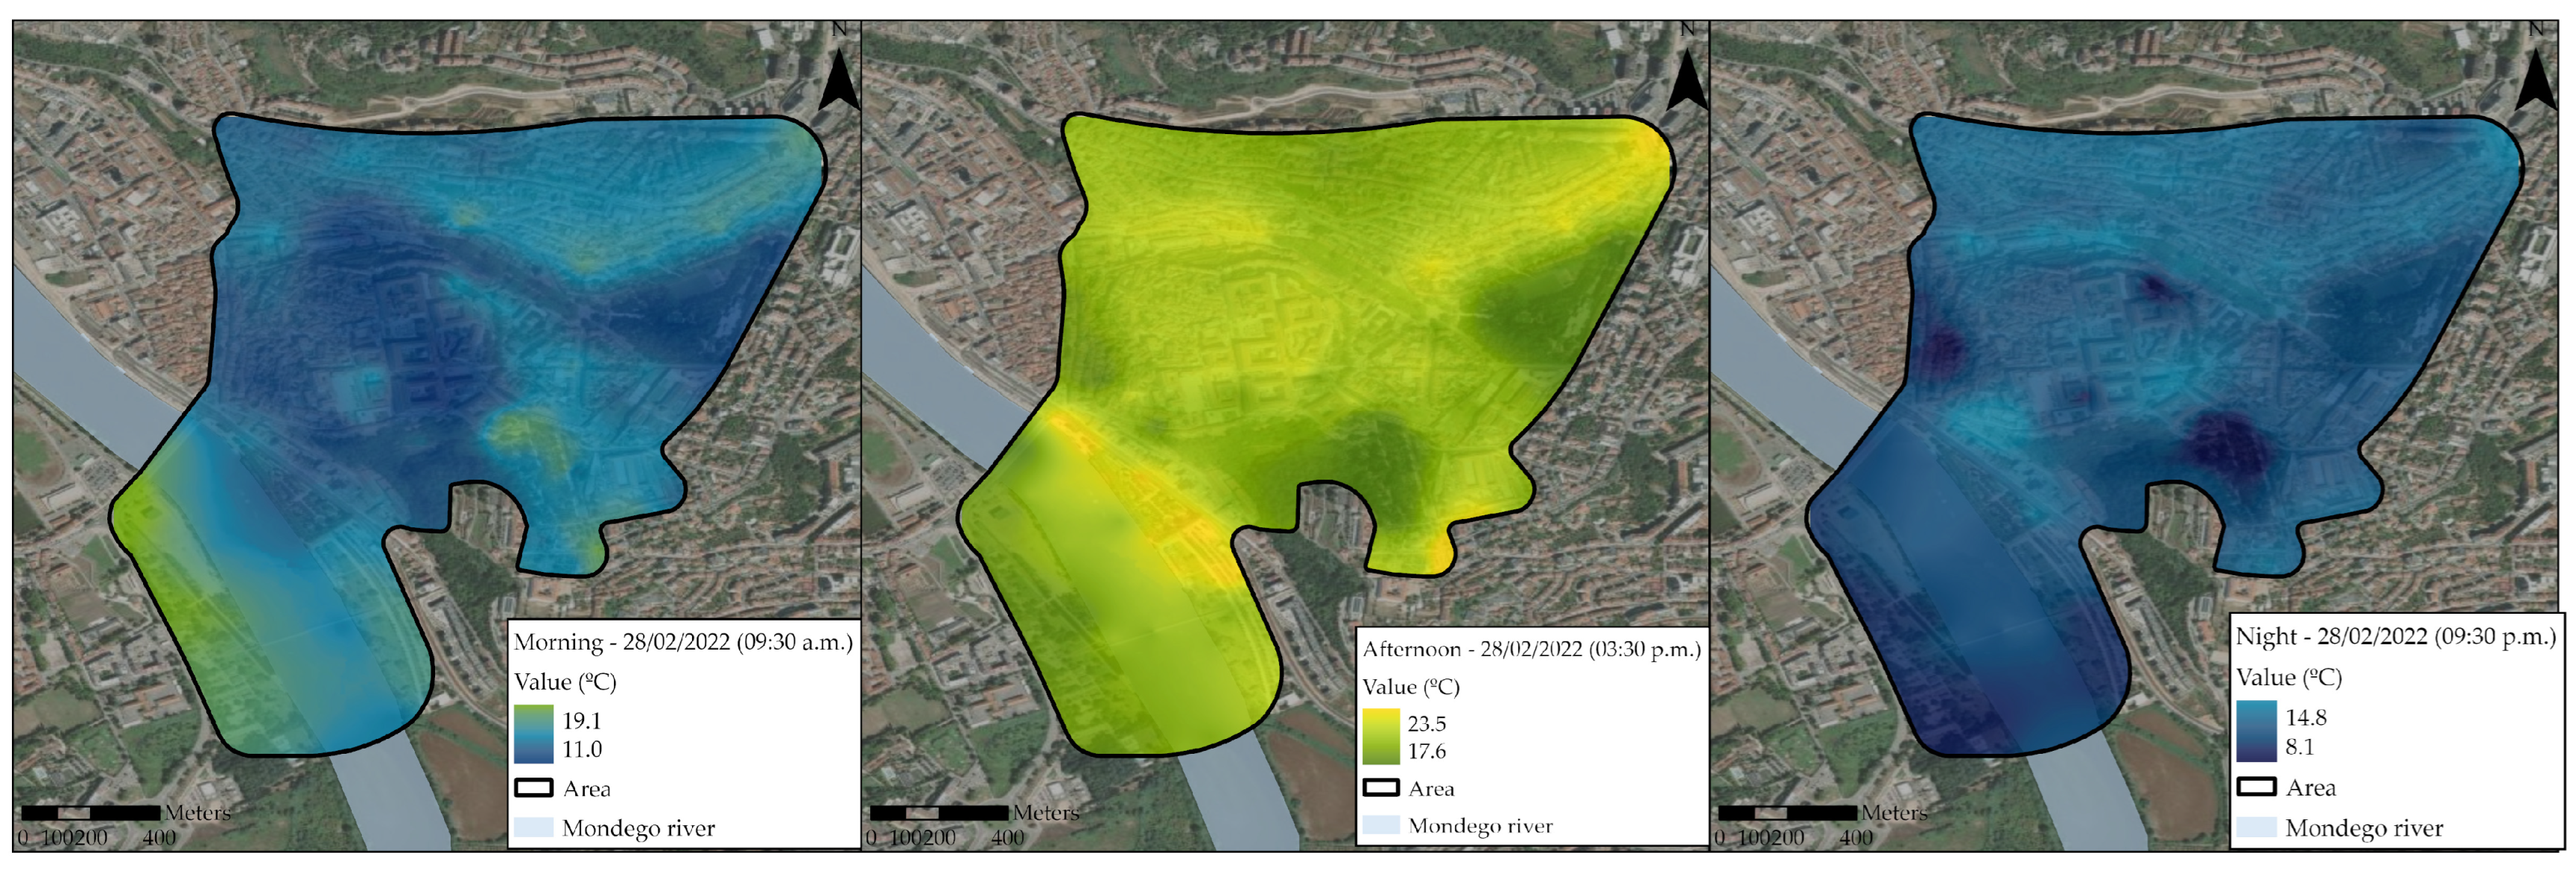
In February (
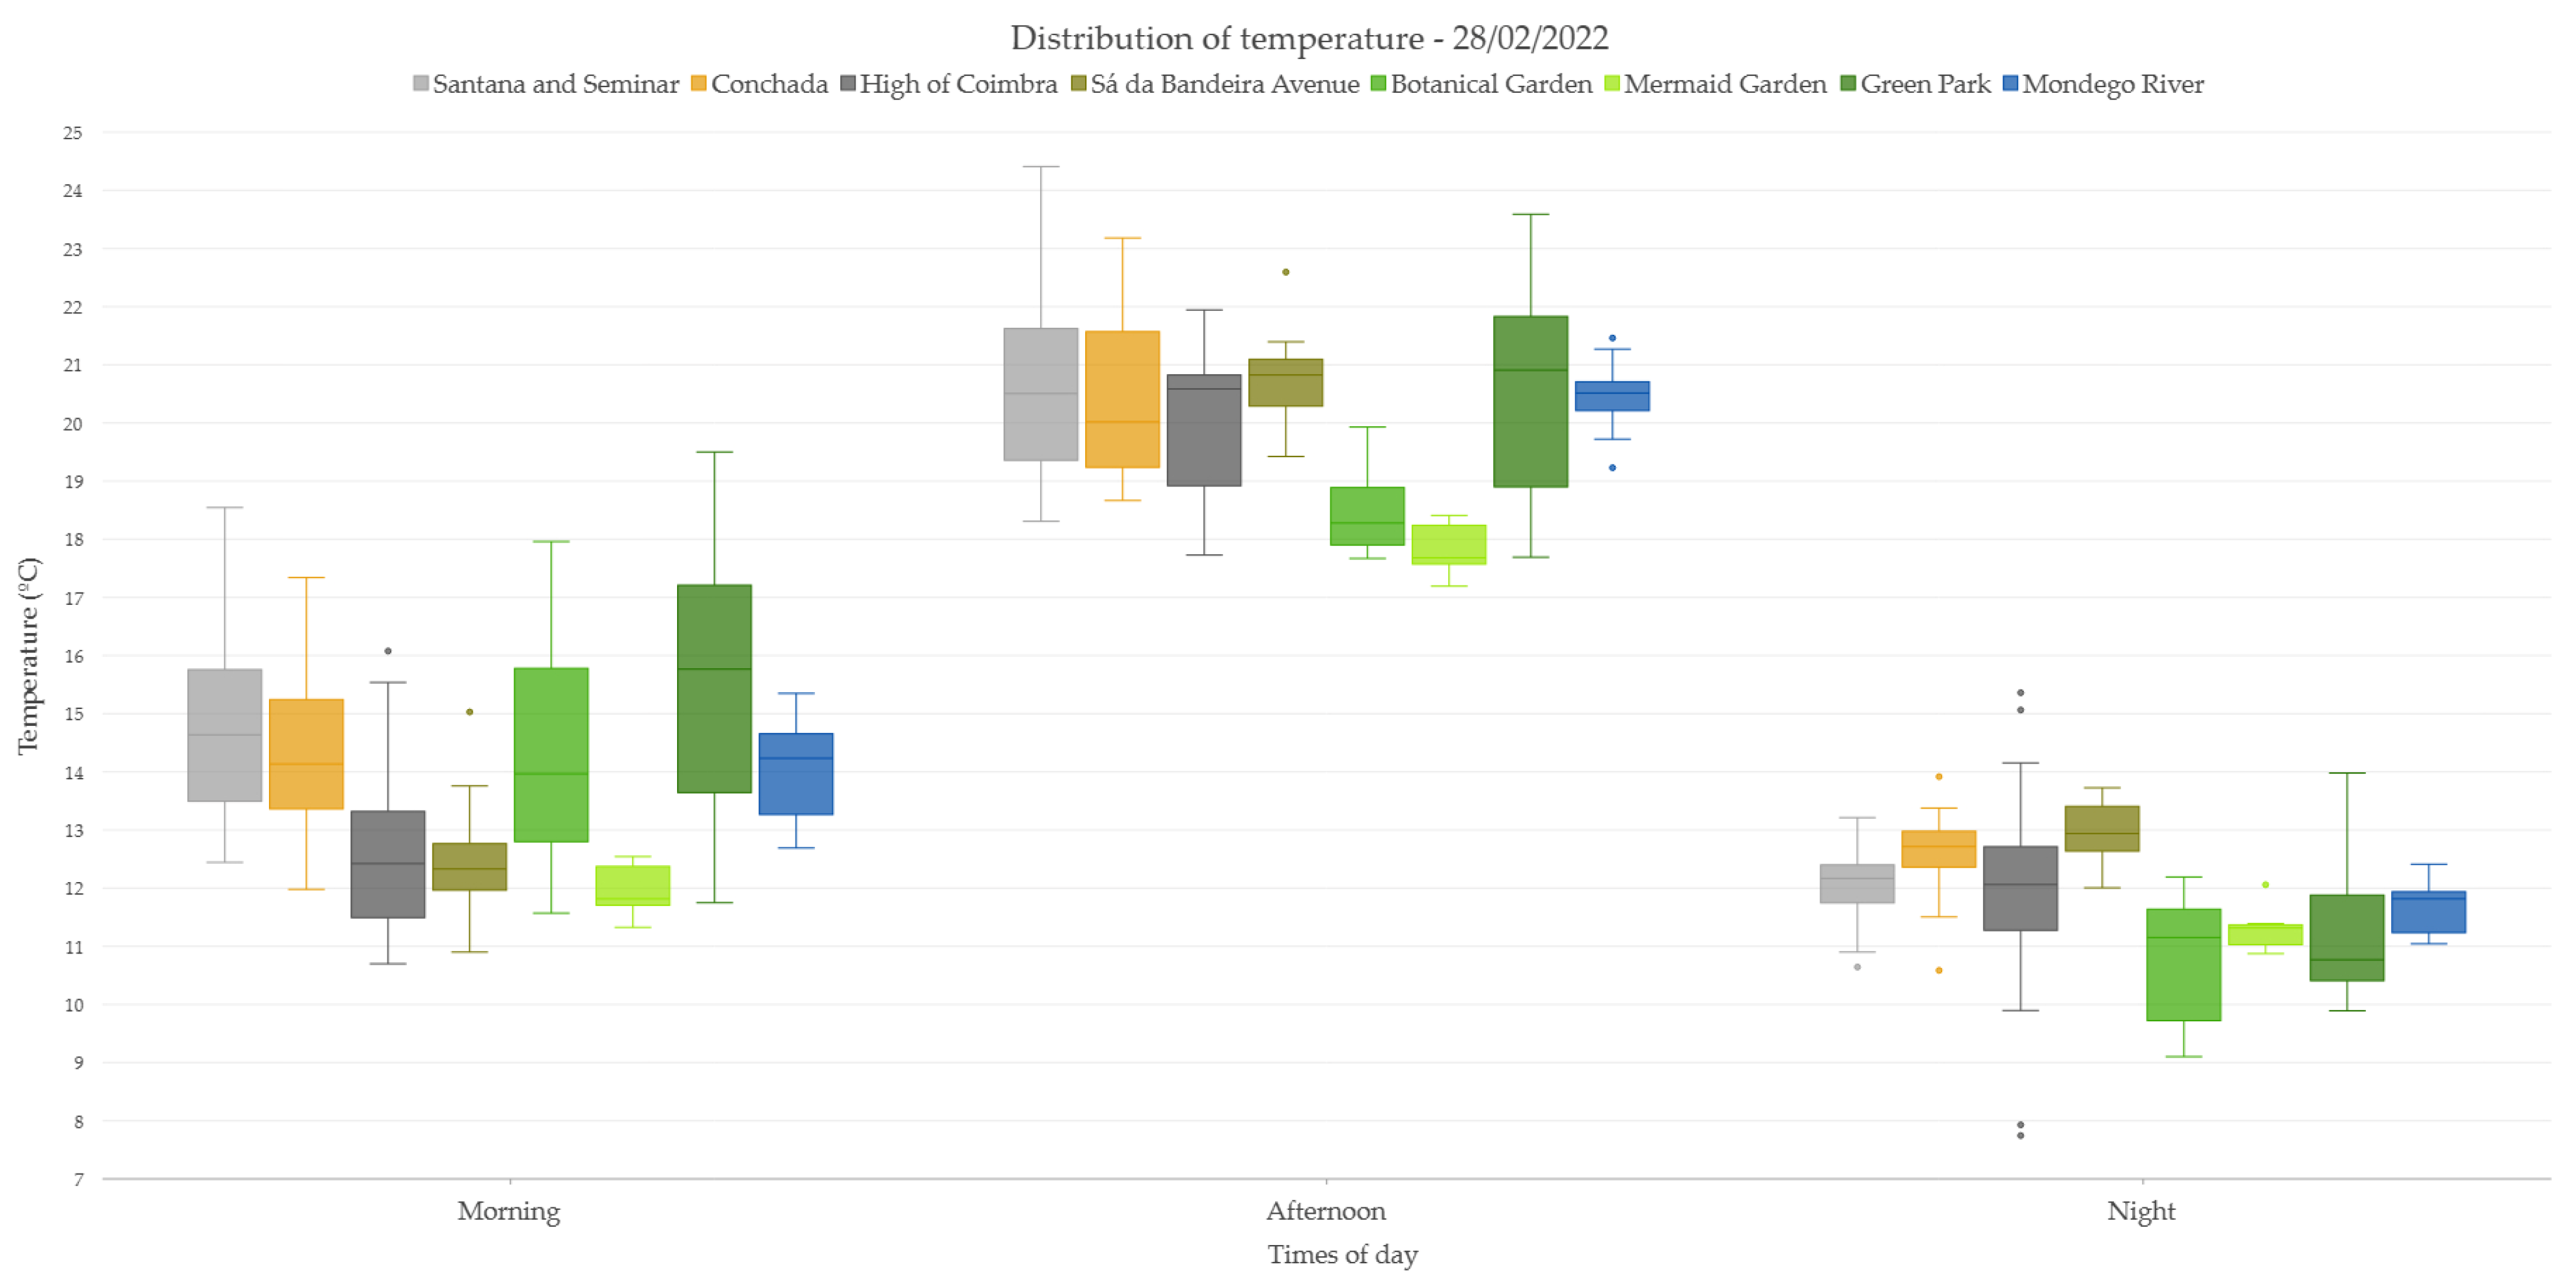
Figure 3), temperatures exhibited significant variability between different periods of the day, characteristic of the winter season. Minimum values ranged from 7.7 °C (HC at night) to 12.7 °C (MR in the morning), indicating pronounced nighttime cooling in elevated areas.
The strongest warming (afternoon) occurred in urbanized locations, particularly SS, demonstrating the UHI effect. Green spaces moderated extreme warming. SS had consistently exhibited the highest temperature values, particularly in the afternoon, when maximum temperatures had reached 24.4 °C. The UHI effect had been evident, as these locations had recorded elevated median temperatures of 14.6 °C in the morning, 20.5 °C in the afternoon, and 12.8 °C at night. CH had displayed intermediate thermal conditions, with temperatures closely resembling those of SS but with slightly reduced variability. Afternoon temperatures had reached a median of 20 °C, while the lowest values at night had been recorded at 10.6 °C.
By night, the most significant temperature drops were observed in vegetated areas and high-altitude locations, whereas urban heat retention kept temperatures relatively elevated in built-up regions.
A detailed examination of spatial variation in February suggests that areas with greater vegetation coverage, such as the BG and GP, showed more stable temperature profiles, particularly at night. This contrasts with more built-up environments, like SS, which recorded the highest peaks in temperature during the afternoon, emphasizing the heat retention properties of urban infrastructure.
In February, a typical winter month, the lowest temperature ranges were observed across all locations. First quartile (Q1) values consistently remained below 12 °C at most sites. While the IQR was generally narrow, suggesting limited temperature variability, GP and the BG exhibited wider IQRs, indicating localized fluctuations. Maximum recorded temperatures rarely exceeded 20 °C, and mean temperatures aligned with expected winter cooling trends further detailed in
Table 1. During morning and night, Q1 values typically ranged from 11 °C to 13 °C. In contrast, the afternoon showed a distinct warming pattern, with values reaching 17–20 °C due to increased solar radiation. Notable outliers in early morning readings suggested instances of cold air pooling, particularly in sheltered locations with limited solar exposure.
In the same Table, median temperatures fluctuated between 11 °C and 14 °C in the morning and night, rising to 20–21 °C in the afternoon, highlighting a clear diurnal heating effect. The highest temperature recorded was 24.4 °C (SS in the afternoon). IQR values, representing temperature dispersion, ranged from 0.3 °C (MG at night) to 3.6 °C (GP in the morning), suggesting greater variability in open and green spaces. Mean temperatures followed a similar trend: lowest at night (~11–12 °C) and highest in the afternoon (~18–21 °C). The BG consistently demonstrated the cooling effects of vegetated areas, with median temperatures of 14 °C in the morning, 18.3 °C in the afternoon, and 11.2 °C at night.
A detailed examination of spatial temperature variation in February revealed that areas with greater vegetation coverage, such as the BG and GP, exhibited more stable temperature profiles, particularly at night (
Figure 4). The MG exhibited the lowest nocturnal IQR among all monitored locations (0.3 °C), indicating an exceptionally stable thermal environment during the night period. This value is substantially lower than those observed in both densely urbanized areas and larger green spaces, reflecting minimal short-term temperature variability. Such stability is likely associated with the garden’s compact morphology, limited ventilation, and localized microclimatic buffering, including moisture retention and reduced radiative cooling due to vegetation structure. These characteristics promote rapid thermal equilibration after sunset and effectively dampen nocturnal temperature fluctuations.
This contrasted sharply with more built-up environments like SS, which recorded the highest afternoon temperature peaks, emphasizing the heat retention properties of urban infrastructure. The IQR in SS indicated a moderate dispersion of values, signifying stable but consistently high temperatures throughout the day.
Furthermore, the thermal influence of the MR played a significant role in temperature stabilization. The median morning temperature at the MR site was 14.2 °C, one of the highest among all locations. Afternoon temperatures reached 20.5 °C, with a relatively low IQR of 0.5 °C, highlighting the buffering effect of the water body on daily temperature fluctuations. Nighttime cooling was also more gradual, with minimum temperatures remaining above 11 °C.
3.1.2. May
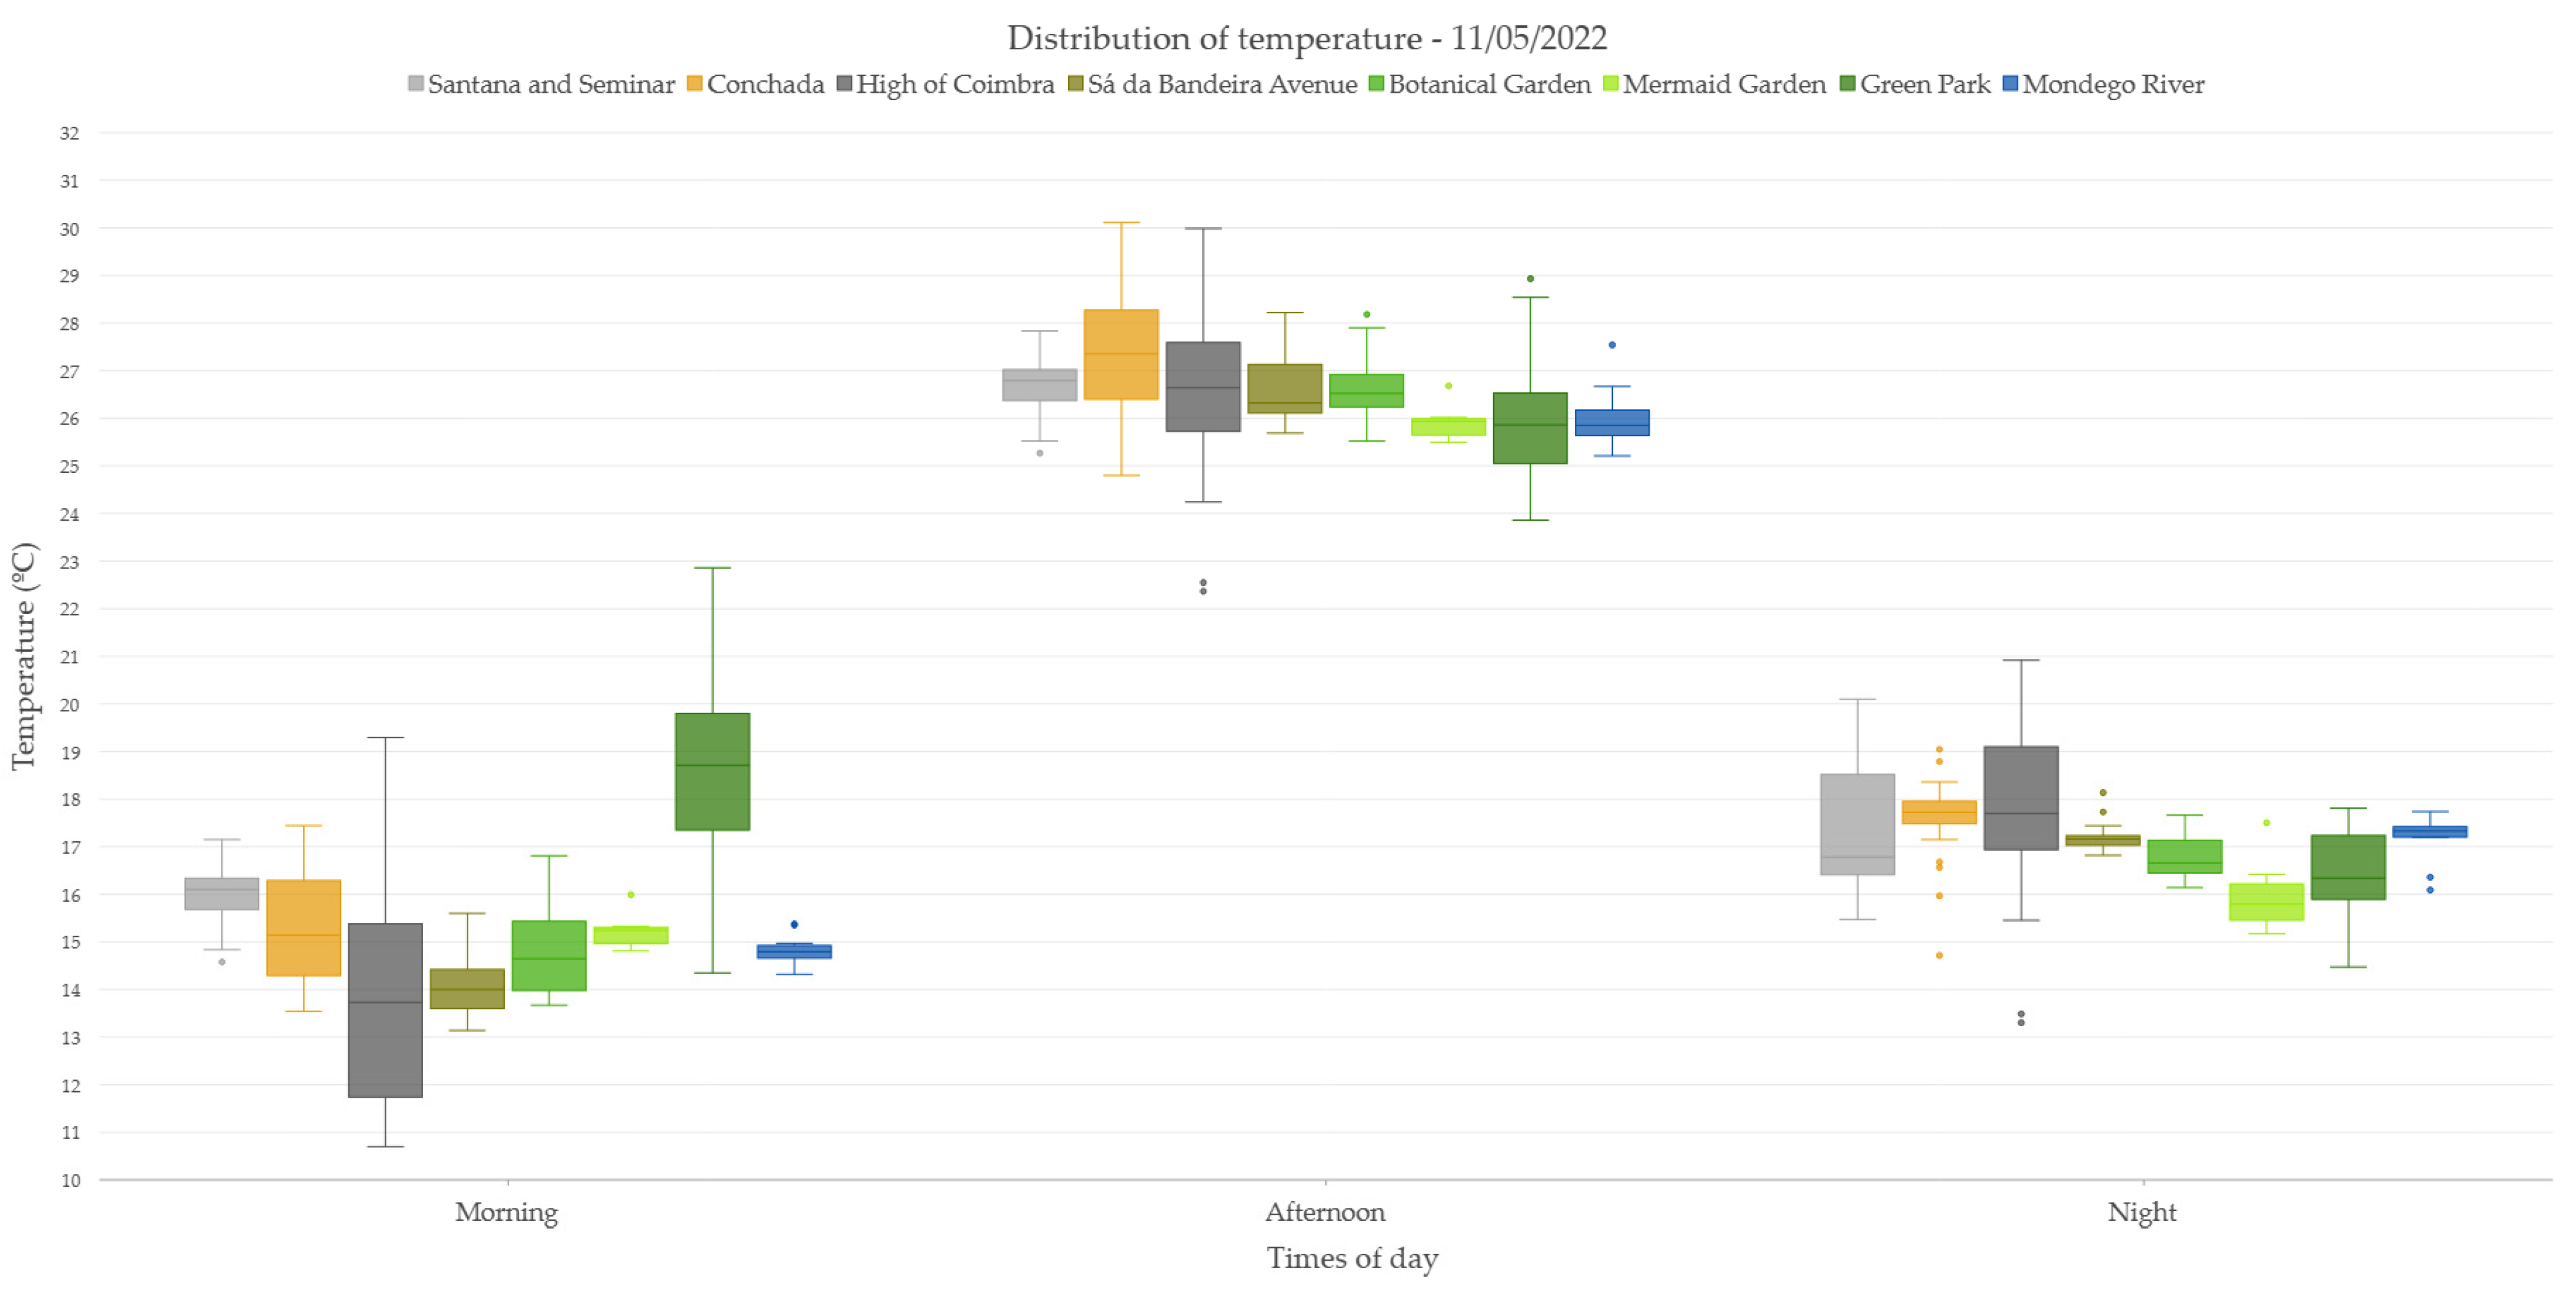
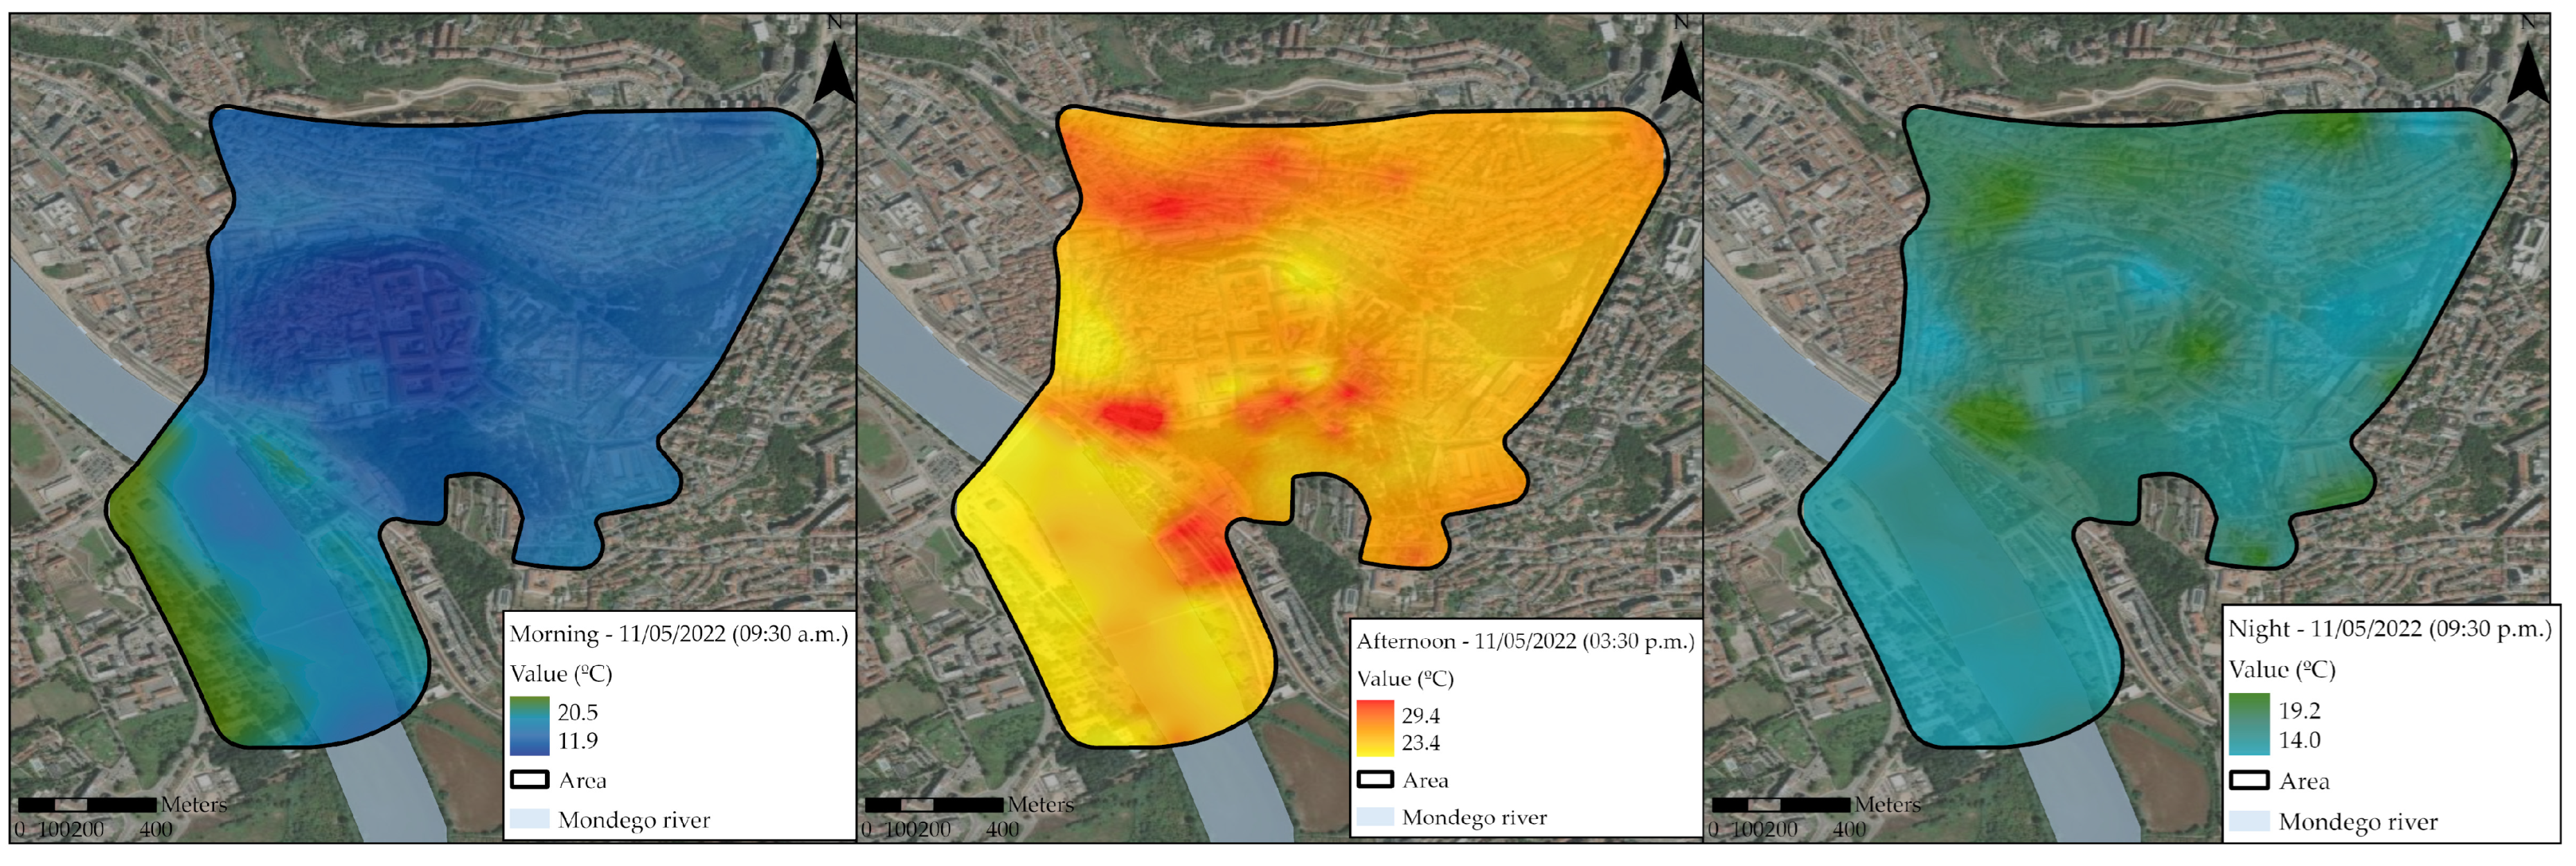
May marked a significant transition towards warmer conditions, showing reduced thermal variation between periods of the day (
Figure 5). Minimum temperatures increased considerably compared to February, ranging from 10.7 °C (HC, in the morning) to 16.1 °C (MR, at night). Q1 values remained in the range of 13 °C to 17 °C, while median temperatures climbed to 18 °C at night and 27 °C in the afternoon. Notably, SS sites exhibited relatively stable temperatures, with morning minima of 14.6 °C and afternoon maxima of 27.8 °C, demonstrating moderate thermal inertia characteristic of these urbanized areas.
In the morning, the temperature gap between urban and vegetated areas was already noticeable, with green spaces maintaining cooler conditions. The HC registered the lowest morning minimum at 10.7 °C, indicating significant nocturnal cooling at this elevated location. In contrast, the GP had a much higher morning mean temperature (18.5 °C), likely due to heat retention within its vegetative environment. Water bodies near the MR influenced higher morning temperatures, with a minimum of 14.3 °C and a mean of 15 °C, reinforcing the moderating role of water.
During the afternoon, temperatures increased across all locations, with urban centers experiencing the highest peaks, exceeding 30 °C in some cases. CH, with an afternoon maximum of 30.1 °C, stood out as particularly vulnerable to heat accumulation, likely due to its dense urban structure. SS also experienced substantial heating, reaching maximum of 27.8 °C. Green spaces again exhibited lower temperature extremes, with GP (mean 26 °C) and the BG (mean 26.6 °C) demonstrating milder afternoon conditions compared to more built-up environments.
Unlike February, nighttime temperatures remained significantly higher. Urban areas like SS, HC, and CH retained more heat, with a mean nighttime temperature of 17.4 °C. In contrast, areas with more vegetation, such as GP (16.5 °C) and the MG (16 °C), exhibited lower nocturnal heat retention. SB, an urban corridor, maintained a particularly narrow IQR (0.2 °C), indicating minimal temperature variation, possibly due to urban heat retention effects. Meanwhile, the MR showed a stabilizing effect, with a mean of 17.2 °C, confirming its thermal regulatory influence during nocturnal hours.
May represented the transition into the warmer season, marked by an observable increase in mean temperatures and a broader distribution of quartiles. The Q1 values in May were notably higher than February’s median values, illustrating a clear shift towards a warmer thermal regime. The Q3 was frequently observed in the mid-20 °C range, with an IQR expansion across multiple locations, reflecting greater temperature fluctuations.
As shown in
Table 2, afternoon temperatures in May displayed wider IQRs, reaching extremes above 30 °C in sites like CH and HC. The recorded maximum temperatures indicated the first significant peaks of seasonal heat buildup. Mean temperature values showed an upward trend, though specific locations, such as the MR, presented narrower interquartile spreads, reinforcing the thermal buffering effects of water bodies in stabilizing temperature variations.
May marked a clear transition towards warmer conditions, with reduced thermal variation between periods of the day. Minimum temperatures increased significantly compared to February, ranging from 10.7 °C (HC in the morning) to 16.1 °C (BG and MR at night). The Q1 values remained in the range of 11 °C to 17 °C in the morning, while median temperatures climbed to 18 °C at night and 27 °C in the afternoon. Notably, SS sites exhibited relatively stable temperatures, with morning minimums of 14.6 °C and afternoon maximums of 26.7 °C, demonstrating moderate thermal inertia in these urbanized areas (
Figure 6).
Maximum temperatures increased notably in May, reaching 30.1 °C (CH in the afternoon), which reinforced the growing intensity of solar heating. IQR values ranged from a minimum of 0.2 °C (SB at night) to a maximum of 3.6 °C (HC in the morning), suggesting that areas with higher elevation continued to experience greater thermal variability. Mean temperatures in May followed a clear pattern of afternoon peaks, typically ranging from 26 °C to 27 °C, while nighttime averages stabilized between 16 °C and 18 °C. The BG and GP maintained relatively lower temperature fluctuations due to their dense vegetation cover, with mean afternoon temperatures of 26.6 °C and 26 °C, respectively, thus confirming the significant cooling effect of urban green spaces.
3.1.3. July
A spatial comparison in July (
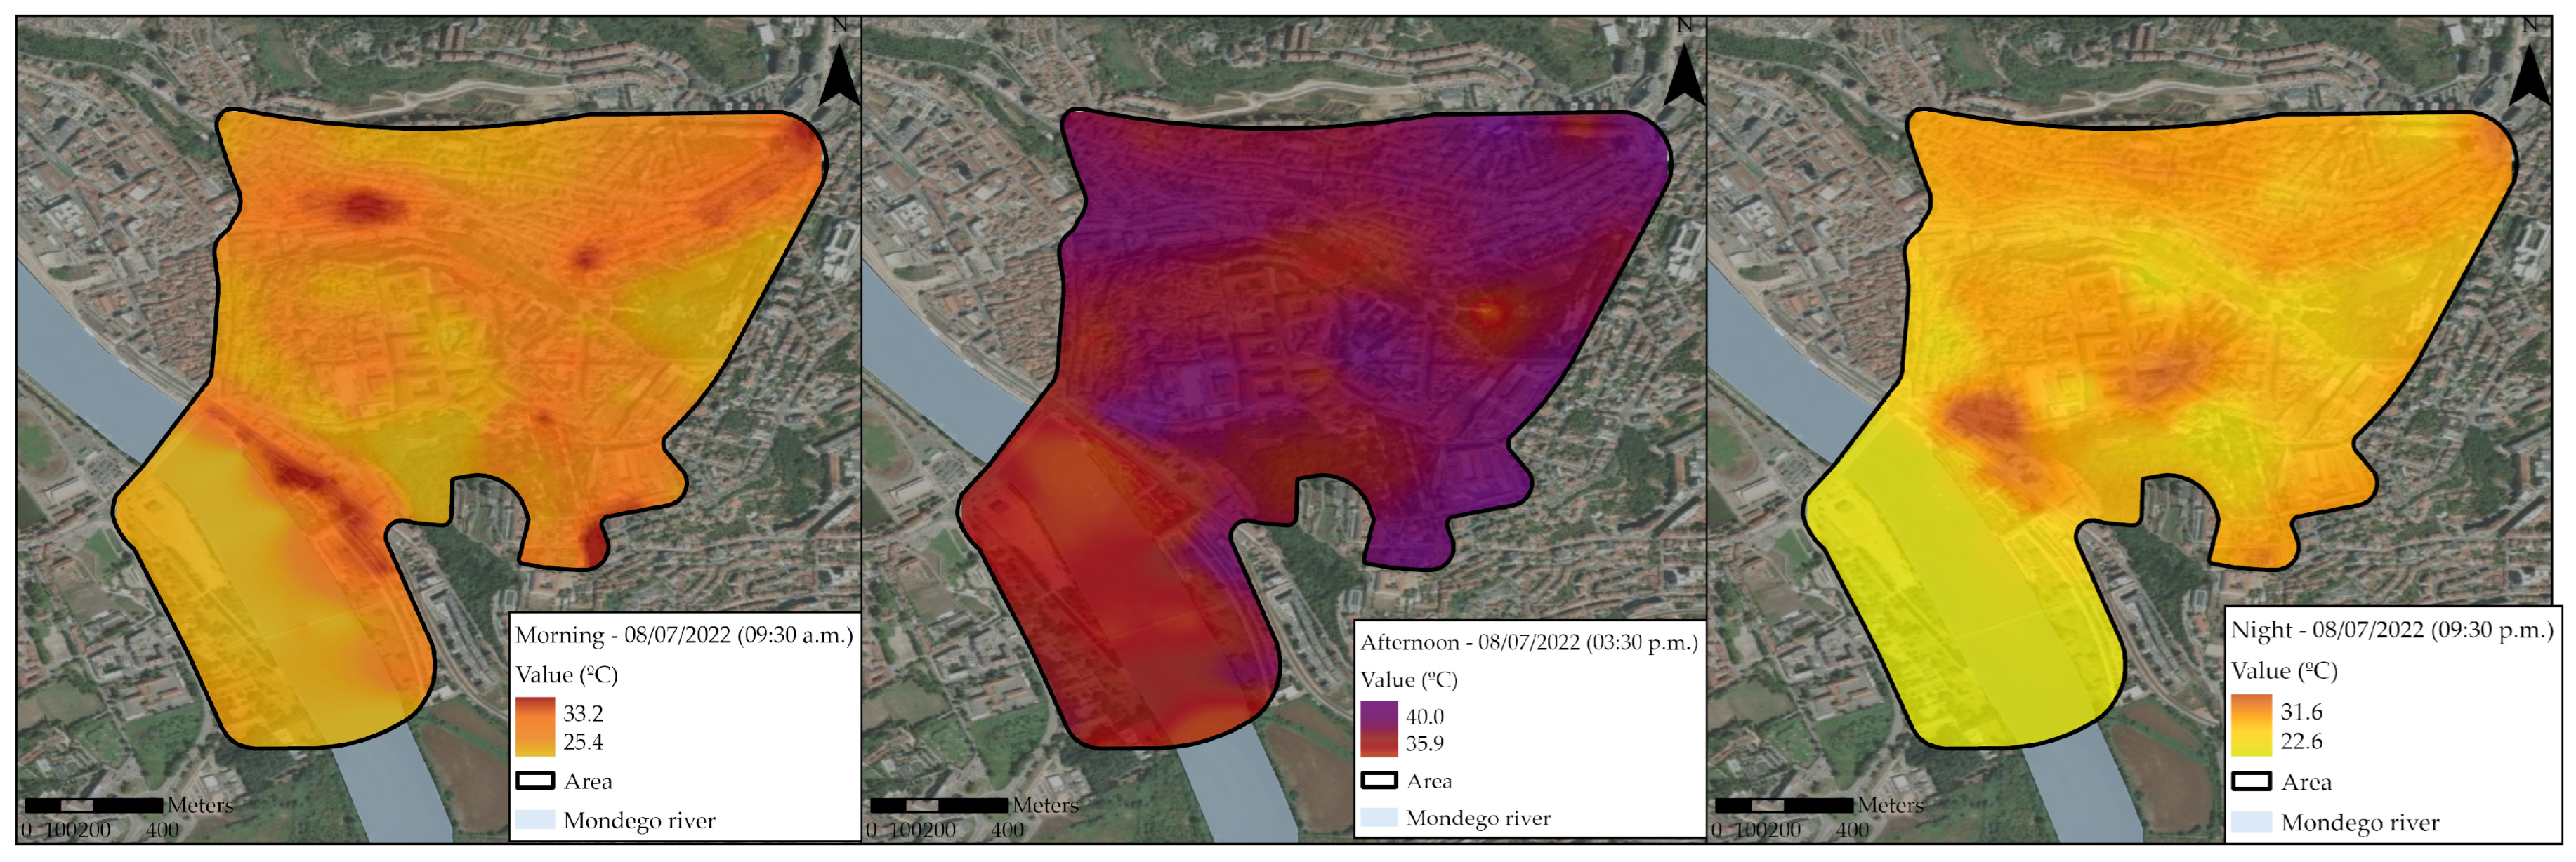
Figure 7) showed that areas with significant vegetation cover, such as the BG and GP, exhibited slower warming rates during the morning compared to urbanized zones. This variation underscored the role of greenery in moderating temperature surges early in the day.
In contrast, locations with a higher density of impervious surfaces, such as SS, demonstrated an earlier and more pronounced rise in temperature due to rapid heat absorption and limited evaporative cooling. The increased exposure to morning radiation was especially notable along SB, where reflective surfaces further intensified localized warming. Temperatures were already elevated in most locations, with urban areas showing significant residual heat from the previous day.
The intense afternoon heating was further exacerbated by prolonged solar exposure in open urban locations. The UHI effect was particularly visible in high-density regions such as SS and CH. Here, limited vegetation and dense construction retained heat for extended periods.
Conversely, parks and garden areas acted as thermal buffers, mitigating peak temperature spikes through enhanced transpiration and shading effects. The presence of trees in the BG and GP contributed to a delayed temperature rise, providing relief from extreme heat when compared to more exposed zones. Extreme heating occurred, with urban sites peaking at over 40 °C, highlighting the dangerous impact of heat waves.
Urban zones generally exhibited prolonged heat retention at night, attributed to the thermal inertia of concrete and asphalt surfaces, which stored and re-emitted heat after sunset. This resulted in significant differences between built-up environments and vegetated areas, with parks and gardens demonstrating stronger nighttime cooling effects. The combined influence of transpiration and reduced surface heat retention in GP and the MG was particularly noticeable, contributing to lower temperature readings when compared to fully urbanized sites. Heat retention was significant, particularly in urbanized locations, with some areas experiencing nighttime temperatures above 29 °C, exacerbating heat stress risks.
By July, the climatological dataset confirmed the height of the summer season, characterized by substantial increases in all measured statistical parameters. The Q1 values in many locations exceeded the mean temperatures observed in February, demonstrating the significant seasonal amplitude. Afternoon periods displayed the most extreme values, with Q3 values exceeding 35 °C in SS. The IQR widened significantly across locations, particularly in urban settings, where the effects of UHI intensification were evident. Maximum temperatures in July surpassed 40 °C in multiple locations, with HC recording values beyond 43 °C. The elevated mean temperatures suggested sustained thermal accumulation, while the lower quartiles remained significantly higher than winter averages, emphasizing the dominance of persistent heat.
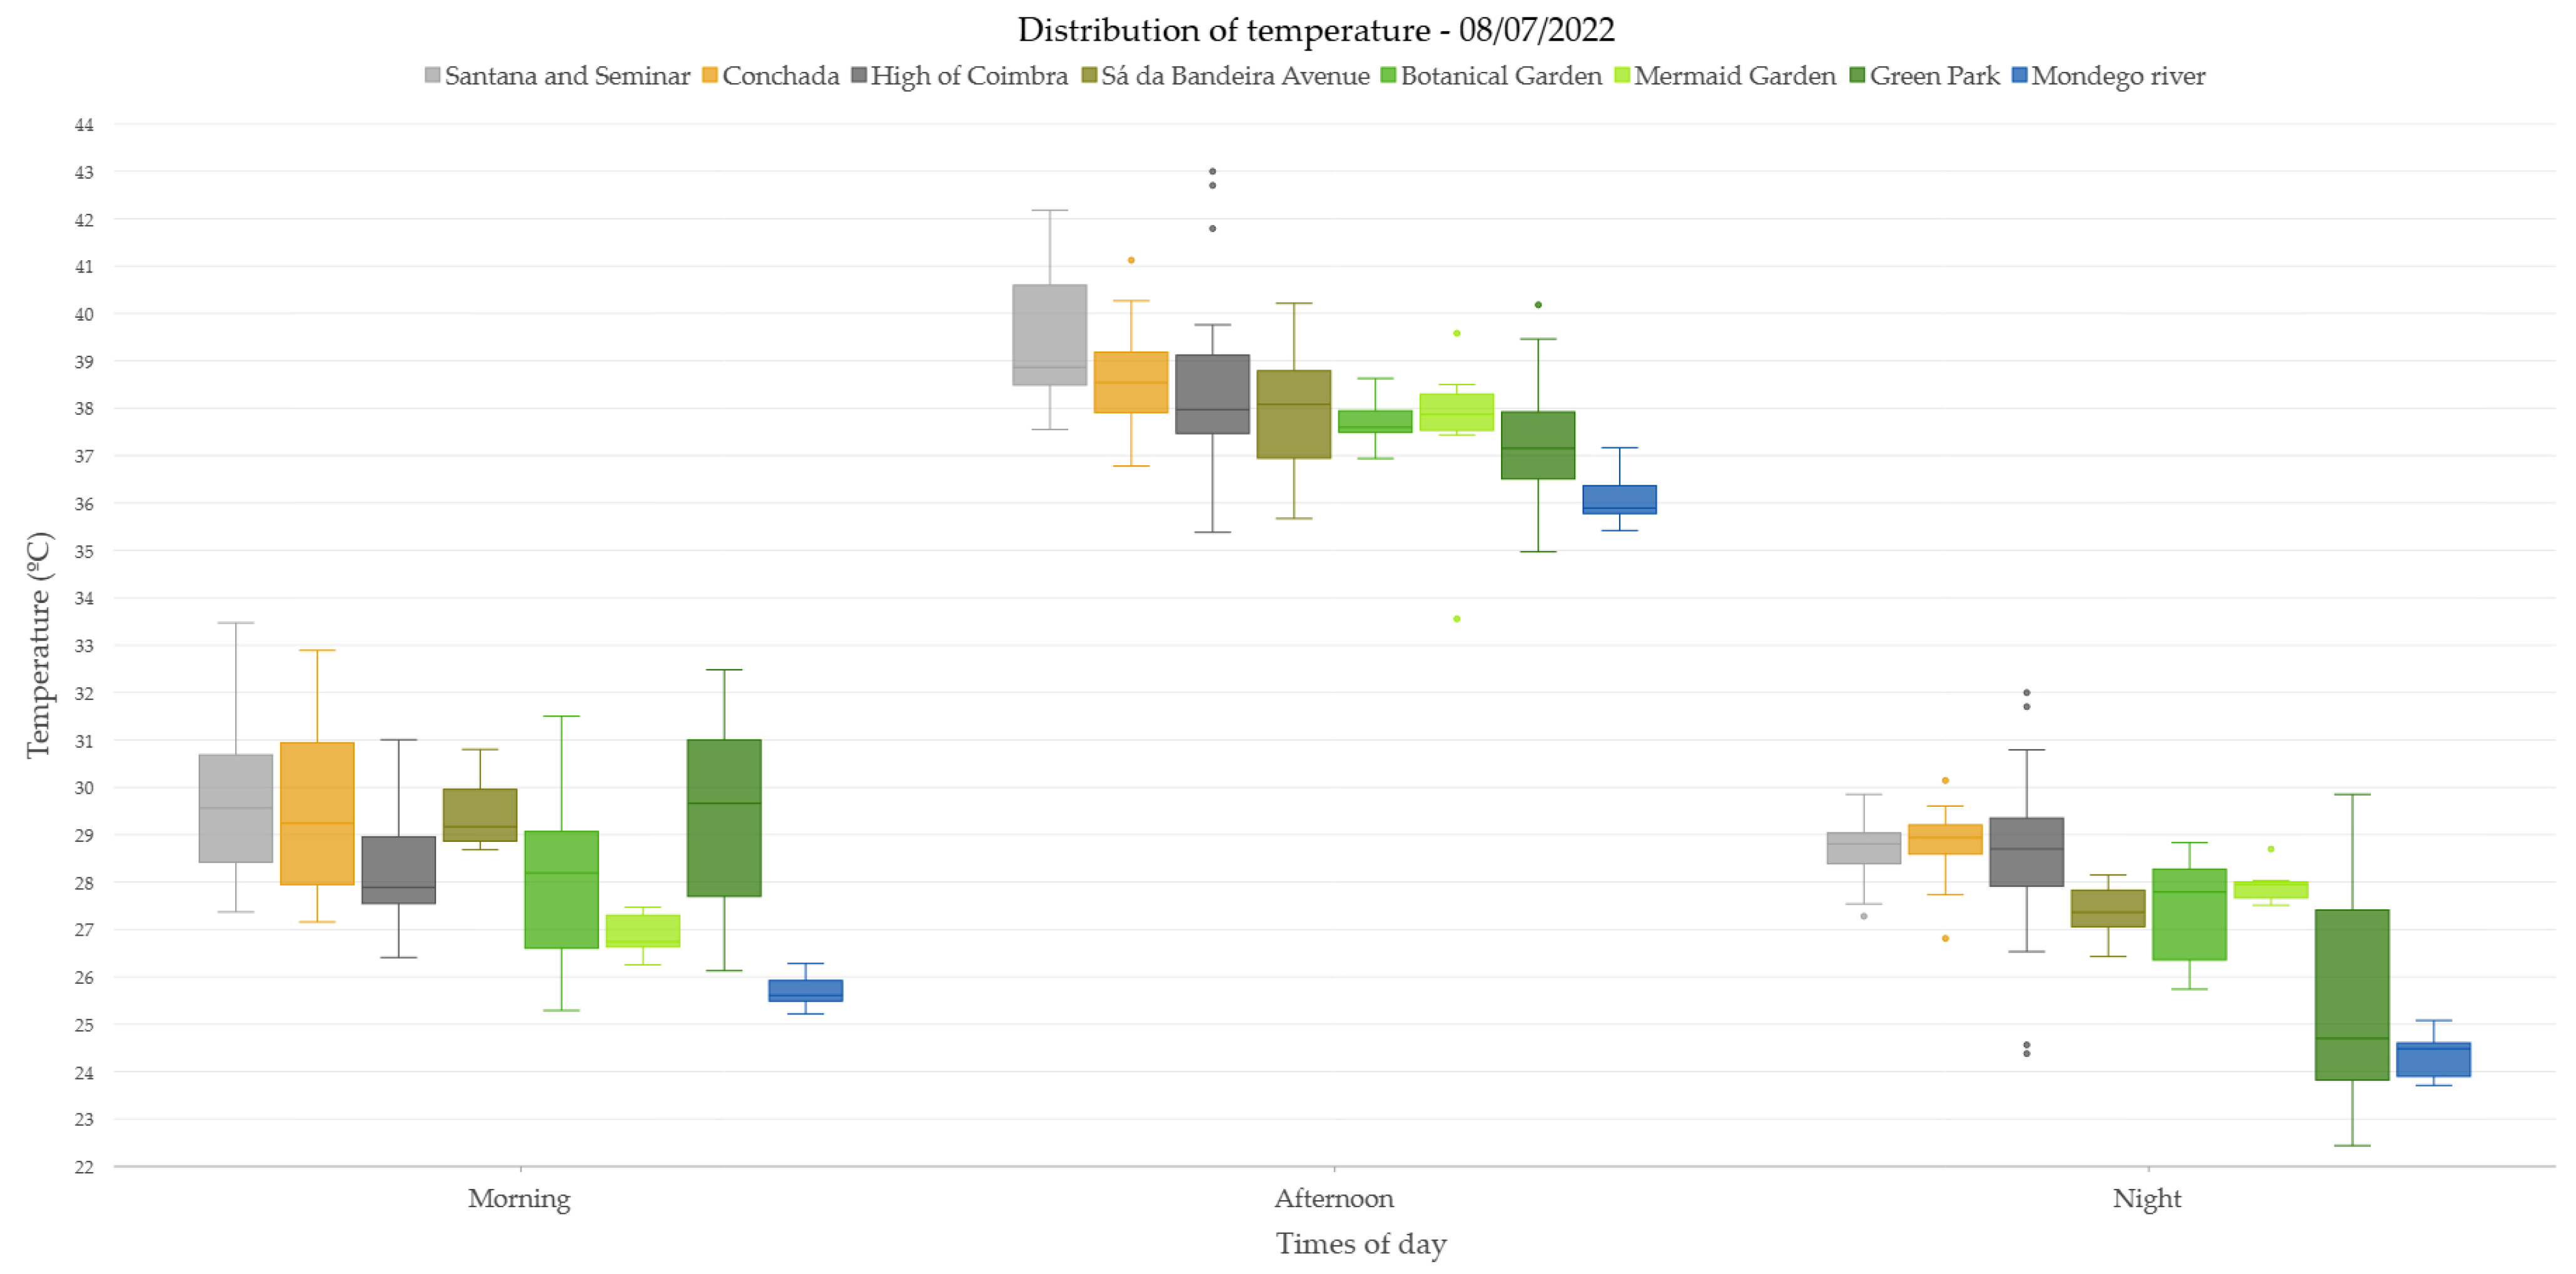
SS recorded morning median temperatures of 29.6 °C, with an IQR of 2.3 °C, highlighting the increased thermal retention in these built-up environments. CH followed a similar trend, with a mean of 29.5 °C and maximum temperatures nearing 33 °C, reinforcing its susceptibility to heat buildup (
Table 3). HC presented slightly lower morning temperatures (mean of 28.3 °C), though it maintained considerable variability due to its elevation. SB showed a morning median temperature of 29.2 °C, reflecting its exposure to direct sunlight with minimal vegetation. In contrast, vegetated areas such as the BG (mean 28 °C) and GP (mean 29.5 °C) experienced slightly lower morning temperatures due to enhanced evapotranspiration effects. The MG recorded the most stable morning temperatures, with an IQR of only 0.7 °C, indicating reduced variability due to a more balanced microclimate.
Afternoon temperatures exhibited the most extreme values. SS peaked at 42.2 °C and maintained a high mean temperature of 39.4 °C. CH, similarly, showed maximum values above 41 °C, suggesting significant UHI effects. HC recorded the highest afternoon maximum in the dataset at 43 °C, with a mean of 38.4 °C, indicating strong solar heating effects in elevated locations. SB displayed a slightly more moderated profile (mean of 37.9 °C), likely due to the influence of street orientation and shading (
Figure 8). Vegetated areas, such as the BG (mean 37.7 °C) and the MG (mean 37.5 °C), demonstrated slightly lower temperature peaks, reinforcing the thermal mitigation role of green spaces. GP exhibited the lowest peak afternoon temperatures among urban locations, with a median value of 37.2 °C, highlighting the effectiveness of urban vegetation in moderating extreme heat.
Unlike winter months, nighttime temperatures remained significantly high in July, with minimum values exceeding 22.4 °C across all locations. SS exhibited a mean nighttime temperature of 28.7 °C, while CH followed closely at 28.9 °C. HC displayed slightly more variation, with an IQR of 1.4 °C and a mean of 28.6 °C. SB recorded a relatively stable nighttime temperature profile, with a median of 27.4 °C and a maximum value of 28.2 °C. The BG recorded a nighttime mean of 27.4 °C, suggesting that the cooling effect of vegetation mitigated nocturnal heat retention. In contrast, GP showed more substantial cooling at night, with a minimum temperature of 22.4 °C and a mean of 25.6 °C, reinforcing the importance of green infrastructure in urban temperature regulation. The MG demonstrated remarkable nighttime thermal stability, with an IQR of only 0.3 °C, underscoring its capacity to provide a balanced nocturnal microclimate.
By July, the climatological dataset confirmed the height of the summer season, characterized by substantial increases in all measured statistical parameters. The Q1 values in many locations exceeded the mean temperatures observed in February, demonstrating the significant seasonal amplitude. Afternoon periods displayed the most extreme values, with Q3 values exceeding 40.6 °C in SS. The IQR widened significantly across locations, particularly in urban settings, where the effects of UHI intensification were evident. Maximum temperatures in July surpassed 40 °C in multiple locations, with HC recording values beyond 43 °C. The elevated mean temperatures suggested sustained thermal accumulation, while the lower quartiles remained significantly higher than winter averages, emphasizing the dominance of persistent heat.
4. Discussion
The spatiotemporal temperature analysis conducted for Coimbra across February, May, and July revealed consistent yet complex patterns of thermal variation. These findings underscored how urban form, land use, vegetation cover, and topography jointly influenced local microclimates. Seasonal progression from winter to midsummer brought a steady increase in temperature, but the extent and intensity of warming varied significantly across locations.
While the cooling role of urban green and blue infrastructure is well established in the literature, the present study contributes novel empirical evidence by resolving intra-urban thermal heterogeneity at high spatial resolution during thermally anomalous conditions in a medium-sized Southern European city. Rather than reproducing generalized urban–rural contrasts, the analysis identifies multiple coexisting thermal hotspots and cooling refugia within the urban fabric, highlighting the non-uniform and polycentric nature of heat accumulation across compact, topo-graphically complex cities. This fine-scale differentiation is particularly relevant for urban planning, as it allows cli-mate adaptation strategies to move beyond generic greening prescriptions towards spatially targeted interventions that prioritize the most thermally vulnerable urban sectors.
Throughout all three periods, SS, CH, and HC emerged as thermal hotspots, with July values exceeding 38.8 °C (mean). These areas, particularly SS and CH, which are characterized by compact urban morphology, exhibited persistent heat stress both during the day and at night. The HC, due to its elevation, demonstrated significant temperature extremes, notably registering the highest afternoon maximum (43 °C) in July. These urban sectors, dominated by impermeable surfaces and minimal vegetative cover, consistently demonstrated high thermal inertia, particularly during nighttime. The reduced IQR values across multiple periods indicated sustained heat retention and limited diurnal cooling. While conventional literature suggests UHIs primarily manifest after sunset, our observations indicate the occurrence of “hotspots” throughout the day, with CC, HC, and SS emerging as prominent hotspots across all periods (references [
15,
16,
17,
18,
19,
20,
28,
31,
32]). The observation of multiple hotspots in each period contributes to the initial stages of temperature accumulation, potentially leading to UHI development. This thermal persistence confirmed the magnitude of the UHI effect in structurally dense zones, especially under peak summer conditions.
Contrastingly, areas like the BG and GP, and to a lesser degree the MG, functioned as thermally resilient spaces. These areas exhibited higher IQRs in February and cooler mean values in all months, particularly during afternoons. Their canopy coverage and layered vegetation structures facilitated evapotranspiration and reduced solar heat gain. The lower mean and maximum values, especially in July, validated the capacity of green infrastructure to serve as passive climate regulation mechanisms.
From February to July, the data reflected a pronounced increase in both maximum and minimum temperatures. In May, transitional patterns were evidently—midday warming had intensified, but nocturnal cooling remained relatively functional. By July, especially in SS, CH, and HC, temperatures stayed consistently high, eliminating nighttime relief. Such sustained heating underscores the importance of adaptive planning, particularly in areas with persistent UHI patterns.
The analysis reinforces the importance of green infrastructure and NBSs in mitigating thermal extremes. Strategic implementation of vegetative corridors, urban forests, and permeable surfaces in SS, CH, HC, and adjacent high-heat areas could offset UHI accumulation. Moreover, water-integrated urbanism—leveraging features like the MR—should be explored to increase microclimate stability.
Findings from this study provide robust empirical support for the systematic integration of NBSs as a cornerstone of urban climate strategy [
29,
30,
31,
32,
34]. NBSs, defined as ecosystem-inspired interventions designed to address societal challenges, have demonstrably improved microclimatic conditions through urban greening, strategic tree planting, and restoration of riparian buffers. In Coimbra, the mitigating role of the MR exemplified how water bodies can attenuate diurnal extremes and serve as thermal moderators.
Water bodies, as observed near the MR, had also played a stabilizing role, reducing temperature fluctuations and providing cooler microclimates. These findings underscored the potential benefits of integrating water elements and green infrastructure into urban landscapes.
The synergy between green infrastructure and NBSs presents a forward-looking pathway for enhancing climate resilience, particularly in mid-sized cities like Coimbra. Urban strategies that incorporate vegetative corridors, green roofs, permeable pavements, and shaded public spaces are critical to counteract UHI effects and bolster adaptive capacity against rising temperatures and increasing frequency of extreme weather events.
The comparative analysis of Coimbra’s urban and green spaces over February, May, and July had demonstrated significant seasonal and spatial asymmetries [
44,
45,
46,
47,
48]. The identification of trend values and extremes emphasized the need to prioritize green infrastructure in urban planning to mitigate rising temperatures. By understanding the interplay between urban morphology, vegetation cover, and climate dynamics, urban planners can better design resilient and thermally comfortable cities, particularly in the face of global climate change.
Beyond descriptive statistics and spatial interpolation, the observed temperature contrasts between urban typologies indicate statistically and physically meaningful differences in thermal behavior associated with land-use configuration, vegetation structure, and built density. Compact built-up areas consistently exhibited higher median and maximum temperatures than green and riparian environments across all campaigns, confirming the role of surface impermeability, reduced shading, and limited evapotranspiration in amplifying heat exposure. Although the present study does not aim to construct predictive models, the systematic contrasts observed across typologies provide an empirical basis for explanatory interpretations linking morphological and ecological attributes to pedestrian-level thermal conditions. These findings support the development of simplified, operational indicators for identifying priority intervention zones in urban climate adaptation planning.
5. Conclusions
Through this comprehensive temperature survey, we aim to equip city administrators with valuable tools to enhance urban development strategies. Our findings culminate in a detailed correlation between specific locations and the respective periods of the day under analysis.
The comparative analysis of Coimbra’s urban and green spaces over February, May, and July demonstrated significant seasonal and spatial asymmetries [
44,
45,
46,
47,
48]. Identifying trend values and extremes reinforces the need to prioritize green infrastructure in urban planning to mitigate rising temperatures.
Identified intra-urban hotspots are likely to intersect with socially vulnerable urban sectors characterized by high residential density, ageing populations, or limited access to green spaces. The spatial differentiation of thermal exposure revealed in this study therefore has important implications for environmental justice and climate equity, suggesting that heat mitigation strategies should be prioritized in areas where biophysical vulnerability overlaps with social susceptibility. Integrating high-resolution thermal mapping with socio-demographic indicators constitutes a key avenue for future research, enabling the co-design of climate adaptation strategies that are not only thermally effective but also socially equitable.
This study has systematically characterized the spatial and seasonal dynamics of temperature in Coimbra, illustrating the profound influence of urban structure, vegetation, topography, and hydrological features on local climate regulation. Key thermal disparities observed across SS, CH, HC, BG, and GP demonstrated that temperature variability is not uniform—either in space or over time.
Urban zones such as SS, CH, and HC repeatedly presented extreme thermal conditions, particularly during summer afternoons and nights, due to their compact urban form, altitudinal exposure, and insufficient green space. In contrast, GP and BG functioned as thermal sanctuaries, consistently showing lower maxima and more effective nighttime cooling. These spaces, by virtue of their green infrastructure, provide tangible models for designing climate-resilient urban environments.
However, one notable limitation of the present study lies in its primarily thermal and biophysical analytical scope, which, although rigorous in examining the spatial and temporal variability of surface temperatures across different sites in Coimbra, did not incorporate a more comprehensive socio-spatial lens. While the research identifies clear thermal contrasts between highly urbanized areas such as CG and SB and vegetated environments like the BG and GP, it does not fully interrogate how these spatial thermal inequalities intersect with patterns of social vulnerability in the urban zones of Coimbra. Empirical observations indicate that the warmest zones—characterized by high building density, low vegetation cover, and significant surface impermeability—often correspond to residential or transit-dense sectors that may host populations in precarious housing conditions, elderly residents, or socioeconomically disadvantaged groups. These populations are less able to mitigate or adapt to thermal extremes due to limited access to cooling infrastructure, green spaces, or well-insulated housing, thus exacerbating their exposure to urban heat risks.
Addressing the multifaceted nature of climate vulnerability in Coimbra thus demands a shift toward a more integrated socio-spatial approach within urban climatology and planning practices. Urban thermal stress in Coimbra is not uniformly distributed, and the findings of this study suggest that mitigation strategies—such as the implementation of green infrastructure or NBSs—should be spatially targeted to prioritize the urban heat hotspots most acutely affected during the summer months, especially in July. These interventions must also be guided by social justice principles, ensuring that the benefits of thermal mitigation reach the most vulnerable urban residents. Future research should combine high-resolution thermal data with social indicators—such as income levels, housing quality, age demographics, and access to public green spaces—to inform equitable planning decisions. In Coimbra’s context, this would support more resilient and inclusive urban design, aligning ecological adaptation with social sustainability and reinforcing the need for climate policies that are not only effective but spatially and socially just.
Understanding the intricate interplay between urban design, green infrastructure, and temperature regulation during extreme heat waves elucidates the significance of nature-based solutions in mitigating the adverse impacts of rising temperatures in urban settings. These findings hold substantial promises for informing adaptive urban planning strategies intended at enhancing the quality of life and fostering more sustainable and resilient urban environments. Such interventions align with broader climate adaptation frameworks and the Sustainable Development Goals (SDGs), especially SDG 11 (Sustainable Cities and Communities) and SDG 13 (Climate Action). By leveraging green infrastructure and NBSs, cities can transform vulnerable thermal hotspots into resilient, livable urban ecosystems.
Rather than relying exclusively on the classical urban–rural heat island paradigm, this study deliberately adopts an intra-urban analytical perspective. This methodological choice responds to the current limitations in high-resolution empirical climatic data for Coimbra, which have so far constrained the precise identification and spatial delineation of urban heat island patterns within the city. While previous research has identified several thermally sensitive locations, this study demonstrates that increasing the spatial scale and diversity of analyzed urban environments enhances the visibility, definition, and differentiation of localized heat islands. By systematically comparing densely built areas, various forms of urban green spaces, elevated zones, and riparian environments, this work provides a refined understanding of intra-urban thermal heterogeneity and reinforces the importance of detailed, city-scale analyses to support climate-resilient and evidence-based urban planning.
The Coimbra City Council has initiated an Afforestation Plan entailing the planting of 2540 trees, aligned with our proposed measures to mitigate the UHI effect. Our study identified priority locations and highlighted the areas experiencing higher temperatures, serving as a crucial guide for situating these trees strategically to counteract UHI progression. This research serves as a crucial guide for strategically placing these trees in areas most prone to UHI development and emphasizes the necessity of introducing blue spaces in the hottest sectors.




 ,
,