Article

Atmospheric and Ionospheric Effects of La Palma Volcano 2021 Eruption

College of Instrumentation and Electrical Engineering, Jilin University, Changchun 130061, China
*
Authors to whom correspondence should be addressed.
Atmosphere 2023, 14(8), 1198; https://doi.org/10.3390/atmos14081198
Submission received: 30 June 2023 / Revised: 20 July 2023 / Accepted: 22 July 2023 / Published: 26 July 2023
(This article belongs to the Special Issue State-of-the-Art in Gravity Waves and Atmospheric-Ionospheric Physics)

Abstract

:
On 19 September 2021, La Palma volcano (Canarias Archipelagos) started an eruption that persisted until 13 December 2021. Despite the Volcano Explosive Index (VEI) being estimated equal to 3, corresponding to not so powerful eruption, the long eruption activity posed much scientific interest in this natural hazard event. In this paper, we searched for possible effects of this eruption on the atmosphere and ionosphere, investigating the climatological archive and Swarm magnetic satellite data. In particular, we explored Aerosol, Sulphur Dioxide and Carbon Monoxide concentrations in the atmosphere identifying both the direct emissions from the volcano as well as the plume that drifted toward West-South-West and was reinforced during the eruption period. The vertical profile of temperature from the Saber satellite was analysed to search for the possible presence of acoustic gravity waves induced by volcanic activity. Compared with the year before without eruption in the areas, a lot of Saber profiles present an Energy Potential very much higher than the previous year, proposing the presence of Acoustic Gravity Waves (AGW) induced by volcano eruption activity. We also identified Swarm magnetic disturbances on the day of the eruption and in November. The mechanism of coupling could be different for the latter one, as there is no evidence for AGW. They may be due to a more complex of physical and chemical alterations that propagate from the lower atmosphere to the upper one into the ionosphere.

1. Introduction

1.1. Introduction and Motivation of the Work

La Palma volcano started an eruption from the Cumbre Vieja vent on 19 September 2021 [1]. Some papers refer to this eruption also with the name Tajogaite [2]. In fact, the name La Palma refers to the whole volcanic island, which has an extremely long eruptive history [3]. Cumbre Vieja and Tajogaite refer to more local volcanos on the Southern side of La Palma Island. The eruption was estimated as Volcanic Explosive Index (VEI) equal to 3. Such intensity is not so high, but surprisingly the eruption activity, including lava outflow of about 12 km2, persisted for several months [4]. Our previous work concentrated on the study of the unrest of the volcano, investigating the lithosphere, atmosphere and ionosphere from six months or more before the eruption [5]. We clearly identified a migration of seismicity from a depth of about 40 km one year before up to a few km of depth in the days preceding the eruption. This seismic activity can underline the magma uplift, which firstly filled a magmatic deep (between ~20 km and 13 km) chamber 10 months before the eruption and a smaller magmatic chamber placed a few km under the Earth’s surface in the last 10 days before the event. We also identified possible lithosphere atmosphere and ionosphere couplings (LAIC) phenomena explainable with pure electromagnetic interaction channel (as, for example, the theory of Molchanov and Hayakawa [6] or Freund [7]) or a more complex chain of anomalies in the geo-layers that requires several days of interactions as predicted by Pulinets and Ouzounov [8,9]. From the empirical pieces of evidence seems that both theories may explain different ways of coupling between the geo-layers.

1.2. Brief Overview of Previous Studies about La Palma Volcano Eruption 2021

Several studies investigated the unrest of La Palma volcano as well as the dynamic and geophysical, and geochemical characteristics of the eruption itself. Torres-González et al. [10] backtracked the first seismic swarm in October 2017 and February 2018 at a depth of about 25 km, suggesting this was the first unrest of La Palma volcano after 46 years of quiescence. They also identified gas emissions (e.g., Helium and carbon dioxide) associated with such seismic swarms and explained these activities as a refilling of a deep magmatic chamber. Variations of isotopic composition and gases in groundwater before the 2021 eruption synchronously with seismic swarms have been reported by Amonte et al. [11]. The presence of a deep chamber as well as a possibly complex system of dikes has been confirmed by Di Paolo et al. [12], which made a magnetotelluric investigation of La Palma Island, providing an interesting resistivity map of the lithosphere. Padrón et al. [13] also investigated the gases emission, and in particular the ratio between 3He and 4He and confirmed the identification. Finally, D’Auria et al. [14] identified a rapid ascension of the magma in the last 7 days before the start of the eruption from precise relocalisation of the earthquakes. They also provided shreds of evidence that there was a continuous interaction and uplift of magma from the mantle during the 85 days of eruption filling the magma plumbing system at several depths from 20 km to shallow magma chamber. The complex magmatic plumbing system under La Palma volcano has been widely investigated by del Fresno et al. in their recent paper [15].
Romerero et al. [16] studied the first phase of the 2021 eruption, identifying that after the initial activities of the volcano on 19 September 2021, a collapse of the west flank of the edifice occurred on 25 September 2021. After the collapse, there was a temporary reduction in the amount of lava that erupted daily, associated with discharging of the shallow magma chamber, and later the volcano activity raised back to previous eruption levels following the same vent until it ceased on 13 December 2021. Bonadonna et al. [17] deeply investigated the material emitted in the form of rock from a volcano explosion (tephra) and compared it with the lava outflow. They also estimated an altitude of the plume of ashes and tephra within 1 and 6 km above sea level, with the mean height of the plume that reduced along the months (from ~4 km at the end of September to ~2 km at the mid of December, i.e., the end of the eruption).
Other research focused on multiple varieties of La Palma 2021 volcano eruption, including the actions of tidal sea variation on the volcano system [18], impact on the air quality [19], petrographic and mineralogic investigations of the emitted materials [3,20] and seismological investigations [21].

1.3. Lithosphere Atmosphere and Ionosphere Coupling Associated with Natural Hazards

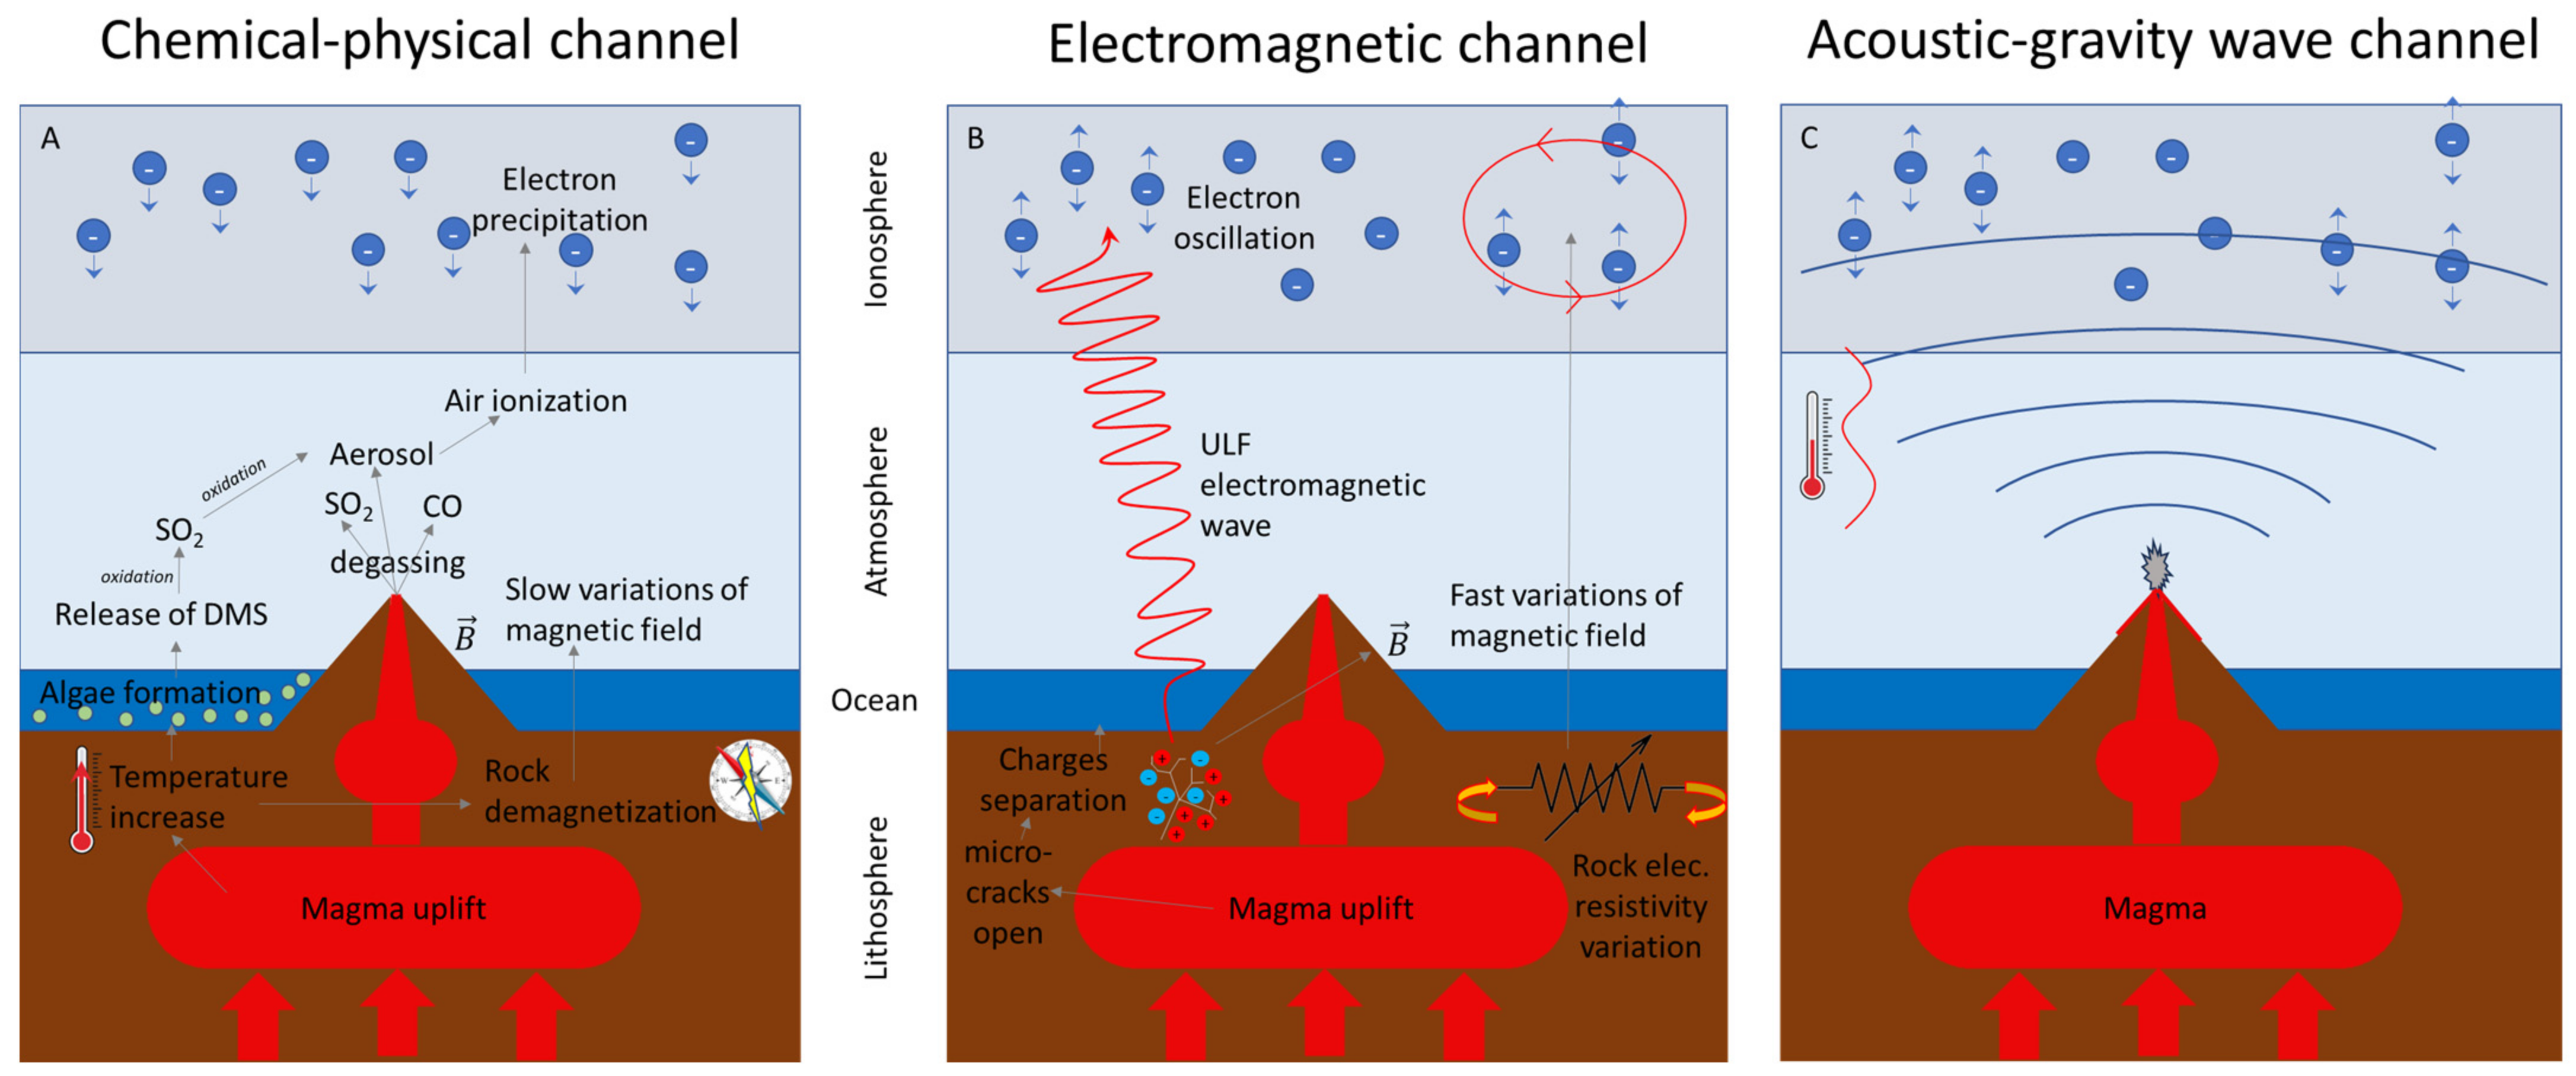
Several theories and empirical evidences proposed Lithosphere Atmosphere Ionosphere Coupling (LAIC) in the occasion of earthquakes and volcano eruptions (e.g., [22,23]). The coupling is to be intended as a transmission of perturbations or signals from the bottom layers toward the upper ones. The opposite coupling is also possible, for example, in the case of the impact of the Sun’s particles in Earth’s geomagnetic field as during a geomagnetic storm (as in the case of 26 August 2018 studied by Spogli et al. [24]) or interaction of pulsation of the magnetosphere that propagates in ionosphere up to Earth’s surface, such as Pi2 (as the case reported by Ghamry et al. [25]). Despite this, in this paper, we concern only with coupling from the bottom (lithosphere) to the upper layers (atmosphere and ionosphere).
In particular, several mechanisms have been proposed for the coupling:
  • A pure electromagnetic channel. In this case, electromagnetic (EM) waves are supposed to be generated by the separation of electrical charges due to microfracturing at fault level. Such EM waves can be potentially detected at ground level and ionosphere [6,26]. Another more recent explanation of seismo-electromagnetic phenomena relies on the generation of positive charges (p-holes) due to the stress increase, which is supposed to break peroxy links in the rocks [7,27]. Accumulation of p-holes at the Earth’s surface may induce ionospheric perturbations (such as plasma bubbles) as a consequence of the alteration of atmospheric and ionospheric electrical circuits as simulated by Kuo et al. [28].
  • A mix of chemical and physical processes. This mechanism involves more observable and has been proposed by Pulinets and Ouzounov [8]. The key phenomenon is the air ionisation induced by radon release. Similar action may also be induced by p-holes instead of radon. The consequences of the air ionisation would be an increase in temperature at the Earth surface associated with a drop in humidity (for hydration of ionised particles in the air), formation of clouds, thermal emission (detected as Outgoing Longwave radiation) and electromagnetic alteration of the atmospheric and ionospheric global circuit [29,30].
  • Acoustic gravity waves. Such mechanism has been demonstrated to occur during a volcano eruption [31] and earthquake occurrence [32], but it is debated if it could happen before an eruption or earthquake. The source mechanism is the explosion of the volcano that generates mechanical pressure waves in the atmosphere or seismic shaking of the ground. Such waves propagated vertically combined in the gravity field and so they combined an acoustic and gravity wave [33].
  • The existence of these LAIC phenomena, especially before the earthquake, is debated, and certain researchers propose that the empirical evidence are by chance before the specific events [34]. Despite this, a lot of recent studies identify not only empirical evidence before volcano eruptions [23,35,36,37,38] and earthquakes [39,40,41,42,43,44,45,46,47,48] but also statistical evidence [49,50,51,52,53].
In particular, in our previous work on activity before the La Palma volcano eruption [5], we proposed that several channels of LAIC can coexist and describe different ways of geophysical interaction. A similar claim has been proposed by Zhang et al. [54], investigating in a systematic way the months that preceded the Mw6.7 Lushan (China) 2013 earthquake, identifying a clear chain of anomalies in the lithosphere atmosphere and ionosphere but with different LAIC mechanisms.

2. Materials and Methods

In this section, we illustrated specific methods used in this paper and further details are provided in the Section 3.

2.1. Vertical Temperature Profiles to Search for Acoustic Gravity Waves

To estimate the Energy potential related to the Acoustic gravity wave, we retrieved the data from satellite SABER and applied the method proposed and used by several authors, including another paper in this Special Issue [55,56,57,58]. Essentially the temperature profiles are retrieved from satellite observation. This means that the line of view depends on the satellite’s orbit, and any day the point of observation is potentially different. The temperature vertical profile between 20 km and 150 km is retrieved, and according to previous studies, the section from 30 to 50 km is investigated. A polynomial fit of the third degree is performed on the temperature profile “T0” and subtracted to obtain “Tp”. We calculated the classic two quantities, i.e., the Brunt-Väisälä frequency “N” and Energy potential “Ep”:
N 2 = g T 0 · T 0 z + g c p
E p = 1 2 · g N 2 · T p T 0 2
where “cp” is the heat capacity of dry air at constant pressure and set at 1006 m2/(K·s2); z is the altitude, and g is the gravity acceleration that we estimated considering the Earth mass ME = 5.97 × 1024 kg and the universal constant of gravity G = 6.67 × 10⁻¹¹ m3/(kg·s2):
g = G · M E r 2
r is the radius equal to the sum of Earth’s mean radius (6371 km) and altitude.
To define if the value of energy potential in 2021 was anomalous or not, we compared it with the same one in a comparison year (in this case the previous one, i.e., 2020). In particular, we estimated the mean “μ” and standard deviation “σ” of Ep in the same area and the same month during the comparison year and we define a threshold equal to μ + 2σ. If a value overpasses such a threshold, we consider this value anomalous. This definition is different from the one used in the previous paper, but it is considered to be more restrictive as the cited work used only a mean and not standard deviation, even if on more years of comparisons (e.g., [55]).

2.2. Atmospheric Time Series

The atmospheric time series of Aerosol, SO2 and CO parameters have been investigated using a well-established algorithm MEANS [59] developed to investigate earthquakes and volcanoes. The purpose of MEANS is to determine the typical value of the atmospheric parameter in terms of mean and standard deviation for the specific day and region to define the so-called historical time series. If the year of investigation exceeded the mean plus or minus 2 standard deviations, then the particular day can be considered anomalous. Such an approach was derived from another very similar algorithm, CAPRI [60], with the main difference being the data source: MEANS investigate the climatological archive of MERRA-2 from NASA [61] (the one used in this paper) and CAPRI ERA-Interim and operational archive from ECMWF. Such algorithms have been successfully applied to several earthquakes in the world as well as volcano eruptions [39,54,59,60,62,63].

2.3. Swarm Ionospheric Magnetic Data Processing

Magnetic data from the Swarm satellite mission have been investigated to search for possible ionospheric anomalies induced by the La Palma volcano eruption. Swarm is a three-identical satellite (called Alpha, Bravo and Charlie) mission launched by the European Space Agency (ESA) in November 2013 and still in orbit and is now planned to complete at least one solar cycle (11 years), extending its initial planned life of 4 years. Each satellite is equipped with several payloads such as fluxgate magnetometers, absolute scalar magnetometers, Langmuir Probes, Thermal Ion Imagers, accelerometers and GNSS receivers. In this paper, we analysed the data provided at precise o’clock GPS time with a frequency of 1 Hz from Vectorial Field Magnetometer (VFM) and Absolute Scalar Magnetometer (ASM) instruments. For Charlie spacecraft, we calculated the scalar intensity as the vectorial sum of the three components due to the malfunction of its ASM.
The investigation of the data is based on the MASS algorithm fully described in De Santis et al. [49,64,65] and in Appendix B of Marchetti et al. [5]. It essentially removed the background field by approximative the time derivative of the data and removing a cubic spline. What is obtained is called residual signal, and it is plotted for X-North, Y-East, Z-center and F-scalar components of the magnetic field. To search for the eventual anomaly, a moving window of 3° latitudinal length is used. The root means square rms inside the window is compared with the Root Mean Square RMS of the whole track from −50° to +50° N geomagnetic latitude (shown in the upper panel), and if rms > kt × RMS, the window is defined as anomalous. Here, we set kt = 2.5. This threshold is the one that statistically was found optimal for worldwide correlation investigations [49,50].

3. Results

In this section, we present the results of investigations of the lithosphere atmosphere and ionosphere during the eruption of La Palma volcano 2021, i.e., from 19 September to 31 December.

3.1. Results of the Lithosphere

The lithosphere is investigated by looking at the earthquake localised by IGN. We retrieved the earthquake catalogue in the box delimited by 20° W ≤ longitude ≤ 12° W and 26° N ≤ latitude ≤ 31° N from 19 September to 31 December 2021. Then we selected only the events that occurred inside La Palma Island (or immediately outside, considering a circular area), and we plotted their epicentres in Figure 1 with the help of ZMap software, version 7 [66]. The Northern side of the island is not represented because no earthquake was localised there in this period. We also noted that the Northern side of La Palma is the higher altitude and corresponds to the most ancient volcanic activity. So, it is reasonable that no seismicity has been detected on the North side.
To better understand the evolution of the underground activity during the eruption, we plotted the depth distribution versus the origin time of the earthquakes in Figure 2. Several considerations can be drawn from this picture: (1) the seismicity has been recorded mainly into two distinct depth ranges: from 40 to 30 km and from 15 to 8 km. (2) higher magnitude events occurred in the deeper section, and generally the magnitude is smaller as closer to the Earth’s surface; (3) some seismicity has been recorded in the middle or in the shallow section of the crust and the first one may underline a transfer of magma from the deep chamber or mantle in shallower reservoirs, while the second one could underline the immediately pre-effusion of the lava from the volcano vent; (4) in the last period from the first part of December the deep seismicity reduced and after the half of December also the shallow seismicity decreased underlying the end of the eruption activity. The reduction in seismicity in the last part of the graph is in agreement with the previous investigations and the fact that the eruption activity ended on 13 December 2021 [14,21].
Compared with the earthquake recorded before the eruption, higher magnitude events occurred during the eruption. In fact, in the pre-eruption year maximum magnitude was 3.5 (shown in [5]), while during the eruption, some events of magnitude 4.9 have been reported.

3.2. Results of Atmosphere

3.2.1. Research of Possible Acoustic Gravity Wave Signature in Vertical Temperature Profiles and Comparison with Aerosol Maps on the Same Days

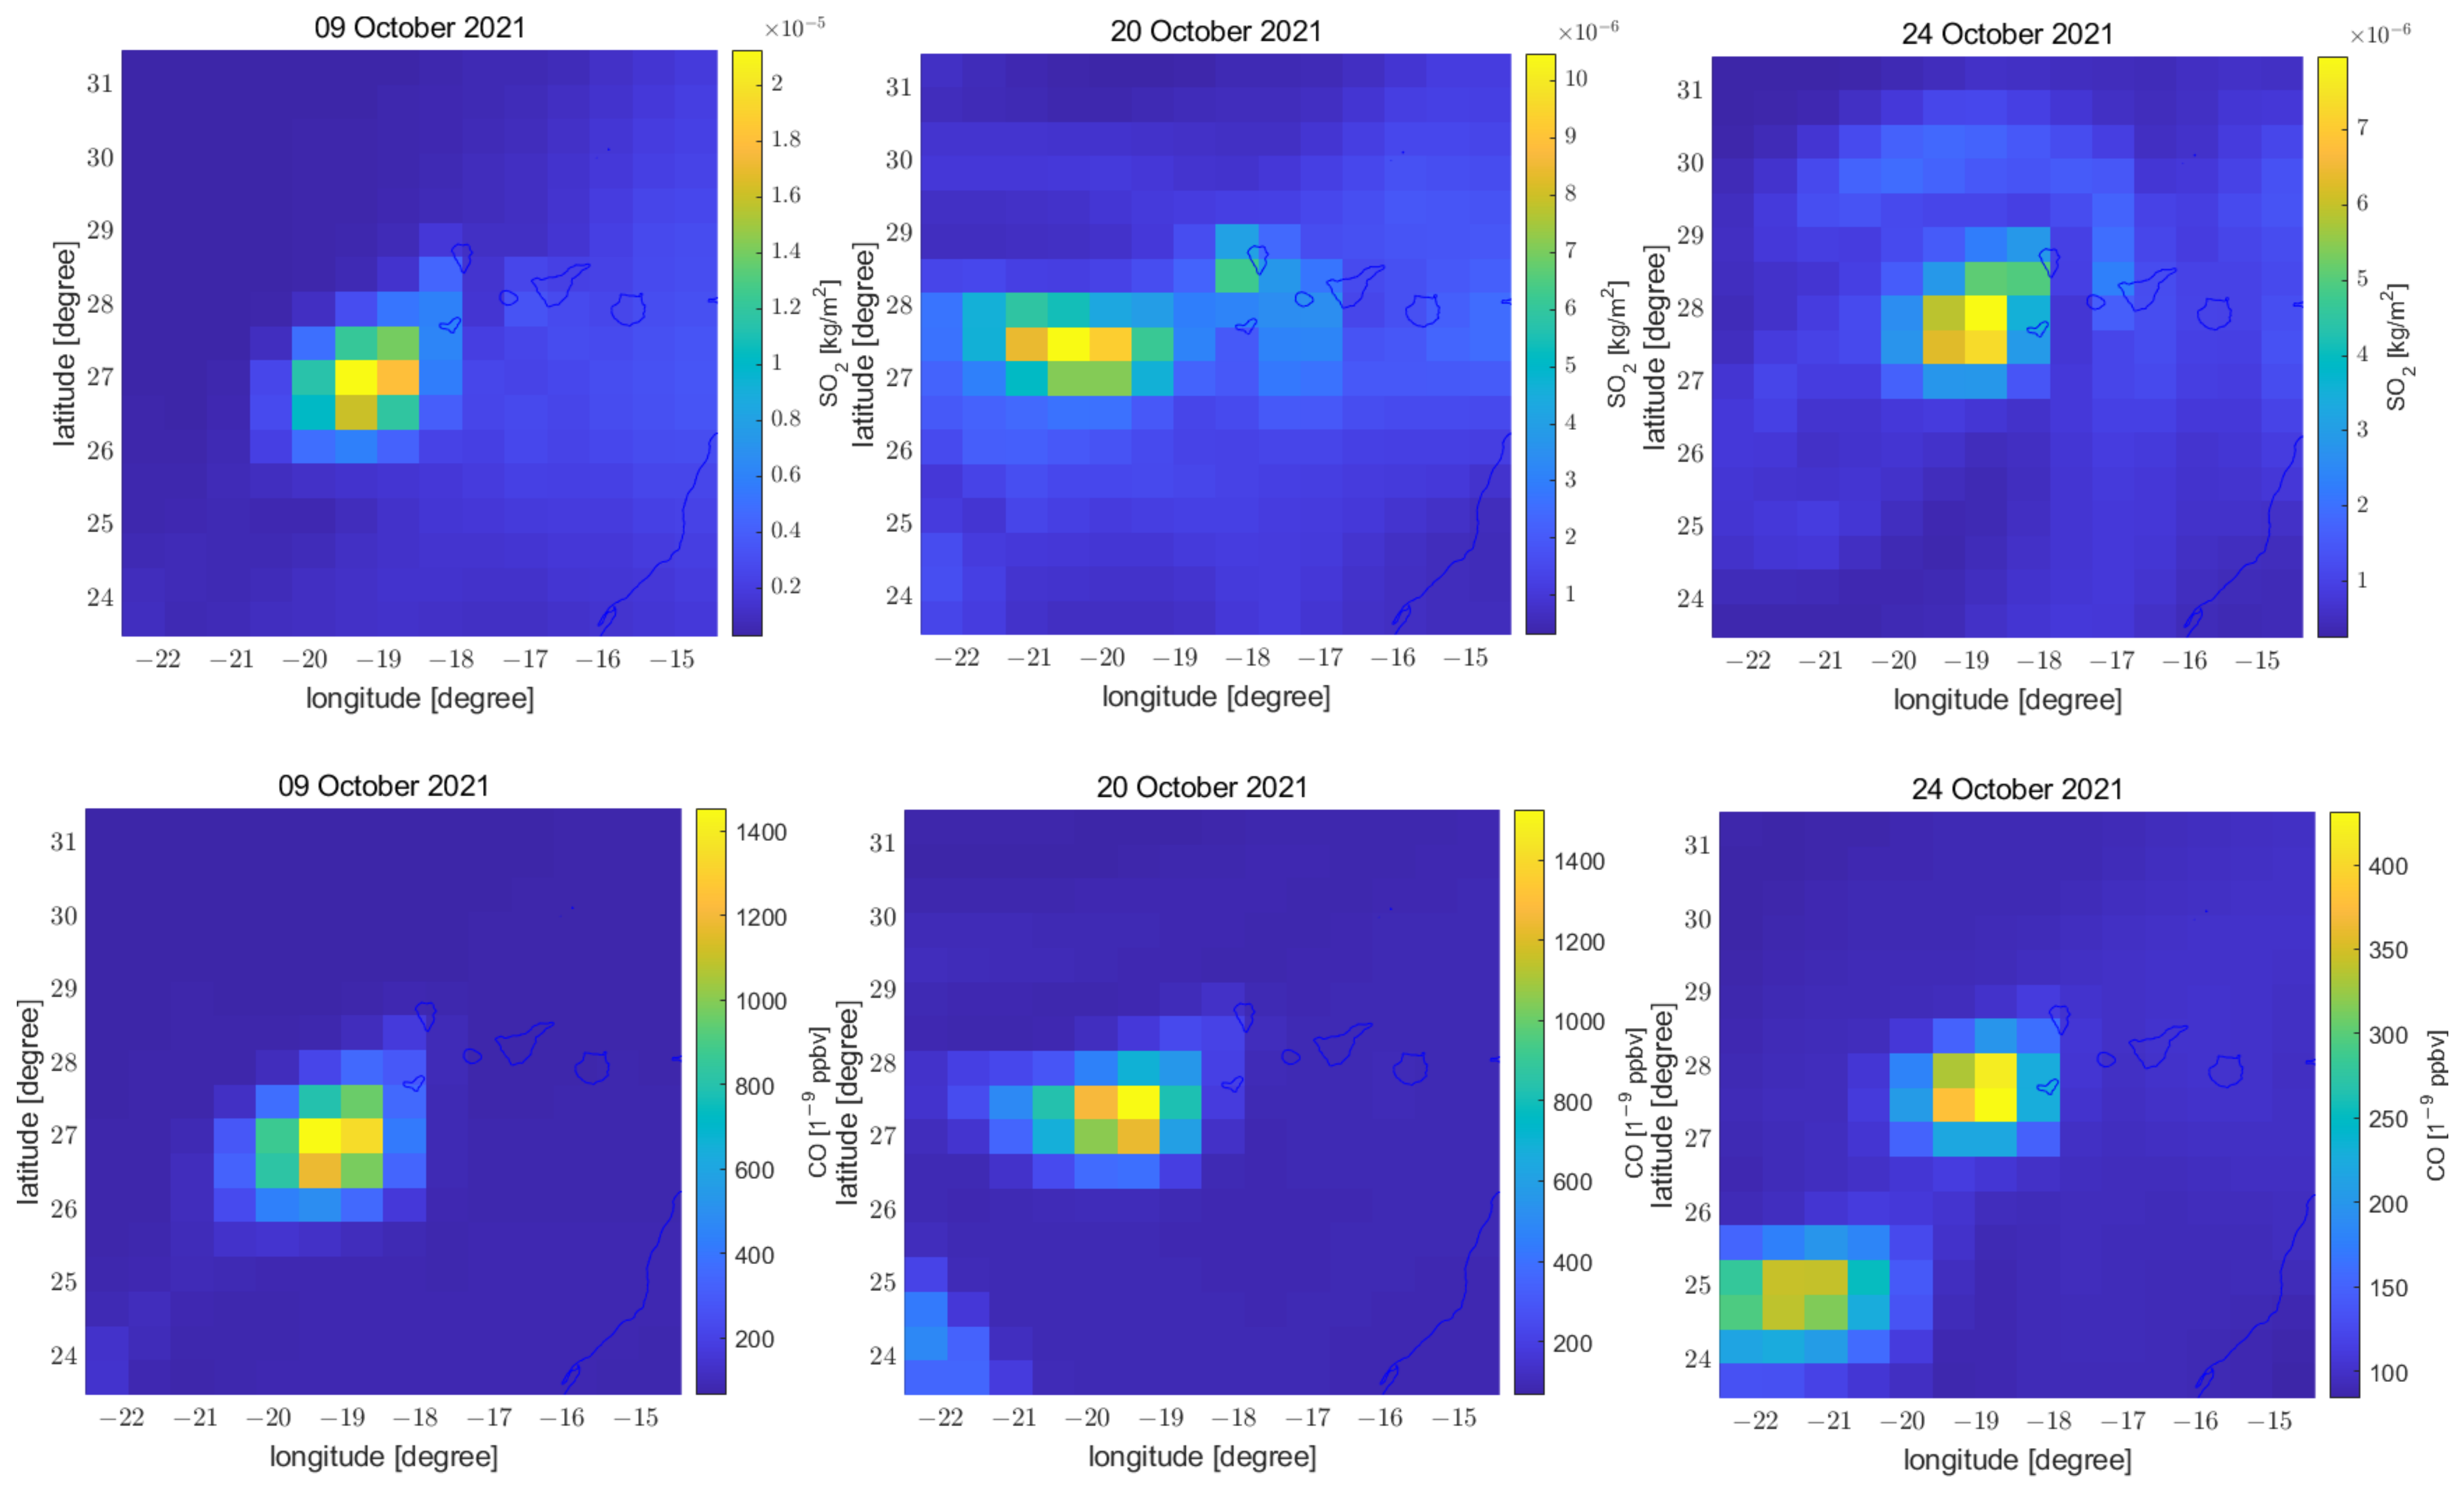
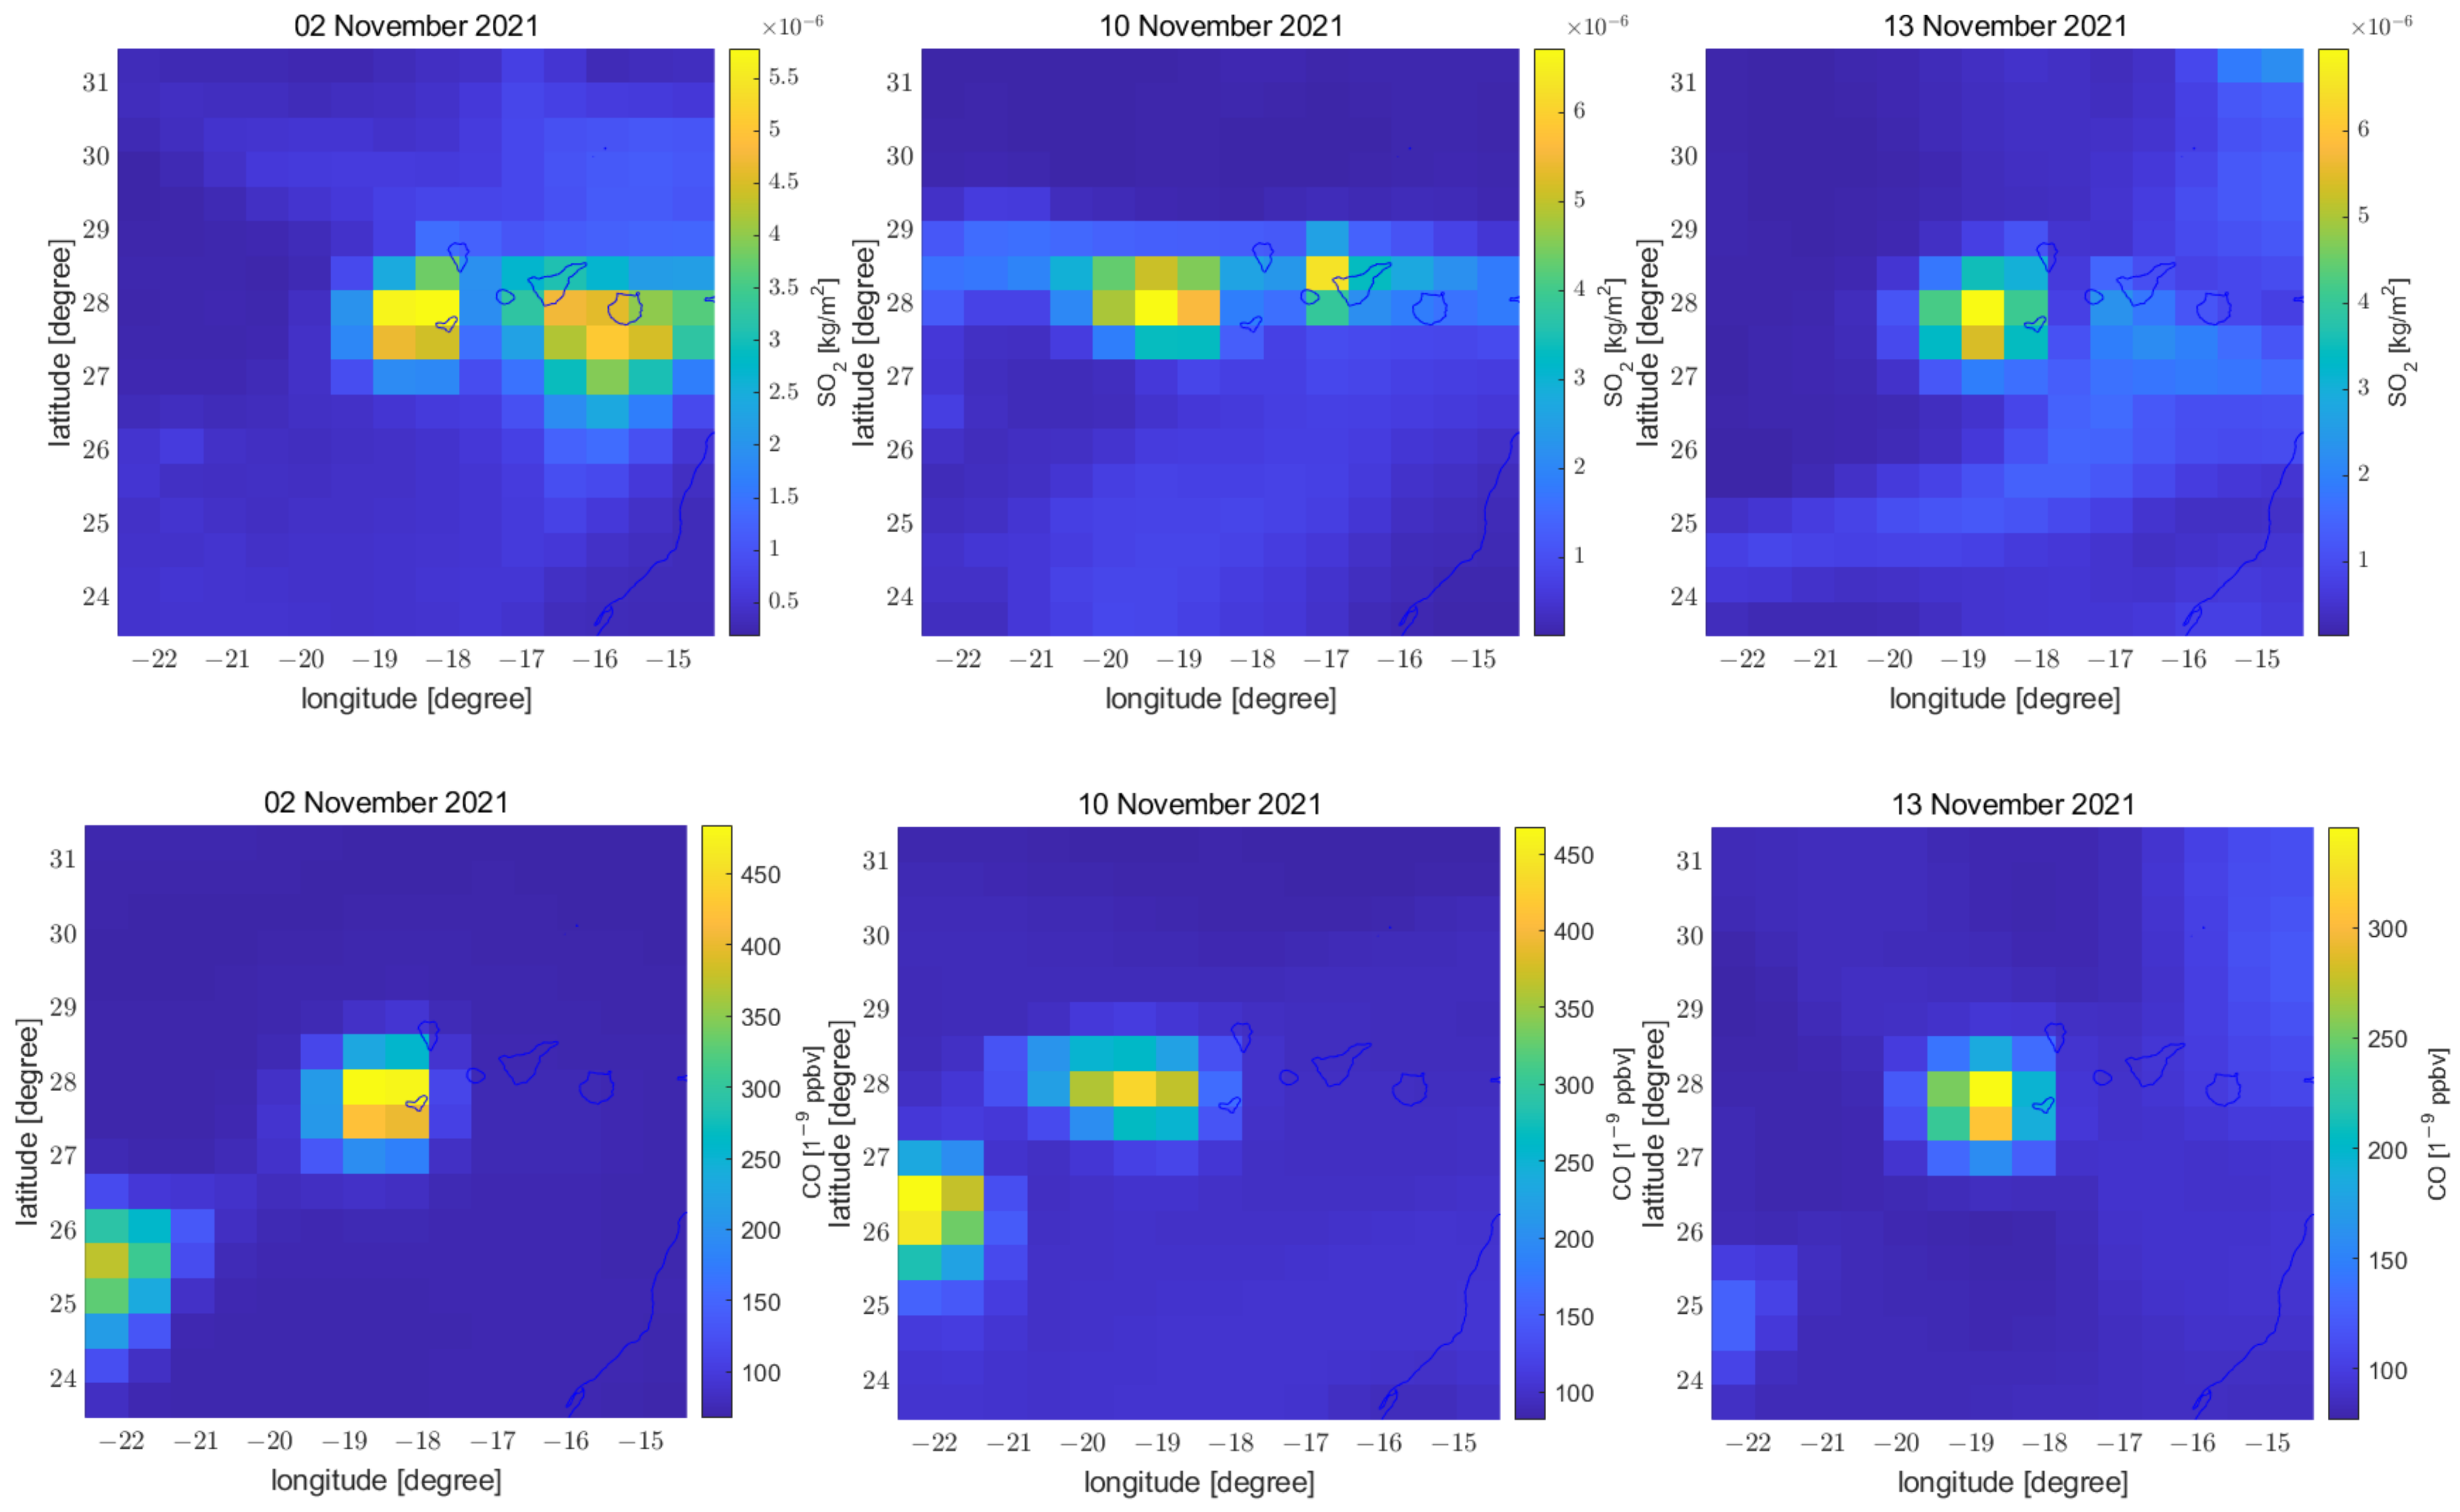
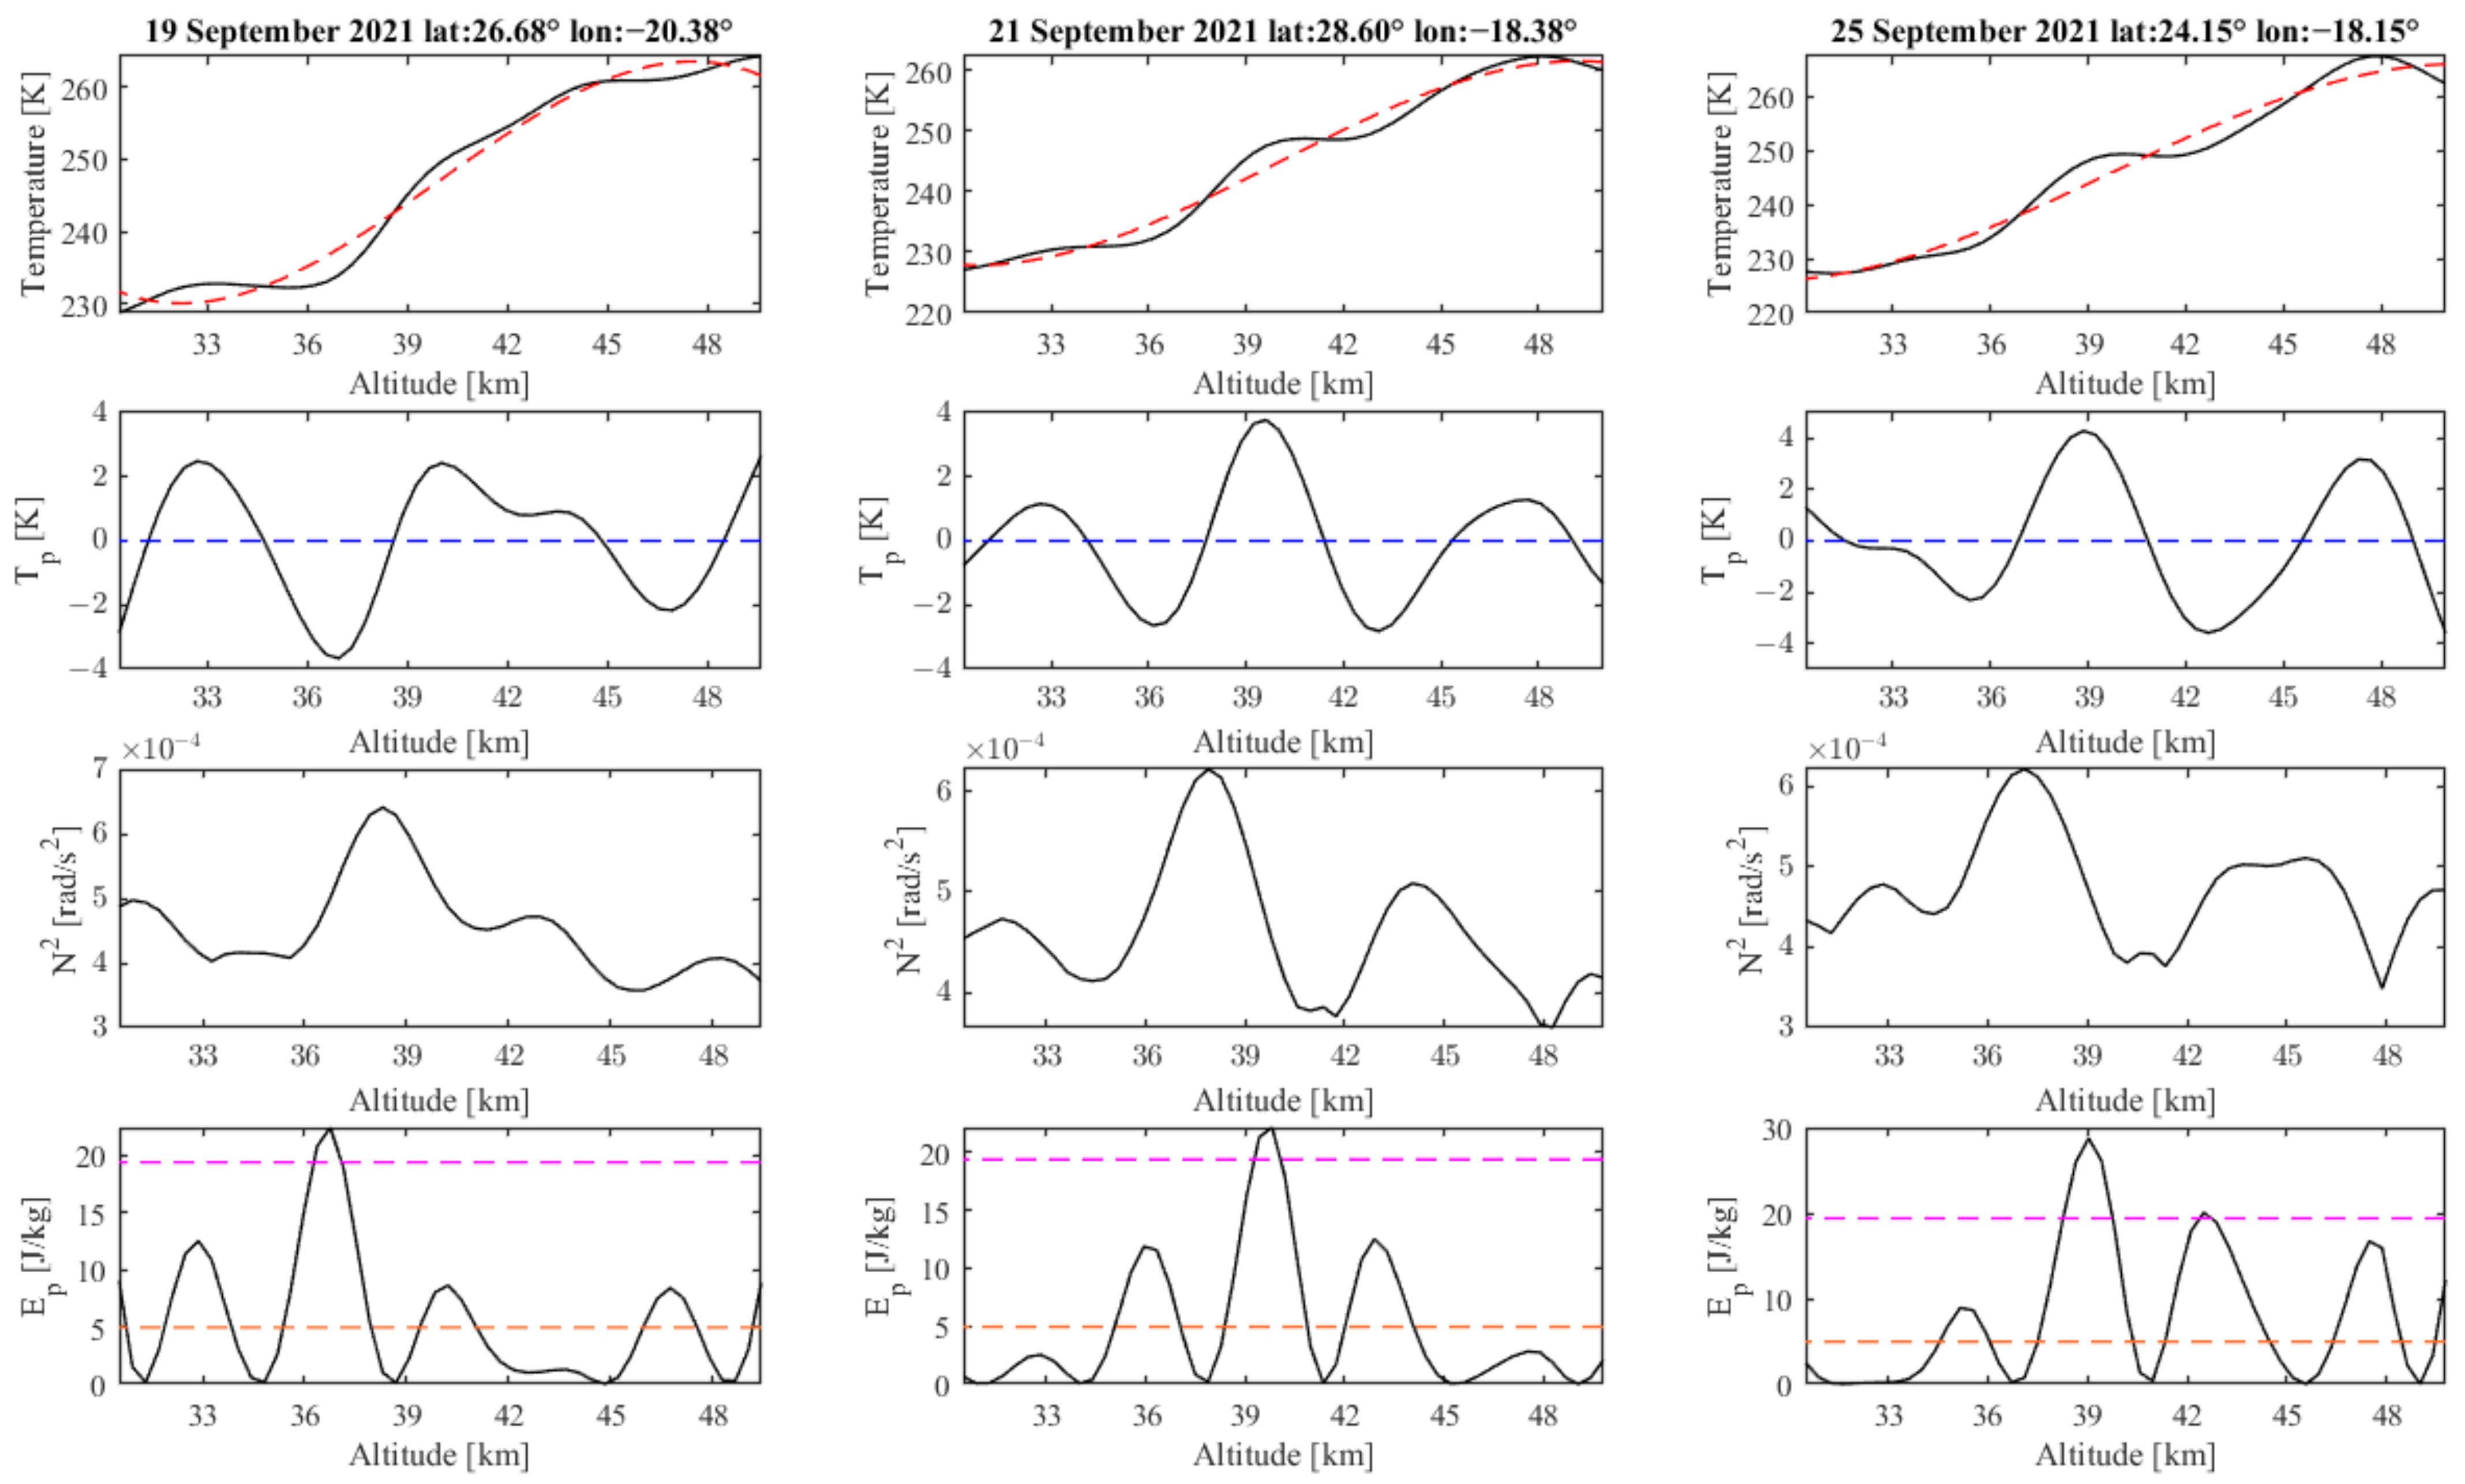
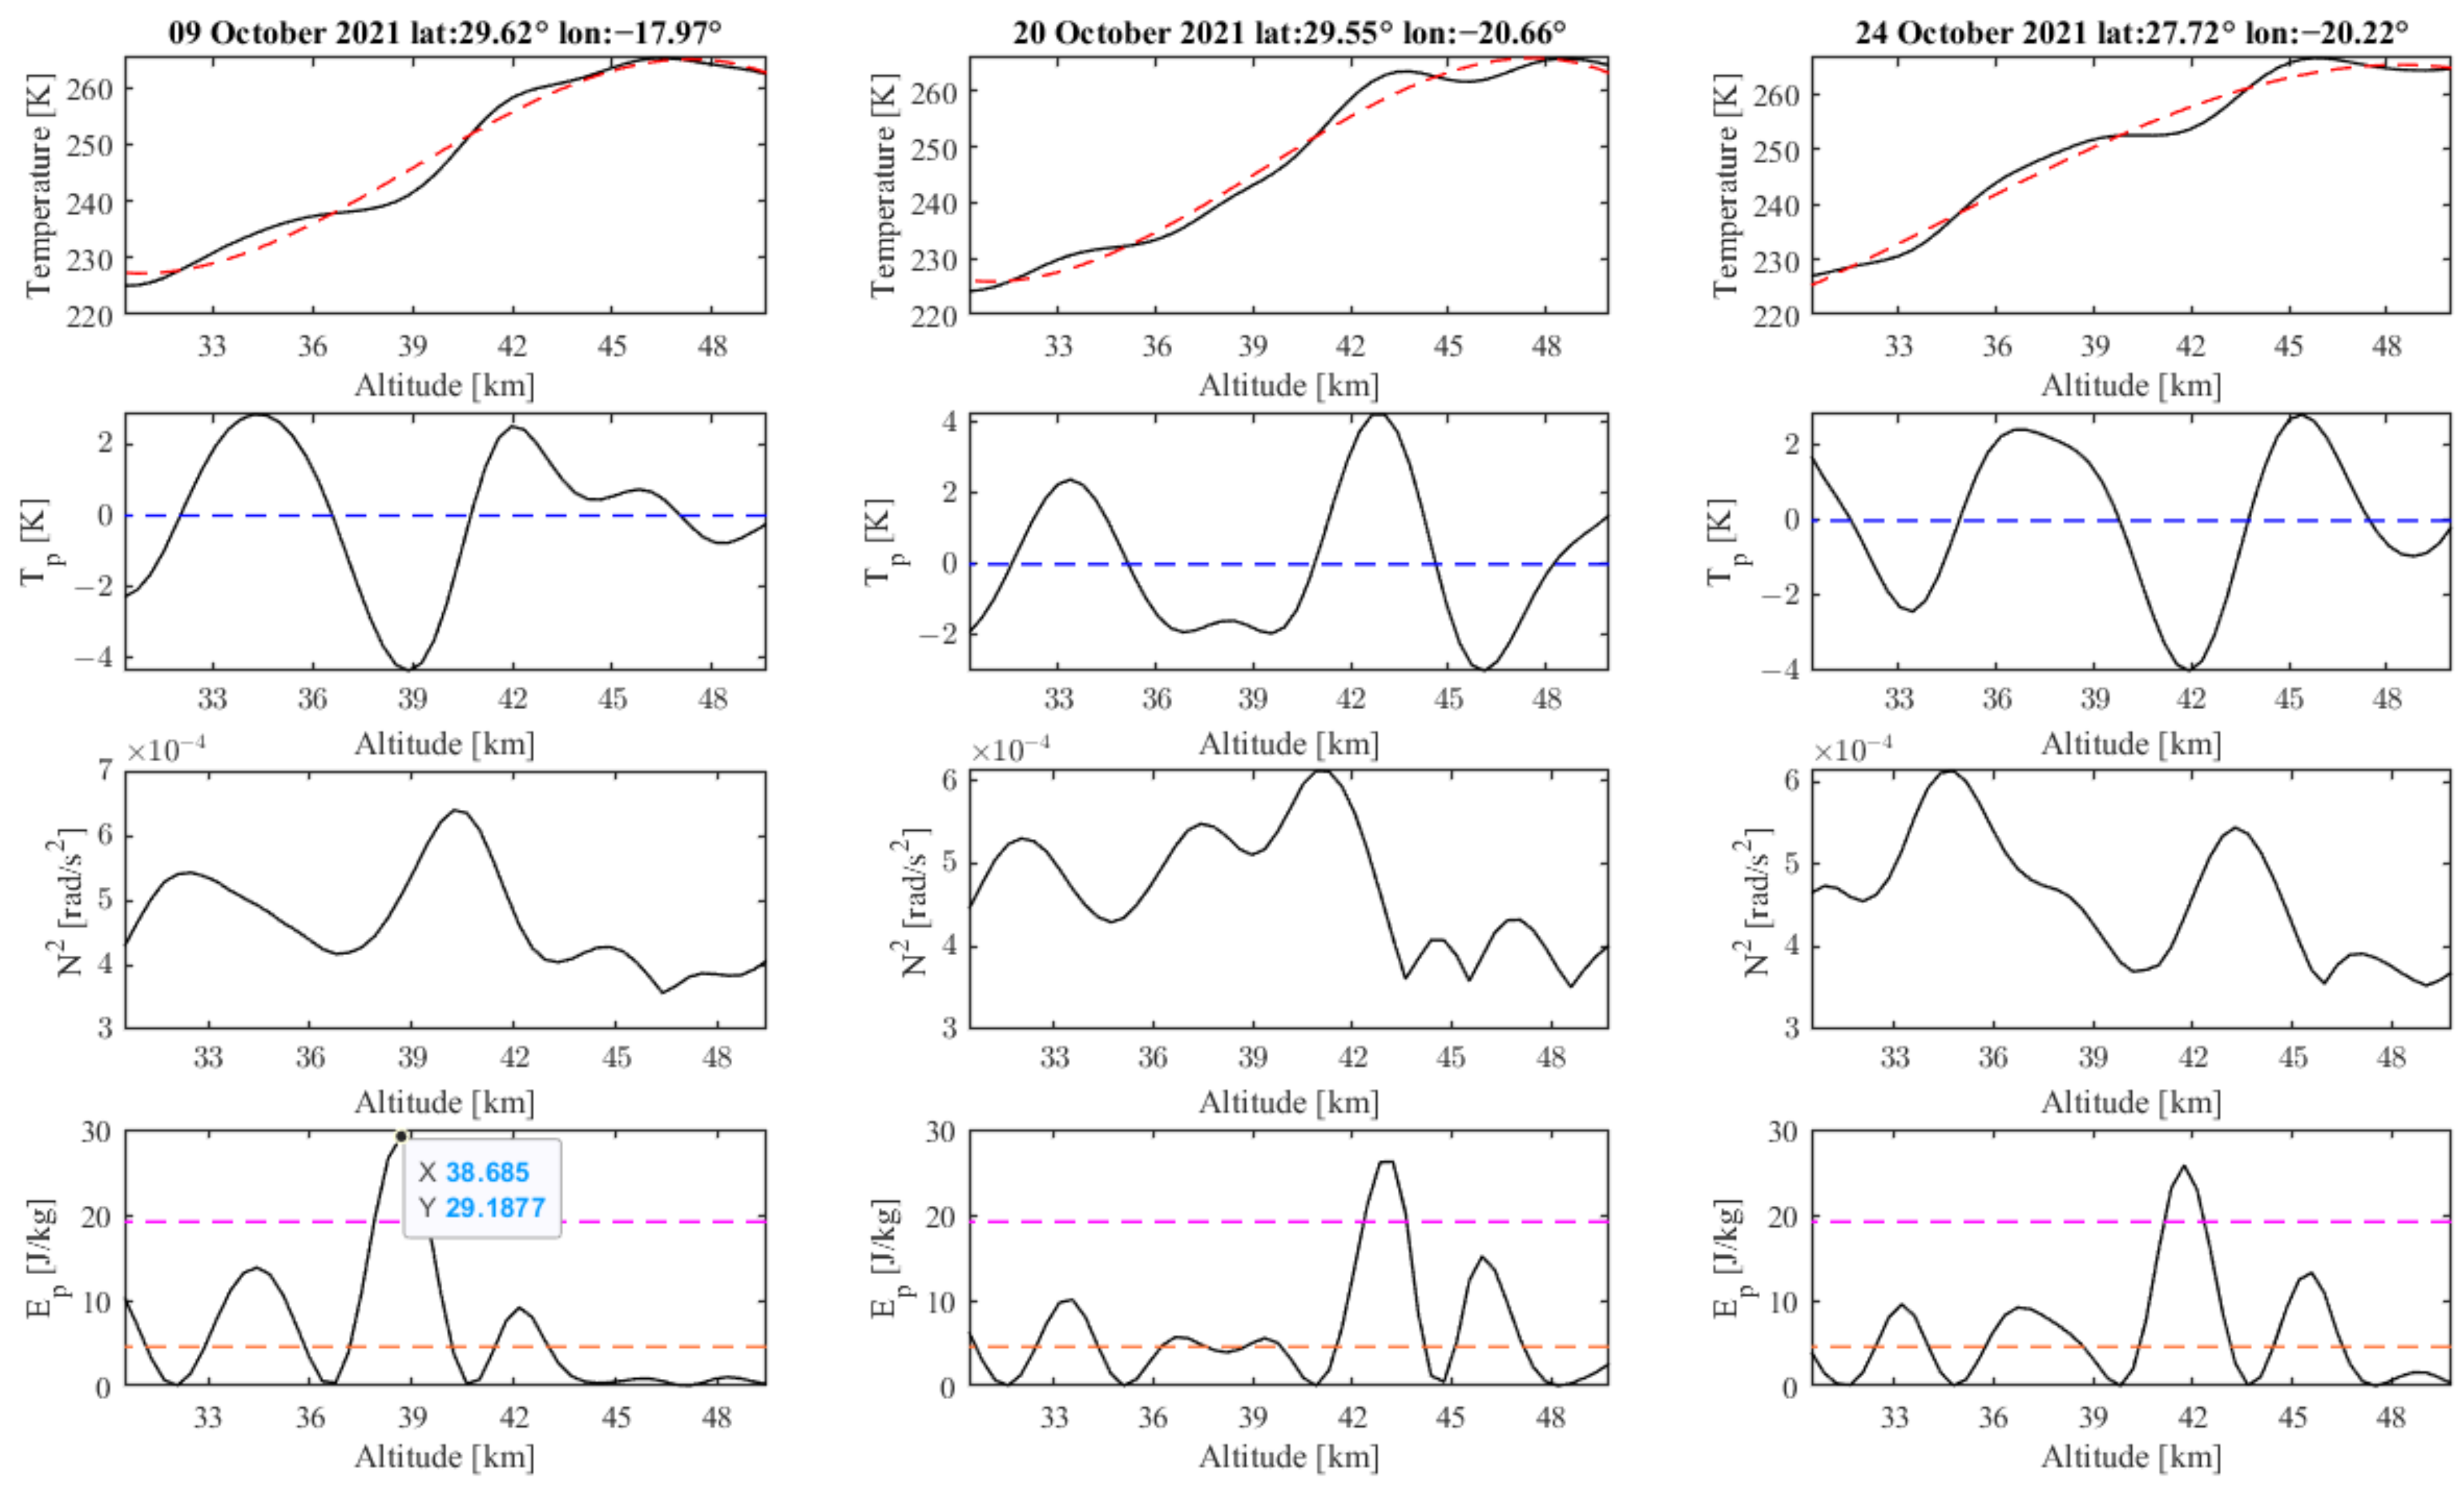
In this section, we present the investigation of vertical temperature profiles acquired by the Saber satellite instrument and we retrieved the Energy potential related to the acoustic gravity wave as explained in the Section 2. We presented all the obtained results, including atmospheric and ionospheric Swarm investigation in Table 1. Here we present some more interesting days, such as the 19 September 2021, i.e., the start of the eruption, 21 and 25 September 2021 in Figure 3. During these days, the Ep slightly exceeded the threshold value of 3.0 J/kg, 2.8 J/kg and 9.4 J/kg on 19, 21 and 25 September 2021, respectively, which correspond to 3.0 σ, 2.8 σ and 3.3 σ above the mean. We show the corresponding maps of Aerosol on the same days in Figure 4 and in Appendix A, Figure A1 the maps of SO2 and CO. For October, we selected three particular days with high values of energy potential and they correspond with the volcano location or its eruption plume on the 9, 20 and 24 October 2021, showing the results in Figure 5, Figure 6 and Figure A2 (in Appendix A). In particular, the 9 October anomaly is 10 J/kg above the threshold, i.e., 3.4 σ above the mean, 20 October is 7.0 J/kg above the threshold, i.e., 3.0 σ above the mean and 24 October is 6.6 J/kg above the threshold, i.e., 2.9 σ above the mean. November 2021 presented extremely high values of Energy potential very much higher than the comparison year and in particular the 10 November (87 J/kg above the threshold, i.e., 17.5 σ above the mean) and 13 November 2021 (160 J/kg above the threshold, i.e., 30.3 σ above the mean). Together with 2 November (16 J/kg above the threshold, i.e., 4.9 σ above the mean), which shows some peculiarities, we present the graphs and maps in Figure 7, Figure 8 and Figure A3 (in Appendix A), respectively.
We do not select any day of December 2021 as the vertical profiles do not present anomalous values (with very few exceptions). This is in agreement with the fact that in December the eruption was at its ending phase and stopped completely after 13 December 2021.

3.2.2. Investigation of the Evolution of the Volcanic Plume

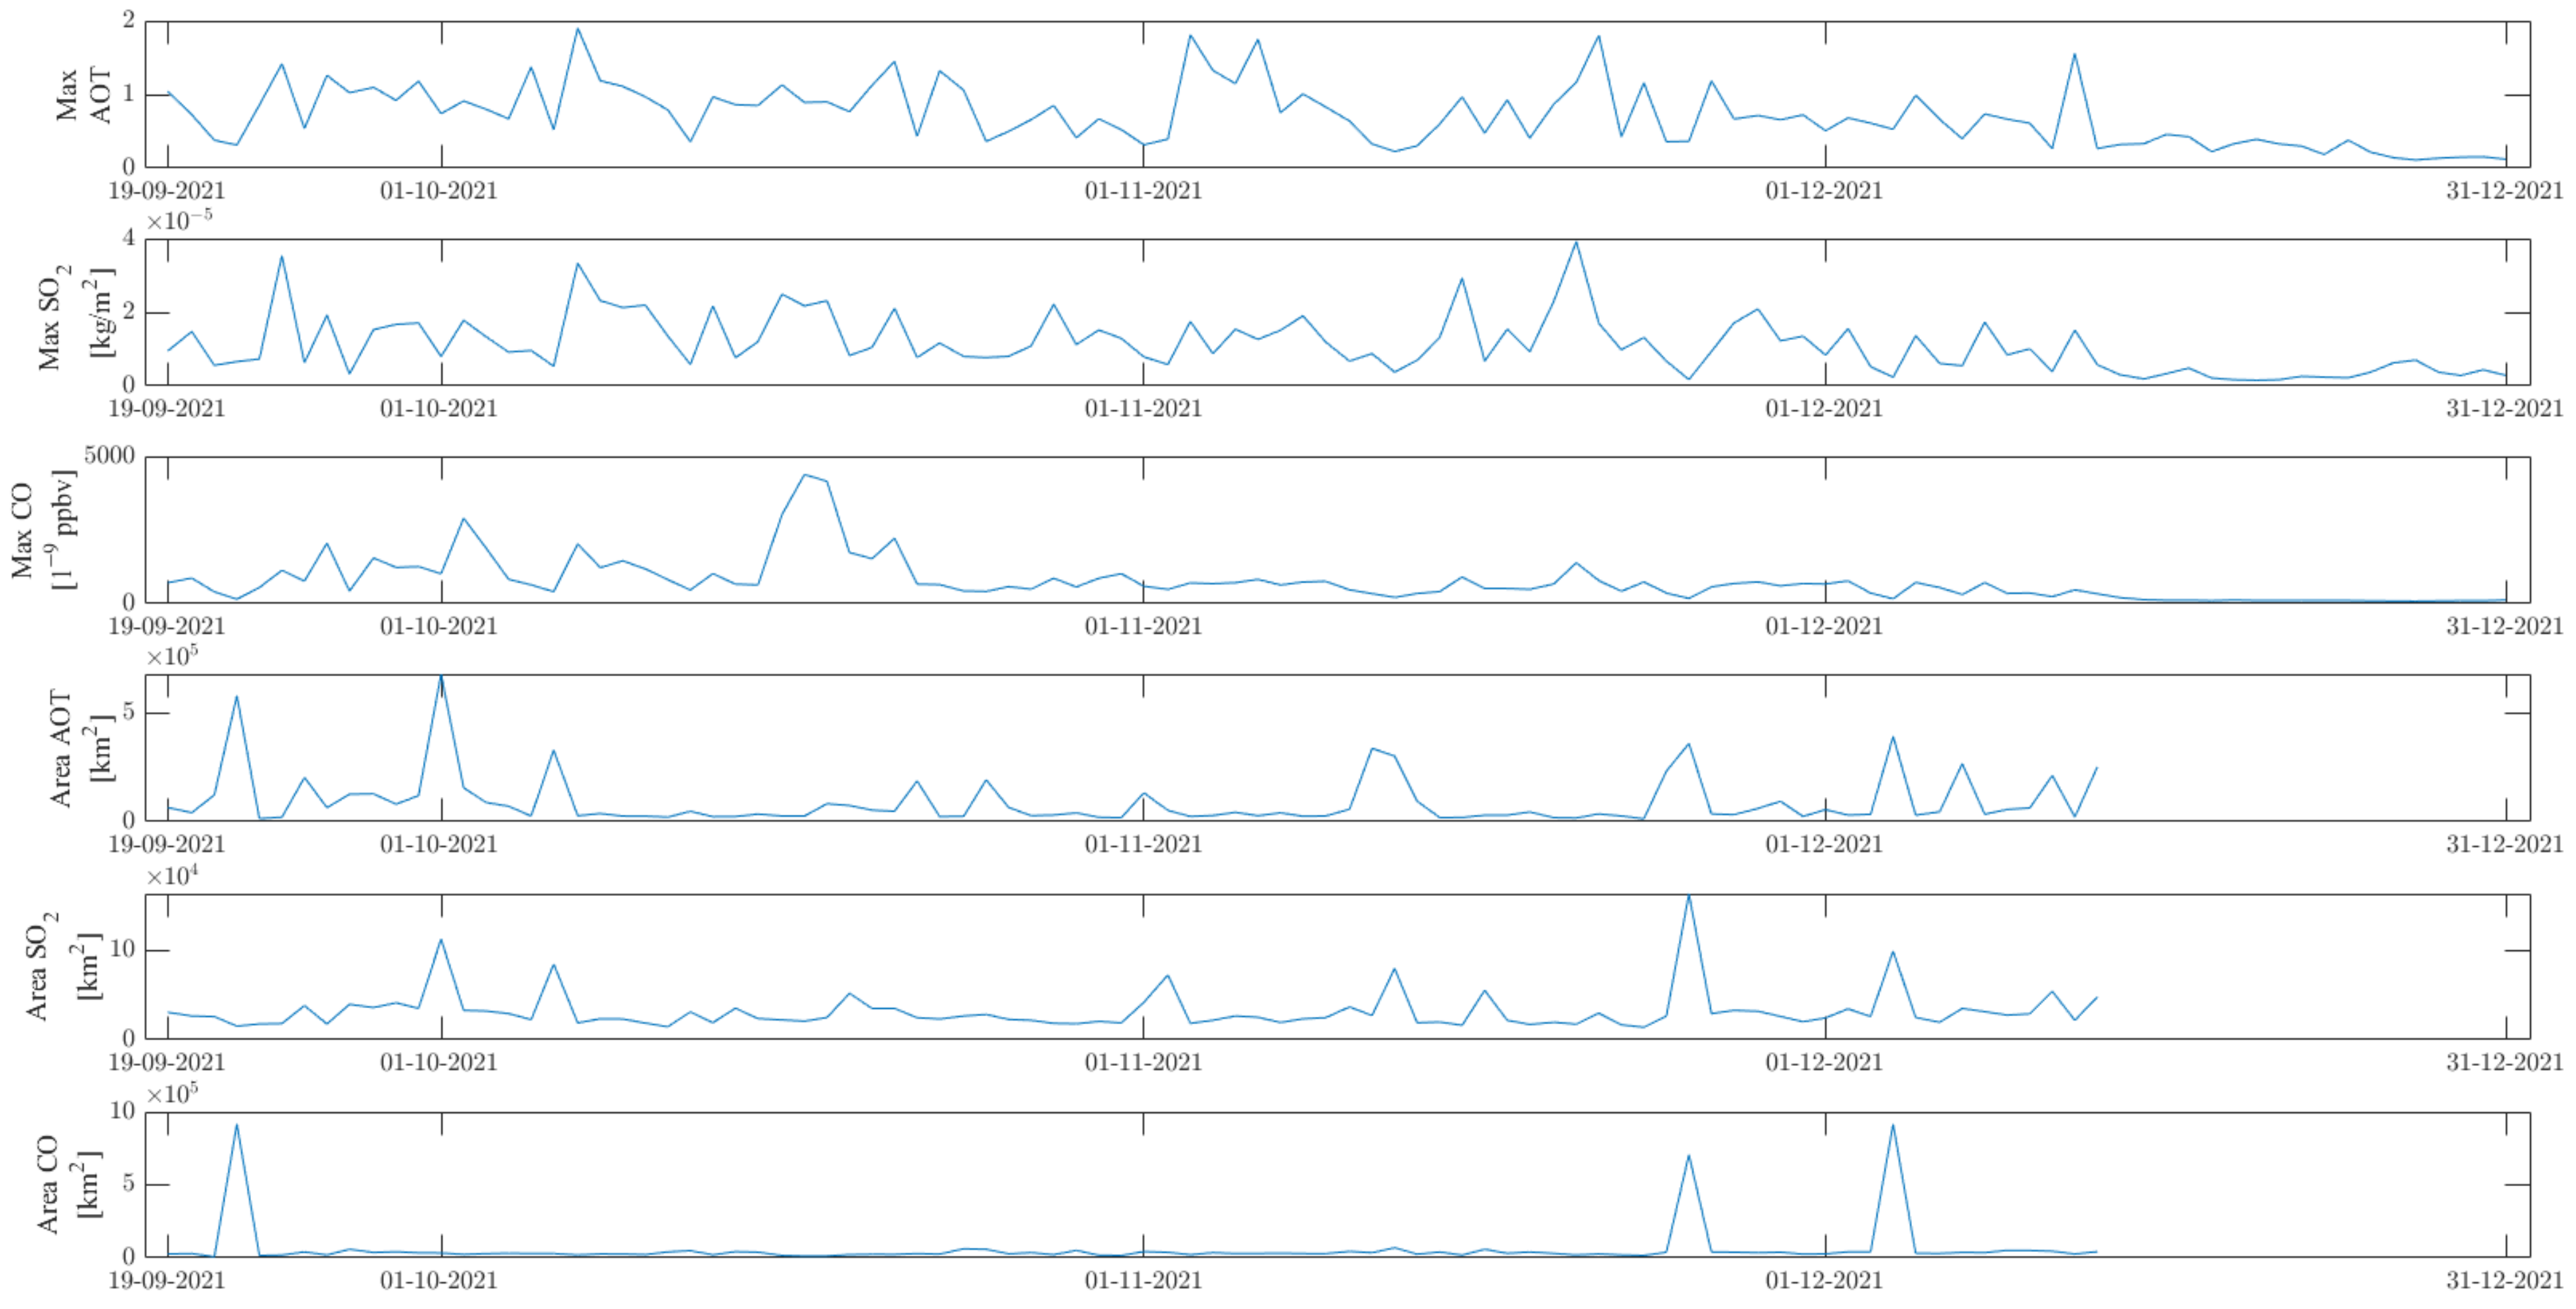
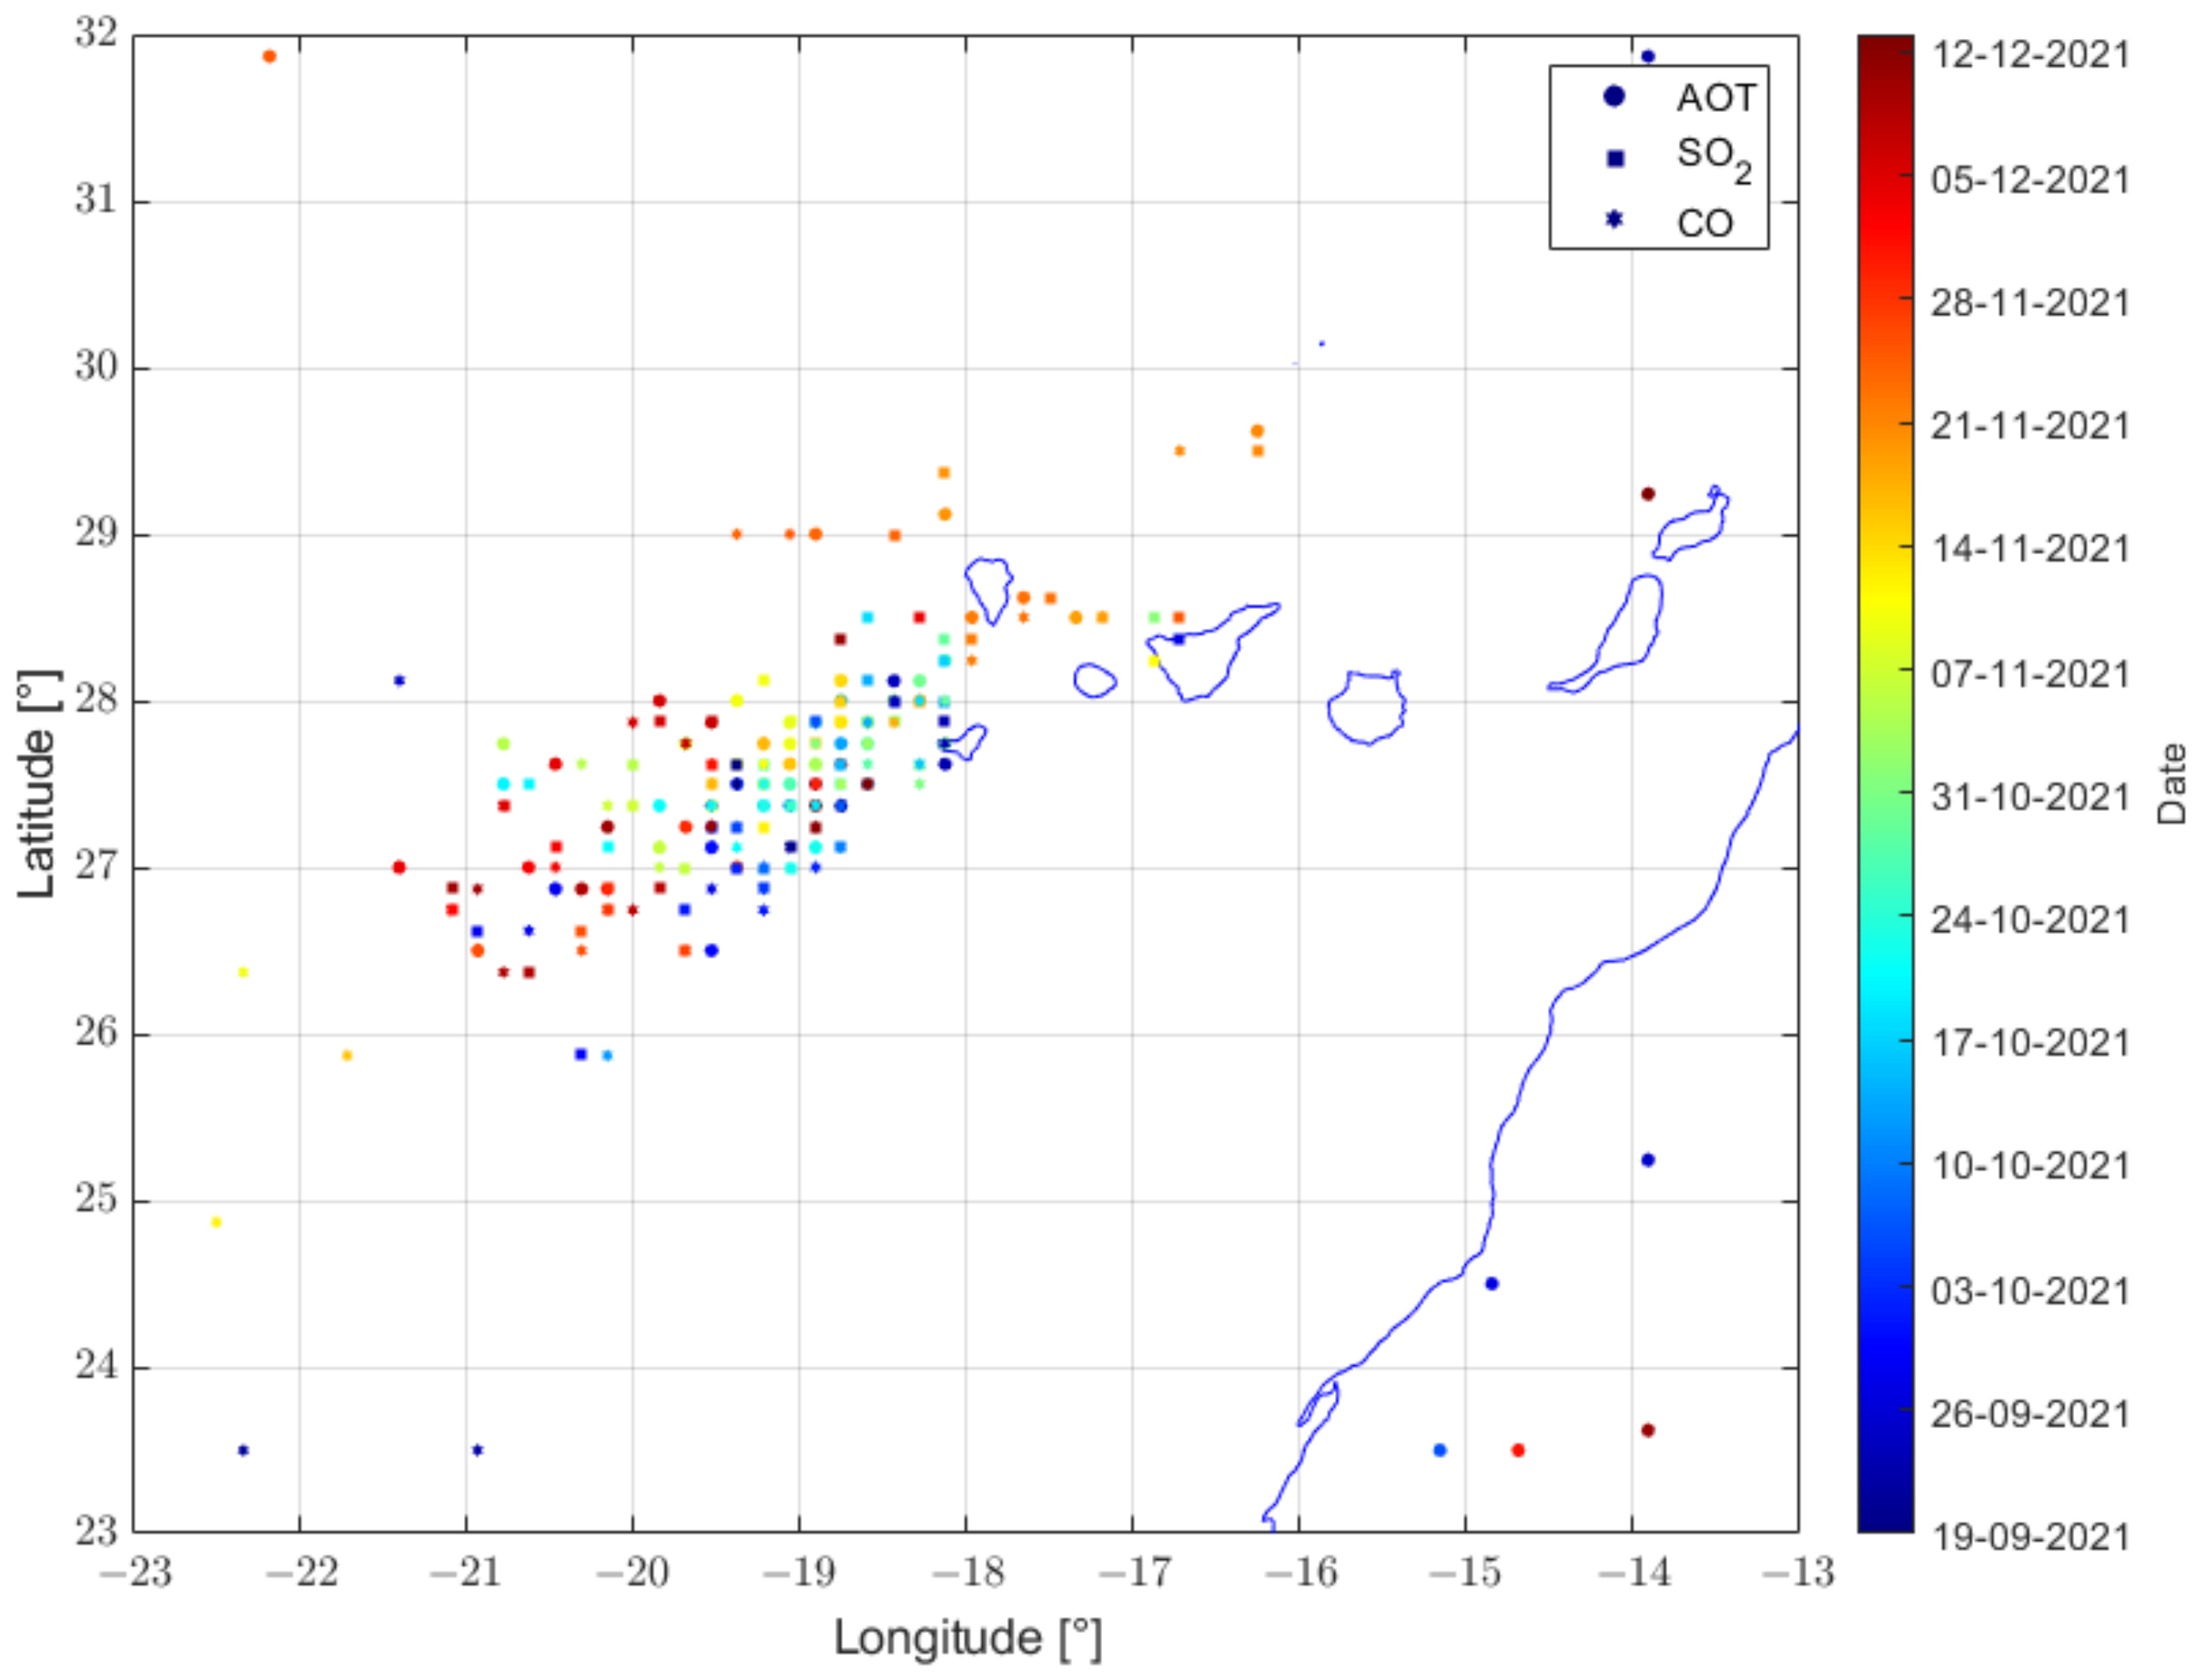
In this section, we investigate the maps of Aerosol, SO2 and CO, searching automatically to identify the volcanic plume. In particular, we extracted the maximum value of the atmospheric parameters, the area of the plume (see Figure 9) and the position of the maximum value (see Figure 10).
Each parameter has been investigated in the box delimited by 22° W ≤ longitude ≤ 14° W and 23° N ≤ latitude ≤ 32° N. The maximum value is the original maximum value of the map. For the research of its position and the extension of the plume, the data have been firstly interpolated to increase of 4 times the spatial resolution and after the 2 quantities are extracted. In particular, the area is computed by counting all the pixels that have a value equal to or greater than half of the maximum value (of the original image). So the area is to be considered equivalent to FWHM (Full Width Half Maximum).
The time series of the estimation of the area of the plume is cut off after 13 December 2021, as after the eruption, the obtained values were unrealistic. In fact, as the value is determined as the number of pixels that are higher or equal to half of the maximum value in the box, then a low maximum value decreases the general threshold counting pixels that are unrelated to the volcano.
In the time series of maximum values of the three atmospheric parameters, it is still possible to confirm that after the last half of December, their values were significantly lower following the end of the eruption. Larger peaks in the time series of the area in December 2021 correspond to a dilution of the plume in the wide area, increasing its dimensions, but as it is associated with lower maximum values, it does not correspond to an increase in volcano activity.
From the map of Figure 10, it is possible to note that most of the points are located in the West-South-West of La Palma volcano, indicating that the trend (due to the wind) was to transport the volcanic plume above this side that corresponded to the central Atlantic Ocean.

3.2.3. Atmospheric Time Series

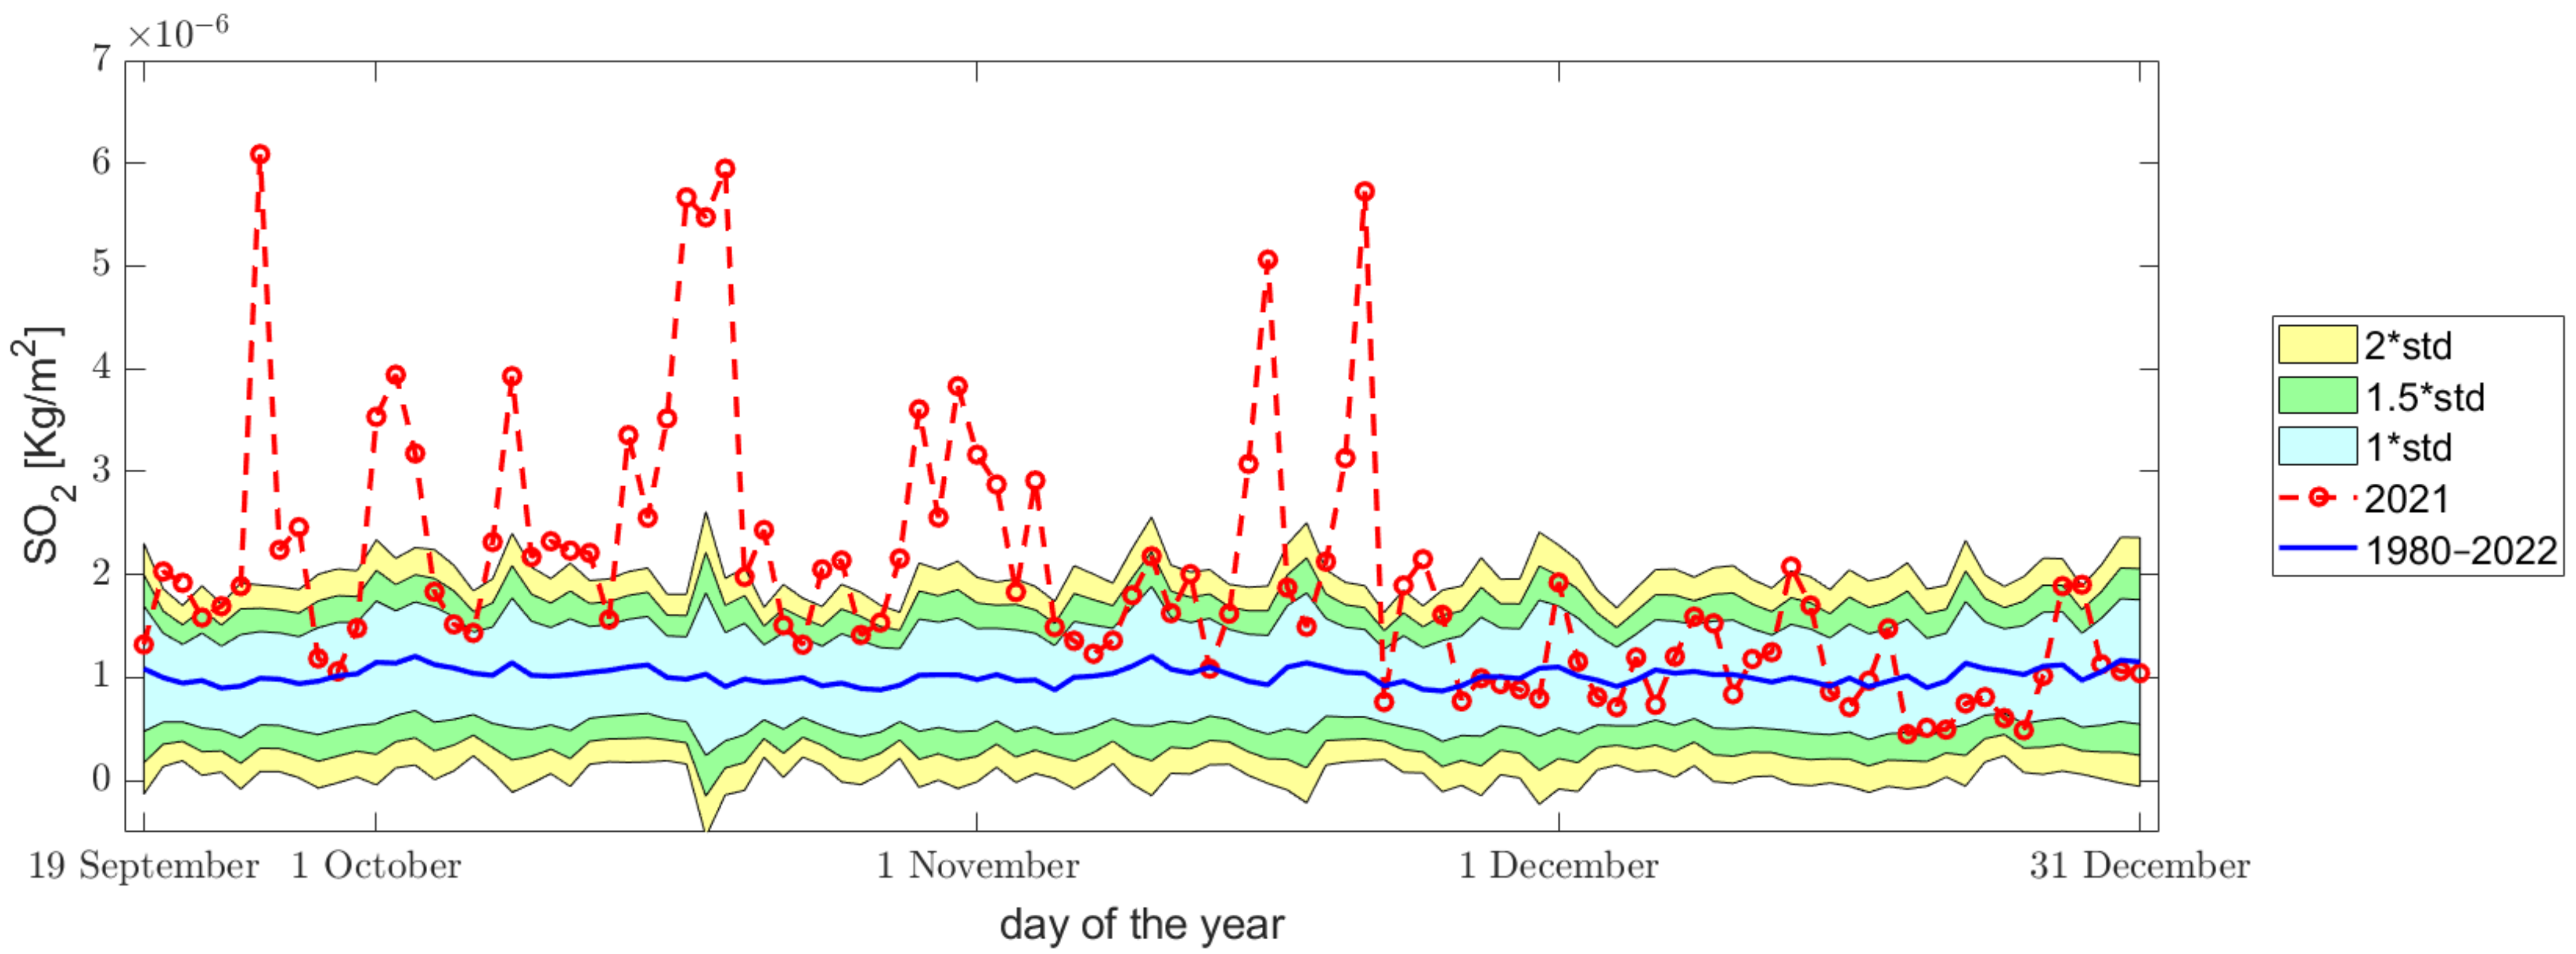
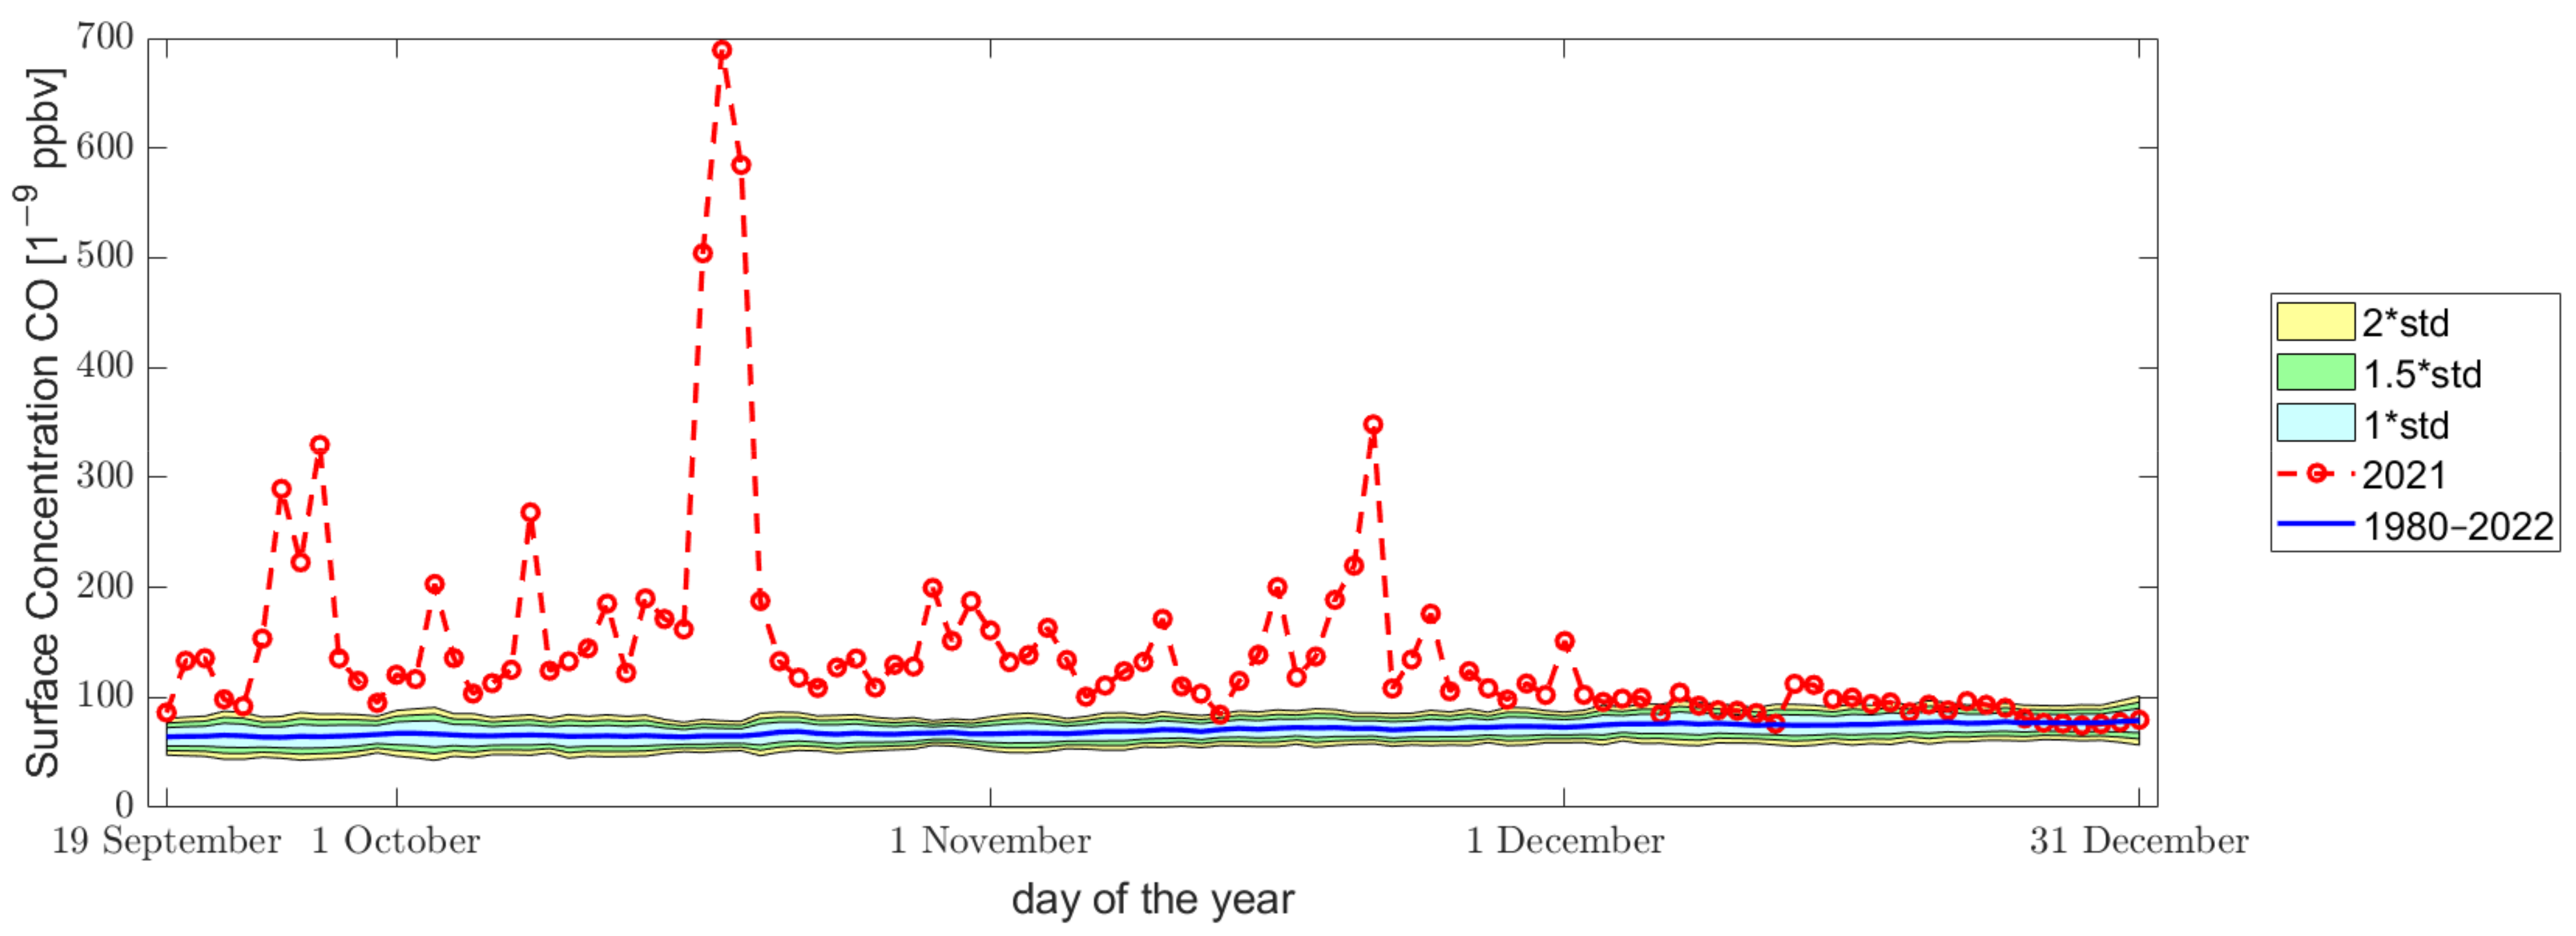
Here we present the results of the application of the MEANS algorithm to the aerosol, SO2 and CO parameters retrieved from MERRA-2 in Figure 11, Figure 12 and Figure 13, respectively. All the parameters present anomalous values which underline the substances emitted by the volcano in the atmosphere. In particular, the most anomalous is the carbon monoxide (CO) which is always above the thresholds until November and in December 2021 it went back inside the typical value for this region. This is well in agreement with the seismicity trend shown in Figure 2.
For the aerosol time series, it is outstanding to note that the anomalous days tend to concentrate in the first half of the time series, as visible in Figure 11. A similar consideration can be drawn out for SO2, but in this case, the value presents more anomalies for a longer time. In fact, the last larger anomaly was recorded on 21 November 2021, and smaller anomalies can be depicted on 23 and 24 November and isolated one on 13 and 28 December 2021.
The aspect of the CO time series of Figure 13 is very peculiar, and this is due to the fact that background is calculated in years without eruption, and so the value during the eruption is extremely higher than the typical one for this region (and time). This is the reason why the algorithm MEANS automatically checks for possible outliers in the background year that generally are due to volcanic eruptions and excludes such a year from the historical mean [59]. Despite this, the year that must be investigated is always excluded from the background, and in this case, this study coincides with the La Palma eruption. At the same time, even though Aerosol and SO2 did not present such extreme values also, CO concentration after the end of the eruption in December decreased inside the typical values (i.e., inside 2 standard deviations of historical values).

3.3. Results of the Ionosphere

In order to investigate the lithosphere, a circular research area centred on the La Palma volcano has been considered. For the extension of the area, we take into account that firstly, the satellites are flying at an altitude of about 500 km, so a smaller diameter would not be reasonable, as stated in [67]. We also need to consider that the plume has been transported by the wind during this period, and we may expect a possible coupling with the atmosphere both straight with the volcano activity (so above La Palma Island) or at above the plume as possible coupling with the volcano activity may be indirect as in the case of Hunga Tonga Hunga Ha’Apai that was reported a possible LAIC in ionosphere with the pressure wave produced by the extreme explosion [68,69]. A radius of 380 km was finally selected. Only tracks acquired during the quiet geomagnetic time (|Dst| ≤ 20 nT and ap ≤ 15 nT) are taken into account to search for anomalies.
Figure 14 shows a track that contains anomalous values of Y, East and Z, vertical components of the geomagnetic field on the first day of the starting of the La Palma eruption. It is interesting to note that the Y component is the one with a higher intensity peak to peak of the identified anomaly (about 1.5 nT/s), and this is a typical feature that in the previous study on possible LAIC or geomagnetic jerks poses toward the internal origin of the signal [39,70]. We also noted that this is the stronger perturbation among the section of the tracks between −50° and +50° geomagnetic latitude. The projection of the anomaly on the ground is in Las Canarias Archipelagos but on the East side, opposite the one of La Palma. Previous studies already identified eastward shifts of possible seismo-induced ionospheric electromagnetic anomalies, for example, before the catastrophic Mw = 7.9 Wenchuan (China) 2008 earthquake [71,72,73,74] or from statistical studies [75,76]. This can be explained from a theoretical model: an upward current combined with the geomagnetic field results in a drift toward the East as calculated and simulated by Ruzhin et al. [76] and Kuo et al. [28]. Consequently, the Swarm magnetic anomaly depicted in Figure 14 may be explained in the same theoretical framework. Furthermore, considering the strong eruption activity that started on this day, a link with this event cannot be excluded.
Figure 15 shows an anomalous track of Swarm Bravo acquired on 21 September 2021, on the same day shown in the centre column of Figure 3 and Figure 4. Compared with the previously analysed track, the Y anomaly seems faster and isolated. A small disturbance is also present in the Z component but is small not to exceed the threshold to be defined anomaly. We note that there is a spatial correspondence with aerosol map concentration on the same day (see Figure 4). In addition, this sharp impulse is peculiar, as no other similar signals have been recorded during the investigated period as shown in Supplementary Materials where we reported all the tracks that crossed the Dobrovolsky’s area, with the exception of a double pulse acquired by Alpha and Charlie on 29 November 2021. Appendix B is dedicated to a deeper investigation of the Swarm operating conditions during this anomaly. According to ESA data quality flags, the satellite was in nominal condition. Despite all of these coincidences, it does not seem easy to explain such a variation in the track with an impact of acoustic gravity wave in the ionosphere. It is still possible that a combination of acoustic gravity wave with a second propagation mechanism, for example, after hitting the F2 layer in the ionosphere, better describes this possible coupling (as proposed for earthquakes by Hayakawa [77] and investigated by Marchetti et al. [78]). Finally, the intensity of the perturbation of more than one hundred nanoteslas is larger than what natural hazard normally is expected to cause in the ionosphere in the magnitude order from 1 or 10 nT.
An interesting anomaly in the research area was identified by Swarm Bravo on 28 September 2021 as shown in Figure 16. During the time of acquisition, geomagnetic conditions were quiet: Dst = 1 nT and ap = 12 nT. Among the whole orbit, there are other anomalous signals, especially at about 12° N geomagnetic latitude, but the most intense signal in the residual is exactly at the volcano latitude. To this day, no vertical thermal profiles show the possible presence of anomalous Ep, so if this anomaly has been induced by the volcanic eruption, the coupling mechanism cannot be an AGW. Similar perturbations are recorded in this region on the southern side, as visible in Supplementary Materials. We cannot exclude that these are ionospheric responses to different lithospheric phenomena. For example, earthquakes statistically seem to influence the ionosphere [50] or oceanic currents [79]. Finally, the anomaly depicted in Figure 15 is very much different from the one recorded in Figure 14 and Figure 16. The one in Figure 15 does not seem to be caused by an instrument malfunction. Nevertheless, further verification could be necessary, even though the volcanic source appears unlikely due to its intensity. On the other side, the anomalies depicted in Figure 14 and Figure 16 are more likely to be induced by volcanic activity, and future investigations are necessary in order to assess better the mechanism of coupling of geo-layers.

4. Discussion and Conclusions

In this work, we have investigated possible alterations of the atmosphere and ionosphere during La Palma 2021 volcanic eruption. This work can be considered a compendium of our previous publication, where we investigated the lithosphere, atmosphere and ionosphere in the 6 months preceding this eruption [5]. The approaches we used in this work are similar but not exactly the same, and this is also due to the totally different nature of the object of study. In fact, in pre-volcano, the disturbances that we may expect are weak signals, mainly due to the magma uplift in the lithosphere and magma chambers filling. During the eruption, there is not only the presence of effusive and explosive activity at Earth’s surface but also a considerable layer of the atmosphere (of several km) is affected by the presence of the volcanic plume.
In this paper, we also investigated the vertical profile of temperature measured by Saber satellite to search for possible evidence of acoustic gravity waves. In fact, it is well established that during volcano eruption, some ionospheric disturbances (Co-Volcanic Ionospheric Disturbances = CVID) can be induced [31]. In particular, on the day of the starting of eruption, 19 September 2021, there were anomalies in all layers, including evidence of AGW in the atmosphere. In this light, we would re-draw the picture of the possible coupling we presented in the previous paper, adding the acoustic gravity wave as a possible further channel in Figure 17.
We also monitored the direction and extension of the volcanic plume by analysing the maps of aerosol SO2 and CO. It was found that the plume was transported by the wind in a West-South-West direction and reinforced several times as the eruption was ongoing until 13 December 2021.
Finally, it is possible to confirm the huge impact in the atmosphere of the La Palma volcano eruption 2021, and we offer some empirical shreds of evidence for possible impact in the ionosphere explainable by AGW or a more complex chain of phenomena. We identify a great accordance between the atmospheric investigation and the underground seismicity trend, confirming that the atmospheric anomalies are likely induced by the La Palma 2021 volcano eruption. Further studies are necessary to better understand the geophysical interaction between the lithosphere atmosphere and ionosphere in the occasion of volcano eruptions and earthquakes.

Supplementary Materials

The following supporting information can be downloaded at: https://www.mdpi.com/article/10.3390/atmos14081198/s1, Supplementary Materials contains the representation of all Swarm Alpha. Bravo and Charlie magnetic tracks that crossed the research area from 19 September to 31 December 2021.

Author Contributions

Conceptualisation, D.M.; methodology, data curation, D.M.; software, formal analysis visualisation and investigation D.M. and H.Z.; validation, Y.C. and K.Z.; writing—original draft preparation, D.M.; writing—review and editing, D.M., W.C., M.F., S.W., T.W., D.Z. and Y.Z.; supervision, D.M., K.Z. and Y.C.; project administration and funding acquisition, D.M. and K.Z. All authors have read and agreed to the published version of the manuscript.

Funding

This research was funded by the National Natural Science Foundation of China, grant number 41974084; the China Postdoctoral Science Foundation, grant number 2021M691190; the International Cooperation Project of the Department of Science and Technology of Jilin Province, grant number 20200801036GH.

Institutional Review Board Statement

Not applicable.

Informed Consent Statement

Not applicable.

Data Availability Statement

Seismic data are freely available from “Instituto Geográfico Nacional” of Spain on their web portal (https://www.ign.es/web/ign/portal/sis-area-sismicidad, last access 20 June 2023). MERRA-2 data can be downloaded from https://disc.gsfc.nasa.gov/datasets?project=MERRA-2 (last access on 26 June 2023) with Earth Observation NASA free credential. Swarm data are freely available via ftp and http at swarm-diss.eo.esa.int server (last access on 26 June 2023).

Acknowledgments

We would acknowledge Luca D’Auria, Guido Ventura and Alessandro Piscini, for their suggestions and discussions and Francisco Javier Pavón-Carrasco, Saioa Arquero Campuzano, Maurizio Soldani and Angelo De Santis for their contributions in the preparation, writing and optimisation of some codes re-used in this work originally developed for some of the cited papers. The authors acknowledge ISSI/ISSI-BJ for support the International Team 553 “CSES and Swarm Investigation of the Generation Mechanisms of Low Latitude Pi2 Waves” lead by Essam Ghamry and Zeren Zhima and International Team 23-583 “Investigation of the Lithosphere Atmosphere Ionosphere Coupling (LAIC) Mechanism before the Natural Hazards” lead by Dedalo Marchetti and Essam Ghamry. We acknowledge the SABER Team to make freely available the vertical temperature profiles at the web portal https://saber.gats-inc.com/ (last access 30 June 2023).

Conflicts of Interest

The authors declare no conflict of interest. The funders had no role in the design of the study; in the collection, analyses, or interpretation of data; in the writing of the manuscript; or in the decision to publish the results.

Appendix A. Distribution Maps of SO2 and CO on Certain Days in September, October and November
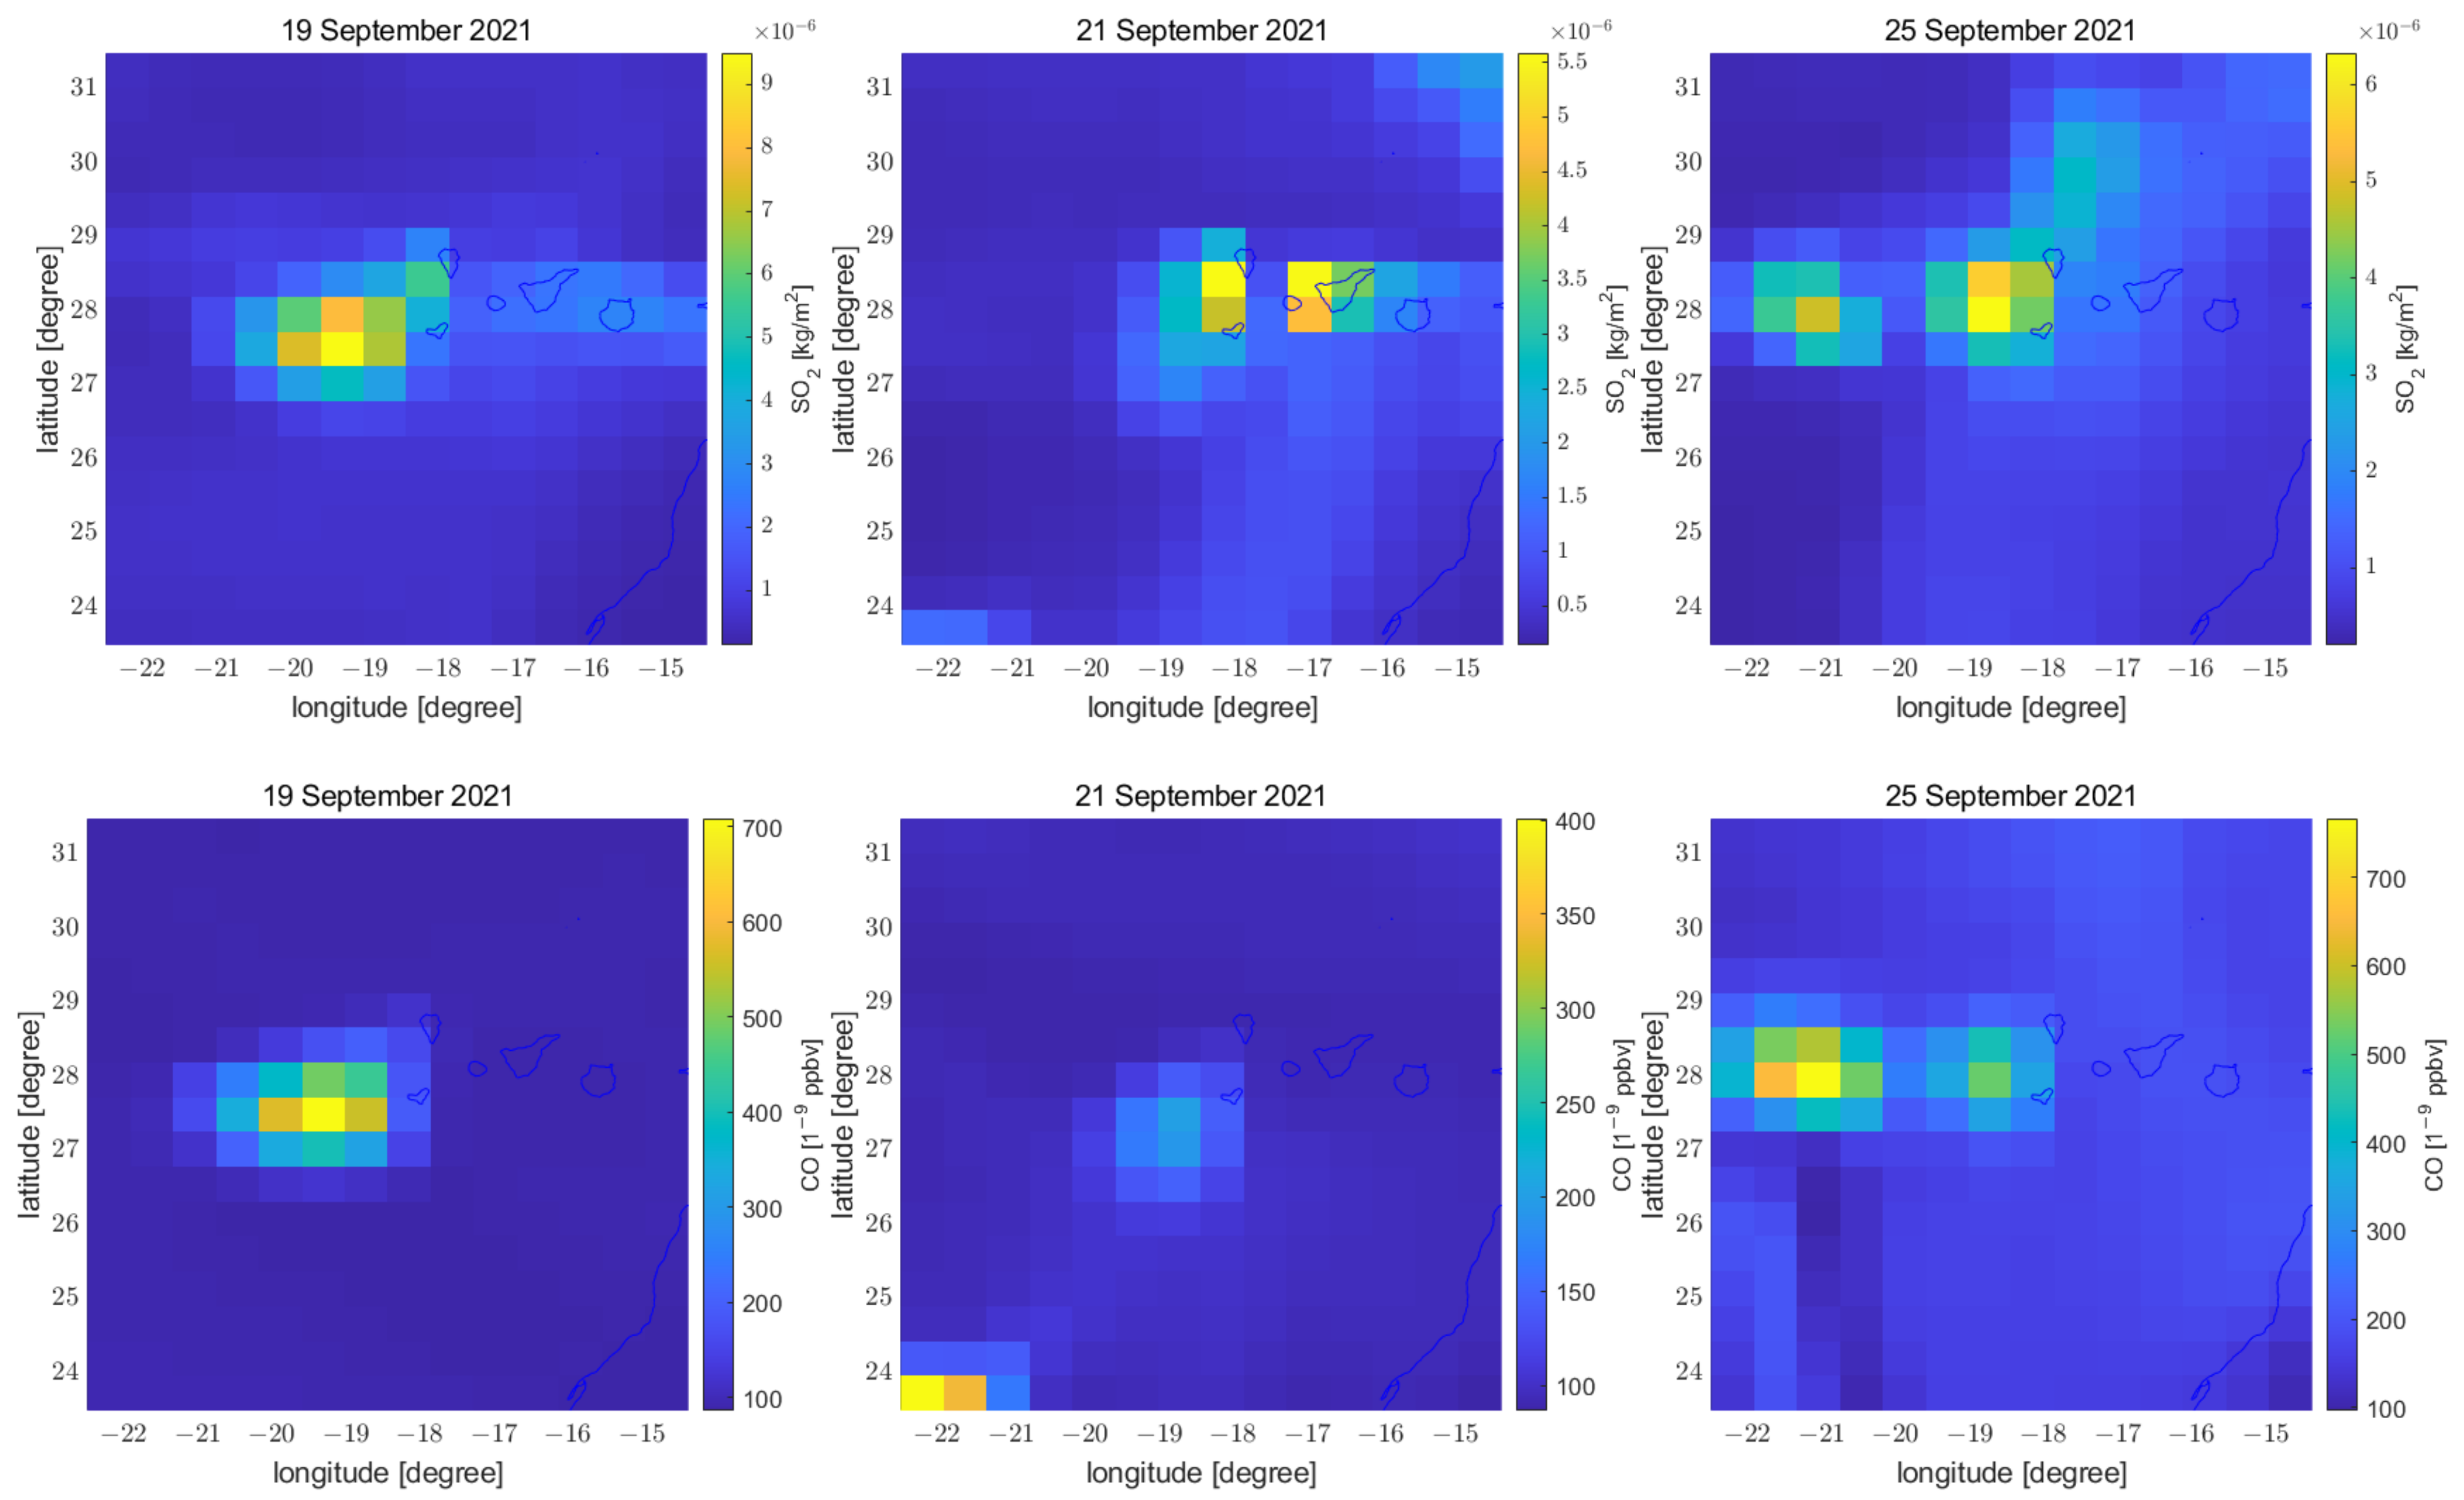
In this appendix, we provided the distribution maps of SO2 and CO on 19 September 2021, 21 September 2021, 25 September 2021, 9 October 2021, 20 October 2021, 24 October 2021, 2 November 2021, 10 November 2021 and 13 November 2021. These maps correspond to the days depicted in the figures of EP (Figure 3, Figure 5 and Figure 7) and the distribution maps of AOT that we showed in Figure 4, Figure 6 and Figure 8. They showed that at almost the same time as the EP anomalies, the AOT, SO2 and CO in the atmosphere had a similar distribution of anomalies. For this, we can support the link of these anomalies to the eruption of the La Palma volcano. Some of these anomalies occur near the volcano, and some are a little farther away from the volcano, underling that the plume has been transported far following the local wind direction.
Figure A1. Distribution maps of SO2 and CO on 19 September 2021, 21 September 2021 and 25 September 2021. The blue line indicates the coastline.
Atmosphere 14 01198 g0a1
Figure A2. Distribution maps of SO2 and CO on 9 October 2021, 20 October 2021 and 24 October 2021. The blue line indicates the coastline.
Atmosphere 14 01198 g0a2
Figure A3. Distribution maps of SO2 and CO on 2 November 2021, 10 November 2021 and 13 November 2021. The blue line indicates the coastline.
Atmosphere 14 01198 g0a3

Appendix B. Inspection of the Original Swarm B Data of 21 September 2021
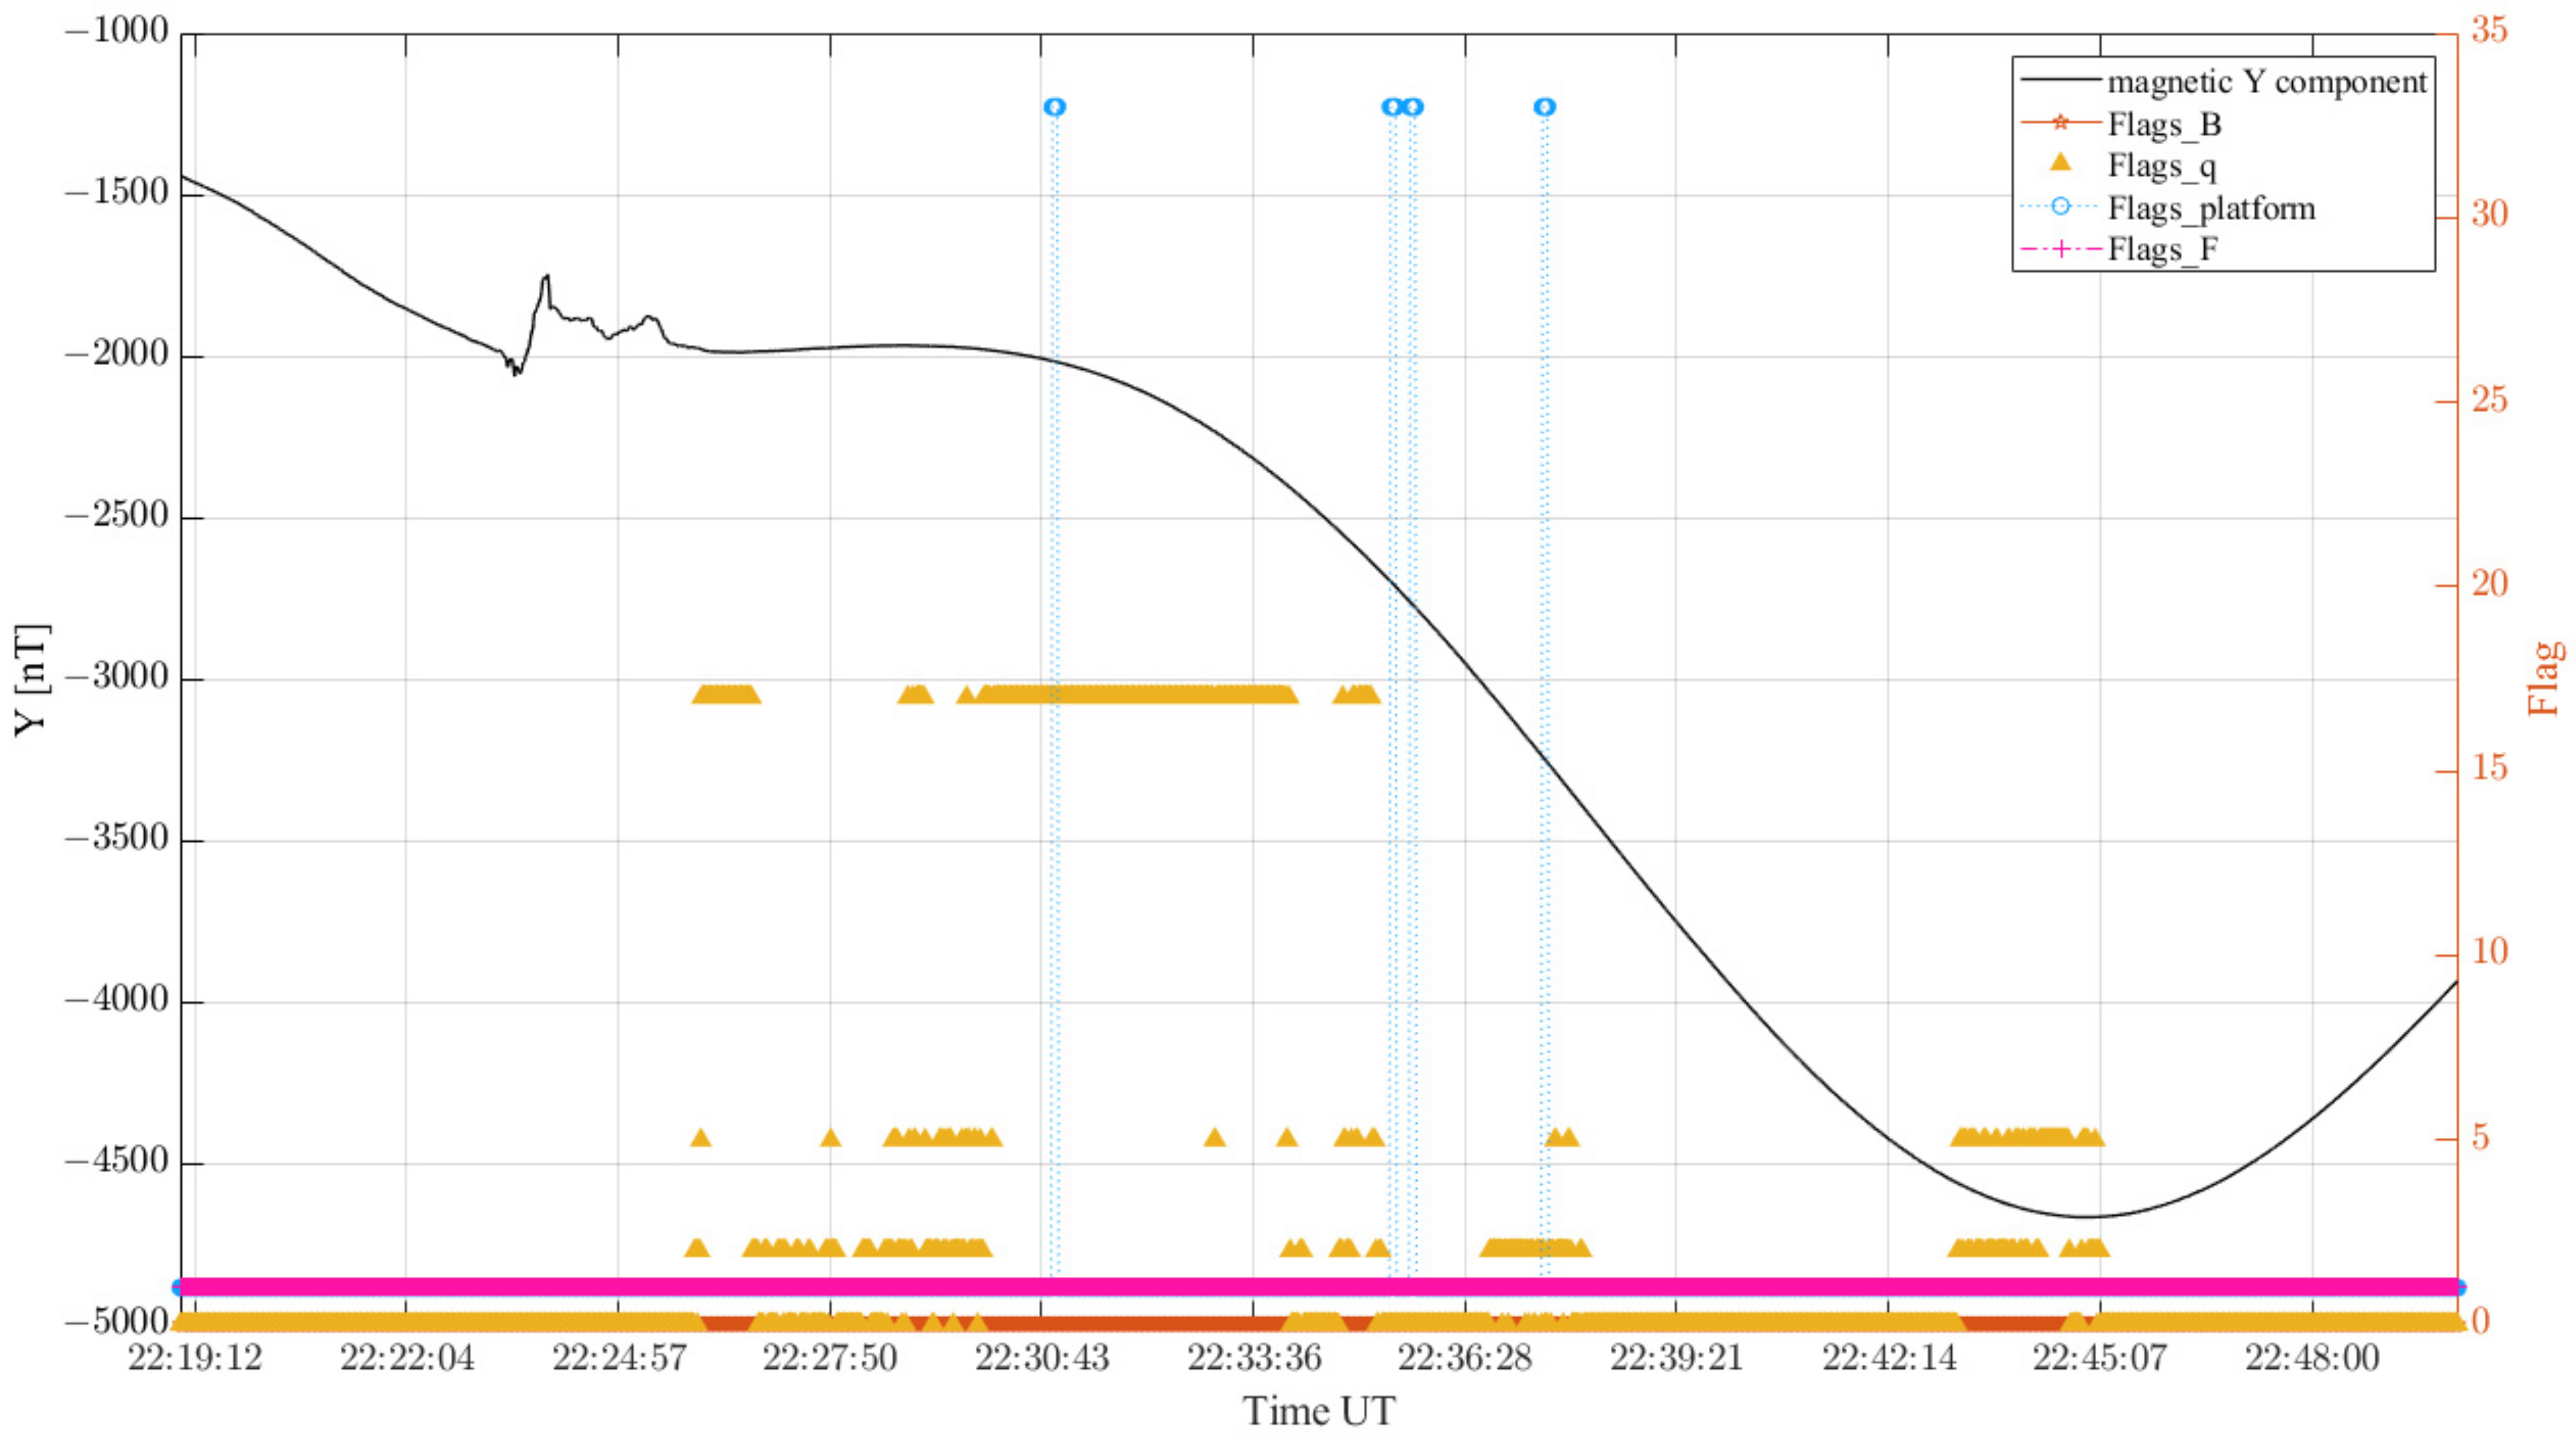
In this appendix, we provided an inspection of the original Swarm B data acquired on 21 September 2021. Such an investigation is necessary to understand if the anomaly depicted in Figure 15 on this day by Swarm B may be due to some malfunction of the satellite platform or the VFM instrument. For this purpose, we downloaded the last available release of Swarm data, i.e., version 602, and we checked the four flags in the moments that the anomaly was recorded. In addition, we reported in Figure A4 the original data as provided by ESA without any processing (i.e., the Y-East component of the magnetic field) in order to exclude that the anomaly depicted in Figure 15 could be an artefact of our processing of the magnetic data. It is interesting to note that the anomaly shown in Figure 15 as a sharp signal acquired at about 22:23:30 UT corresponds to a jump in the Y magnetic field, as visible in Figure A4. Furthermore, the signal slightly oscillated just before and after the jump, with a peculiar shape, returning to a standard trend at about 22:26 UT. Consequently, we can say that this anomaly persisted for about 2.4 min, and its maximum intensity reached about 290 nT (peak-to-peak). To check the operating conditions of the Swarm B satellite, we represented the Flags_B related to the VFM instrument, Flabs_q associated with the attitude of the satellite, Flags_platform indicating the satellite’s general conditions and Flag_F related to the ASM instrument. Flags_B and Flags_F are always at their standard values of 0 and 1, respectively, indicating nominal conditions of the measurement instruments. Flags_q underlines some non-nominal conditions of the satellite’s attitude with values equal to 2, 5 and 17 in limited moments. According to the Swarm mission operating manual (https://swarmhandbook.earth.esa.int/catalogue/SW_MAGx_LR_1B, last access 20 July 2023) such indications indicate problems with one of the 3 star cameras. In particular, flag_q = 17 indicates a bright object (such as Sun) in the first star camera. The other two star cameras were working nominally, so we don’t think this may impact the quality of our results. Overall, these phenomena happened after the recording of the anomaly. Also, the Flags_platfor indicated a flag = 33 in few moments, which is a combination of Flags_platform = 1 (thruster latch valves open, thruster not activated) and flags_platform = 32 which means a change in instrument state according to bus telemetry. The first condition is the standard one of Swarm satellites; the second is recorded several minutes after this anomaly. Finally, according to all the available flags, the anomaly in Figure 15 cannot be explained as a known satellite malfunction.
Figure A4. Swarm B original data (version 602) in NEC frame acquired on 21 September 2021. The quality flags are also represented.
Atmosphere 14 01198 g0a4

References

  1. De Luca, C.; Valerio, E.; Giudicepietro, F.; Macedonio, G.; Casu, F.; Lanari, R. Pre- and Co-Eruptive Analysis of the September 2021 Eruption at Cumbre Vieja Volcano (La Palma, Canary Islands) through DInSAR Measurements and Analytical Modeling. Geophys. Res. Lett. 2022, 49, e2021GL097293. [Google Scholar] [CrossRef]
  2. Dóniz-Páez, J.; Németh, K.; Becerra-Ramírez, R.; Hernández, W.; Gosálvez, R.U.; Escobar, E.; González, E. Tajogaite 2021 Eruption (La Palma, Canary Islands, Spain): An Exceptional Volcanic Heritage to Develop Geotourism. Proceedings 2023, 87, 26. [Google Scholar] [CrossRef]
  3. Pankhurst, M.J.; Scarrow, J.H.; Barbee, O.A.; Hickey, J.; Coldwell, B.C.; Rollinson, G.K.; Rodríguez-Losada, J.A.; Martín Lorenzo, A.; Rodríguez, F.; Hernández, W.; et al. Rapid Response Petrology for the Opening Eruptive Phase of the 2021 Cumbre Vieja Eruption, La Palma, Canary Islands. Volcanica 2022, 5, 1–10. [Google Scholar] [CrossRef]
  4. Civico, R.; Ricci, T.; Scarlato, P.; Taddeucci, J.; Andronico, D.; Del Bello, E.; D’Auria, L.; Hernández, P.A.; Pérez, N.M. High-Resolution Digital Surface Model of the 2021 Eruption Deposit of Cumbre Vieja Volcano, La Palma, Spain. Sci. Data 2022, 9, 435. [Google Scholar] [CrossRef] [PubMed]
  5. Marchetti, D.; Zhu, K.; Zhang, H.; Zhima, Z.; Yan, R.; Shen, X.; Chen, W.; Cheng, Y.; He, X.; Wang, T.; et al. Clues of Lithosphere, Atmosphere and Ionosphere Variations Possibly Related to the Preparation of La Palma 19 September 2021 Volcano Eruption. Remote Sens. 2022, 14, 5001. [Google Scholar] [CrossRef]
  6. Molchanov, O.A.; Hayakawa, M. Generation of ULF Electromagnetic Emissions by Microfracturing. Geophys. Res. Lett. 1995, 22, 3091–3094. [Google Scholar] [CrossRef]
  7. Freund, F. Pre-Earthquake Signals: Underlying Physical Processes. J. Asian Earth Sci. 2011, 41, 383–400. [Google Scholar] [CrossRef]
  8. Pulinets, S.; Ouzounov, D. Lithosphere–Atmosphere–Ionosphere Coupling (LAIC) Model—An Unified Concept for Earthquake Precursors Validation. J. Asian Earth Sci. 2011, 41, 371–382. [Google Scholar] [CrossRef]
  9. Pulinets, S.; Ouzounov, D.; Karelin, A.; Davidenko, D. Lithosphere-Atmosphere-Ionosphere-Magnetosphere Coupling-A Concept for Pre-Earthquake Signals Generation. In Pre-Earthquake Processes: A Multidisciplinary Approach to Earthquake Prediction Studies; Ouzounov, D., Pulinets, S., Hattori, K., Taylor, P., Eds.; Geophysical Monograph Series; John Wiley & Sons, Inc.: Hoboken, NJ, USA, 2018; pp. 77–98. ISBN 978-1-119-15694-9. [Google Scholar]
  10. Torres-González, P.A.; Luengo-Oroz, N.; Lamolda, H.; D’Alessandro, W.; Albert, H.; Iribarren, I.; Moure-García, D.; Soler, V. Unrest Signals after 46 Years of Quiescence at Cumbre Vieja, La Palma, Canary Islands. J. Volcanol. Geotherm. Res. 2020, 392, 106757. [Google Scholar] [CrossRef]
  11. Amonte, C.; Melián, G.V.; Asensio-Ramos, M.; Pérez, N.M.; Padrón, E.; Hernández, P.A.; D’Auria, L. Hydrogeochemical Temporal Variations Related to the Recent Volcanic Eruption at the Cumbre Vieja Volcano, La Palma, Canary Islands. Front. Earth Sci. 2022, 10, 1003890. [Google Scholar] [CrossRef]
  12. Di Paolo, F.; Ledo, J.; Ślęzak, K.; Martínez van Dorth, D.; Cabrera-Pérez, I.; Pérez, N.M. La Palma Island (Spain) Geothermal System Revealed by 3D Magnetotelluric Data Inversion. Sci. Rep. 2020, 10, 18181. [Google Scholar] [CrossRef]
  13. Padrón, E.; Pérez, N.M.; Hernández, P.A.; Sumino, H.; Melián, G.V.; Alonso, M.; Rodríguez, F.; Asensio-Ramos, M.; D’Auria, L. Early Precursory Changes in the 3He/4He Ratio Prior to the 2021 Tajogaite Eruption at Cumbre Vieja Volcano, La Palma, Canary Islands. Geophys. Res. Lett. 2022, 49, e2022GL099992. [Google Scholar] [CrossRef]
  14. D’Auria, L.; Koulakov, I.; Prudencio, J.; Cabrera-Pérez, I.; Ibáñez, J.M.; Barrancos, J.; García-Hernández, R.; Martínez van Dorth, D.; Padilla, G.D.; Przeor, M.; et al. Rapid Magma Ascent beneath La Palma Revealed by Seismic Tomography. Sci. Rep. 2022, 12, 17654. [Google Scholar] [CrossRef]
  15. Del Fresno, C.; Cesca, S.; Klügel, A.; Domínguez Cerdeña, I.; Díaz-Suárez, E.A.; Dahm, T.; García-Cañada, L.; Meletlidis, S.; Milkereit, C.; Valenzuela-Malebrán, C.; et al. Magmatic Plumbing and Dynamic Evolution of the 2021 La Palma Eruption. Nat. Commun. 2023, 14, 358. [Google Scholar] [CrossRef]
  16. Romero, J.E.; Burton, M.; Cáceres, F.; Taddeucci, J.; Civico, R.; Ricci, T.; Pankhurst, M.J.; Hernández, P.A.; Bonadonna, C.; Llewellin, E.W.; et al. The Initial Phase of the 2021 Cumbre Vieja Ridge Eruption (Canary Islands): Products and Dynamics Controlling Edifice Growth and Collapse. J. Volcanol. Geotherm. Res. 2022, 431, 107642. [Google Scholar] [CrossRef]
  17. Bonadonna, C.; Pistolesi, M.; Biass, S.; Voloschina, M.; Romero, J.; Coppola, D.; Folch, A.; D’Auria, L.; Martin-Lorenzo, A.; Dominguez, L.; et al. Physical Characterization of Long-Lasting Hybrid Eruptions: The 2021 Tajogaite Eruption of Cumbre Vieja (La Palma, Canary Islands). J. Geophys. Res. Solid Earth 2022, 127, e2022JB025302. [Google Scholar] [CrossRef]
  18. Miguelsanz, L.; Fernández, J.; Prieto, J.F.; Tiampo, K.F. Tidal Modulation of the Seismic Activity Related to the 2021 La Palma Volcanic Eruption. Sci. Rep. 2023, 13, 6485. [Google Scholar] [CrossRef] [PubMed]
  19. Milford, C.; Torres, C.; Vilches, J.; Gossman, A.-K.; Weis, F.; Suárez-Molina, D.; García, O.E.; Prats, N.; Barreto, Á.; García, R.D.; et al. Impact of the 2021 La Palma Volcanic Eruption on Air Quality: Insights from a Multidisciplinary Approach. Sci. Total Environ. 2023, 869, 161652. [Google Scholar] [CrossRef] [PubMed]
  20. Martínez-Martínez, J.; Mediato, J.F.; Mata, M.P.; Ordóñez, B.; del Moral, B.; Bellido, E.; Pérez-López, R.; Rodríguez-Pascua, M.A.; Vegas, J.; Lozano Otero, G.; et al. Early Fumarolic Minerals from the Tajogaite Volcanic Eruption (La Palma, 2021). J. Volcanol. Geotherm. Res. 2023, 435, 107771. [Google Scholar] [CrossRef]
  21. Mezcua, J.; Rueda, J. Seismic Swarms and Earthquake Activity B-Value Related to the September 19, 2021, La Palma Volcano Eruption in Cumbre Vieja, Canary Islands (Spain). Bull. Volcanol. 2023, 85, 32. [Google Scholar] [CrossRef]
  22. Liperovsky, V.A.; Pokhotelov, O.A.; Meister, C.-V.; Liperovskaya, E.V. Physical Models of Coupling in the Lithosphere-Atmosphere-Ionosphere System before Earthquakes. Geomagn. Aeron. 2008, 48, 795–806. [Google Scholar] [CrossRef]
  23. Dautermann, T.; Calais, E.; Lognonné, P.; Mattioli, G.S. Lithosphere–Atmosphere–Ionosphere Coupling after the 2003 Explosive Eruption of the Soufriere Hills Volcano, Montserrat. Geophys. J. Int. 2009, 179, 1537–1546. [Google Scholar] [CrossRef] [Green Version]
  24. Spogli, L.; Sabbagh, D.; Regi, M.; Cesaroni, C.; Perrone, L.; Alfonsi, L.; Di Mauro, D.; Lepidi, S.; Campuzano, S.A.; Marchetti, D.; et al. Ionospheric Response Over Brazil to the August 2018 Geomagnetic Storm as Probed by CSES-01 and Swarm Satellites and by Local Ground-Based Observations. JGR Space Phys. 2021, 126, e2020JA028368. [Google Scholar] [CrossRef]
  25. Ghamry, E.; Marchetti, D.; Yoshikawa, A.; Uozumi, T.; De Santis, A.; Perrone, L.; Shen, X.; Fathy, A. The First Pi2 Pulsation Observed by China Seismo-Electromagnetic Satellite. Remote Sens. 2020, 12, 2300. [Google Scholar] [CrossRef]
  26. Molchanov, O.A.; Hayakawa, M. On the Generation Mechanism of ULF Seismogenic Electromagnetic Emissions. Phys. Earth Planet. Inter. 1998, 105, 201–210. [Google Scholar] [CrossRef]
  27. Freund, F.; Ouillon, G.; Scoville, J.; Sornette, D. Earthquake Precursors in the Light of Peroxy Defects Theory: Critical Review of Systematic Observations. Eur. Phys. J. Spec. Top. 2021, 230, 7–46. [Google Scholar] [CrossRef]
  28. Kuo, C.L.; Lee, L.C.; Huba, J.D. An Improved Coupling Model for the Lithosphere-Atmosphere-Ionosphere System. J. Geophys. Res. Space Phys. 2014, 119, 3189–3205. [Google Scholar] [CrossRef]
  29. Pulinets, S.A. Physical Mechanism of the Vertical Electric Field Generation over Active Tectonic Faults. Adv. Space Res. 2009, 44, 767–773. [Google Scholar] [CrossRef]
  30. Pulinets, S.; Khachikyan, G. The Global Electric Circuit and Global Seismicity. Geosciences 2021, 11, 491. [Google Scholar] [CrossRef]
  31. Astafyeva, E. Ionospheric Detection of Natural Hazards. Rev. Geophys. 2019, 57, 1265–1288. [Google Scholar] [CrossRef]
  32. Rolland, L.M.; Lognonné, P.; Munekane, H. Detection and Modeling of Rayleigh Wave Induced Patterns in the Ionosphere. J. Geophys. Res. 2011, 116, A05320. [Google Scholar] [CrossRef] [Green Version]
  33. Godin, O.A. Finite-Amplitude Acoustic-Gravity Waves: Exact Solutions. J. Fluid Mech. 2015, 767, 52–64. [Google Scholar] [CrossRef]
  34. Masci, F.; Thomas, J.N. Are There New Findings in the Search for ULF Magnetic Precursors to Earthquakes? J. Geophys. Res. Space Phys. 2015, 120, 10,289–10,304. [Google Scholar] [CrossRef] [Green Version]
  35. Heki, K. Ionospheric Signatures of Repeated Passages of Atmospheric Waves by the 2022 Jan. 15 Hunga Tonga Eruption Detected by QZSS-TEC Observations in Japan. Earth Planets Space 2022, 74, 112. [Google Scholar] [CrossRef]
  36. Uyeda, S.; Hayakawa, M.; Nagao, T.; Molchanov, O.; Hattori, K.; Orihara, Y.; Gotoh, K.; Akinaga, Y.; Tanaka, H. Electric and Magnetic Phenomena Observed before the Volcano-Seismic Activity in 2000 in the Izu Island Region, Japan. Proc. Natl. Acad. Sci. USA 2002, 99, 7352–7355. [Google Scholar] [CrossRef] [PubMed]
  37. Zlotnicki, J.; Li, F.; Parrot, M. Ionospheric Disturbances Recorded by DEMETER Satellite over Active Volcanoes: From August 2004 to December 2010. Int. J. Geophys. 2013, 2013, 530865. [Google Scholar] [CrossRef] [Green Version]
  38. Tramutoli, V.; Marchese, F.; Falconieri, A.; Filizzola, C.; Genzano, N.; Hattori, K.; Lisi, M.; Liu, J.-Y.; Ouzounov, D.; Parrot, M.; et al. Tropospheric and Ionospheric Anomalies Induced by Volcanic and Saharan Dust Events as Part of Geosphere Interaction Phenomena. Geosciences 2019, 9, 177. [Google Scholar] [CrossRef] [Green Version]
  39. Marchetti, D.; De Santis, A.; Shen, X.; Campuzano, S.A.; Perrone, L.; Piscini, A.; Di Giovambattista, R.; Jin, S.; Ippolito, A.; Cianchini, G.; et al. Possible Lithosphere-Atmosphere-Ionosphere Coupling Effects Prior to the 2018 Mw = 7.5 Indonesia Earthquake from Seismic, Atmospheric and Ionospheric Data. J. Asian Earth Sci. 2020, 188, 104097. [Google Scholar] [CrossRef]
  40. Zhu, K.; Fan, M.; He, X.; Marchetti, D.; Li, K.; Yu, Z.; Chi, C.; Sun, H.; Cheng, Y. Analysis of Swarm Satellite Magnetic Field Data Before the 2016 Ecuador (Mw = 7.8) Earthquake Based on Non-Negative Matrix Factorization. Front. Earth Sci. 2021, 9, 621976. [Google Scholar] [CrossRef]
  41. Zhu, K.; Li, K.; Fan, M.; Chi, C.; Yu, Z. Precursor Analysis Associated With the Ecuador Earthquake Using Swarm A and C Satellite Magnetic Data Based on PCA. IEEE Access 2019, 7, 93927–93936. [Google Scholar] [CrossRef]
  42. Akhoondzadeh, M.; De Santis, A.; Marchetti, D.; Piscini, A.; Cianchini, G. Multi Precursors Analysis Associated with the Powerful Ecuador (MW= 7.8) Earthquake of 16 April 2016 Using Swarm Satellites Data in Conjunction with Other Multi-Platform Satellite and Ground Data. Adv. Space Res. 2018, 61, 248–263. [Google Scholar] [CrossRef] [Green Version]
  43. Akhoondzadeh, M.; De Santis, A.; Marchetti, D.; Piscini, A.; Jin, S. Anomalous Seismo-LAI Variations Potentially Associated with the 2017 Mw = 7.3 Sarpol-e Zahab (Iran) Earthquake from Swarm Satellites, GPS-TEC and Climatological Data. Adv. Space Res. 2019, 64, 143–158. [Google Scholar] [CrossRef]
  44. Jing, F.; Singh, R.P.; Shen, X. Land—Atmosphere—Meteorological Coupling Associated with the 2015 Gorkha (M 7.8) and Dolakha (M 7.3) Nepal Earthquakes. Geomat. Nat. Hazards Risk 2019, 10, 1267–1284. [Google Scholar] [CrossRef] [Green Version]
  45. Akhoondzadeh, M.; De Santis, A.; Marchetti, D.; Wang, T. Developing a Deep Learning-Based Detector of Magnetic, Ne, Te and TEC Anomalies from Swarm Satellites: The Case of Mw 7.1 2021 Japan Earthquake. Remote Sens. 2022, 14, 1582. [Google Scholar] [CrossRef]
  46. Han, P.; Hattori, K.; Zhuang, J.; Chen, C.-H.; Liu, J.-Y.; Yoshida, S. Evaluation of ULF Seismo-Magnetic Phenomena in Kakioka, Japan by Using Molchan’s Error Diagram. Geophys. J. Int. 2017, 208, 482–490. [Google Scholar] [CrossRef]
  47. Chen, H.; Han, P.; Hattori, K. Recent Advances and Challenges in the Seismo-Electromagnetic Study: A Brief Review. Remote Sens. 2022, 14, 5893. [Google Scholar] [CrossRef]
  48. Wu, L.; Qi, Y.; Mao, W.; Lu, J.; Ding, Y.; Peng, B.; Xie, B. Scrutinizing and Rooting the Multiple Anomalies of Nepal Earthquake Sequence in 2015 with the Deviation–Time–Space Criterion and Homologous Lithosphere–Coversphere–Atmosphere–Ionosphere Coupling Physics. Nat. Hazards Earth Syst. Sci. 2023, 23, 231–249. [Google Scholar] [CrossRef]
  49. De Santis, A.; Marchetti, D.; Pavón-Carrasco, F.J.; Cianchini, G.; Perrone, L.; Abbattista, C.; Alfonsi, L.; Amoruso, L.; Campuzano, S.A.; Carbone, M.; et al. Precursory Worldwide Signatures of Earthquake Occurrences on Swarm Satellite Data. Sci. Rep. 2019, 9, 20287. [Google Scholar] [CrossRef] [Green Version]
  50. Marchetti, D.; De Santis, A.; Campuzano, S.A.; Zhu, K.; Soldani, M.; D’Arcangelo, S.; Orlando, M.; Wang, T.; Cianchini, G.; Di Mauro, D.; et al. Worldwide Statistical Correlation of Eight Years of Swarm Satellite Data with M5.5+ Earthquakes: New Hints about the Preseismic Phenomena from Space. Remote Sens. 2022, 14, 2649. [Google Scholar] [CrossRef]
  51. Yan, R.; Parrot, M.; Pinçon, J.-L. Statistical Study on Variations of the Ionospheric Ion Density Observed by DEMETER and Related to Seismic Activities: Ionospheric Density and Seismic Activity. J. Geophys. Res. Space Phys. 2017, 122, 12,421–12,429. [Google Scholar] [CrossRef] [Green Version]
  52. Genzano, N.; Filizzola, C.; Hattori, K.; Pergola, N.; Tramutoli, V. Statistical Correlation Analysis Between Thermal Infrared Anomalies Observed From MTSATs and Large Earthquakes Occurred in Japan (2005–2015). J. Geophys. Res. Solid Earth 2021, 126, e2020JB020108. [Google Scholar] [CrossRef]
  53. Filizzola, C.; Corrado, A.; Genzano, N.; Lisi, M.; Pergola, N.; Colonna, R.; Tramutoli, V. RST Analysis of Anomalous TIR Sequences in Relation with Earthquakes Occurred in Turkey in the Period 2004–2015. Remote Sens. 2022, 14, 381. [Google Scholar] [CrossRef]
  54. Zhang, Y.; Wang, T.; Chen, W.; Zhu, K.; Marchetti, D.; Cheng, Y.; Fan, M.; Wang, S.; Wen, J.; Zhang, D.; et al. Are There One or More Geophysical Coupling Mechanisms before Earthquakes? The Case Study of Lushan (China) 2013. Remote Sens. 2023, 15, 1521. [Google Scholar] [CrossRef]
  55. Kundu, S.; Chowdhury, S.; Ghosh, S.; Sasmal, S.; Politis, D.Z.; Potirakis, S.M.; Yang, S.-S.; Chakrabarti, S.K.; Hayakawa, M. Seismogenic Anomalies in Atmospheric Gravity Waves as Observed from SABER/TIMED Satellite during Large Earthquakes. J. Sens. 2022, 2022, 3201104. [Google Scholar] [CrossRef]
  56. Yang, S.-S.; Hayakawa, M. Gravity Wave Activity in the Stratosphere before the 2011 Tohoku Earthquake as the Mechanism of Lithosphere-Atmosphere-Ionosphere Coupling. Entropy 2020, 22, 110. [Google Scholar] [CrossRef] [Green Version]
  57. Zhao, W.; Hu, X.; Yan, Z.; Pan, W.; Guo, W.; Yang, J.; Du, X. Atmospheric Gravity Wave Potential Energy Observed by Rayleigh Lidar above Jiuquan (40° N, 95° E), China. Atmosphere 2022, 13, 1098. [Google Scholar] [CrossRef]
  58. Yang, S.; Asano, T.; Hayakawa, M. Abnormal Gravity Wave Activity in the Stratosphere Prior to the 2016 Kumamoto Earthquakes. JGR Space Phys. 2019, 124, 1410–1425. [Google Scholar] [CrossRef]
  59. Piscini, A.; Marchetti, D.; De Santis, A. Multi-Parametric Climatological Analysis Associated with Global Significant Volcanic Eruptions During 2002–2017. Pure Appl. Geophys. 2019, 176, 3629–3647. [Google Scholar] [CrossRef]
  60. Piscini, A.; De Santis, A.; Marchetti, D.; Cianchini, G. A Multi-Parametric Climatological Approach to Study the 2016 Amatrice–Norcia (Central Italy) Earthquake Preparatory Phase. Pure Appl. Geophys. 2017, 174, 3673–3688. [Google Scholar] [CrossRef]
  61. Gelaro, R.; McCarty, W.; Suárez, M.J.; Todling, R.; Molod, A.; Takacs, L.; Randles, C.A.; Darmenov, A.; Bosilovich, M.G.; Reichle, R.; et al. The Modern-Era Retrospective Analysis for Research and Applications, Version 2 (MERRA-2). J. Clim. 2017, 30, 5419–5454. [Google Scholar] [CrossRef]
  62. Akhoondzadeh, M.; De Santis, A.; Marchetti, D.; Shen, X. Swarm-TEC Satellite Measurements as a Potential Earthquake Precursor Together With Other Swarm and CSES Data: The Case of Mw7.6 2019 Papua New Guinea Seismic Event. Front. Earth Sci. 2022, 10, 820189. [Google Scholar] [CrossRef]
  63. Akhoondzadeh, M.; Marchetti, D. Developing a Fuzzy Inference System Based on Multi-Sensor Data to Predict Powerful Earthquake Parameters. Remote Sens. 2022, 14, 3203. [Google Scholar] [CrossRef]
  64. De Santis, A.; Balasis, G.; Pavón-Carrasco, F.J.; Cianchini, G.; Mandea, M. Potential Earthquake Precursory Pattern from Space: The 2015 Nepal Event as Seen by Magnetic Swarm Satellites. Earth Planet. Sci. Lett. 2017, 461, 119–126. [Google Scholar] [CrossRef] [Green Version]
  65. De Santis, A.; Marchetti, D.; Spogli, L.; Cianchini, G.; Pavón-Carrasco, F.J.; Franceschi, G.D.; Di Giovambattista, R.; Perrone, L.; Qamili, E.; Cesaroni, C.; et al. Magnetic Field and Electron Density Data Analysis from Swarm Satellites Searching for Ionospheric Effects by Great Earthquakes: 12 Case Studies from 2014 to 2016. Atmosphere 2019, 10, 371. [Google Scholar] [CrossRef] [Green Version]
  66. Wiemer, S. A Software Package to Analyze Seismicity: ZMAP. Seismol. Res. Lett. 2001, 72, 373–382. [Google Scholar] [CrossRef]
  67. Marchetti, D.; Zhu, K.; Marchetti, L.; Zhang, Y.; Chen, W.; Cheng, Y.; Fan, M.; Wang, S.; Wang, T.; Wen, J.; et al. Quick Report on the ML = 3.3 on 1 January 2023 Guidonia (Rome, Italy) Earthquake: Evidence of a Seismic Acceleration. Remote Sens. 2023, 15, 942. [Google Scholar] [CrossRef]
  68. D’Arcangelo, S.; Martín-Hernández, F.; Parés, J.M. Magnetic Properties of Cave Sediments at Gran Dolina Site in Sierra de Atapuerca (Burgos, Spain). Quat. Int. 2021, 583, 1–13. [Google Scholar] [CrossRef]
  69. Marchetti, D.; Zhu, K.; Yan, R.; Zhima, Z.; Shen, X.; Chen, W.; Cheng, Y.; Fan, M.; Wang, T.; Wen, J.; et al. Ionospheric Effects of Natural Hazards in Geophysics: From Single Examples to Statistical Studies Applied to M5.5+ Earthquakes. Proceedings 2023, 87, 34. [Google Scholar] [CrossRef]
  70. Pinheiro, K.J.; Jackson, A.; Finlay, C.C. Measurements and Uncertainties of the Occurrence Time of the 1969, 1978, 1991, and 1999 Geomagnetic Jerks. Geochem. Geophys. Geosyst. 2011, 12, Q10015. [Google Scholar] [CrossRef]
  71. Yu, T.; Mao, T.; Wang, Y.; Wang, J. Study of the Ionospheric Anomaly before the Wenchuan Earthquake. Chin. Sci. Bull. 2009, 54, 1080–1086. [Google Scholar] [CrossRef] [Green Version]
  72. Zhang, X.; Ding, J.; Shen, X.; Wang, M.; Liu, J.; Yu, S.; Wang, Y.; Ouyang, X. Electromagnetic perturbations before Wenchuan M8 earthquake and stereo electromagnetic observation system. Chin. J. Radio Sci. 2009, 24, 1–8. [Google Scholar] [CrossRef]
  73. Zhang, X.; Ding, J.; Shen, X.; Ouyang, X.; Huang, J.; Zeren, Z.; Zhao, S.; Liu, J. The Analysis on the Electromagnetic Anomalies before Wenchuan from Ground and Satellite Data. In Proceedings of the International Disaster and Risk Conference, Chengdu, China, 13–15 July 2009; pp. 399–403. [Google Scholar]
  74. Sarkar, S.; Gwal, A.K. Satellite Monitoring of Anomalous Effects in the Ionosphere Related to the Great Wenchuan Earthquake of May 12 2008. Nat. Hazards 2010, 55, 321–332. [Google Scholar] [CrossRef]
  75. Li, M.; Parrot, M. Statistical Analysis of the Ionospheric Ion Density Recorded by DEMETER in the Epicenter Areas of Earthquakes as Well as in Their Magnetically Conjugate Point Areas. Adv. Space Res. 2018, 61, 974–984. [Google Scholar] [CrossRef]
  76. Ruzhin, Y.Y.; Sorokin, V.M.; Yashchenko, A.K. Physical Mechanism of Ionospheric Total Electron Content Perturbations over a Seismoactive Region. Geomagn. Aeron. 2014, 54, 337–346. [Google Scholar] [CrossRef]
  77. Hayakawa, M. Earthquake Prediction with Electromagnetic Phenomena. AIP Conf. Proc. 2016, 1709, 020002. [Google Scholar]
  78. Marchetti, D.; De Santis, A.; Jin, S.; Campuzano, S.A.; Cianchini, G.; Piscini, A. Co-Seismic Magnetic Field Perturbations Detected by Swarm Three-Satellite Constellation. Remote Sens. 2020, 12, 1166. [Google Scholar] [CrossRef] [Green Version]
  79. Grayver, A.V.; Olsen, N. The Magnetic Signatures of the M2, N2, and O1 Oceanic Tides Observed in Swarm and CHAMP Satellite Magnetic Data. Geophys. Res. Lett. 2019, 46, 4230–4238. [Google Scholar] [CrossRef] [Green Version]
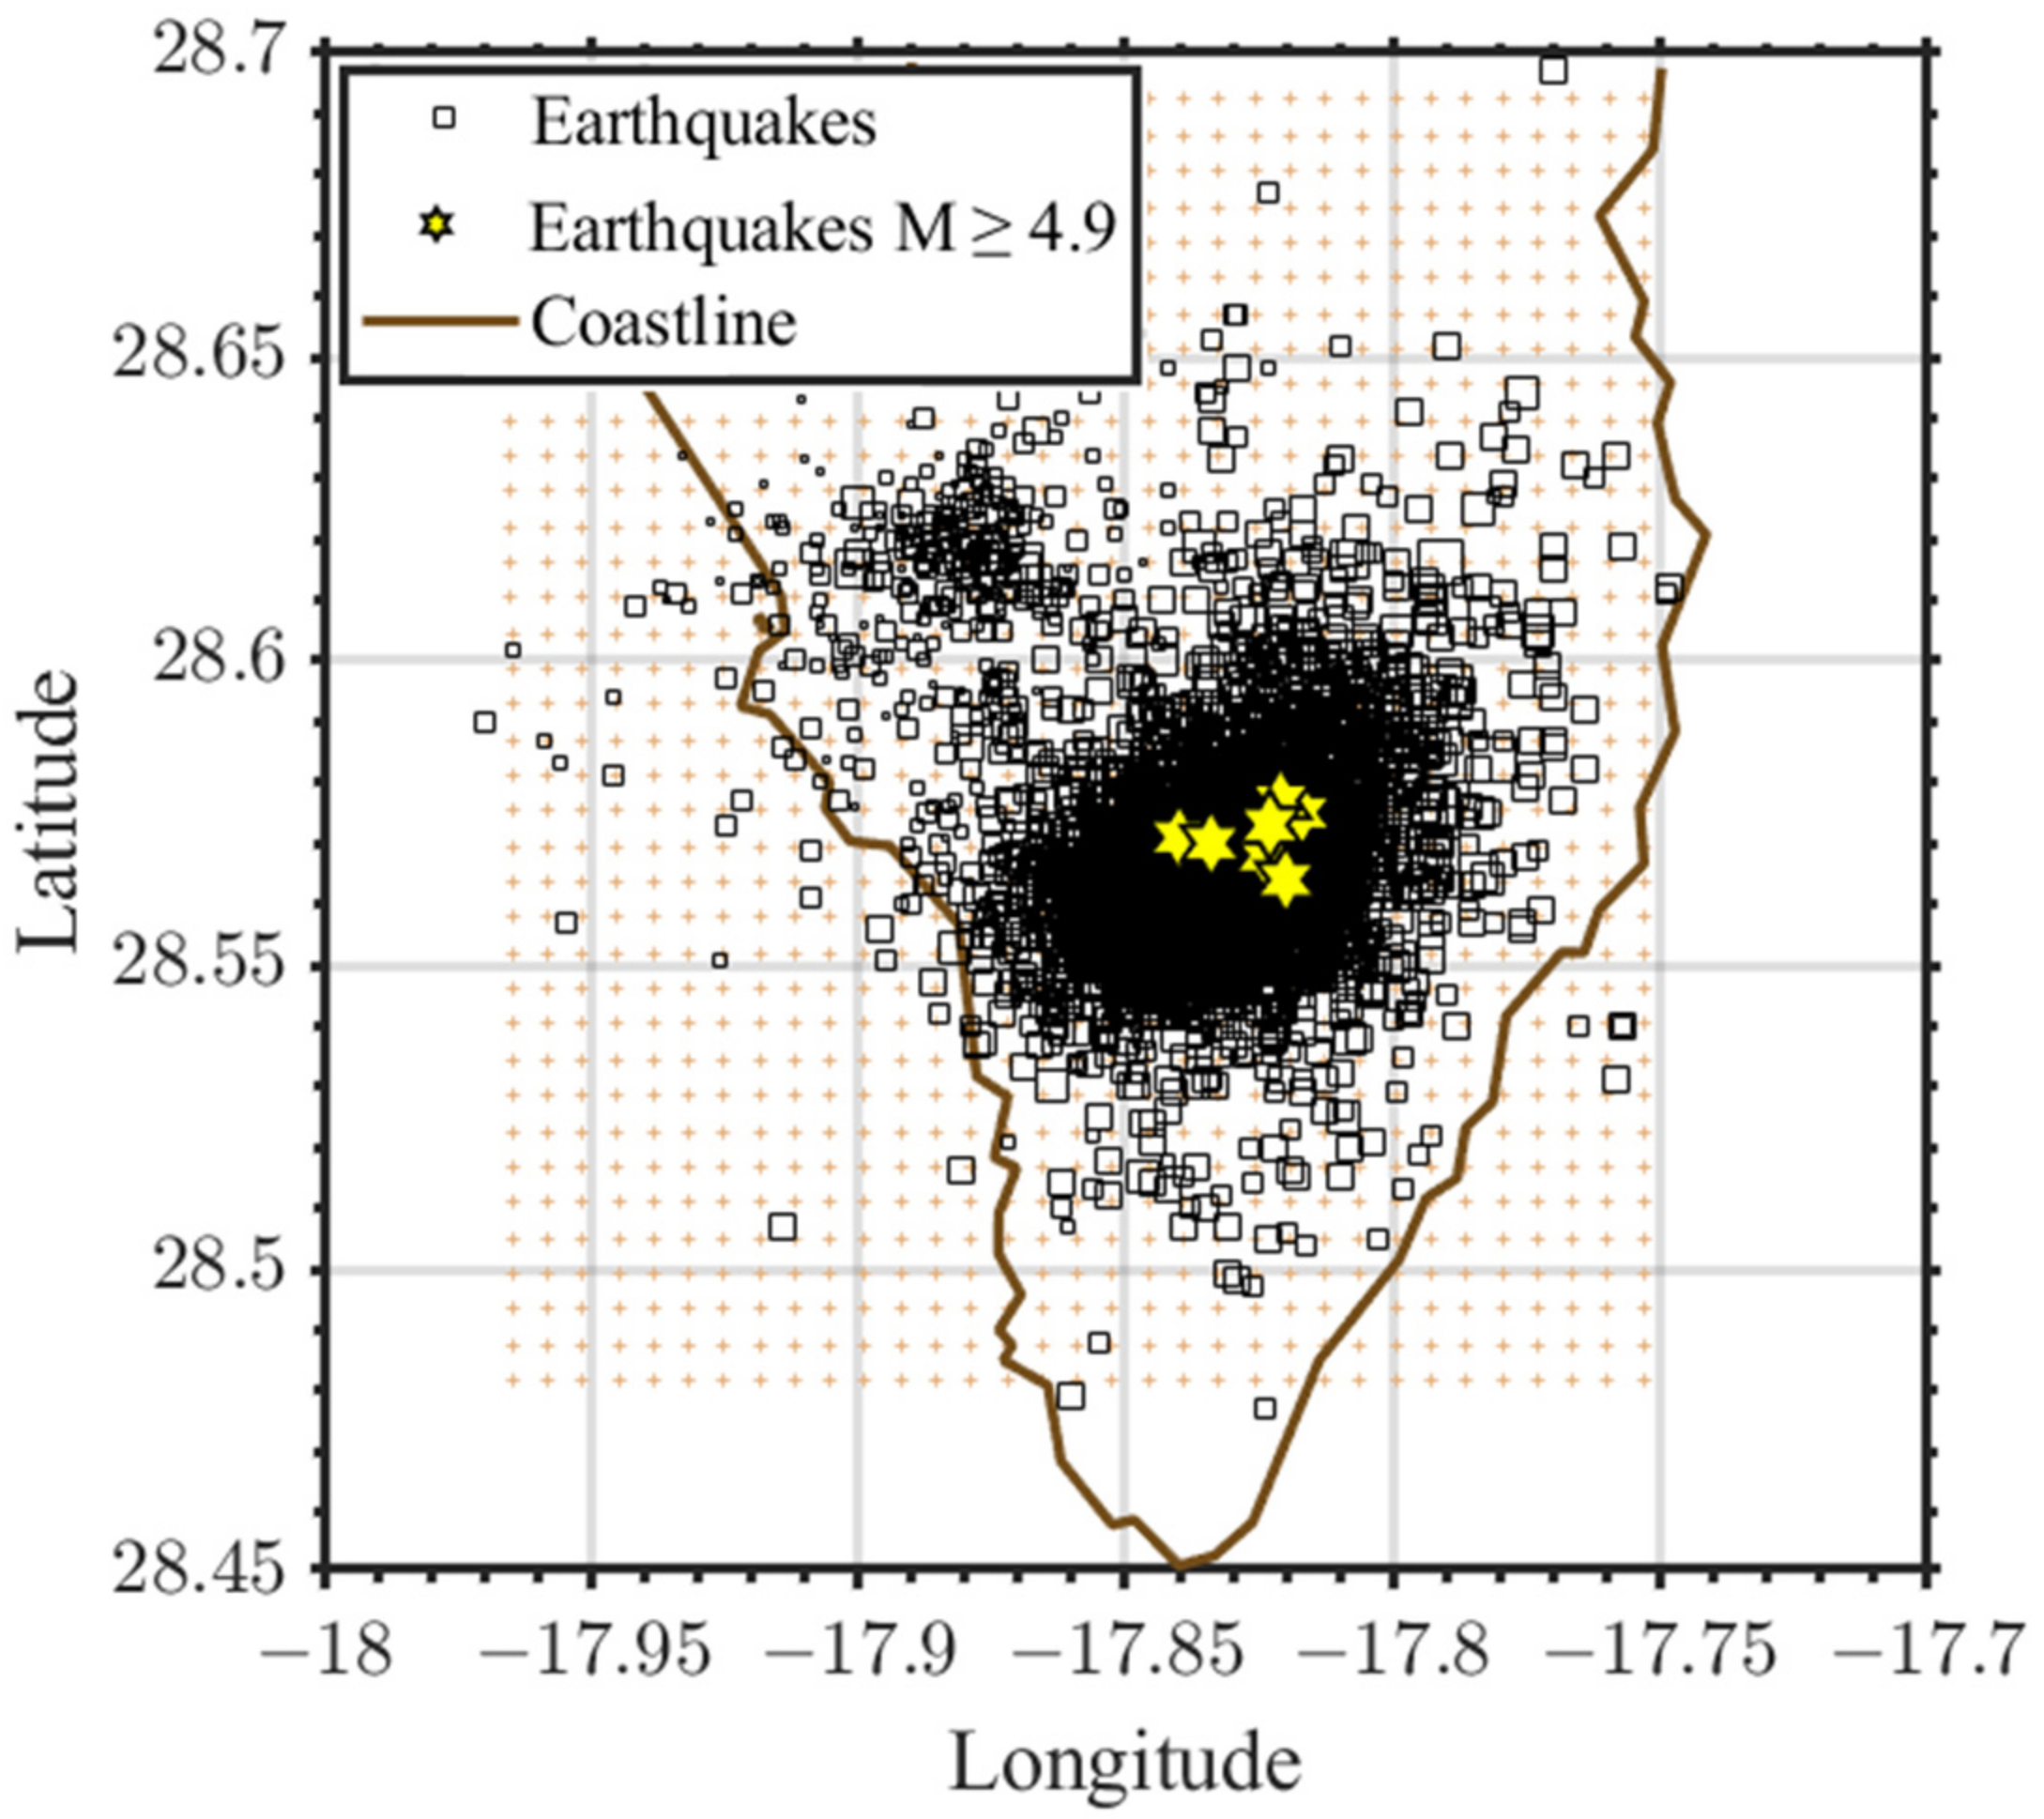
Figure 1. Map of the localisation of the earthquakes from 19 September 2021 until 31 December 2021 in La Palma Island.
Atmosphere 14 01198 g001
Figure 2. Earthquake depth versus origin time. The colour and size of each dot represents the earthquake magnitude.
Atmosphere 14 01198 g002
Figure 3. Temperature vertical profile in Kelvin (black solid curve) with 3rd order polynomial fitted value (red dashed curve), perturbation temperature Tp (solid black curve) around reference level (blue dashed line), Brunt Vaisala Frequency N2 in rad/S2, calculated potential energy Ep in J/kg, and threshold Ep (The orange dotted line is the mean of previous years, and the purple dotted line is the mean plus two standard deviations) from 30 to 50 km on 19 September 2021, 21 September 2021 and 25 September 2021.
Atmosphere 14 01198 g003
Figure 4. Distribution maps of AOT on 19 September 2021, 21 September 2021 and 25 September 2021. The blue line indicates coastline.
Atmosphere 14 01198 g004
Figure 5. Temperature vertical profile in Kelvin (black solid curve) with 3rd order polynomial fitted value (red dashed curve), perturbation temperature Tp (solid black curve) around reference level (blue dashed line), Brunt Vaisala Frequency N2 in rad/S2, calculated potential energy Ep in J/kg, and threshold Ep (The orange dotted line is the mean of previous years, and the purple dotted line is the mean plus two standard deviations) from 30 to 50 km on 9 October 2021, 20 October 2021 and 24 October 2021.
Atmosphere 14 01198 g005
Figure 6. Distribution maps of AOT on 9 October 2021, 20 October 2021 and 24 October 2021. The blue line indicates the coastline.
Atmosphere 14 01198 g006
Figure 7. Temperature vertical profile in Kelvin (black solid curve) with 3rd order polynomial fitted value (red dashed curve), perturbation temperature Tp (solid black curve) around reference level (blue dashed line), Brunt Vaisala Frequency N2 in rad/S2, calculated potential energy Ep in J/kg, and threshold Ep (The orange dotted line is the mean of previous years, and the purple dotted line is the mean plus two standard deviations) from 30 to 50 km on 2 November 2021, 10 November 2021 and 13 November 2021.
Atmosphere 14 01198 g007
Figure 8. Distribution maps of AOT on 2 November 2021, 10 November 2021 and 13 November 2021. The blue line indicates the coastline.
Atmosphere 14 01198 g008
Figure 9. Variations over time of maximum value and extension area (half-maximum area) of Aerosol, SO2 and CO were recorded in the studied region. Time series are plotted from 19 September to 31 December 2021. The time series of the estimation of the area of the plume is performed only during the eruption, i.e., from 19 September to 13 December 2021.
Atmosphere 14 01198 g009
Figure 10. Map of the interpolated maximum value of Aerosol, SO2 and CO. The time of acquisition of the data is represented with colour. The blue line indicates the coastline.
Atmosphere 14 01198 g010
Figure 11. Time series of aerosol from 19 September to 31 December 2021 compared with historical time series. The years of 1980 and 1987 have been automatically excluded for the presence of outliers in the original data.
Atmosphere 14 01198 g011
Figure 12. Time series of SO2 from 19 September to 31 December 2021 compared with historical time series.
Atmosphere 14 01198 g012
Figure 13. Time series of CO from 19 September to 31 December 2021 compared with historical time series.
Atmosphere 14 01198 g013
Figure 14. Swarm Alpha magnetic data was acquired on 19 September 2021 at 22:41 UT (centre of the shown track) for X-North, Y-East, and Z-center components and F, the scalar intensity of geomagnetic field residuals. In the map, the green star represents the position of La Palma volcano and the brown line is the ground projection of satellite orbit. The red line underlines the section of the Swarm magnetic track, which is identified as anomalous by the MASS algorithm.
Atmosphere 14 01198 g014
Figure 15. Swarm Bravo magnetic data acquired on 21 September 2021 at 22:34 UT (center of the shown track) for X-North, Y-East, Z-center components and F the scalar intensity of geomagnetic field residuals. In the map, the green star represents the position of La Palma volcano and the brown line is the ground projection of satellite orbit (the red section indicates some unusual data quality flags). The red line underlines the section of the Swarm magnetic track, which is identified as anomalous by the MASS algorithm. More investigations of this track are provided in Appendix B.
Atmosphere 14 01198 g015
Figure 16. Swarm Bravo magnetic data was acquired on 28 September 2021 above Las Canarias Archipelagos. A green star marked the position of the volcano. X (North), Y (East) and Z (centre) components were measured by VFM, while F was measured by ASM payloads. In the map, the green star represents the position of La Palma volcano and the brown line is the ground projection of satellite orbit (red section indicates some unusual data quality flags). The red line underlines the section of the Swarm magnetic track, which is identified as anomalous by the MASS algorithm.
Atmosphere 14 01198 g016
Figure 17. Possible mechanisms of lithosphere atmosphere and ionosphere Coupling (LAIC) in the occasion of volcano eruption. The image has been readapted from Marchetti et al. [5] and shows a chemical-physical channel (A), electromagnetic channel (B) or Acoustic Gravity Wave AGW (C) channel.
Atmosphere 14 01198 g017
Table 1. List of days with abnormal vertical temperature profiles. For each day, temperatures are screened for anomalies based on mean and standard deviation and distance from the atmospheric anomalies.
DayEpSwarm Mag, Sat ASwarm Mag, Sat BSwarm Mag, Sat CAOT 1SO2 1CO 1
19 September 202120:39Track: 31 Time: 21:42\Track:31 Time: 22:4127.5°, −19.375°27.5°, −19.375°27.5°, −19.375°
21 September 202106:15\Track: 30 Time: 22:34\27.5°, −18.75°28.5°, −18.125°\
25 September 202105:25, 05:27\\\\28°, −18.75°28°, −21.25°
27 September 202118:59\\\\\27, −19.375
28 September 2021\\Track: 29 Time: 21:49\27°, −20.625°26.5°, −21.25°26.5°, −20.625°
1 October 202118:17\\\27°, −19.375°26.5°, −19.375°27°, −19.375°
9 October 202116:37\\\27.5°, −18.75°27°, −19.375°27°, −19.375°
20 October 202100:51\\\27.5°, −20.625°27.5°, −20.625°27.5°, −19.375°
24 October 202123:37\\\28°, −18.75°28°, −18.75°27.5°, −18.75°
2 November 202108:32\\\28°, −18.75°28°, −18.125°28°, −18.75°
10 November 202106:56, 06:58\\\28°, −19.375°28°, −19.375°\
13 November 202122:43\\\28°, −18.75°28°, −18.75°28°, −18.75°
14 November 202106:07\\\28°, −18.75°28°, −18.75°28°, −18.75°
22 November 202104:31\\\28.5°, −18.125°28.5°, −18.125°28.5°, −18.125°
25 November 202120:20\\\29.5°, −19.375°\29°, −18.75°
26 November 202103:43\\\26.5°, −20.625°26.5°, −20.625°26.5°, −20.625°
27 November 202103:56\\\27°, −19.375°26.5°, −19.375°26.5°, −19.375°
29 November 202119:34Track: 22 Time: 16:24\Track: 22 Time: 16:2327.5°, −19.375°27°, −20°27°, −20°
1 December 202103:09\\\\27.5°, −19.375°27.5°, −19.375°
19 December 202122:25\\\\29.5°, −15.625°30°, −16.25°
23 December 202111:42\\\\28.5°, −16.25°28.5°, −16.25°
27 December 202110:52\\\\28.5°, −16.875°26.5°, −20.625°
1 The reported coordinates refer to the latitude and longitude of the maximum value in the distribution map of each atmospheric parameter on the specific day.
Disclaimer/Publisher’s Note: The statements, opinions and data contained in all publications are solely those of the individual author(s) and contributor(s) and not of MDPI and/or the editor(s). MDPI and/or the editor(s) disclaim responsibility for any injury to people or property resulting from any ideas, methods, instructions or products referred to in the content.