Article

Genome-Wide Identification and Expression Pattern Analysis of the Late Embryogenesis Abundant (LEA) Family in Foxtail Millet (Setaria italica L.)

1
College of Life Sciences, Shanxi Agricultural University, Jinzhong 030800, China
2
Houji Laboratory in Shanxi Province, Taiyuan 030031, China
3
College of Agriculture, Shanxi Agricultural University, Jinzhong 030800, China
*
Authors to whom correspondence should be addressed.
These authors contributed equally to this work.
Genes 2025, 16(8), 932; https://doi.org/10.3390/genes16080932 (registering DOI)
Submission received: 14 July 2025 / Revised: 28 July 2025 / Accepted: 31 July 2025 / Published: 4 August 2025
(This article belongs to the Section Plant Genetics and Genomics)

Abstract

Background/Objectives: Late embryogenesis abundant (LEA) proteins regulate stress responses and contribute significantly to plant stress tolerance. As a model species for stress resistance studies, foxtail millet (Setaria italica) lacks comprehensive characterization of its LEA gene family. This study aimed to comprehensively identify SiLEA genes in foxtail millet and elucidate their functional roles and tissue-specific expression patterns. Methods: Genome-wide identification of SiLEA genes was conducted, followed by phylogenetic reconstruction, cis-acting element analysis of promoters, synteny analysis, and expression profiling. Results: Ninety-four SiLEA genes were identified and classified into nine structurally distinct subfamilies, which are unevenly distributed across all nine chromosomes. Phylogenetic analysis showed closer clustering of SiLEA genes with sorghum and rice orthologs than with Arabidopsis thaliana AtLEA genes. Synteny analysis indicated the LEA gene family expansion through tandem and segmental duplication. Promoter cis-element analysis linked SiLEA genes to plant growth regulation, stress responses, and hormone signaling. Transcriptome analysis revealed tissue-specific expression patterns among SiLEA members, while RT-qPCR verified ABA-induced transcriptional regulation of SiLEA genes. Conclusions: This study identified 94 SiLEA genes grouped into nine subfamilies with distinct spatial expression profiles. ABA treatment notably upregulated SiASR-2, SiASR-5, and SiASR-6 in both shoots and roots.

1. Introduction

Plants activate specific response programs under abiotic stress, enhancing stress resistance through the production of protective proteins that preserve cellular homeostasis [1,2]. Among these, late embryogenesis abundant (LEA) proteins show marked stress-inducible expression, making them prominent subjects in plant stress research [3]. Although their roles have been thoroughly characterized in model plants such as Arabidopsis [4], sorghum (Sorghum bicolor) [5], rice (Oryza sativa) [6], and wheat (Triticum aestivum) [7], LEA proteins also occur in fungi, bacteria, and metazoans [8]. Unlike typical proteins that follow the “sequence-structure-function” paradigm, LEA proteins often lack stable tertiary structures and belong to the intrinsically disordered protein class [9].
The LEA family includes numerous members, and its taxonomic classification has been revised several times. Early nomenclature assigned LEA family members with a capital “D” followed by numerals, such as D-19 and D-29 [10]. Based on conserved motif divergence in LEA protein sequences, these proteins are classified into six subfamilies [11]. After the establishment of the Late Embryogenesis Abundant Proteins Database (LEAPdb), the classification expanded to eight subfamilies according to PFAM conserved domain architecture [12], namely LEA_1 (PF03760), LEA_2 (PF03168), LEA_3 (PF03242), LEA_4 (PF02987), LEA_5 (PF00477), LEA_6/PvLEA18 (PF10714), Dehydrin (PF00257), and SMP (Seed maturation protein, PF04927). ASR (abscisic acid, stress, and ripening-induced) proteins constitute a distinct subgroup of plant LEA proteins. These genes show coordinated expression with canonical LEA genes and encode intrinsically disordered proteins with physicochemical similarities to LEA proteins. Thus, ASR proteins are classified as the LEA_7 subfamily, extending the LEA classification to nine subfamilies [13]. Two additional proteins without PFAM domain classification were identified as members of the AtM subgroup in the Arabidopsis LEA gene family [3].
LEA family members play crucial roles in plant adaptation to abiotic stresses. In Arabidopsis, numerous AtLEA genes show strong induction under stress conditions. Mutational studies reveal that Atlea4 loss-of-function mutants exhibit increased drought sensitivity [14], whereas AtLEA5 regulates antioxidant defense systems [15]. Salt stress markedly upregulates AtLEA14 expression, and both transgenic Arabidopsis and heterologous yeast systems overexpressing this gene demonstrate improved salinity tolerance [16]. AtLEA4-5 transcription increases under salt or osmotic stress, confirming its role in drought tolerance mechanisms [17]. Transgenic rice and wheat expressing barley (Hordeum vulgare) HVA1 (LEA_3 subfamily) show improved water-use efficiency under drought conditions [18,19]. Similarly, rice overexpressing OsEm1 (LEA_1) or OsLEA5 (LEA_2) exhibits enhanced drought and salt tolerance [20,21]. Drought stress substantially elevates ZmLEA34 expression in maize (Zea mays), while ZmNHL1 overexpression improves drought resistance by enhancing ROS scavenging and maintaining membrane integrity [22,23]. Foxtail millet SiLEA14 responds to osmotic stress, NaCl, and exogenous ABA; its heterologous expression in Arabidopsis improves seedling stress tolerance, and overexpressing foxtail millet lines show better physiological performance under salt and drought conditions [24]. In cotton (Gossypium hirsutum), GhLEA-5A/D may positively regulate salt stress responses [25]. GhLEA3 knockout increases sensitivity to salinity and drought while reducing ABA/stress-responsive gene expression, whereas overexpression enhances stress tolerance [26]. Tobacco (Nicotiana tabacum) expressing kenaf (Hibiscus cannabinus) HcLEA113 gains drought resilience, while its silencing impairs growth under drought [27]. Pepper (Capsicum annuum) CaLEA1 modulates drought and salt tolerance via ABA signaling, with overexpressing lines showing ABA-hypersensitive germination, improved stomatal regulation, and upregulated stress genes [28]. Medicago sativa with MsLEA1 overexpression gains drought and aluminum tolerance, while silencing reduces stress resilience [29]. Soybean (Glycine max) GmLEA4_19 expression in Arabidopsis increases plant height under drought, and transgenic soybean lines show enhanced drought tolerance [30]. Brassica campestris BcLEA73 improves root elongation, germination under stress, and drought survival in Arabidopsis [31]. Rosa chinensis RcLEA enhances growth recovery after temperature extremes [32]. Medicago truncatula MtPM25 prevents stress-induced protein aggregation and dissolves existing aggregates via chaperone activity [33]. MsLEA69 from M. sativa increases osmotic and temperature tolerance in prokaryotic and eukaryotic systems by elevating stress enzyme activity [34]. Brassica napus with BnaA.LEA6.a overexpression shows greater freezing resistance [35], while Pinus tabuliformis PtLEA22 improves freezing tolerance when expressed in Arabidopsis [36].
Foxtail millet (S. italica), an annual C4 herbaceous plant in the Poaceae family, is both a traditional Chinese crop [37] and a promising model organism owing to its drought tolerance, adaptability to poor soils, storage stability, compact genome, and experimental convenience [38,39]. However, the LEA gene family in foxtail millet has not been thoroughly studied. Here, we identify all SiLEA family members and analyze their chromosomal locations, phylogenetic relationships, conserved domains, gene structures, promoter cis-elements, collinearity patterns, and expression profiles. We also examine the ABA-responsive expression patterns of SiLEA genes, providing foundational insights into their functional roles in this species.

2. Materials and Methods

2.1. Identification and Chromosomal Localization Analysis of SiLEA Gene Family Members in Foxtail Millet

Foxtail millet genomic resources—whole-genome sequences, CDS annotations, .gff structural annotation files, and complete proteome amino acid sequences—were obtained from Multi-omics Database for S. italica (MDSi, http://foxtail-millet.biocloud.net, accessed on 20 October 2023) [40]. The Hidden Markov Model (HMM) profile for LEA protein domains was acquired from the Pfam database (http://pfam-legacy.xfam.org/, accessed on 27 October 2023). We identified candidate SiLEA family genes by performing an HMMER scan (E-value ≤ 1 × 10⁻⁵) against the S. italica reference proteome (v2.2) (https://www.ebi.ac.uk/interpro/entry/pfam, accessed on 27 October 2023). The amino acid sequences from rice [6], Arabidopsis [3], and sorghum [5] were aligned with their foxtail millet counterparts using TBtools(v2.322)’ BLAST function [41], with candidate genes for the SiLEA family selected based on an E-value threshold of <0.001. After identifying SiLEA gene family members through Venn diagram analysis of gene counts obtained by both methods, we mapped their chromosomal locations using the foxtail millet .gff annotation file and visualized the results with TBtools (v2.322)’ Graphics function [41].

2.2. Physicochemical Properties of SiLEA Gene Family Members in Foxtail Millet

The amino acid composition and physicochemical properties of the SiLEA gene family were characterized using ExPaSy ProtParam (http://web.expasy.org/protparam, accessed on 21 March 2024). Subcellular localization predictions were performed with PSORT (http://psort1.hgc.jp/form.html, accessed on 10 April 2024).

2.3. Phylogenetic Analysis of Foxtail Millet SiLEA Gene Family Members

We aligned LEA amino acid sequences from foxtail millet, rice [6], Arabidopsis [3], and sorghum [5] using ClustalW and constructed a phylogenetic tree with the Neighbor-Joining (NJ) approach in MEGA 11.0 [42]. The phylogenetic tree was further annotated and visualized using the iTOL online tool (https://itol.embl.de/, accessed on 10 April 2024).

2.4. Conserved Domain and Gene Structure Analysis of Foxtail Millet SiLEA Genes

The NCBI-CDD Batch CD-Search tool (https://www.ncbi.nlm.nih.gov/Structure/bwrpsb/bwrpsb.cgi, accessed on 18 April 2024) identified conserved domains in the SiLEA protein sequences, which were then visualized with TBtools (v2.322) software [41]. Gene structures were reconstructed using the TBtools (v2.322) Gene Structure View (Advanced) tool [41], incorporating the foxtail millet genome annotation (.gff) and corresponding gene IDs.

2.5. Analysis of SiLEA Gene Promoter Cis-Regulatory Elements in Foxtail Millet

We extracted the promoter sequences of SiLEA genes using TBtools (v2.322) [41]. The PlantCARE database (http://bioinformatics.psb.ugent.be/webtools/plantcare/html/, accessed on 26 April 2024) identified cis-regulatory elements, which were then visualized with TBtools (v2.322) [41].

2.6. Collinearity and Evolutionary Patterns of SiLEA Genes

Interspecies collinearity of LEA genes and intraspecies collinearity of SiLEA genes were analyzed using genome annotations and sequences from foxtail millet, rice [6], sorghum [5], and Arabidopsis [3] through TBtools (v2.322)’ One Step MCScanX-SuperFast tool [41]. Collinear gene pairs were also visualized using TBtools (v2.322) [41]. For foxtail millet segmental duplications, Ka, Ks, and Ka/Ks ratios were calculated with TBtools (v2.322)’ Simple Ka/Ks Calculator [41].

2.7. Tissue-Specific Expression Analysis of Foxtail Millet SiLEA Gene Family Members

Transcriptome data for SiLEA gene family members across multiple tissues and developmental stages were obtained from the MDSi [40]. The dataset comprised 3-day germinated seeds, seedlings at the two-leaf and one-heart stage, heading-stage leaves, roots/stems/leaf veins during grain filling, panicles at various developmental phases, and mature seeds. Expression heatmaps were generated using TBtools (v2.322) [41].
Root samples were collected from 9-day-old Yugu1 seedlings treated with 2 µM ABA and untreated controls (CK), grown in an artificial climate chamber under 30,000 lux light intensity with a 16 h photoperiod at 28 °C and an 8 h dark period at 22 °C. Jingu 21 young panicles were sampled at the branch meristem differentiation phase (young panicle stage 1, ~1.0–1.5 mm) and the distinct formation phase (young panicle stage 2, ~2.5–3.0 mm). All collected root and young panicle samples were immediately flash-frozen in liquid nitrogen and stored at −80 °C. Three biological replicates were analyzed per sample. Novogene Co., Ltd. (Beijing, China) performed RNA library preparation and subsequent high-throughput sequencing.

2.8. Expression Analysis of SiLEA Gene in Response to ABA in Different Tissues of Foxtail Millet by qRT-PCR

Foxtail millet seeds were rinsed with deionized water, surface-sterilized in 70% ethanol for 30 s, and then immersed in 5% NaClO for 20 min before a final rinse with deionized water. The sterilized seeds were evenly distributed on moist filter paper (three layers) in plate and incubated in darkness for 12 h before being transferred to a growth chamber under standard conditions. The 5-day-old seedlings showing uniform growth were transplanted into hydroponic boxes containing 2 μM ABA solution. Shoots and roots were collected at 0, 12, 24, and 48 h after ABA treatment, immediately flash-frozen in liquid nitrogen, and stored at −80 °C. Each treatment included three biological replicates.
Total RNA was extracted from −80 °C preserved root and leaf samples of ABA-treated seedlings. cDNA synthesis was performed using the UnionScript First-strand cDNA Synthesis Mix (with dsDNase) (Genesand Biotech Co., Ltd., Beijing, China) for Real-time Quantitative Polymerase Chain Reaction (RT-qPCR), and the resulting cDNA was stored at −20 °C. Gene-specific primers for SiLEA genes (Table S1) were designed to amplify fragments of 80–200 bp. RT-qPCR was conducted on a Bio-Rad CFX 96 Real-Time PCR Detection System, with Si9g37480 serving as the internal control [38]. Three biological replicates, each with three technical replicates, were analyzed. Statistical significance was assessed using ANOVA (Analysis of Variance) in GraphPad Prism(v9.0.0), with results expressed as means ± SE.

3. Results

3.1. Identification, Physicochemical Characterization, and Chromosomal Localization of SiLEA Gene Family Members in Foxtail Millet

Initial HMMER analysis identified 119 candidate LEA family genes, which were reduced to 98 after Blastp screening. PFAM domain verification confirmed 94 genes with authentic LEA domains (Table 1, Figure 1). Based on conserved domains and PFAM classifications, these genes clustered into nine subfamilies, LEA_1–LEA_6/PvLEA18, ASR, Dehydrin and SMP (Table 1, Figure 1). The SiLEA_2 subfamily was the largest, encompassing 51 genes designated as SiLEA2-1 to SiLEA2-51 (Table 1, Figure 1). The SiLEA3, SiSMP, and SiASR subfamilies each contained eight genes, designated as SiLEA3-1 to SiLEA3-8, SiSMP-1 to SiSMP-8, and SiASR-1 to SiASR-8, respectively (Table 1, Figure 1). Seven genes formed the SiDehydrin subfamily (SiDehydrin1 to SiDehydrin7), while the SiLEA_1 subfamily contained five (SiLEA1-1 to SiLEA1-5) (Table 1, Figure 1). The SiLEA_4, SiLEA_5, and SiLEA_6 subfamilies comprised four, two, and one gene (s), respectively (Table 1, Figure 1).
Characterization of the physicochemical properties of the SiLEA gene family (Table 1) showed that these genes encode proteins with lengths varying between 90 (SiLEA3-1) and 641 (SiLEA2-40) amino acids. The corresponding molecular masses span from 9.41 KDa (SiLEA3-1) to 70.62 KDa (SiLEA2-40). The isoelectric points (pI) of these proteins range from 4.63 (SiSMP-4) to 11.98 (SiLEA3-2), with most exhibiting alkaline pI values. Subcellular localization predictions suggest predominant targeting to chloroplast (36%), cytoplasm (22%), and nuclei (18%). The majority of SiLEA proteins demonstrate characteristic hydrophilicity (Table 1).
Chromosomal localization analysis (Table 1, Figure 1) showed an uneven distribution of SiLEA gene family members across the nine chromosomes of foxtail millet. Chromosome 5 contained the highest concentration with 18 genes (19.15% of total), whereas chromosome 4 had only three members (3.19%). The remaining chromosomes displayed intermediate counts: 10 genes on chromosome (chr) 1; 12 on chr 2; 13 on chr 3; 6 on chr 6; 11 on chr 7; 7 on chr 8; and 14 on chr 9 (Table 1, Figure 1).

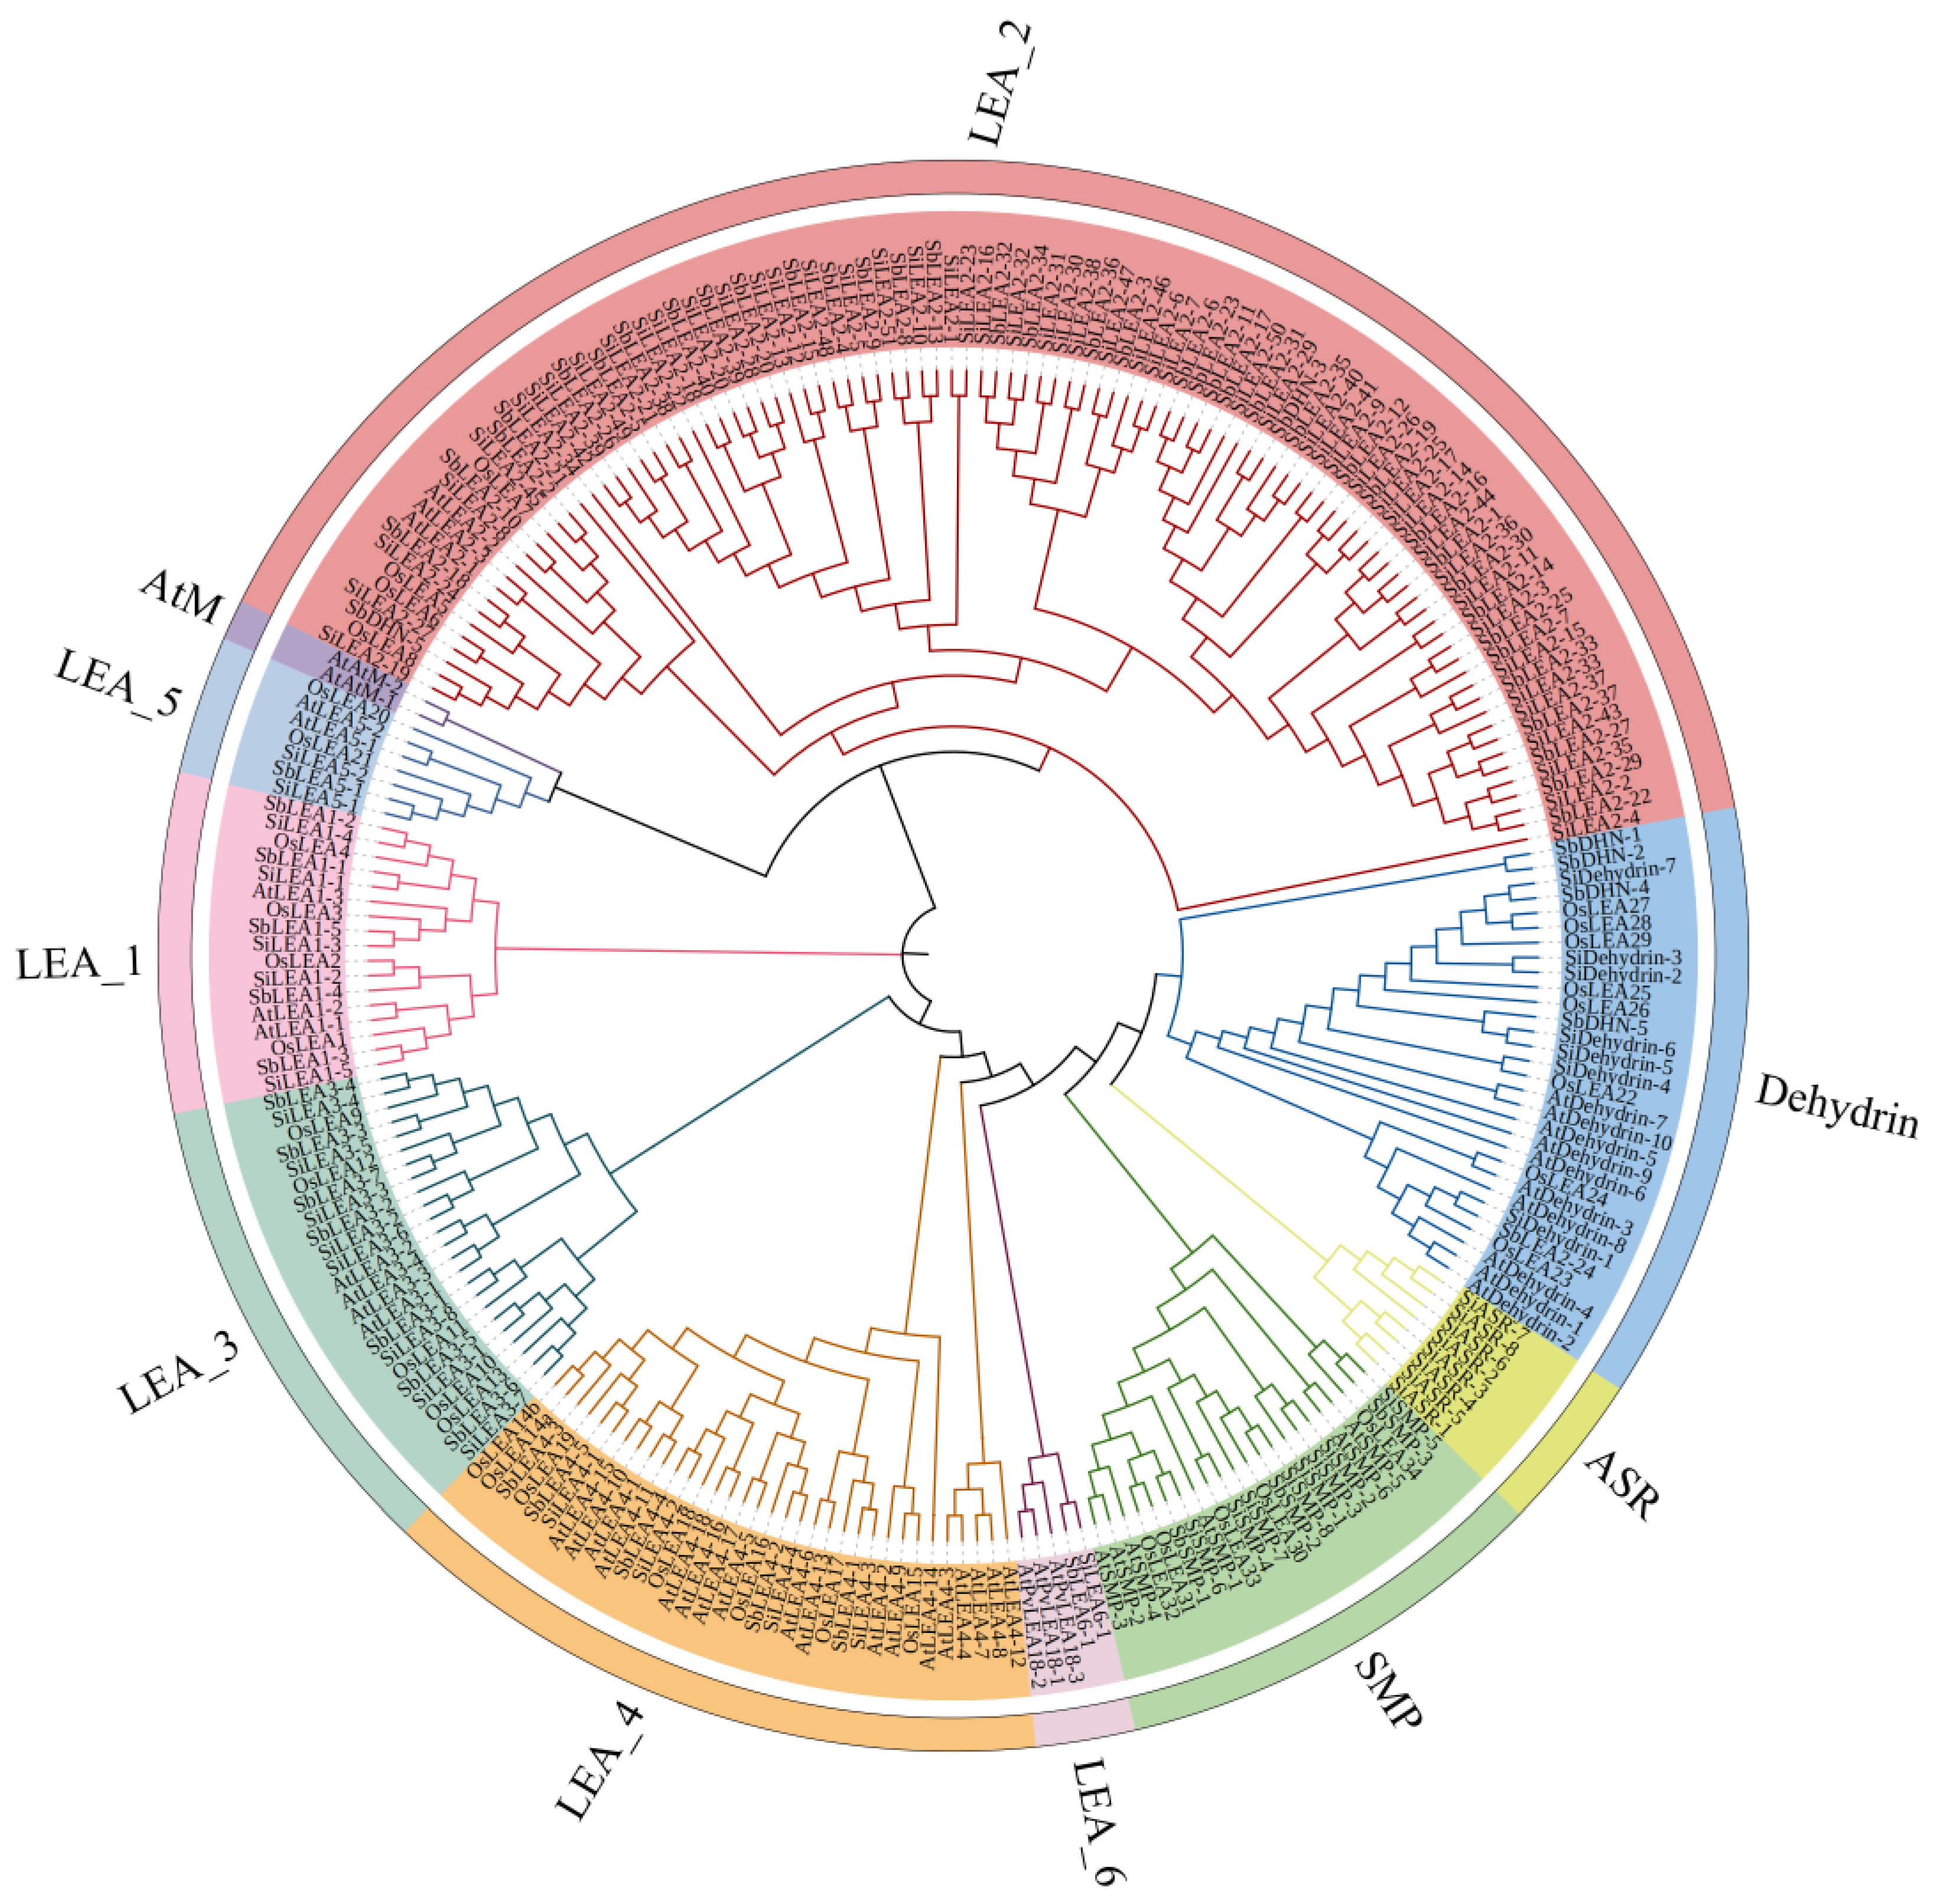
3.2. Phylogenetic Analysis of SiLEA Gene Family Members

Phylogenetic relationships among LEA gene family members were reconstructed using amino acid sequences of 246 LEA genes—including 94 SiLEA genes from foxtail millet, 34 OsLEA genes from rice, 67 SbLEA genes from sorghum, and 51 AtLEA genes from Arabidopsis—were subjected to multiple sequence alignment and phylogenetic tree construction (Table S2). The analysis grouped these genes into 10 distinct subfamilies, LEA_1—LEA_6/PvLEA18, ASR, Dehydrin, SMP, and AtM subfamilies (Figure 2). These subfamilies further segregated into three major clades: Clade I (LEA_2, LEA_5, AtM); Clade II (LEA_1); Clade III (LEA_3, LEA_4, LEA_6/PvLEA18, ASR, Dehydrin, SMP). Species-specific expansion patterns emerged, with foxtail millet and sorghum showing pronounced gene duplication in the LEA_2, while Arabidopsis exhibited higher representation in the LEA_4 and Dehydrin. Although most subfamilies formed well-defined clusters (e.g., LEA_3/LEA_4), exceptions were noted. SbDHN-3 and SbDHN-5 from sorghum Dehydrin nested within LEA_2, and SbLEA2-24 anomalously grouped with the Dehydrin, implying potential functional overlap or conserved structural features. The AtM and ASR subfamilies displayed lineage-specific divergence: Arabidopsis AtM genes (AtAtM, 2 members) formed an isolated branch, whereas foxtail millet ASR genes (SiASR, 8 members) clustered independently, indicating divergent functional specialization (Figure 2).

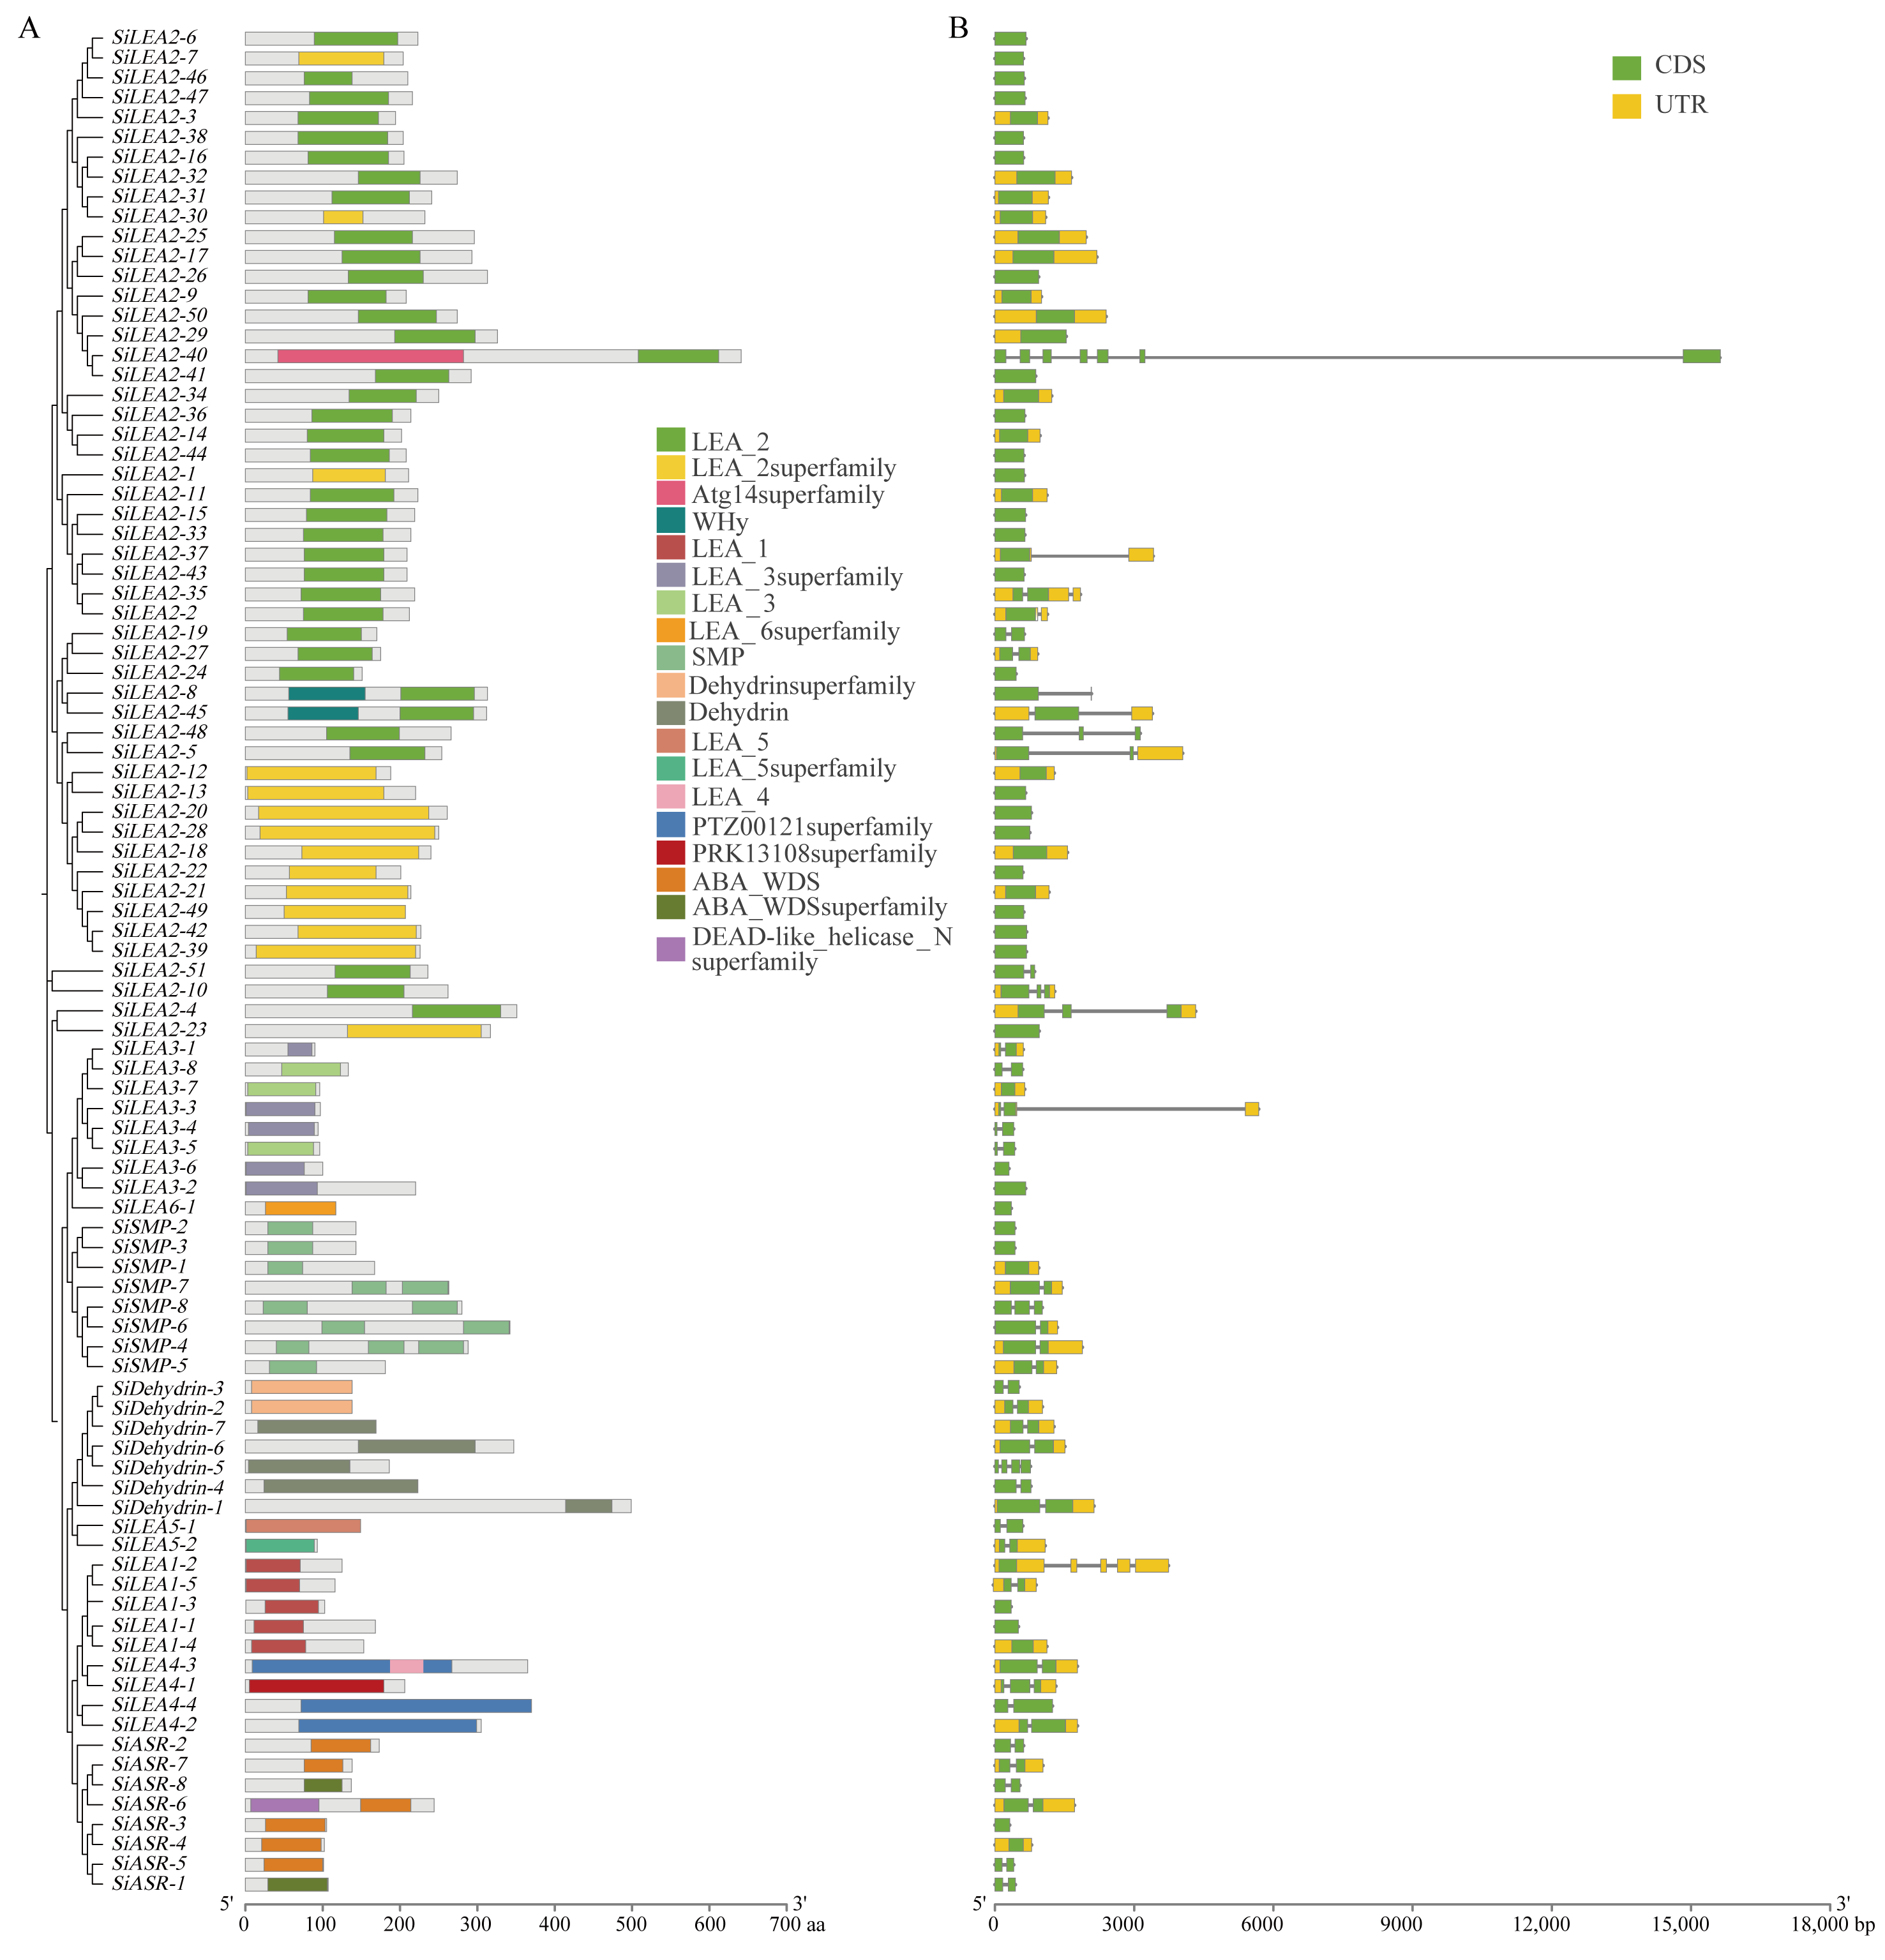
3.3. Conserved Domains and Gene Structures of SiLEA Genes in Foxtail Millet

Conserved domain analysis revealed that SiLEA genes encode proteins with characteristic subfamily-specific domains: LEA_1 for SiLEA_1, LEA_3/LEA_3 superfamily for SiLEA_3, LEA_5/LEA_5 superfamily for SiLEA_5, LEA_6 superfamily for SiLEA_6, SMP for SiSMP, and Dehydrin/Dehydrin superfamily for SiDehydrin (Figure 3A). The SiLEA_2 subfamily proteins all contain the core LEA_2 domain, though some members display additional domains—SiLEA2-40 protein carries an N-terminal Atg14 superfamily domain, while SiLEA2-8 and SiLEA2-45 proteins feature N-terminal WHy domains. In the SiLEA_4 subfamily, SiLEA4-3 protein contains both LEA4 and PTZ00121 superfamily domains; whereas SiLEA4-2 and SiLEA4-4 proteins possess only the PTZ00121 superfamily domain; SiLEA4-1 protein uniquely encodes a PRK13108 superfamily domain. All SiASR subfamily proteins contain the ABA_WDS domain, with SiASR-6 protein additionally harboring an N-terminal DEAD-like_helicase_N superfamily domain, demonstrating strong sequence conservation across the gene family (Figure 3A).
Further analysis of gene structures demonstrated that most SiLEA genes are split, with 46.81% being intronless (Figure 3B). Forty-nine genes completely lack both 5′- and 3′-UTRs, while 43 retain both UTR regions; exceptions include SiLEA2-29 (5’-UTR only) and SiSMP-6 (3’-UTR only). The number of exons ranges from 1 to 7, indicating considerable structural and functional divergence among SiLEA family members (Figure 3B).

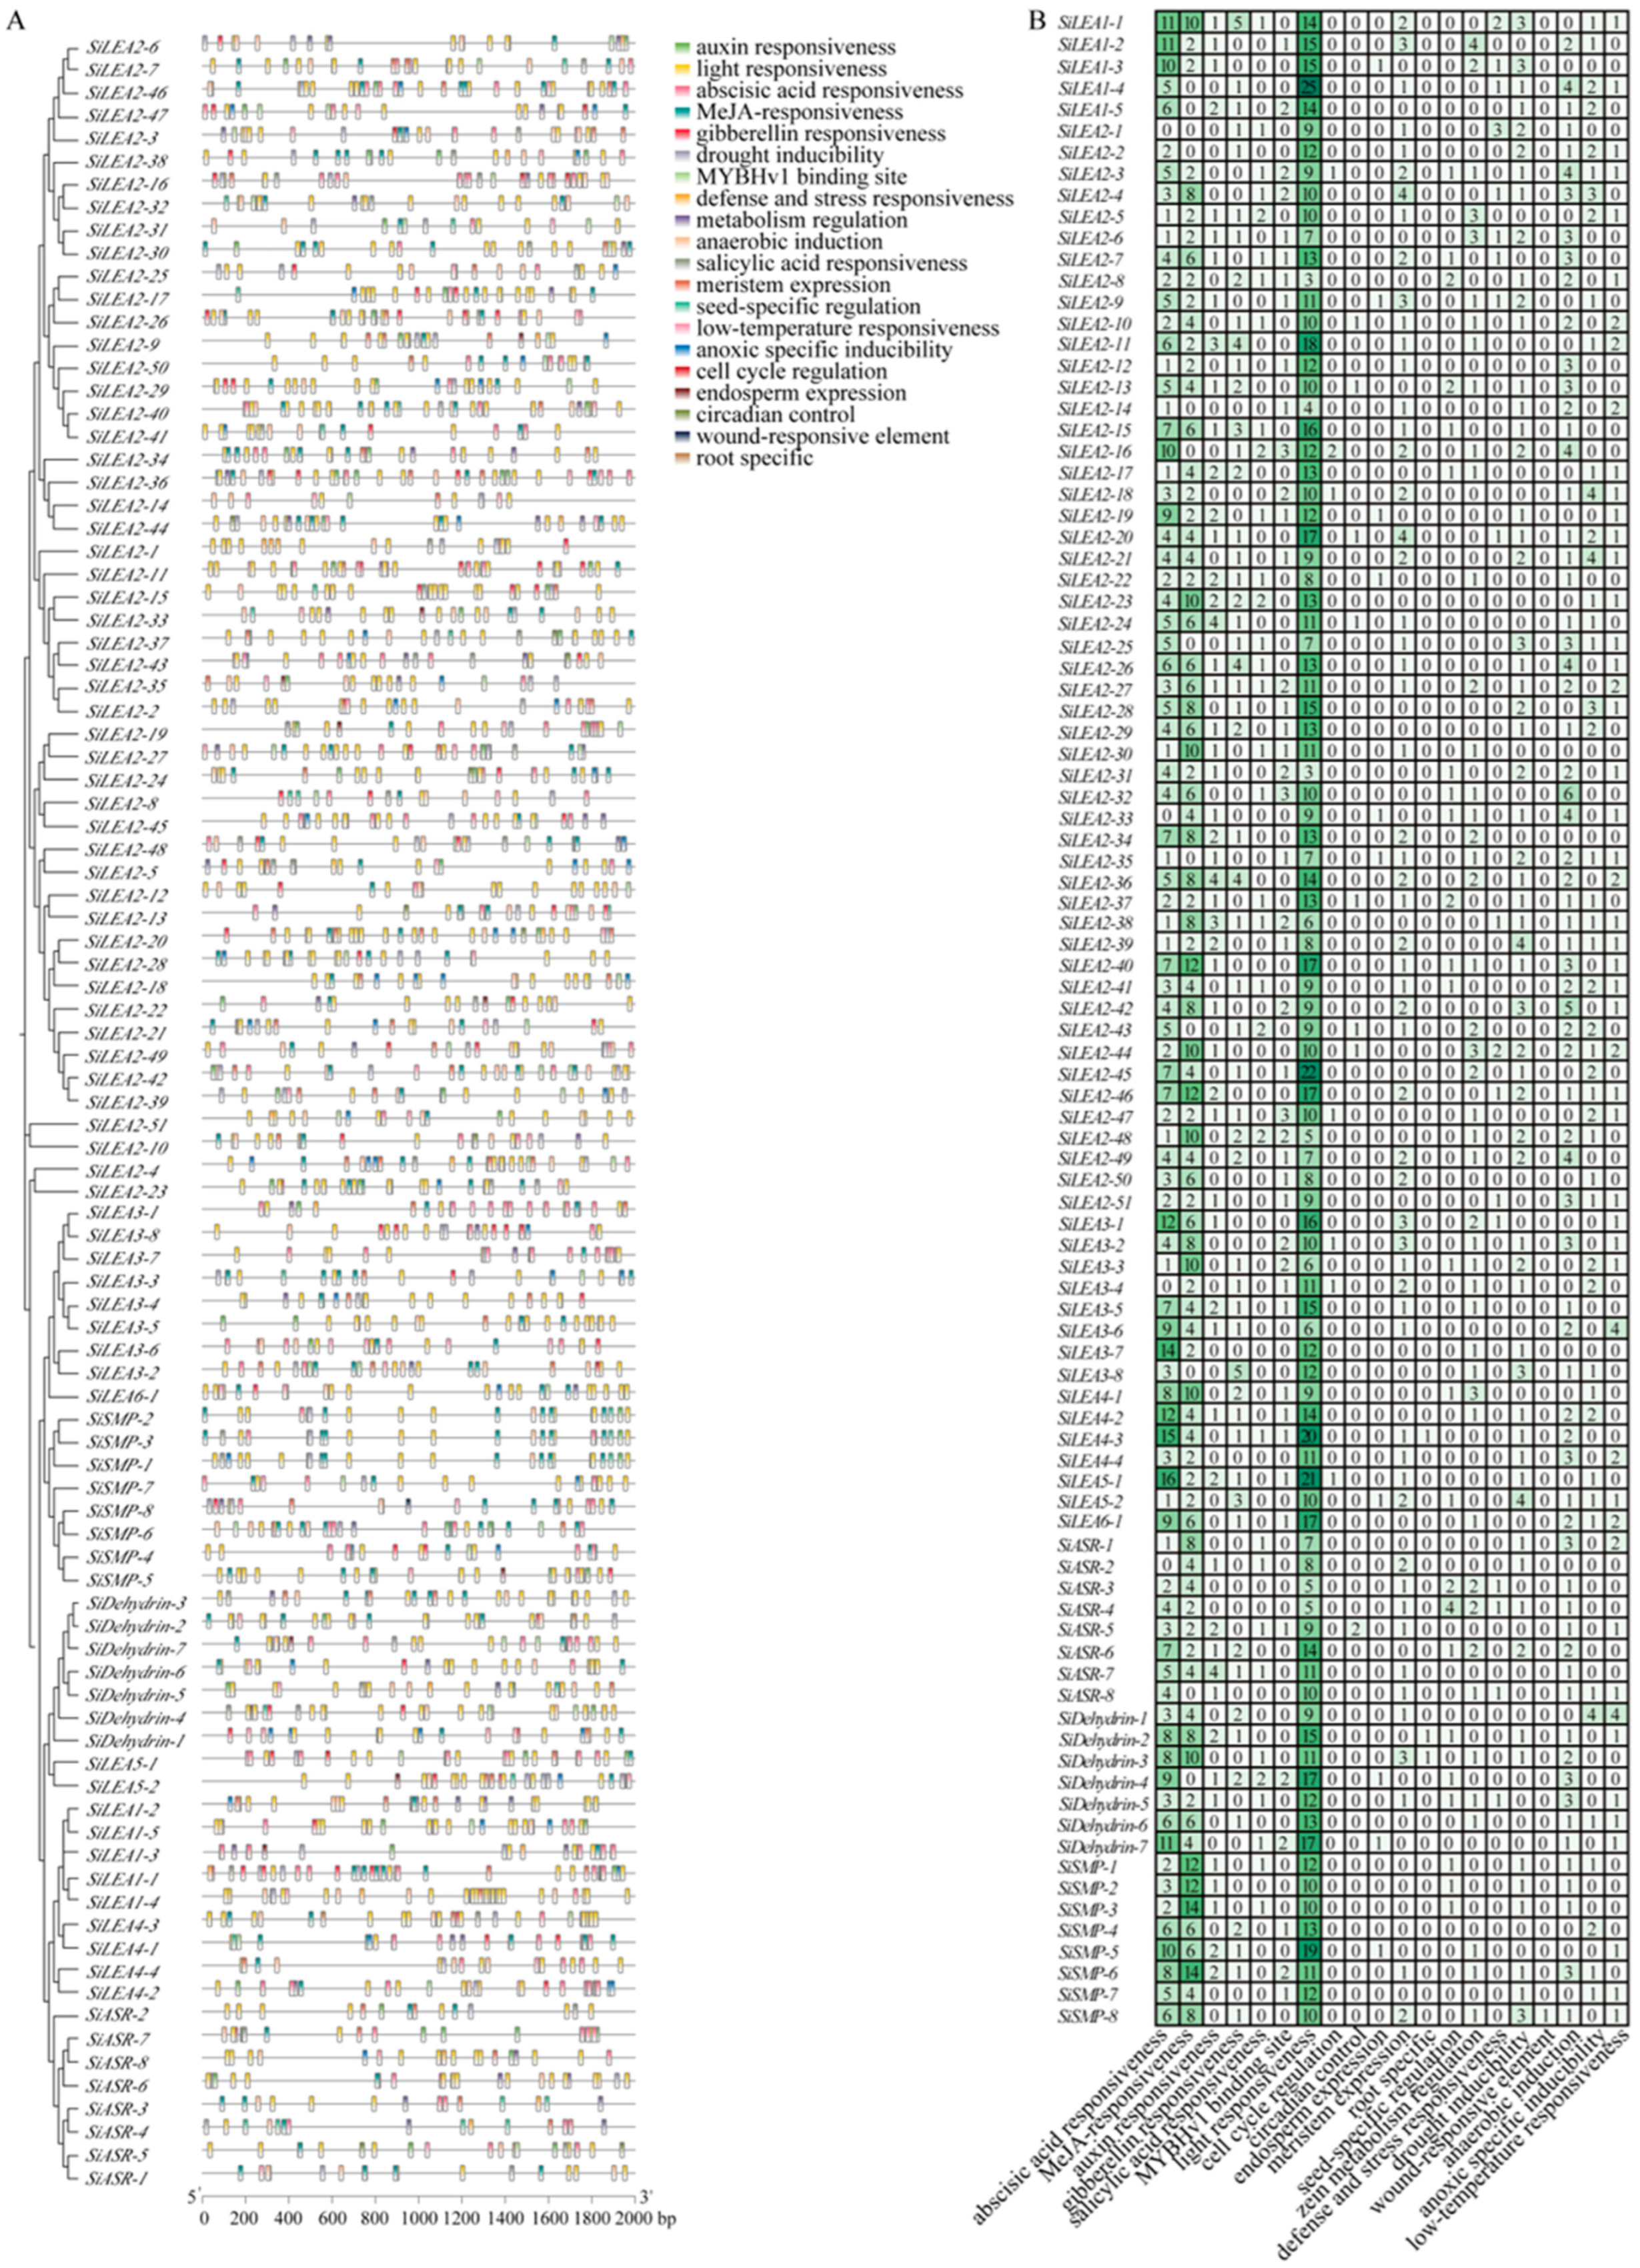
3.4. Promoter Cis-Acting Elements in SiLEA Genes

Analysis of cis-acting elements in SiLEA promoter regions revealed three functional categories (Figure 4, Table S3), providing insights into their potential roles in stress responses. Class I, associated growth and development elements, includes light responsiveness (present in all 94 SiLEA genes), root-specific elements, cell cycle regulation elements, alongside meristem expression, MYBHv1 binding sites, endosperm expression, and circadian control elements. Class II, linked to biotic and abiotic stress elements, feature drought inducibility, low-temperature responsiveness, wound-responsive elements, and defense/stress responsiveness, indicating these genes predominantly contribute to drought and cold adaptation. Class III elements mediate hormone response, with ABA, auxin, gibberellin, salicylic acid, and MeJA responsiveness identified; ABA-responsive elements occur in 90 of 94 genes (95.7%), excluding SiLEA2-1, SiLEA2-33, SiLEA3-4, and SiASR-2, underscoring ABA’s central role in regulating SiLEA expression.

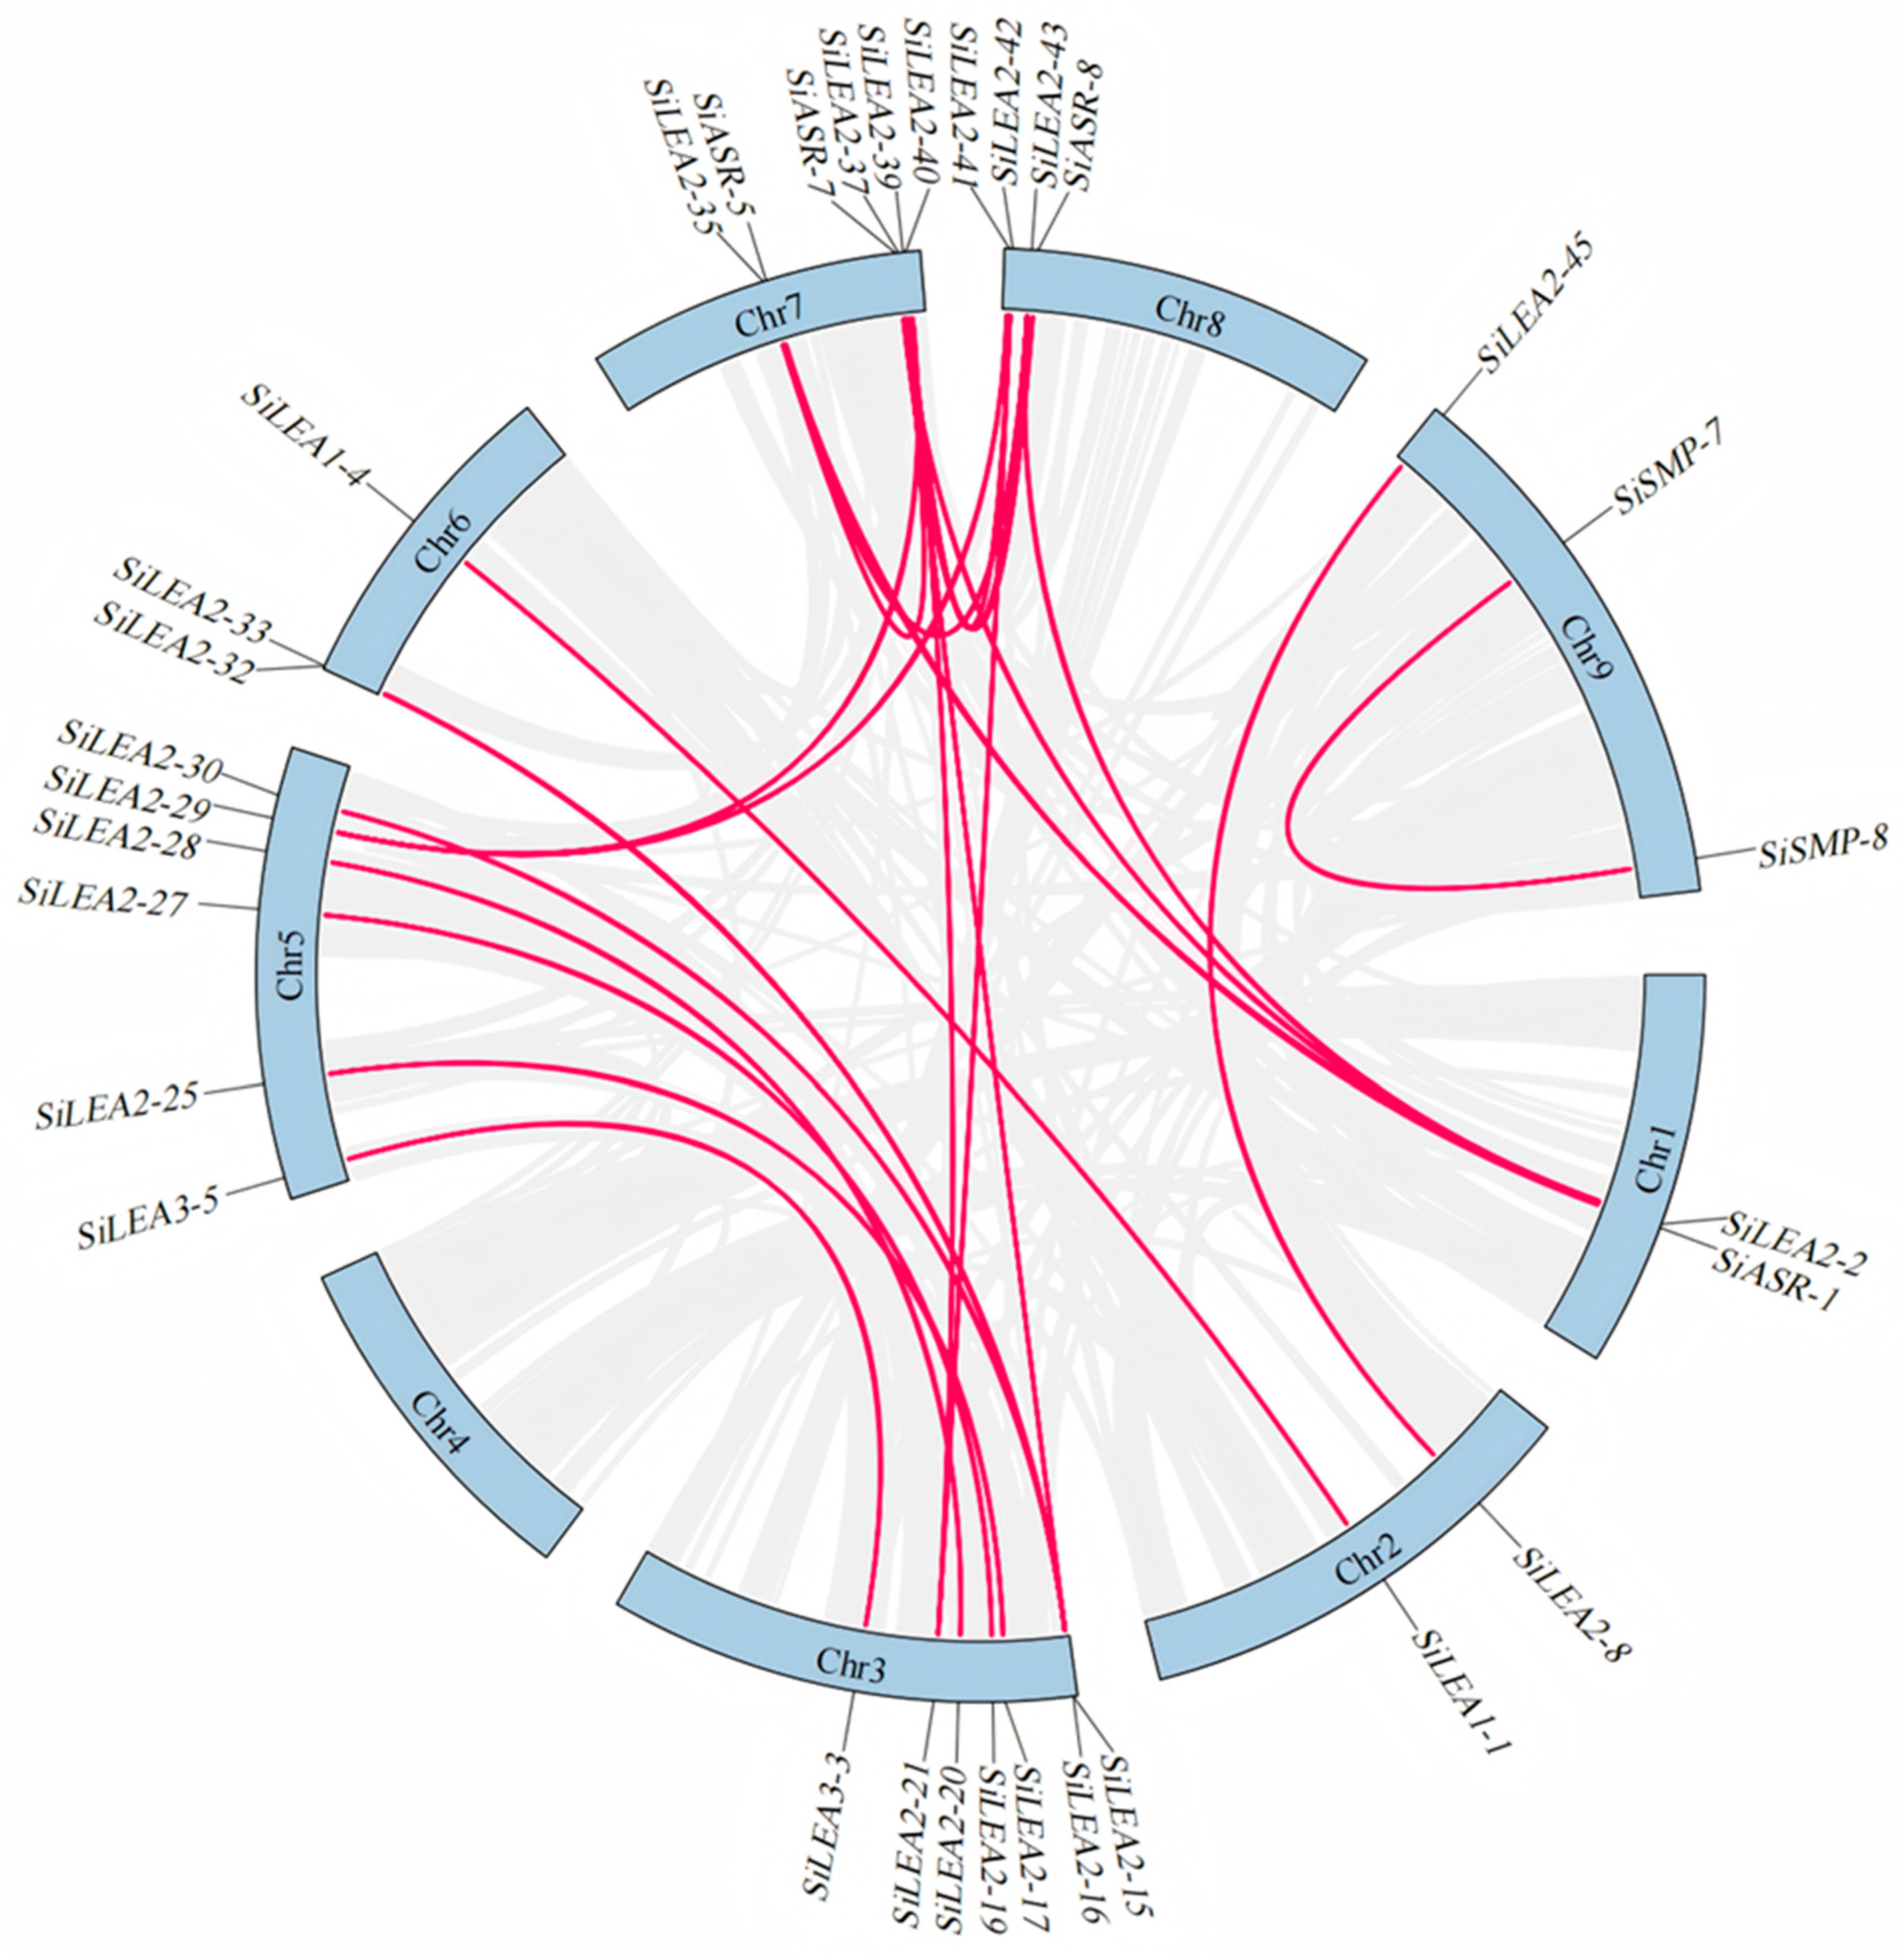
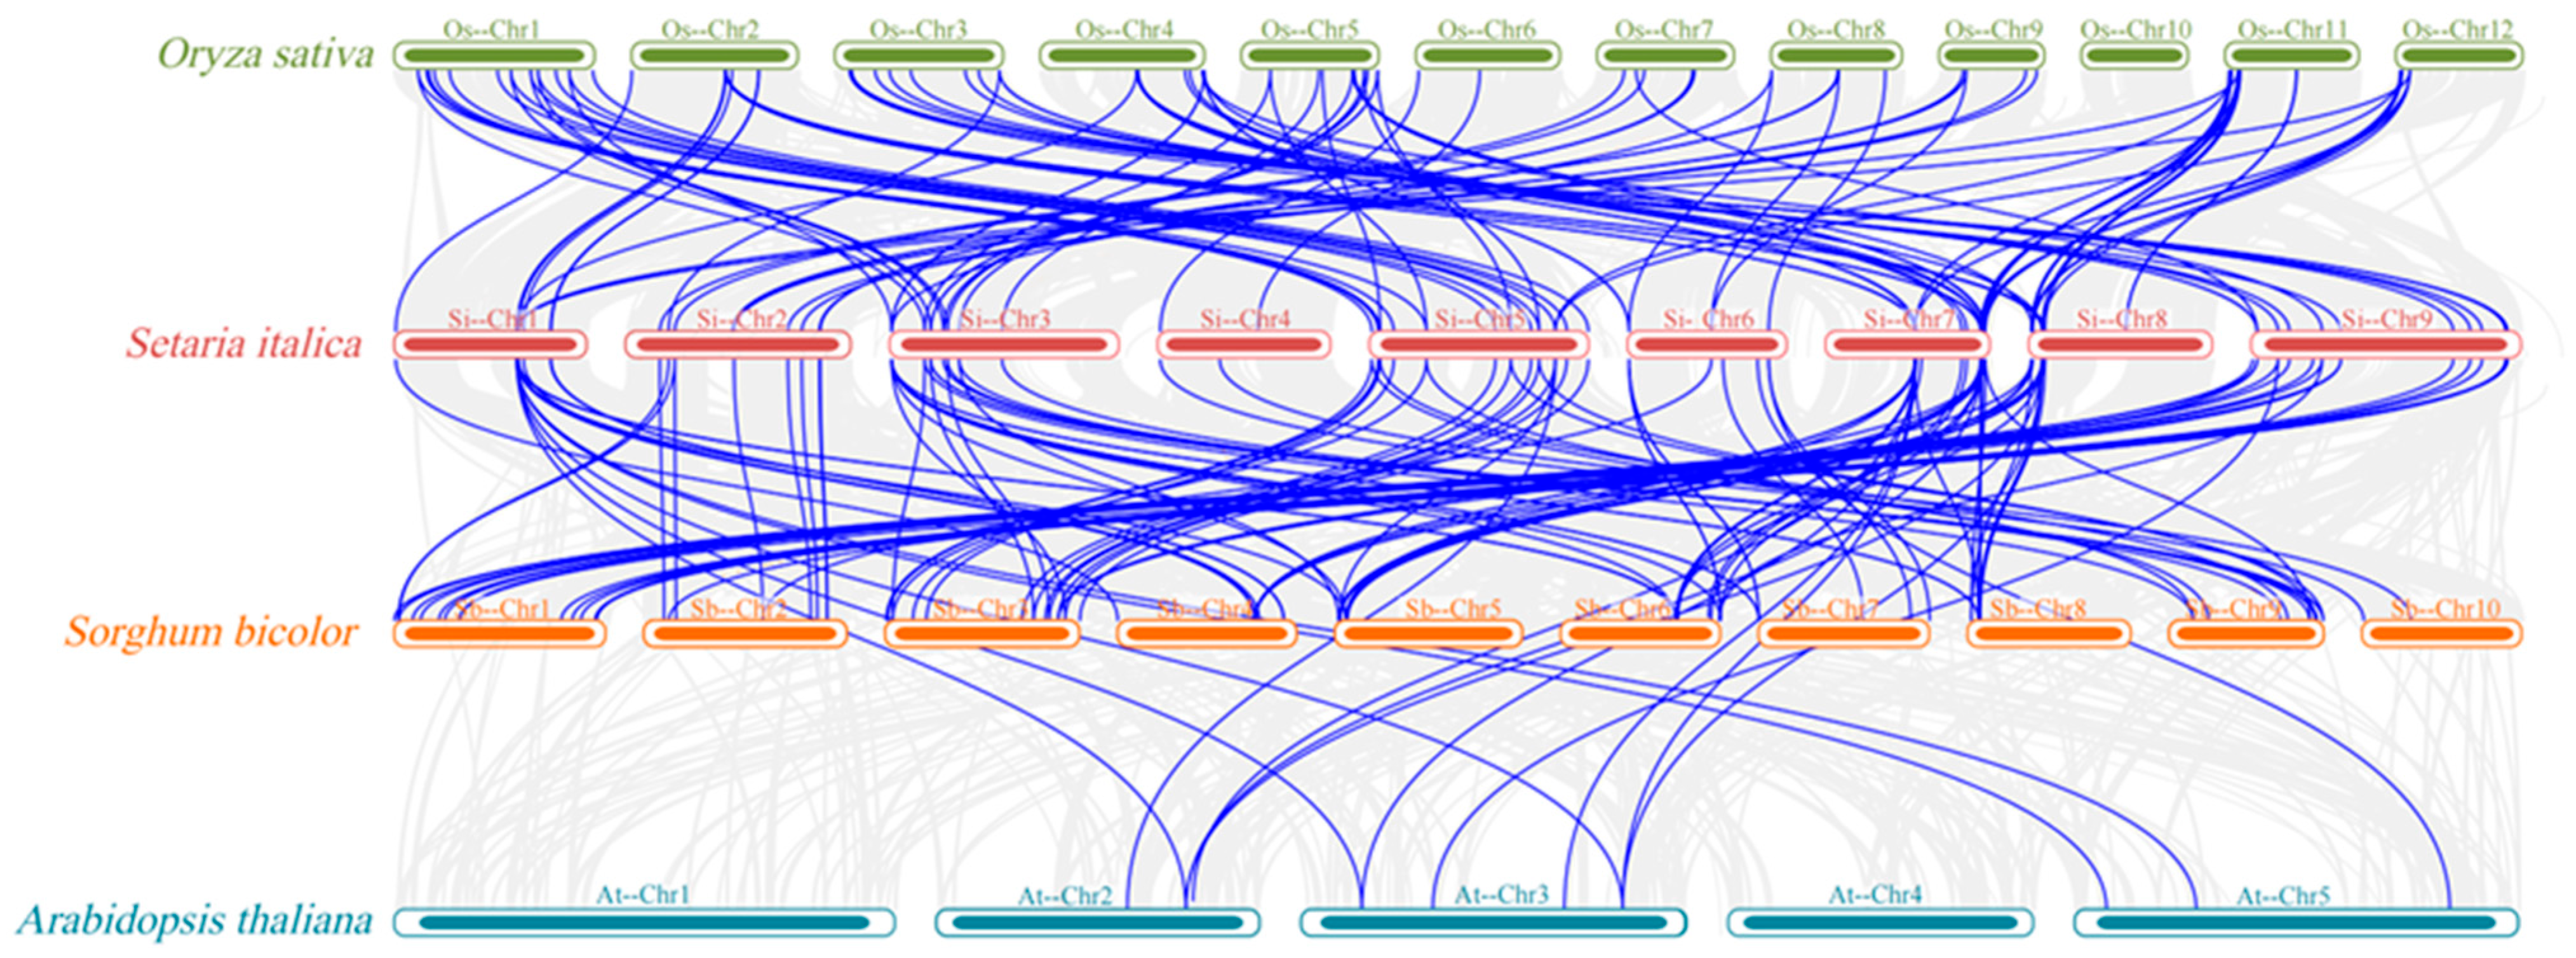
3.5. Synteny Analysis of the Foxtail Millet SiLEA Genes

To investigate the evolutionary mechanisms of the SiLEA gene family in foxtail millet, intra-species synteny analysis was performed (Figure 5). A total of 24 segmental duplicate gene pairs encompassing 33 SiLEA genes (35% of all family members) were identified (Table S4). Duplication patterns varied across subfamilies: the SiLEA_2 subfamily displayed a complex duplication network, featuring multi-gene duplication units (e.g., SiLEA2-2 forming triplicate relationships with SiLEA2-35, SiLEA2-37, and SiLEA2-43) and bidirectional duplication pairs (e.g., SiLEA2-15 with SiLEA2-37 and SiLEA2-33; SiLEA2-16 with SiLEA2-30 and SiLEA2-32; SiLEA2-21 with SiLEA2-39 and SiLEA2-42; SiLEA2-29 with SiLEA2-40 and SiLEA2-41). SiLEA2-37 served as a quadruplicate node, interacting with SiLEA2-2, SiLEA2-15, SiLEA2-35, and SiLEA2-43. Five large segmental duplication pairs were specific to the SiLEA_2 subfamily: SiLEA2-8/SiLEA2-45, SiLEA2-19/SiLEA2-27, SiLEA2-20/SiLEA2-28, SiLEA2-17/SiLEA2-25, and SiLEA2-39/SiLEA2-42. The SiLEA_1, SiLEA_3, SiASR, and SiSMP subfamilies contained segmental duplicates, including SiLEA1-1/SiLEA1-4, SiLEA3-3/SiLEA3-5, SiASR-1/SiASR-5, SiASR-7/SiASR-8, and SiSMP-7/SiSMP-8. Conversely, no duplication events occurred in the SiLEA_4, SiLEA_5, SiLEA_6, or SiDehydrin subfamilies. All duplicated gene pairs belonged to the same subfamilies, implying that chromosomal segment duplications likely drove their expansion, potentially resulting in functional redundancy.
Ka/Ks ratio analysis of segmental duplicate gene pairs in the SiLEA gene family revealed distinct evolutionary selection patterns (Table 2). Seventeen of the 24 homologous gene pairs with segmental duplication relationships (71%) exhibited Ka/Ks ratios significantly below 1 (p < 0.05), consistent with purifying selection. Six pairs (25%) displayed Ka/Ks ratios exceeding 1, potentially indicating positive selection. The SiLEA2-8/SiLEA2-45 pair produced a Ka/Ks value of NaN due to synonymous site saturation, preventing accurate calculation of synonymous substitution rates. This implies these genes accumulated exceptional sequence variation, with coding regions divergence reaching the maximum measurable evolutionary distance.
To investigate the evolutionary dynamics of LEA genes in plant species and assess their divergence and conservation across taxa, cross-species synteny analysis was conducted using foxtail millet, sorghum (monocot C4 plants), rice (monocot C3 plant), and Arabidopsis (dicot plant). Foxtail millet shared significantly more orthologous LEA genes with sorghum than with rice, while both monocot comparisons showed substantially higher ortholog counts than the foxtail millet–Arabidopsis pairing, which yielded only 15 orthologous LEA genes (Figure 6). These results suggest that foxtail millet and sorghum diverged more recently, whereas foxtail millet and Arabidopsis exhibit greater phylogenetic distance in LEA gene evolution.

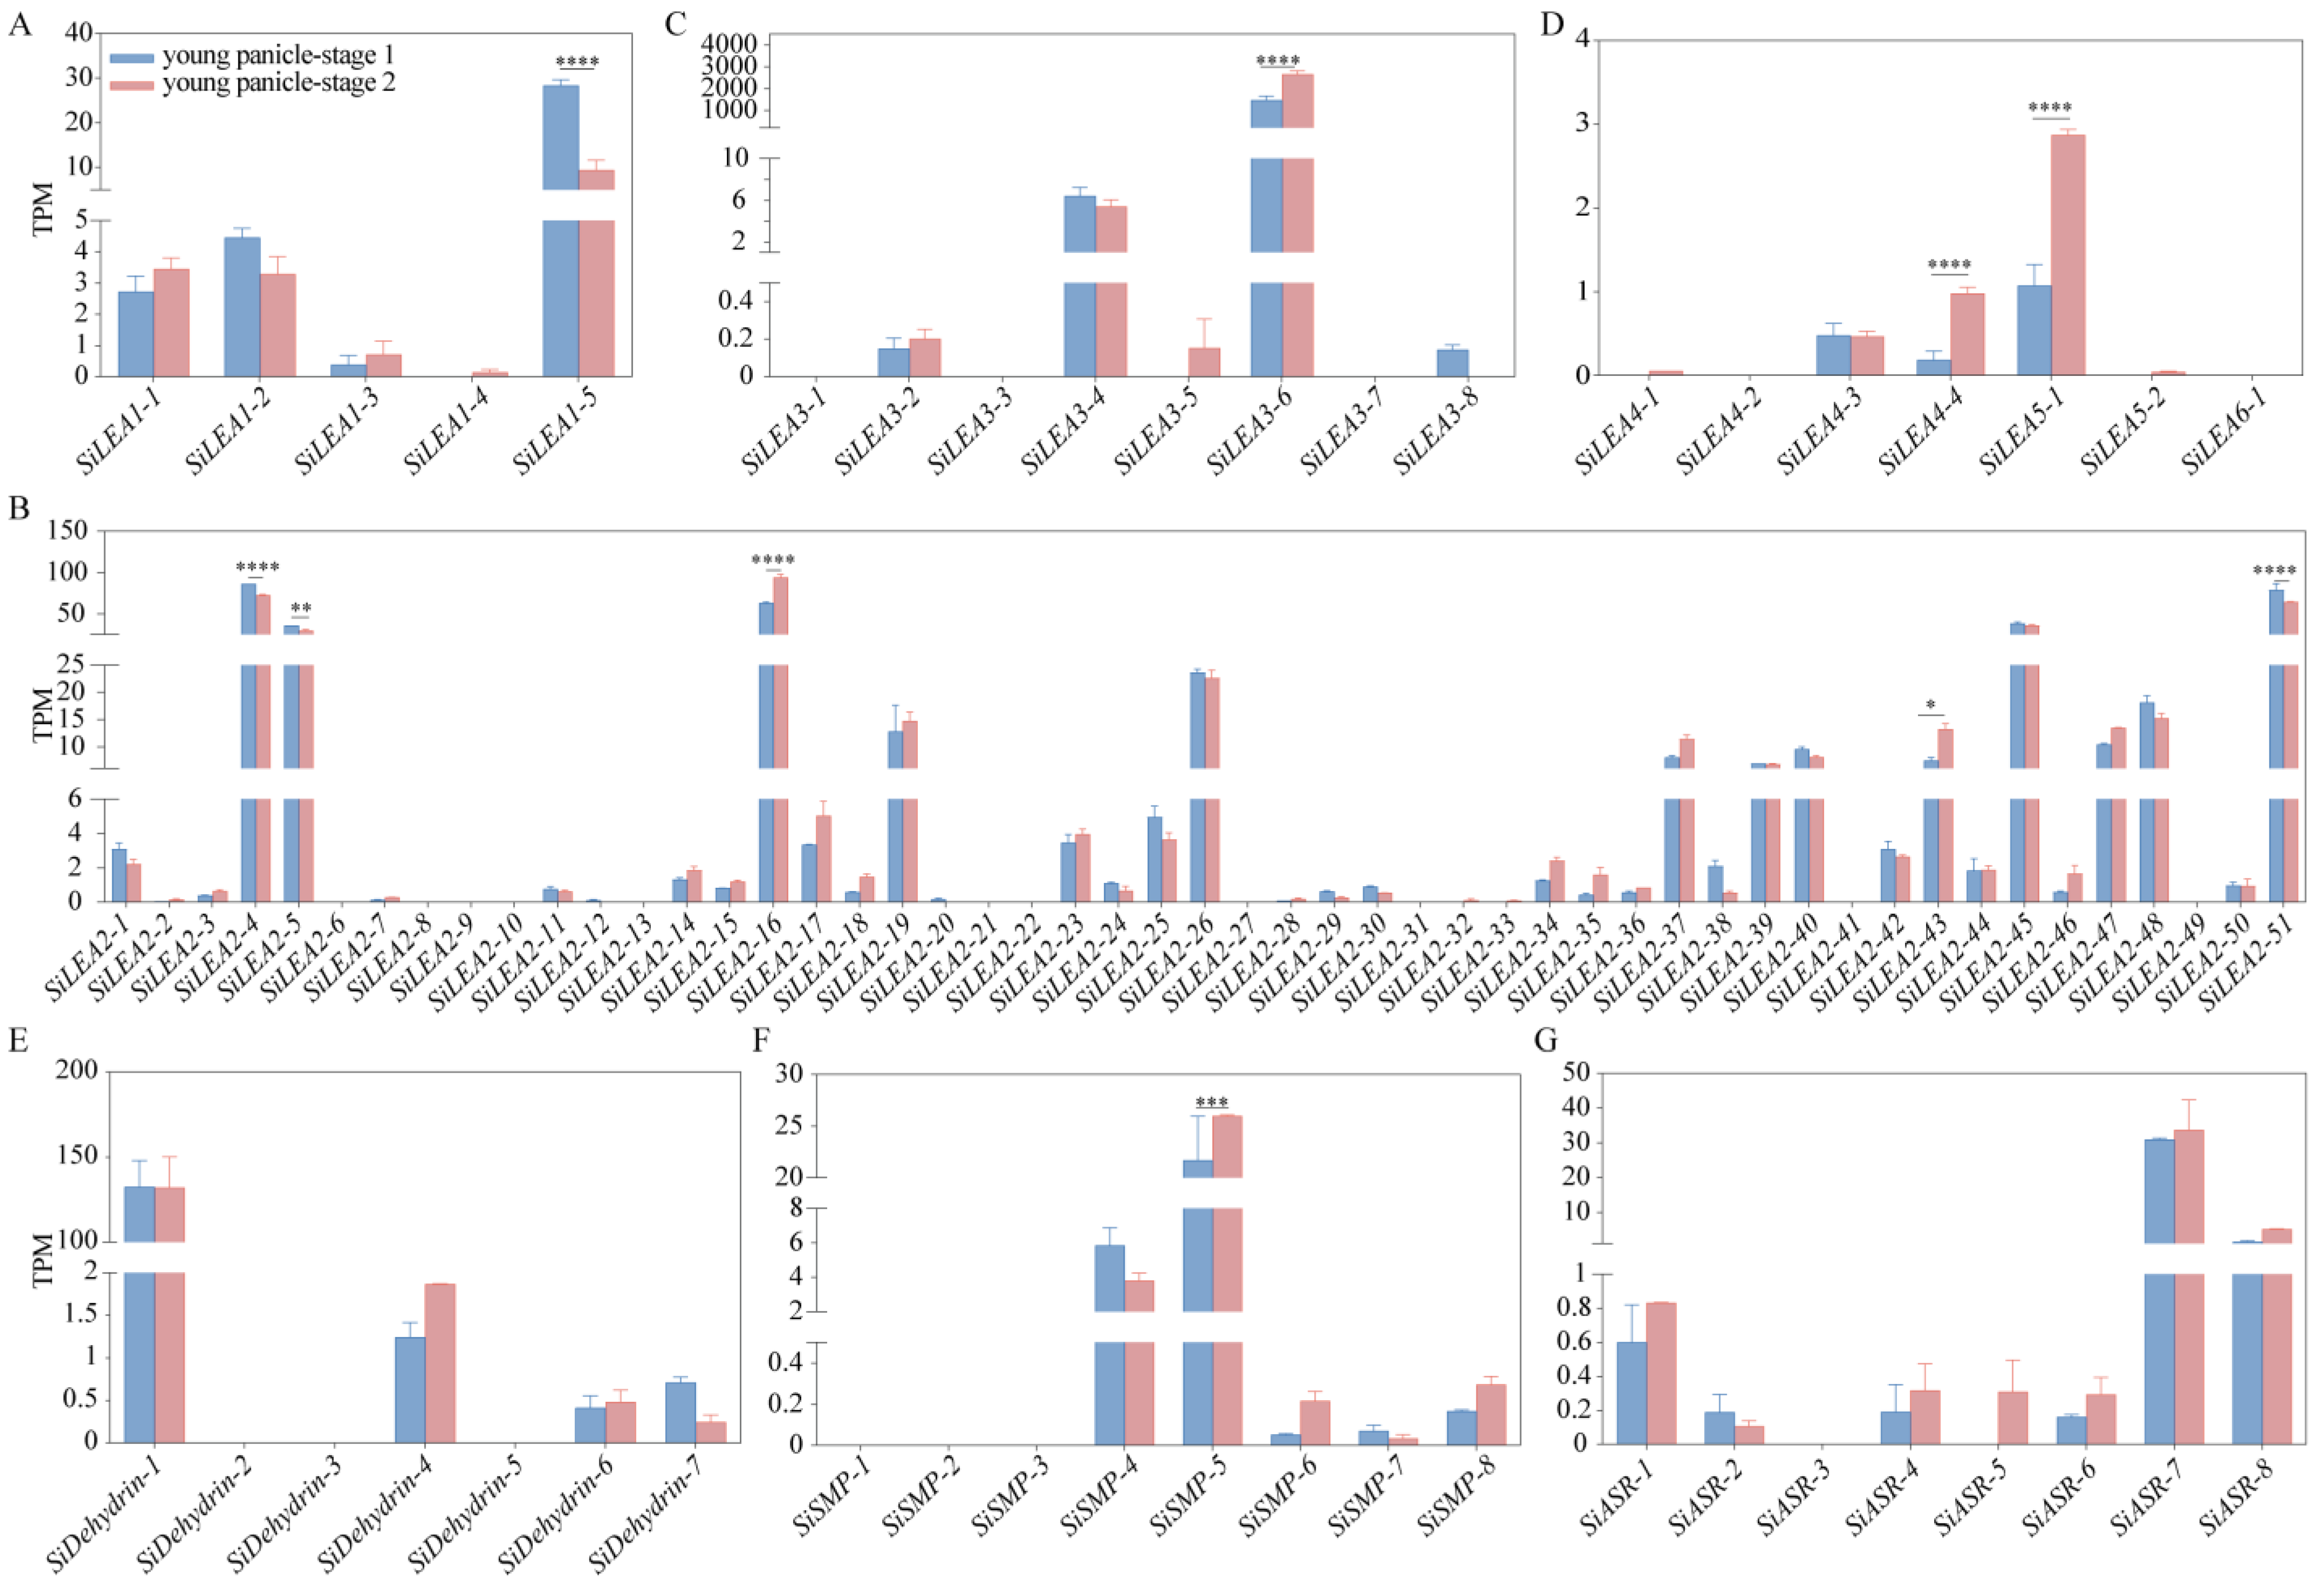
3.6. Tissue-Specific Expression Analysis of SiLEA Genes

The expression profiles of all 94 SiLEA genes across different tissues and developmental stages were analyzed using MDSi, revealing distinct spatiotemporal expression patterns (Figure 7, Table S5). SiASR-8 was high expression in aerial tissues and during panicle development, while SiSMP-5, SiLEA1-5, and SiLEA3-6 reached peak expression in immature seeds at stage S5 (Immature seed_S5). SiLEA2-45 showed upregulation in mature seeds (30 and 60 days after maturation), whereas SiLEA2-21 and SiDehydrin-2 exhibited root-specific expression during the grain-filling stage. Elevated expression of SiLEA3-4, SiASR-2, SiASR-5, SiASR-6, and SiASR-7 was observed in aerial tissues (Figure 7, Table S5).
Transcriptome analysis of foxtail millet panicles revealed distinct stage-specific expression patterns among SiLEA gene family members during two developmental phases (Figure 8). In the LEA_1 subfamily, SiLEA1-5 transcripts were substantially more abundant than those of other members but decreased sharply during the young panicle-stage 2, while other genes remained stable (Figure 8A). The LEA_2 subfamily analysis showed reduced expression of SiLEA2-4, SiLEA2-5, and SiLEA2-51 at young panicle-stage 2, contrasting with significant upregulation of SiLEA2-16 and SiLEA2-43 (Figure 8B). Among LEA_3–LEA_6/PvLEA18 members, SiLEA3-6 maintained exceptionally high expression throughout both stages while other genes showed minimal activity; SiLEA4-3 expression was stable, whereas SiLEA4-4 and SiLEA5-1 increased during stage 2 (Figure 8C,D). Within the SiDehydrin, SiSMP, and SiASR subfamilies, SiDehydrin-1 expression remained stable, SiSMP-5 exhibited coordinated upregulation, and SiSMP-4 was significantly downregulated (Figure 8E–G). These results demonstrate the differential regulatory mechanisms operating across SiLEA subfamilies during panicle development.
ABA regulates root development in plants by activating transcriptional responses of specific genes. Distinct expression patterns emerged across SiLEA subfamilies following ABA treatment compared to controls. In the LEA_1 subfamily, SiLEA1-2, SiLEA1-3, and SiLEA1-4 exhibited significant upregulation, with SiLEA1-4 displaying the strongest induction (Figure S1A), suggesting its potential specialized role in ABA signaling. The LEA_2 subfamily exhibited ABA-induced upregulation in ten members—SiLEA2-15, SiLEA2-16, SiLEA2-17, SiLEA2-19, SiLEA2-24, SiLEA2-25, SiLEA2-37, SiLEA2-45, SiLEA2-48, and SiLEA2-50—while SiLEA2-21 and SiLEA2-35 were downregulated (Figure S1B). Five genes across the LEA_3–LEA_6/PvLEA18 subfamilies responded markedly to ABA: SiLEA3-4 and SiLEA3-6 (LEA_3), SiLEA4-1 and SiLEA4-3 (LEA_4), and SiLEA5-2 (LEA_5) (Figure S1C,D). ABA treatment strongly induced SiDehydrin-1, SiDehydrin-2, SiDehydrin-6, and SiDehydrin-7—undetectable in untreated seedling roots—along with SiSMP-4, SiSMP-5, SiASR-2, SiASR-7, and SiASR-8 (Figure S1E–G).

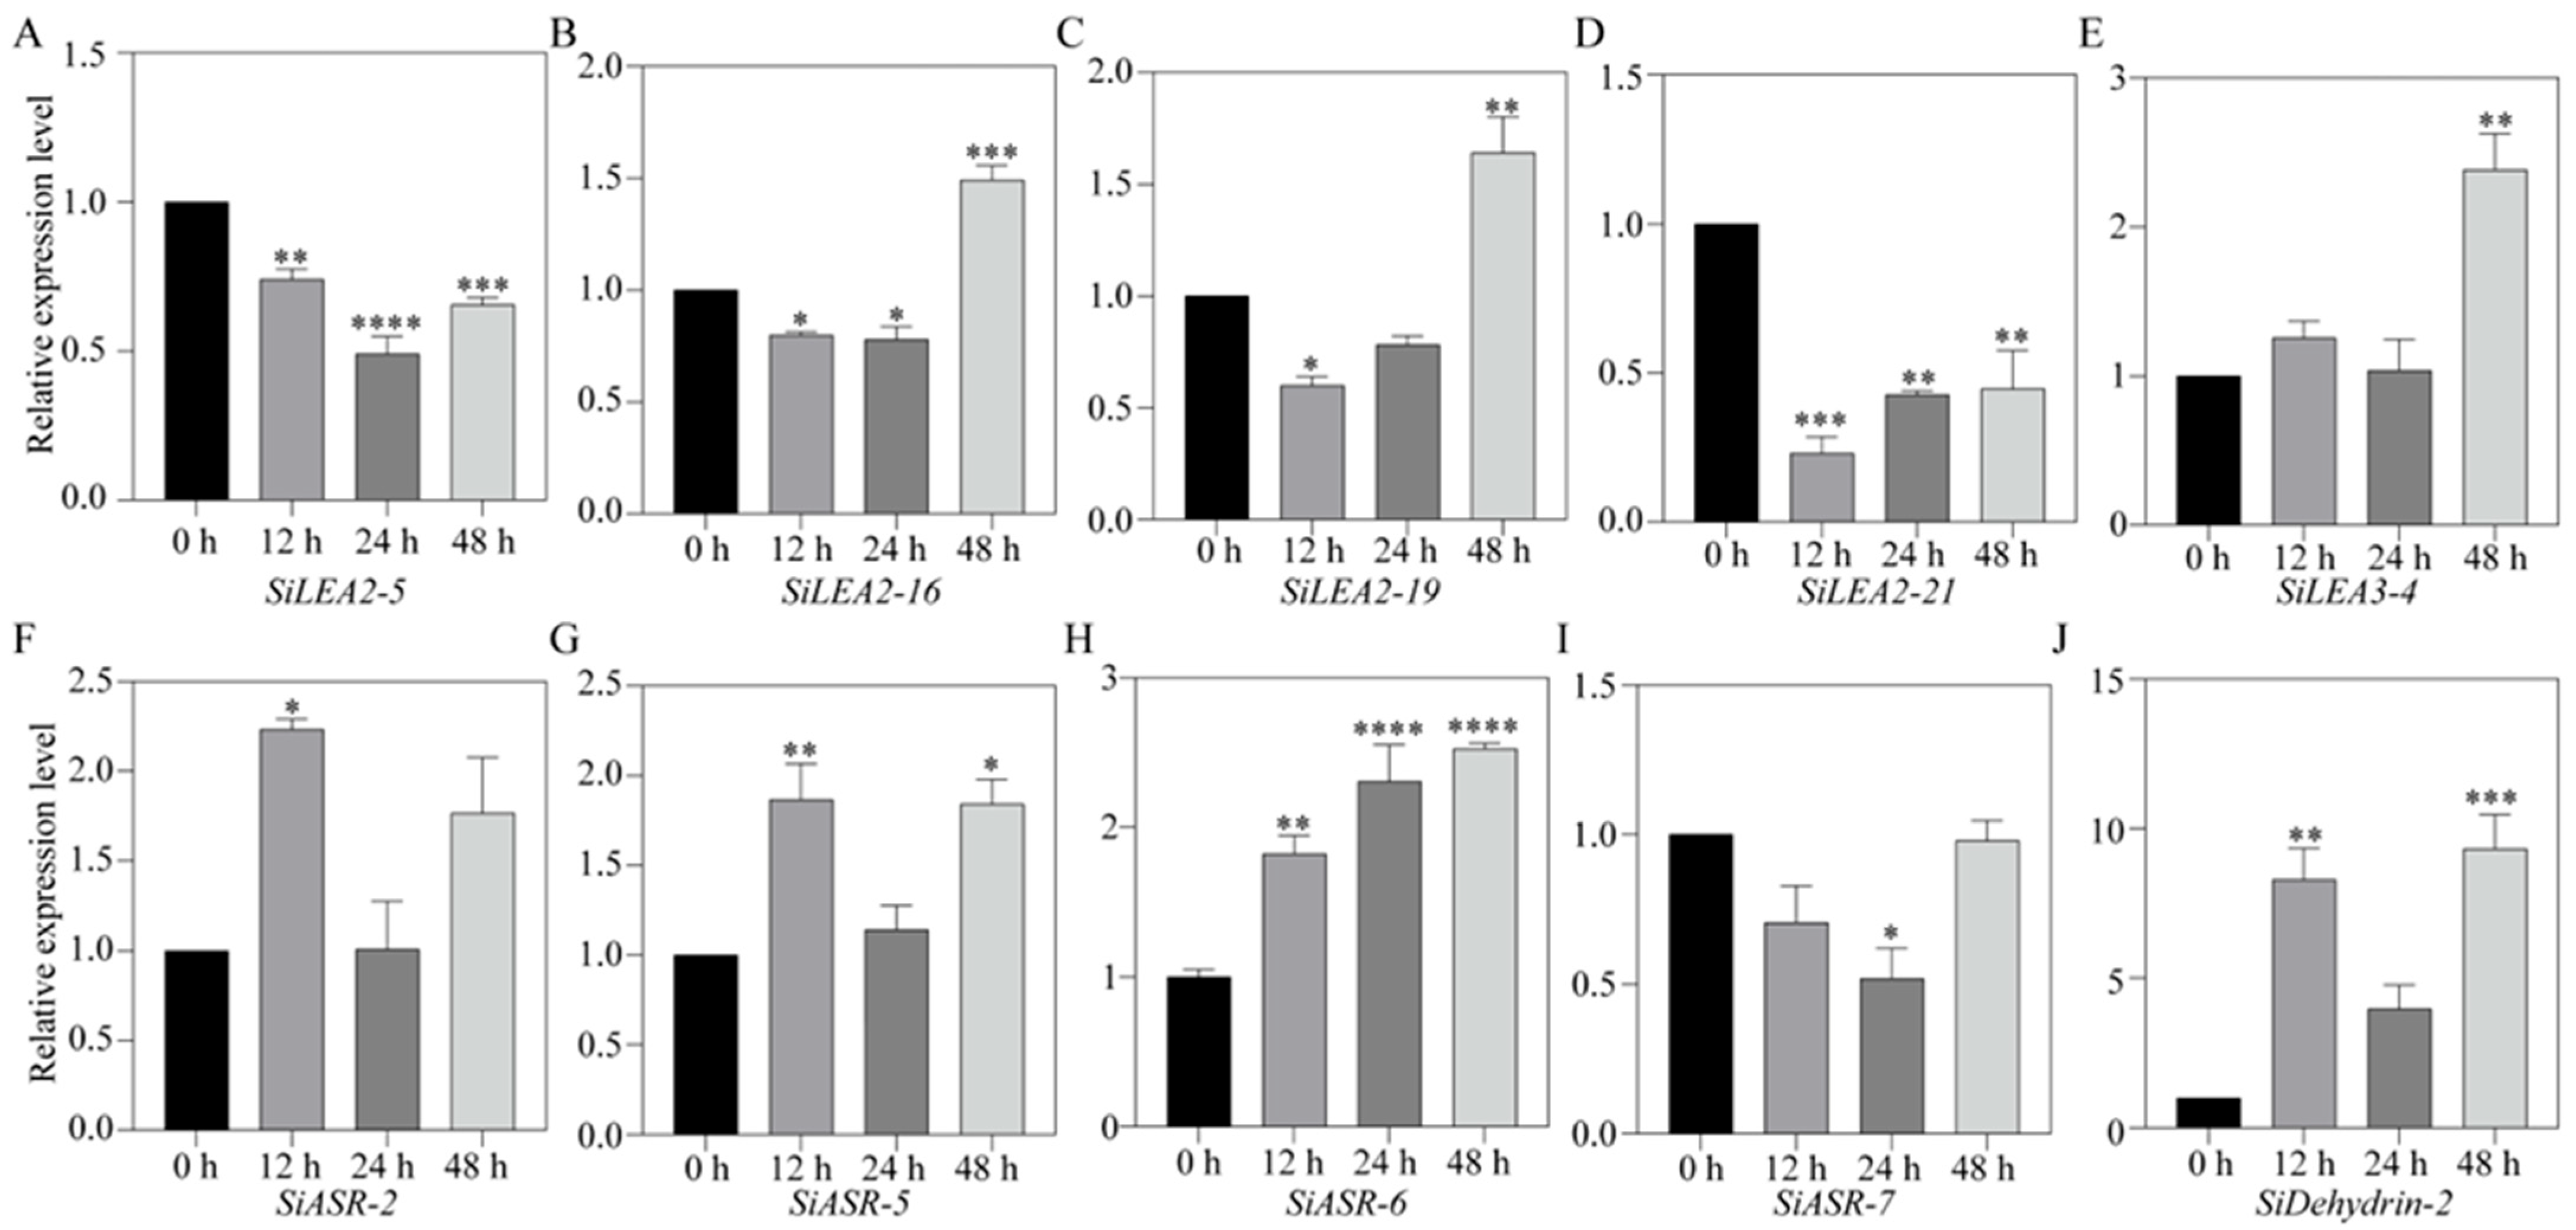
3.7. RT-qPCR Analysis of ABA-Responsive SiLEA Genes in Foxtail Millet

Ten SiLEA genes—SiLEA2-5, SiLEA2-16, SiLEA2-19, SiLEA2-21, SiLEA3-4, SiASR-2, SiASR-5, SiASR-6, SiASR-7, and SiDehydrin-2—were selected for RT-qPCR validation to assess ABA responses in shoot and root tissues based on previous findings. Eight genes in shoots exhibited significant differential expression following ABA treatment (Figure 9). While SiLEA2-5 remained stable, suggesting ABA-independent regulation (Figure 9A), SiLEA2-16 and SiLEA2-19 were initially downregulated at 12 h before gradually increasing (Figure 9B,C). SiLEA3-4 exhibited a transient, though non-significant, upregulation (Figure 9D). The expression of SiASR-2 and SiASR-5 peaked at 12 h before declining (Figure 9E,F). In contrast, SiASR-6 expression rose steadily, reaching maximum induction at 48 h (Figure 9G). SiASR-7 peaked at 24 h (4.5-fold versus control) but partially declined to 2.2-fold by 48 h (Figure 9H).
All ten SiLEA genes were detected in roots under ABA treatment (Figure 10). SiLEA2-5 expression declined under ABA treatment, reaching minimal levels by 24 h (Figure 10A). SiLEA2-16 and SiLEA2-19 expression decreased at 12 h but rebound to a 1.5-fold higher level by 48 h (Figure 10B,C). SiLEA2-21 expression also decreased at 12 h but partially recovered thereafter (Figure 10D). SiLEA3-4 activation occurred late, with expression peaking at 2.4-fold by 48 h (Figure 10E). SiASR-2 expression was induced by ABA treatment at 12 h (Figure 10F). SiASR-5 expression rose sharply at 12 h, returned to baseline at 24 h, and increased again by 48 h (Figure 10G). SiASR-6 expression increased steadily, reaching its highest level at 48 h (Figure 10H). In contrast, SiASR-7 expression decreased by 24 h (Figure 10I). SiDehydrin-2 showed an expression pattern similar to SiASR-5 (Figure 10J).

4. Discussion

The LEA gene family, which plays a crucial role in plant stress responses, has been well characterized in Arabidopsis [4], sorghum [5], rice [6], and wheat [7]. In this study, our bioinformatic analysis identified 94 SiLEA genes in foxtail millet, grouping them into nine subfamilies—LEA_1–LEA_6/PvLEA18, ASR, Dehydrin, and SMP— through comparisons of gene structure and conserved motifs. This classification mirrors earlier findings in Arabidopsis (nine subfamilies) [4], sorghum (eight subfamilies) [5], and rice (seven subfamilies) [6]. Notably, 53.19% of SiLEA genes contain no introns, exceeding the proportions observed in sorghum (47.05%) [5] and rice (35.2%) [6]. This structure feature could contribute to foxtail millet’s stress tolerance by enabling faster transcriptional responses, as intron-free genes bypass splicing delays during stress signal transduction [43]. Domain conservation patterns revealed subfamily-specific functions. SiLEA2-8 and SiLEA2-45 proteins contain the WHy domain, known for dehydration protection [44], whereas the ASR subfamily exclusively carries the ABA_WDS domain linked to ABA-mediated gene regulation [45,46].
Phylogenetic analysis placed SiLEA genes in close proximity to orthologs from monocot species such as sorghum and rice (Figure 2). The monocot-specific LEA_2 subfamily showed substantial expansion in foxtail millet (51 members), while the Arabidopsis-specific AtM subfamily (two members) was completely missing. This divergence probably arose from evolutionary adaptations in monocots, where gene duplication and functional specialization generated distinct stress-response mechanisms. Foxtail millet displayed specific enrichment of the ASR subfamily (eight members), which was absent in Arabidopsis. Since ASR proteins play essential roles in osmoregulation and ABA signal [45,46], their expansion in foxtail millet may enhance its drought tolerance. Synteny analysis demonstrated more orthologous LEA genes between foxtail millet and sorghum than between foxtail millet and either rice or Arabidopsis (Figure 6), indicating a more recent evolutionary divergence between foxtail millet and sorghum. This observation corresponds with the known genomic evolution of Poaceae species [5,6], implying that C4 plants likely faced comparable environmental pressures shaping LEA gene function.
Gene duplication drives the expansion and functional diversification of plant gene families [47]. In foxtail millet, segmental duplication events generated 35% of SiLEA genes (33 members), with the SiLEA2 subfamily exhibiting an especially intricate replication network (Figure 5). SiLEA2-37, for instance, formed a quadruplicate replication node with multiple genes (e.g., SiLEA2-2, SiLEA2-15), reflecting frequent segmental duplication associated with polyploidization in Poaceae genomes [5]. Ka/Ks analysis revealed that 71% of duplicated gene pairs (e.g., SiLEA2-16/SiLEA2-30) evolved under purifying selection (Ka/Ks < 1), preserving their core functions. The remaining 25% of pairs (e.g., SiLEA2-19/SiLEA2-27) underwent positive selection (Ka/Ks > 1), suggesting potential functional innovations that may enhance stress adaptability in foxtail millet.
Integrated transcriptomic and RT-qPCR analyses revealed distinct tissue-specific and stress-inducible expression profiles of SiLEA genes in foxtail millet. SiLEA2-21 and SiDehydrin-2 showed elevated expression in roots (Figure 7), whereas SiASR-5 and SiASR-6 accumulated primarily in aerial tissues (Figure 7), suggesting functional specialization in stress adaptation. SiLEA2-16, SiLEA2-19, and SiASR-6 exhibited pronounced ABA-induced upregulation in roots (Figure 10), with their promoter containing multiple ABA-responsive elements, implicating their role in ABA-dependent signaling. Conversely, SiLEA2-5 and SiLEA2-21 were significantly downregulated by ABA in roots (Figure 10). This functional divergence mirrors findings in rice (OsEm1 and OsLEA5) [20,21], highlighting the coexistence of functional redundancy and regulatory specificity within the LEA gene family.

5. Conclusions

This study identified 94 SiLEA genes in foxtail millet through bioinformatic analysis, classifying them into nine subfamilies based on gene structures, conserved motifs, and phylogenetic relationships with Arabidopsis, rice, and sorghum. Sequences within each subfamily showed high conservation. Chromosomal mapping revealed uneven distribution of these genes across all nine foxtail millet chromosomes. Synteny analysis demonstrated segmental duplication events during SiLEA family evolution, while cross-species comparisons indicated closer orthologous relationships with the Poaceae species sorghum and rice than with the eudicot Arabidopsis. qRT-PCR analysis revealed that ABA regulates the expression of SiASR-2, SiASR-5, and SiASR-6, suggesting these genes in ABA-dependent signaling pathways. These results systematically characterize SiLEA genes’ features, expression profiles, and ABA responsiveness, establishing a framework for investigating their biological roles, decoding drought-resistance mechanisms, and developing stress-tolerant foxtail millet varieties.

Supplementary Materials

The following supporting information can be downloaded at: https://www.mdpi.com/article/10.3390/genes16080932/s1, Figure S1: Expression patterns of SiLEA genes in the root of foxtail millet; Table S1: Primers for RT-qPCR in this study; Table S2: LEA genes used for phylogenetic tree; Table S3: Major cis-regulatory elements in SiLEA gene promoters; Table S4: Tandem duplicated SiLEA genes; Table S5: The Transcripts Per Million (TPM) values of the SiLEA genes in different tissues.

Author Contributions

Conceptualization, Y.Q. and H.L.; methodology, Y.Q., Y.Z. (Yiru Zhao), X.L. and R.W.; software, Y.Z. (Yiru Zhao) and X.L.; validation, R.W., S.C. and Y.Z. (Yu Zhang); formal analysis, Y.Q. and Y.Z. (Yiru Zhao); investigation, X.L. and R.W.; writing—original draft preparation, Y.Z. (Yiru Zhao); writing—review and editing, Y.Q. and H.L.; visualization, Y.Q., Y.Z. (Yiru Zhao) and X.R.; supervision, X.R. and H.L.; project administration, Y.Q. and H.L.; funding acquisition, Y.Q., X.L. and H.L. All authors have read and agreed to the published version of the manuscript.

Funding

This research was funded by the National Natural Science Foundation of China (32201721), Central Government-Guided Local Science and Technology Development Fund Project (YDZJSX2022B007), Reward Fund for Scientific Research Projects for Doctoral Graduates and Post-doctoral Researchers Working in Shanxi Province (SXYBKY2020010), the Science and Technology Innovation Fund Project of Shanxi Agricultural University (2020BQ58), and the College Students Innovation Training Program of Shanxi Agricultural University (S202410113070).

Institutional Review Board Statement

Not applicable.

Informed Consent Statement

Not applicable.

Data Availability Statement

All data generated or analyzed during this study are included in this published article.

Conflicts of Interest

The authors declare no conflicts of interest.

References

  1. Shinozaki, K.; Yamaguchi-Shinozaki, K. Gene networks involved in drought stress response and tolerance. J. Exp. Bot. 2007, 58, 221–227. [Google Scholar] [CrossRef]
  2. Zhang, Y.; Xu, J.; Li, R.; Ge, Y.; Li, Y.; Li, R. Plants’ response to abiotic stress: Mechanisms and strategies. Int. J. Mol. Sci. 2023, 24, 10915. [Google Scholar] [CrossRef] [PubMed]
  3. Hundertmark, M.; Hincha, D.K. LEA (late embryogenesis abundant) proteins and their encoding genes in Arabidopsis thaliana. BMC Genom. 2008, 9, 118. [Google Scholar] [CrossRef] [PubMed]
  4. Bies-Etheve, N.; Gaubier-Comella, P.; Debures, A.; Lasserre, E.; Jobet, E.; Raynal, M.; Cooke, R.; Delseny, M. Inventory, evolution and expression profiling diversity of the LEA (late embryogenesis abundant) protein gene family in Arabidopsis thaliana. Plant Mol. Biol. 2008, 67, 107–124. [Google Scholar] [CrossRef] [PubMed]
  5. Nagaraju, M.; Kumar, S.A.; Reddy, P.S.; Kumar, A.; Rao, D.M.; Kavi Kishor, P.B. Genome-scale identification, classification, and tissue specific expression analysis of late embryogenesis abundant (LEA) genes under abiotic stress conditions in Sorghum bicolor L. PLoS ONE 2019, 14, e0209980. [Google Scholar] [CrossRef]
  6. Wang, X.S.; Zhu, H.B.; Jin, G.L.; Liu, H.L.; Wu, W.R.; Zhu, J. Genome-scale identification and analysis of LEA genes in rice (Oryza sativa L.). Plant Sci. 2007, 172, 414–420. [Google Scholar] [CrossRef]
  7. Liu, D.; Sun, J.; Zhu, D.; Lyu, G.; Zhang, C.; Liu, J.; Wang, H.; Zhang, X.; Gao, D. Genome-wide identification and expression profiles of late embryogenesis-abundant (LEA) genes during grain maturation in wheat (Triticum aestivum L.). Genes 2019, 10, 696. [Google Scholar] [CrossRef]
  8. Koubaa, S.; Brini, F. Functional analysis of a wheat group 3 late embryogenesis abundant protein (TdLEA3) in Arabidopsis thaliana under abiotic and biotic stresses. Plant Physiol. Biochem. 2020, 156, 396–406. [Google Scholar] [CrossRef]
  9. Jin, F.; Yu, C.; Lai, L.; Liu, Z.; van der Spoel, D. Ligand clouds around protein clouds: A scenario of ligand binding with intrinsically disordered proteins. PLoS Comput. Biol. 2013, 9, e1003249. [Google Scholar] [CrossRef]
  10. Dure, L., III; Crouch, M.; Harada, J.; Ho, T.H.; Mundy, J.; Quatrano, R.; Thomas, T.; Sung, Z.R. Common amino acid sequence domains among the LEA proteins of higher plants. Plant Mol. Biol. 1989, 12, 475–486. [Google Scholar] [CrossRef]
  11. Bray, E.A. Molecular responses to water deficit. Plant Physiol. 1993, 103, 1035–1040. [Google Scholar] [CrossRef]
  12. Hunault, G.; Jaspard, E. LEAPdb: A database for the late embryogenesis abundant proteins. BMC Genom. 2010, 11, 221. [Google Scholar] [CrossRef]
  13. Battaglia, M.; Olvera-Carrillo, Y.; Garciarrubio, A.; Campos, F.; Covarrubias, A.A. The enigmatic LEA proteins and other hydrophilins. Plant Physiol. 2008, 148, 6–24. [Google Scholar] [CrossRef]
  14. Olvera-Carrillo, Y.; Campos, F.; Reyes, J.L.; Garciarrubio, A.; Covarrubias, A.A. Functional analysis of the group 4 late embryogenesis abundant proteins reveals their relevance in the adaptive response during water deficit in Arabidopsis. Plant Physiol. 2010, 154, 373–390. [Google Scholar] [CrossRef]
  15. Mowla, S.B.; Cuypers, A.; Driscoll, S.P.; Kiddle, G.; Thomson, J.; Foyer, C.H.; Theodoulou, F.L. Yeast complementation reveals a role for an Arabidopsis thaliana late embryogenesis abundant (LEA)-like protein in oxidative stress tolerance. Plant J. 2006, 48, 743–756. [Google Scholar] [CrossRef] [PubMed]
  16. Jia, F.; Qi, S.; Li, H.; Liu, P.; Li, P.; Wu, C.; Zheng, C.; Huang, J. Overexpression of Late Embryogenesis Abundant 14 enhances Arabidopsis salt stress tolerance. Biochem. Biophys. Res. Commun. 2014, 454, 505–511. [Google Scholar] [CrossRef] [PubMed]
  17. Nguyen, N.H.; Nguyen, C.T.T.; Jung, C.; Cheong, J.J. AtMYB44 suppresses transcription of the late embryogenesis abundant protein gene AtLEA4-5. Biochem. Biophys. Res. Commun. 2019, 511, 931–934. [Google Scholar] [CrossRef] [PubMed]
  18. Sivamani, E.; Bahieldin, A.; Wraith, J.M.; Al-Niemi, T.; Dyer, W.E.; Ho, T.D.; Qu, R. Improved biomass productivity and water use efficiency under water deficit conditions in transgenic wheat constitutively expressing the barley HVA1 gene. Plant Sci. 2000, 155, 1–9. [Google Scholar] [CrossRef]
  19. Xu, D.; Duan, X.; Wang, B.; Hong, B.; Ho, T.; Wu, R. Expression of a Late Embryogenesis Abundant Protein gene, HVA1, from barley confers tolerance to water deficit and salt stress in transgenic rice. Plant Physiol. 1996, 110, 249–257. [Google Scholar] [CrossRef]
  20. Yu, J.; Lai, Y.; Wu, X.; Wu, G.; Guo, C. Overexpression of OsEm1 encoding a group I LEA protein confers enhanced drought tolerance in rice. Biochem. Biophys. Res. Commun. 2016, 478, 703–709. [Google Scholar] [CrossRef]
  21. Huang, L.; Zhang, M.; Jia, J.; Zhao, X.; Huang, X.; Ji, E.; Ni, L.; Jiang, M. An atypical Late Embryogenesis Abundant Protein OsLEA5 plays a positive role in ABA-induced antioxidant defense in Oryza sativa L. Plant Cell Physiol. 2018, 59, 916–929. [Google Scholar] [CrossRef]
  22. Wang, G.; Su, H.; Abou-Elwafa, S.F.; Zhang, P.; Cao, L.; Fu, J.; Xie, X.; Ku, L.; Wen, P.; Wang, T.; et al. Functional analysis of a late embryogenesis abundant protein ZmNHL1 in maize under drought stress. J. Plant Physiol. 2023, 280, 153883. [Google Scholar] [CrossRef] [PubMed]
  23. Zhang, Q.; Cao, L.; Ma, C.; Pang, Y.; Ye, F.; Lu, X. Molecular characterization, cloning, and expression analysis of maize ZmLEA34 gene in response to drought stress. J. Shandong Agric. Univ. (Nat. Sci. Ed.) 2022, 53, 665–672. [Google Scholar]
  24. Wang, M.; Li, P.; Li, C.; Pan, Y.; Jiang, X.; Zhu, D.; Zhao, Q.; Yu, J. SiLEA14, a novel atypical LEA protein, confers abiotic stress resistance in foxtail millet. BMC Plant Biol. 2014, 14, 290. [Google Scholar] [CrossRef]
  25. Tian, C.; Rehman, A.; Wang, X.; Wang, Z.; Li, H.; Ma, J.; Du, X.; Peng, Z.; He, S. Late embryogenesis abundant gene GhLEA-5 of semi-wild cotton positively regulates salinity tolerance in upland cotton. Gene 2025, 949, 149372. [Google Scholar] [CrossRef]
  26. Shiraku, M.L.; Magwanga, R.O.; Zhang, Y.; Hou, Y.; Kirungu, J.N.; Mehari, T.G.; Xu, Y.; Wang, Y.; Wang, K.; Cai, X.; et al. Late embryogenesis abundant gene LEA3 (Gh_A08G0694) enhances drought and salt stress tolerance in cotton. Int. J. Biol. Macromol. 2022, 207, 700–714. [Google Scholar] [CrossRef]
  27. Luo, D.; Wang, C.; Mubeen, S.; Rehman, M.; Cao, S.; Yue, J.; Pan, J.; Jin, G.; Li, R.; Chen, T.; et al. HcLEA113, a late embryogenesis abundant protein gene, positively regulates drought-stress responses in kenaf. Physiol. Plant 2024, 176, e14506. [Google Scholar] [CrossRef]
  28. Lim, C.W.; Lim, S.; Baek, W.; Lee, S.C. The pepper late embryogenesis abundant protein CaLEA1 acts in regulating abscisic acid signaling, drought and salt stress response. Physiol. Plant. 2015, 154, 526–542. [Google Scholar] [CrossRef]
  29. Lv, A.; Su, L.; Fan, N.; Wen, W.; Wang, Z.; Zhou, P.; An, Y. Chloroplast-targeted late embryogenesis abundant 1 increases alfalfa tolerance to drought and aluminum. Plant Physiol. 2023, 193, 2750–2767. [Google Scholar] [CrossRef]
  30. Guo, B.; Zhang, J.; Yang, C.; Dong, L.; Ye, H.; Valliyodan, B.; Nguyen, H.T.; Song, L. The Late Embryogenesis Abundant Proteins in soybean: Identification, expression analysis, and the roles of GmLEA4_19 in drought stress. Int. J. Mol. Sci. 2023, 24, 14834. [Google Scholar] [CrossRef]
  31. Jiang, Y.; Zhang, S.; Xu, H.; Tian, H.; Zhang, M.; Zhu, S.; Wang, C.; Hou, J.; Chen, G.; Tang, X.; et al. Identification of the BcLEA gene family and functional analysis of the BcLEA73 gene in Wucai (Brassica campestris L.). Genes 2023, 14, 415. [Google Scholar] [CrossRef] [PubMed]
  32. Zhang, X.; Lu, S.; Jiang, C.; Wang, Y.; Lv, B.; Shen, J.; Ming, F. RcLEA, a late embryogenesis abundant protein gene isolated from Rosa chinensis, confers tolerance to Escherichia coli and Arabidopsis thaliana and stabilizes enzyme activity under diverse stresses. Plant Mol. Biol. 2014, 85, 333–347. [Google Scholar] [CrossRef] [PubMed]
  33. Boucher, V.; Buitink, J.; Lin, X.; Boudet, J.; Hoekstra, F.A.; Hundertmark, M.; Renard, D.; Leprince, O. MtPM25 is an atypical hydrophobic late embryogenesis-abundant protein that dissociates cold and desiccation-aggregated proteins. Plant Cell Environ. 2010, 33, 418–430. [Google Scholar] [CrossRef] [PubMed]
  34. Wang, X.; Hu, Y.; Dong, Y.; Zhang, L.; Wang, B. Abiotic stress-regulated LEA gene mediates the response to drought, salinity, and cold stress in Medicago sativa L. Plant Cell Physiol. 2025, 66, 781–796. [Google Scholar] [CrossRef]
  35. Wang, W.; Liu, Y.; Kang, Y.; Liu, W.; Li, S.; Wang, Z.; Xia, X.; Chen, X.; Qian, L.; Xiong, X.; et al. Genome-wide characterization of LEA gene family reveals a positive role of BnaA.LEA6.a in freezing tolerance in rapeseed (Brassica napus L.). BMC Plant Biol. 2024, 24, 433. [Google Scholar] [CrossRef]
  36. Zhou, C.; Niu, S.; El-Kassaby, Y.A.; Li, W. Genome-wide identification of late embryogenesis abundant protein family and their key regulatory network in Pinus tabuliformis cold acclimation. Tree Physiol. 2023, 43, 1964–1985. [Google Scholar] [CrossRef]
  37. Doust, A.N.; Kellogg, E.A.; Devos, K.M.; Bennetzen, J.L. Foxtail millet: A sequence-driven grass model system. Plant Physiol. 2009, 149, 137–141. [Google Scholar] [CrossRef]
  38. Yang, Z.; Zhang, H.; Li, X.; Shen, H.; Gao, J.; Hou, S.; Zhang, B.; Mayes, S.; Bennett, M.; Ma, J.; et al. A mini foxtail millet with an Arabidopsis-like life cycle as a C(4) model system. Nat. Plants 2020, 6, 1167–1178. [Google Scholar] [CrossRef]
  39. Lata, C.; Gupta, S.; Prasad, M. Foxtail millet: A model crop for genetic and genomic studies in bioenergy grasses. Crit. Rev. Biotechnol. 2013, 33, 328–343. [Google Scholar] [CrossRef]
  40. Li, X.; Hou, S.; Feng, M.; Xia, R.; Li, J.; Tang, S.; Han, Y.; Gao, J.; Wang, X. MDSi: Multi-omics Database for Setaria italica. BMC Plant Biol. 2023, 23, 223. [Google Scholar] [CrossRef]
  41. Chen, C.; Chen, H.; Zhang, Y.; Thomas, H.R.; Frank, M.H.; He, Y.; Xia, R. TBtools: An integrative Toolkit developed for interactive analyses of big biological data. Mol. Plant 2020, 13, 1194–1202. [Google Scholar] [CrossRef] [PubMed]
  42. Tamura, K.; Stecher, G.; Kumar, S. MEGA11: Molecular Evolutionary Genetics Analysis Version 11. Mol. Biol. Evol. 2021, 38, 3022–3027. [Google Scholar] [CrossRef]
  43. Liu, H.; Lyu, H.M.; Zhu, K.; Van de Peer, Y.; Max Cheng, Z.M. The emergence and evolution of intron-poor and intronless genes in intron-rich plant gene families. Plant J. 2021, 105, 1072–1082. [Google Scholar] [CrossRef]
  44. Hanin, M.; Brini, F.; Ebel, C.; Toda, Y.; Takeda, S.; Masmoudi, K. Plant dehydrins and stress tolerance: Versatile proteins for complex mechanisms. Plant Signal Behav. 2011, 6, 1503–1509. [Google Scholar] [CrossRef]
  45. Cakir, B.; Agasse, A.; Gaillard, C.; Saumonneau, A.; Delrot, S.; Atanassova, R. A grape ASR protein involved in sugar and abscisic acid signaling. Plant Cell 2003, 15, 2165–2180. [Google Scholar] [CrossRef]
  46. Wang, C.S.; Liau, Y.E.; Huang, J.C.; Wu, T.D.; Su, C.C.; Lin, C.H. Characterization of a desiccation-related protein in lily pollen during development and stress. Plant Cell Physiol. 1998, 39, 1307–1314. [Google Scholar] [CrossRef]
  47. Cannon, S.B.; Mitra, A.; Baumgarten, A.; Young, N.D.; May, G. The roles of segmental and tandem gene duplication in the evolution of large gene families in Arabidopsis thaliana. BMC Plant Biol. 2004, 4, 10. [Google Scholar] [CrossRef]
Figure 1. Chromosome localization map of SiLEA genes in foxtail millet. Genes from different subfamilies were assigned different colors for visual distinction.
Genes 16 00932 g001
Figure 2. Phylogenetic analysis diagram of LEA genes in S. italica (Si), O. sativa (Os), S. bicolor (Sb), and Arabidopsis (At).
Genes 16 00932 g002
Figure 3. Conserved domains (A) and gene structures (B) of the SiLEA gene family in foxtail millet.
Genes 16 00932 g003
Figure 4. Cis-acting elements in promoter regions of SiLEA family genes in foxtail millet. (A) Distribution of cis-elements in promoter regions. Differently colored blocks represent distinct types of cis-elements and their positions within the 2000-bp upstream region of SiLEA genes. (B) Cis-element composition in promoters of individual SiLEA genes. Colors in the grid correspond to distinct cis-element types, and numbers indicate their counts, with vertical color bars corresponding to specific element types.
Genes 16 00932 g004
Figure 5. Synteny analysis of the SiLEA genes in foxtail millet.
Genes 16 00932 g005
Figure 6. Synteny analysis of LEA genes in foxtail millet with Arabidopsis, rice, and sorghum.
Genes 16 00932 g006
Figure 7. Tissue expression pattern analysis of SiLEA genes in foxtail millet.
Genes 16 00932 g007
Figure 8. Expression patterns of SiLEA_1 (A), SiLEA_2 (B), SiLEA_3 (C), SiLEA_4—SiLEA_6 (D), SiDehydrin (E), SiSMP (F), and SiASR (G) subfamily genes in the panicles of foxtail millet. Young panicles of Jingu 21 were collected at two developmental stages: the branch meristem differentiation stage (young panicle stage 1, approximately 1.0–1.5 mm) and the distinct formation stage (young panicle stage 2, approximately 2.5–3.0 mm). Statistical significance was determined by t-test (*: p < 0.05, **: p < 0.01, ***: p < 0.001, ****: p < 0.0001). TPM: Transcripts Per Million.
Genes 16 00932 g008
Figure 9. Expression patterns of SiLEA2-5 (A), SiLEA2-16 (B), SiLEA2-19 (C), SiLEA3-4 (D), SiASR-2 (E), SiASR-5 (F), SiASR-6 (G), and SiASR-7 (H) in the shoot of foxtail millet under ABA treatment. Three independent biological replicates yielded consistent results. Values represent means ± SE, with error bars showing replicate variability. Asterisks indicate statistically significant differences in SiLEA gene expression at 12 h, 24 h, and 48 h post-treatment relative to the 0 h untreated control (t-test; * p < 0.05, ** p < 0.01, *** p < 0.001, **** p < 0.0001).
Genes 16 00932 g009
Figure 10. Expression patterns of SiLEA2-5 (A), SiLEA2-16 (B), SiLEA2-19 (C), SiLEA2-21 (D), SiLEA3-4 (E), SiASR-2 (F), SiASR-5 (G), SiASR-6 (H), SiASR-7 (I), and SiDehydrin-2 (J) in the root of foxtail millet under ABA treatment. All experiments were performed three times with consistent results. Data are presented as mean ± SE. The error bars indicate variation among replicates. Asterisks denote significant differences in the expression levels of these SiLEA genes at 12 h, 24 h, and 48 h after ABA treatment compared to the untreated 0 h control. Statistical significance was determined by t-test (*: p < 0.05, **: p < 0.01, ***: p < 0.001, ****: p < 0.0001).
Genes 16 00932 g010
Table 1. Characterization of physicochemical features of SiLEA genes.
Gene NameGene IDGenomic LocationNumber of Amino AcidsMolecular Weight/KDpIGRAVYSubcellular
Localization
SiLEA1-1Si2g16530Chr2:23636372-23636878 (−)16816.549.39−0.489cyto
SiLEA1-2Si4g01700Chr4:588119-591858 (+)12513.499.84−0.889mito
SiLEA1-3Si4g12830Chr4:13541862-13542784 (−)10211.178.73−1.012nucl
SiLEA1-4Si6g11990Chr6:18263649-18264769 (+)15315.349.52−0.722nucl
SiLEA1-5Si7g22800Chr7:28695111-28695461 (+)11611.989.33−0.928mito
SiLEA2-1Si1g01120Chr1:336572-337207 (+)21121.6610.670.08golg
SiLEA2-2Si1g19260Chr1:26685069-26686200 (−)21222.889.230.212E.R.
SiLEA2-3Si1g27150Chr1:34072139-34073281 (+)19421.259.810.128mito
SiLEA2-4Si1g27250Chr1:34138008-34142334 (−)35137.8410.19−0.15cyto
SiLEA2-5Si2g08600Chr2:7511879-7515924 (−)25427.199.160.209chlo
SiLEA2-6Si2g10340Chr2:9405253-9405924 (−)22323.908.790.253chlo
SiLEA2-7Si2g10360Chr2:9408452-9409066 (−)20421.639.750.116cyto
SiLEA2-8Si2g11000Chr2:10739875-10741954 (−)31334.894.84−0.39cyto
SiLEA2-9Si2g16390Chr2:23233404-23234406 (+)20822.778.030.046chlo
SiLEA2-10Si2g22270Chr2:31975586-31976874 (+)26228.6910.120.093chlo
SiLEA2-11Si2g28910Chr2:38432920-38434042 (−)22323.699.350.252E.R.
SiLEA2-12Si2g33820Chr2:42245927-42247204 (−)18819.979.020.534extr
SiLEA2-13Si2g33830Chr2:42252870-42253532 (−)22023.039.080.357plas
SiLEA2-14Si2g34050Chr2:42443262-42444234 (+)20222.739.08−0.071chlo
SiLEA2-15Si3g01780Chr3:462543-463202 (+)21924.238.140.144cyto
SiLEA2-16Si3g01790Chr3:466092-466709 (+)20522.009.030.286chlo
SiLEA2-17Si3g11500Chr3:7657823-7660021 (−)29330.0510.070.084chlo
SiLEA2-18Si3g13070Chr3:8966951-8968514 (−)24024.8410.260.225cyto
SiLEA2-19Si3g13090Chr3:8974973-8975607 (+)17018.775.56−0.155nucl
SiLEA2-20Si3g16980Chr3:12605559-12606344 (+)26127.458.090.168cyto
SiLEA2-21Si3g19790Chr3:15198175-15199340 (−)21422.6610.330.43plas
SiLEA2-22Si3g28330Chr3:27459991-27460596 (−)20120.549.410.514chlo
SiLEA2-23Si5g01580Chr5:514279-515232 (−)31733.2710.88−0.295chlo
SiLEA2-24Si5g02490Chr5:1883173-1883628 (+)15116.306.11−0.028cyto
SiLEA2-25Si5g14240Chr5:12401284-12403251 (−)29630.599.850.095chlo
SiLEA2-26Si5g21720Chr5:27447618-27448559 (−)31332.3011.03−0.07chlo
SiLEA2-27Si5g24710Chr5:30809909-30810829 (+)17519.065.01−0.102cyto
SiLEA2-28Si5g31440Chr5:36949347-36950099 (+)25026.855.300.006cyto
SiLEA2-29Si5g35890Chr5:40487066-40488603 (+)32635.269.78−0.12chlo
SiLEA2-30Si5g39230Chr5:42968053-42969146 (−)23225.369.57−0.14E.R.
SiLEA2-31Si5g39250Chr5:42971994-42973145 (−)24126.709.49−0.26chlo
SiLEA2-32Si6g01320Chr6:331589-333238 (−)27429.908.550.37plas
SiLEA2-33Si6g01330Chr6:334758-335402 (−)21423.469.230.30cyto
SiLEA2-34Si6g19520Chr6:30784863-30786086 (−)25028.0510.310.09chlo
SiLEA2-35Si7g10930Chr7:19450879-19452721 (−)21923.638.200.28extr
SiLEA2-36Si7g25560Chr7:30769688-30770332 (+)21423.729.68−0.06chlo
SiLEA2-37Si7g30030Chr7:34042880-34046298 (+)20922.958.280.137chlo
SiLEA2-38Si7g30060Chr7:34053641-34054255 (+)20422.238.760.038chlo
SiLEA2-39Si7g30680Chr7:34528844-34529524 (−)22624.169.430.123chlo
SiLEA2-40Si7g31120Chr7:34820864-34836496 (−)64170.629.68−0.299E.R.
SiLEA2-41Si8g01520Chr8:523055-523933 (+)29231.6610.99−0.144cyto
SiLEA2-42Si8g02080Chr8:876708-877391 (+)22724.169.430.176chlo
SiLEA2-43Si8g04550Chr8:2883748-2884377 (−)20923.158.930.125chlo
SiLEA2-44Si9g01150Chr9:272503-273129 (−)20822.089.120.084chlo
SiLEA2-45Si9g02550Chr9:1053385-1056778 (+)31234.515.00−0.372cyto
SiLEA2-46Si9g02980Chr9:1300575-1301207 (−)21022.628.000.249extr
SiLEA2-47Si9g02990Chr9:1322153-1322803 (−)21623.289.100.133chlo
SiLEA2-48Si9g12880Chr9:8342829-8345960 (−)26629.279.30−0.006cyto
SiLEA2-49Si9g18470Chr9:13483147-13483770 (−)20722.108.970.263cyto
SiLEA2-50Si9g20420Chr9:15461936-15464333 (+)27429.6610.16−0.111E.R.
SiLEA2-51Si9g44540Chr9:50296499-50297353 (+)23624.859.230.358chlo
SiLEA3-1Si1g20730Chr1:28206279-28206890 (+)909.419.99−0.186chlo
SiLEA3-2Si3g20020Chr3:15406559-15407221 (−)22023.1011.98−0.709nucl
SiLEA3-3Si3g26430Chr3:23674062-23679744 (+)9710.395.45−0.218chlo
SiLEA3-4Si5g03150Chr5:2342818-2343221 (+)949.829.86−0.339chlo
SiLEA3-5Si5g03160Chr5:2347482-2347907 (+)9610.2510.08−0.165chlo
SiLEA3-6Si5g06480Chr5:5284677-5284979 (+)1009.9410.130chlo
SiLEA3-7Si6g17070Chr6:28370327-28370969 (+)9610.289.18−0.309chlo
SiLEA3-8Si9g36850Chr9:44011390-44011988 (+)13314.639.62−0.418chlo/mito
SiLEA4-1Si3g16110Chr3:11735612-11736926 (−)20621.118.53−1.176nucl
SiLEA4-2Si7g24200Chr7:29717629-29719407 (+)30532.209.02−0.89chlo
SiLEA4-3Si9g41270Chr9:47738247-47740023 (+)36538.497.66−0.936mito
SiLEA4-4Si9g51210Chr9:55387138-55388377 (+)37038.087.73−0.904extr
SiLEA5-1Si3g26920Chr3:24540051-24540652 (−)15316.425.74−1.380 nucl
SiLEA5-2Si3g26930Chr3:24544064-24545146 (−)939.805.48−1.280 nucl
SiLEA6-1Si2g25470Chr2:35395735-35396088 (−)11712.326.41−0.925nucl
SiDehydrin-1Si1g27340Chr1:34224000-34226135 (−)49954.809.14−0.964chlo
SiDehydrin-2Si5g17250Chr5:16894582-16895605 (−)13814.139.19−1.178nucl
SiDehydrin-3Si5g17260Chr5:16946844-16947365 (+)13814.108.90−1.192nucl
SiDehydrin-4Si5g29160Chr5:35231709-35232485 (+)22322.846.41−0.843nucl
SiDehydrin-5Si8g11920Chr8:21137495-21138260 (+)18619.219.68−1.003chlo
SiDehydrin-6Si8g11930Chr8:21187756-21189264 (−)34733.748.99−0.804nucl
SiDehydrin-7Si8g11970Chr8:21285230-21286503 (−)16916.918.81−1.050 nucl
SiSMP-1Si1g21980Chr1:29302808-29303751 (−)16716.165.15−0.139cyto
SiSMP-2Si1g22010Chr1:29340219-29340650 (−)14314.125.88−0.145cyto
SiSMP-3Si1g22030Chr1:29358375-29358806 (−)14314.275.89−0.176cyto
SiSMP-4Si4g14860Chr4:21785714-21787597 (−)28828.984.63−0.307cyto
SiSMP-5Si6g13010Chr6:20828940-20830271 (+)18117.604.84−0.317cyto
SiSMP-6Si9g09570Chr9:5850754-5852099 (+)34234.686.00 −0.219chlo
SiSMP-7Si9g24110Chr9:19527196-19528646 (−)26326.384.64−0.419nucl
SiSMP-8Si9g51720Chr9:55837685-55838706 (+)28027.754.65−0.195cyto
SiASR-1Si1g19510Chr1:27087304-27087745 (−)10711.826.76−1.19mito
SiASR-2Si5g45980Chr5:47661506-47662123 (+)17319.386.26−1.277mito
SiASR-3Si5g45990Chr5:47665510-47665827 (−)10511.719.73−1.147nucl
SiASR-4Si5g46000Chr5:47666703-47667492 (+)10211.549.80 −1.372nucl
SiASR-5Si7g11260Chr7:19766534-19766938 (−)10111.486.81−1.366mito
SiASR-6Si7g11270Chr7:19769468-19771182 (−)24426.005.03−1.636nucl
SiASR-7Si7g29600Chr7:33748100-33749135 (+)13815.455.88−1.30mito
SiASR-8Si8g05130Chr8:3530617-3531156 (−)13715.426.15−1.35mito
Table 2. Ka/Ks ratios of segmental duplicated gene pairs in the SiLEA genes.
Homologous GeneNon-Synonymous SubstitutionSynonymous SubstitutionKa/Ks
SiLEA2-2-SiLEA2-350.250.570.44
SiASR-1-SiASR-50.10.460.21
SiLEA2-2-SiLEA2-370.40.341.18
SiLEA2-2-SiLEA2-430.420.351.19
SiLEA1-1-SiLEA1-40.380.680.56
SiLEA2-8-SiLEA2-450.19NaNNaN
SiLEA2-19-SiLEA2-270.240.420.56
SiLEA2-20-SiLEA2-280.30.40.75
SiLEA2-17-SiLEA2-250.280.410.68
SiLEA3-3-SiLEA3-50.490.640.76
SiLEA2-16-SiLEA2-300.880.651.34
SiLEA2-16-SiLEA2-320.440.431.03
SiLEA2-15-SiLEA2-370.450.441.02
SiLEA2-15-SiLEA2-330.310.530.58
SiLEA2-21-SiLEA2-390.550.60.92
SiLEA2-21-SiLEA2-420.550.630.88
SiLEA2-29-SiLEA2-400.610.620.98
SiLEA2-29-SiLEA2-410.510.481.06
SiLEA2-35-SiLEA2-370.390.490.79
SiLEA2-35-SiLEA2-430.480.530.91
SiLEA2-39-SiLEA2-420.020.080.24
SiASR-7-SiASR-80.110.240.47
SiLEA2-37-SiLEA2-430.180.430.42
SiSMP-7-SiSMP-80.340.510.67
Disclaimer/Publisher’s Note: The statements, opinions and data contained in all publications are solely those of the individual author(s) and contributor(s) and not of MDPI and/or the editor(s). MDPI and/or the editor(s) disclaim responsibility for any injury to people or property resulting from any ideas, methods, instructions or products referred to in the content.

