


Abstract
Alpine pastoral areas suffer seasonal forage shortages, and seasonally idle manure-enriched livestock corrals offer potential for forage production, yet the effect of species proportion remains unclear. We tested the hypothesis that mixture ratio, rather than simply increasing forage-pea proportion, determines the system-level performance of oat–forage pea mixtures under high-nutrient corral soil conditions. A two-year field experiment was carried out with monocultures and three oat–forage pea mixed-sowing treatments. The 1:1 mixture yielded the highest dry-matter and crude-protein production among mixed groups. Oat exhibited consistent competitive dominance across all ratios. All mixtures showed land-use advantage with land equivalent ratio >1. Increasing forage-pea proportion improved forage nutritional quality but reduced total biomass yield. The 1:1 treatment achieved the best comprehensive trade-off among forage yield, nutritional quality, land-use efficiency and economic return. Our results suggest that optimizing mixing composition instead of blindly raising legume share is critical for productive utilization of seasonally idle alpine corrals.
1. Introduction
The Qinghai–Tibet Plateau is characterized by low temperatures, short growing seasons, and strong climatic constraints on forage production [1]. Seasonal feed shortages therefore remain a major bottleneck restricting livestock production. During the cold season, natural pasture suffers sharp declines in forage yield and nutritive value, resulting in widespread livestock weight loss [2]. Expanding local forage supply without over-exploiting natural grasslands is therefore critical for the sustainable development of alpine pastoral systems. Seasonally idle livestock corrals represent a unique under-utilized land resource in alpine pastoral regions. A large quantity of livestock manure accumulates inside corrals during cold-season confinement. Once livestock are transferred to summer pastures, these lands become temporarily available for cultivation [3]. Planting annual forage crops during this idle window can make full use of manure-derived soil nutrients, produce winter-reserved forage, and promote nutrient recycling while relieving grazing pressure on natural grasslands [4]. Nevertheless, oat monoculture dominates current corral forage-planting practices, and the agronomic potential of mixed-sowing modes has not been well exploited [3]. Long-term livestock confinement creates soil hotspots enriched in organic matter, nitrogen, phosphorus and potassium [5]. If left fallow after livestock transfer, these nutrient-rich corral soils also face potential risks of nutrient leaching and loss. Therefore, exploring reasonable planting strategies for these special manure-accumulated sites carries both production-oriented and ecological significance.
Cereal–legume mixed sowing is widely recognized as an efficient cropping strategy. Complementary niche utilization between cereals and legumes can improve resource capture, forage yield and feed quality [6]. Legumes obtain nitrogen via symbiotic N2 fixation, while cereals possess rapid above- and below-ground resource-acquisition capacity [7]. Differences in canopy structure, rooting depth and resource demand reduce niche overlap and facilitate complementarity. A large body of domestic and international studies has demonstrated that oat–forage pea mixtures outperform monocultures under conventional farmland conditions: appropriate mixing ratios increase biomass yield, raise crude-protein content, and improve land-use efficiency [8]. Oat is characterized by rapid establishment and high biomass production [9], whereas forage pea contributes protein-rich biomass and symbiotic N2 fixation. Differences in rooting architecture and growth strategy can promote complementary resource capture [8], while the structural support provided by oat stems may also facilitate the climbing growth of forage pea [9]. In high-fertility soils, cereal competitive capacity may increase. Similar inhibitory effects of high soil nitrogen on legume performance have been reported in other cereal–pea intercropping systems [10], although such responses remain poorly documented for oat–forage pea mixtures in manure-enriched alpine corrals [11,12]. Previous studies have demonstrated that oat–forage pea mixtures can improve forage production and land-use efficiency relative to monocultures [8], but their performance is strongly dependent on mixture ratio. A low forage pea proportion may limit the legume contribution to forage quality, whereas excessive forage pea representation may reduce the biomass contribution of the more productive cereal component. Therefore, the optimum mixture should not necessarily be defined by maximum biomass alone, but by the balance among biomass production, protein yield, nutritional quality, land-use efficiency, and competitive interactions.
Despite these advances, little is known about cereal–legume mixture performance in manure-enriched alpine corrals, which differ substantially from conventional croplands in soil nutrients and land-use history. Three major uncertainties persist: whether higher forage-pea proportions consistently improve system performance, whether high soil nutrient availability creates competitive dominance for oat, and whether the biomass-maximizing seeding ratio simultaneously optimizes forage quality, land-use efficiency and economic returns. Superior performance in a single agronomic trait does not guarantee favorable whole-system outcomes. Therefore, integrated assessments of productivity, forage quality, interspecific interactions and economic benefits are essential to test whether mixed sowing can convert seasonally idle manure-rich corrals into productive forage systems, rather than simply reproducing benefits reported from ordinary farmlands (Figure 1).
Figure 1.
Conceptual framework for evaluating oat–forage pea mixed sowing, interspecific interactions, forage performance, and system-level outcomes in manure-enriched alpine corrals. Note: This conceptual figure was manually assembled and edited by the authors using Microsoft PowerPoint. Partial vector graphic components were sourced from AI-generated graphic resources, while the overall layout, logical framework, labels, and text content were redesigned by the authors for the present study; the complete final figure was not directly generated by artificial intelligence.
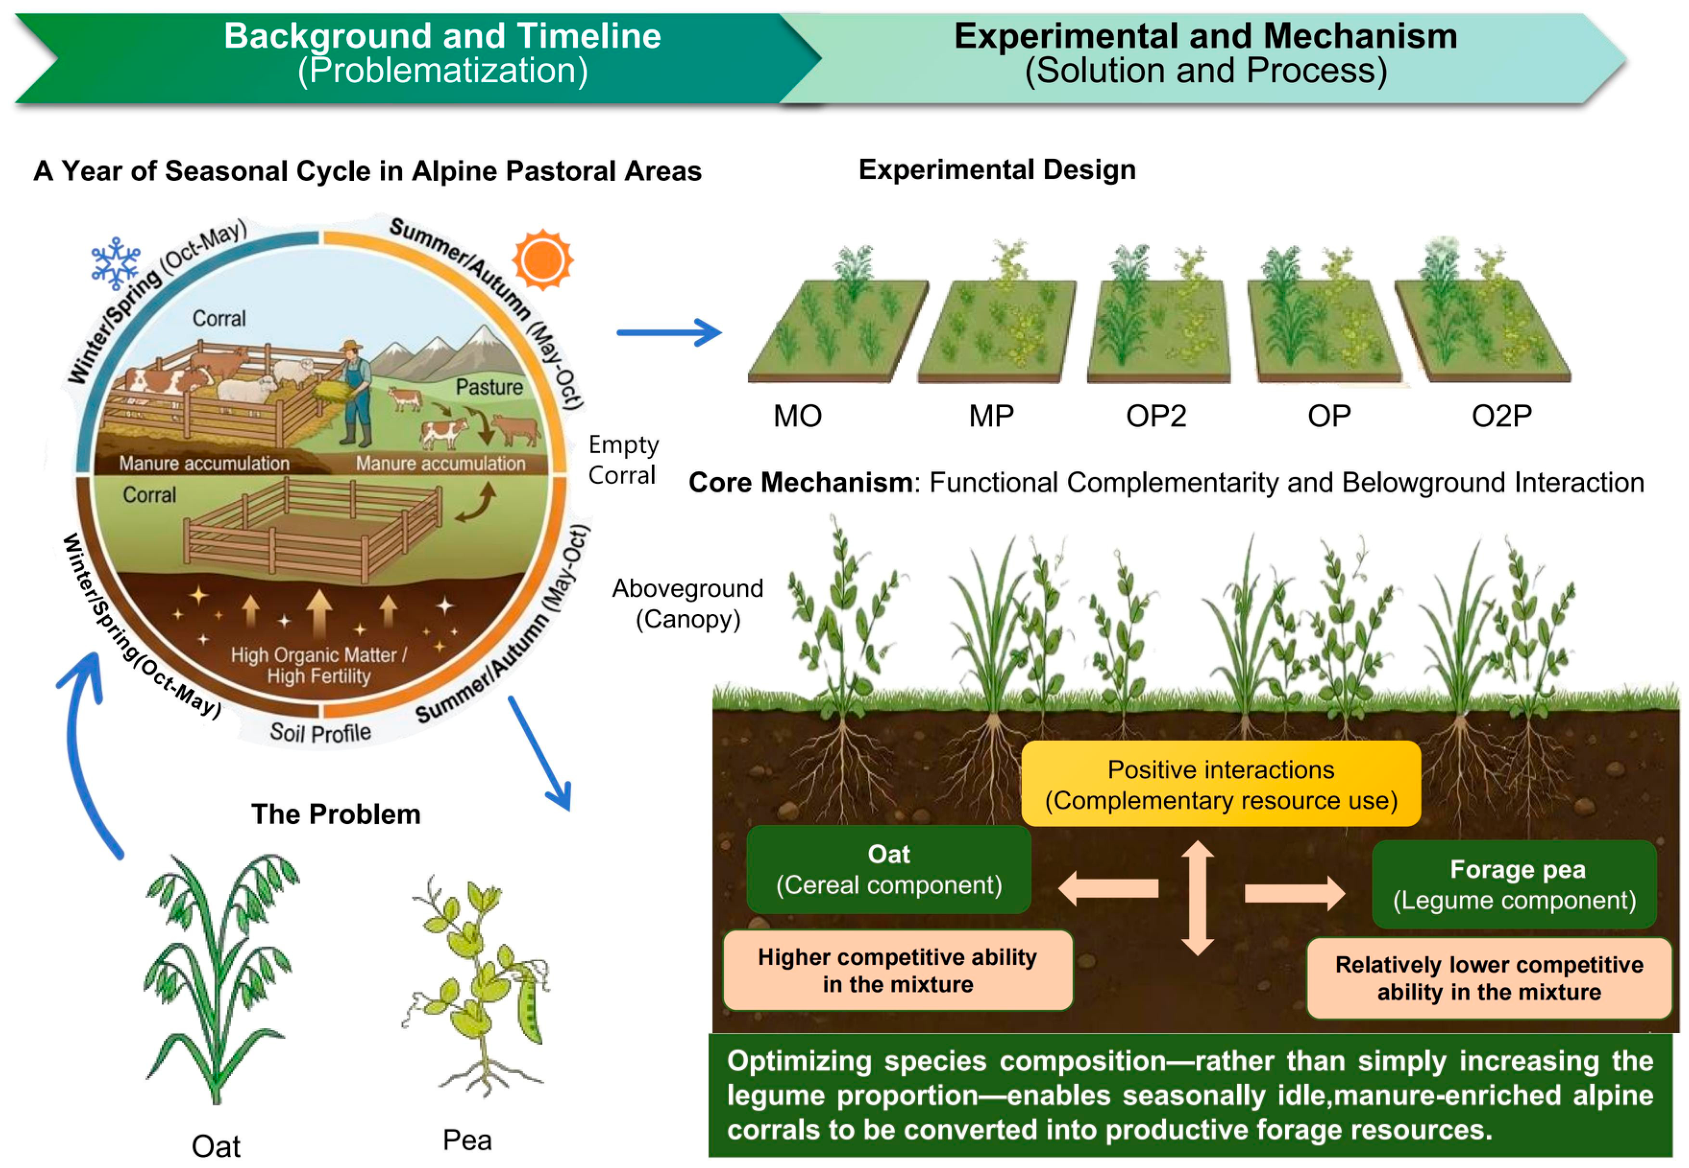
Accordingly, this two-year field experiment on the Qinghai–Tibet Plateau investigated oat–forage pea mixed-sowing across different seeding ratios in manure-enriched alpine corrals. We assessed forage yield, crude-protein output, nutritional quality, interspecific competitive relationships, land-use efficiency and economic performance. This study aimed to reveal how seeding ratio modulates the competitive balance between oat and forage pea, and whether this balance achieves comprehensive agronomic and economic benefits at the system scale. We hypothesized that: (1) mixed sowing would produce higher dry-matter and crude-protein yields than monocultures; (2) seeding ratio would reshape the oat–forage pea competitive balance and further modify land-use efficiency and forage quality; (3) trade-offs would occur among productivity, forage quality, land-use benefit and economic return, and optimal system performance would rely on balancing oat competitiveness and forage-pea contributions.
2. Materials and Methods
2.1. Test Materials
The oat cultivar used in this study was Avena sativa L. cv. Qingyin No. 1, and the forage pea cultivar was Pisum sativum subsp. arvense cv. Qingjian No. 1. Both cultivars were provided by the Grassland Research Institute, Qinghai Academy of Animal and Veterinary Sciences, and are widely adapted forage cultivars for alpine production systems in Qinghai Province.
The pea cultivar used in this experiment was forage pea (Pisum sativum subsp. arvense). This subspecies is characterized by a pigmented seed coat, colored flowers and relatively high tannin content, and is suitable for forage production in alpine pastoral areas.
2.2. Experimental Site
A two-year field experiment was conducted during the 2023 and 2024 growing seasons in Haiyan County, Haibei Tibetan Autonomous Prefecture, Qinghai Province, China (36.93° N, 100.86° E; altitude 3132 m). The experimental site was located within an alpine livestock corral system on the eastern Qinghai–Tibet Plateau.
The region has a typical alpine semi-arid climate characterized by low temperatures, short growing seasons, long winters, and uneven precipitation distribution. The mean annual temperature is approximately 1.5 °C, with an annual sunshine duration of approximately 2980 h. Frost events, hail, drought, and strong winds frequently occur, creating constraints for annual forage crop production.
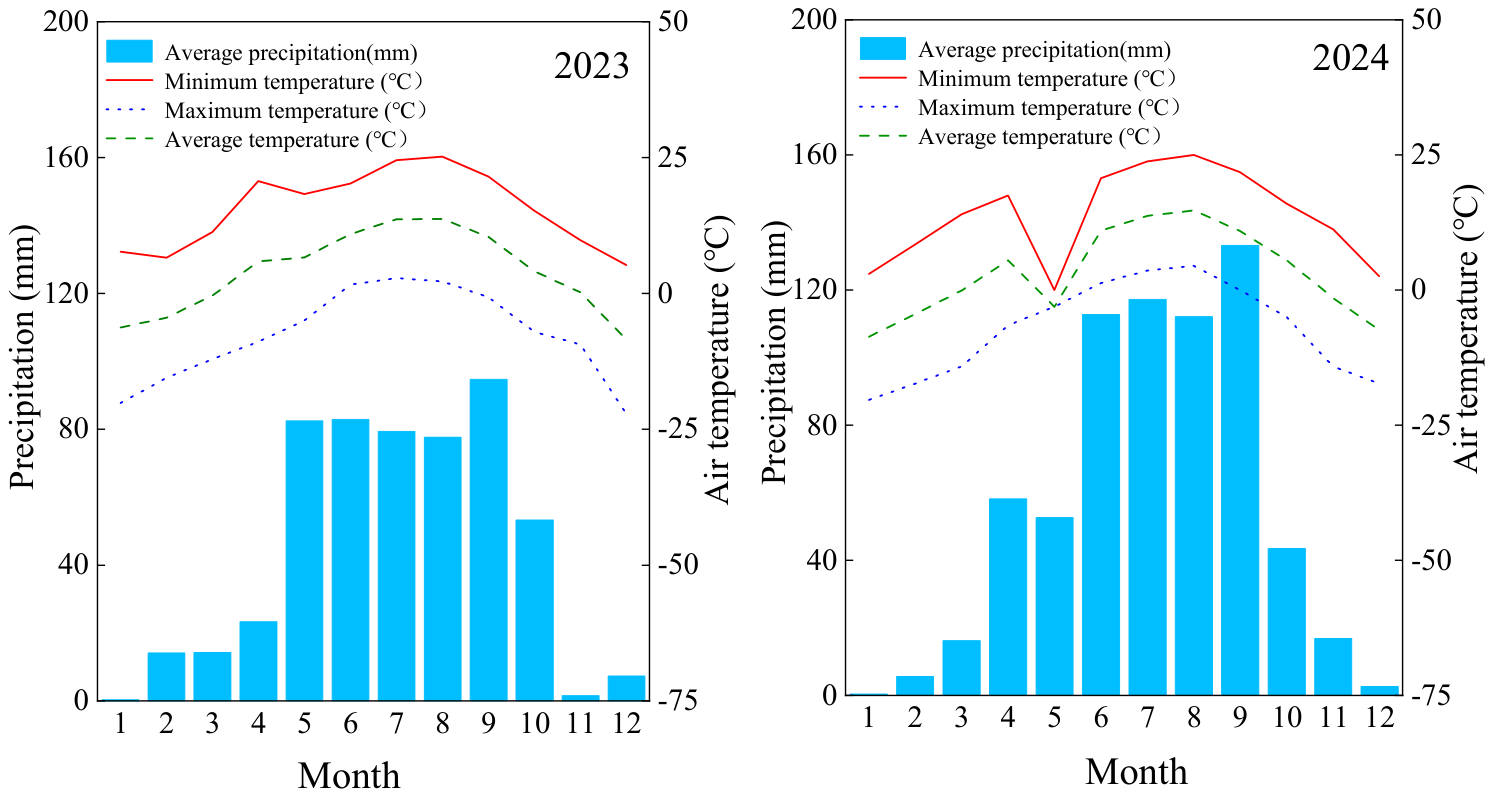
Monthly air-temperature and precipitation data for the 2023 and 2024 growing seasons were obtained from the nearest regional national meteorological station (Haiyan County meteorological station; 36.9057° N, 100.9916° E). The straight-line great-circle distance between this station and our experimental site (36.93° N, 100.86° E) is approximately 11 km. No on-site automatic meteorological instruments were deployed within the experimental plots.
After livestock were transferred to summer pastures, the corral area was used as a temporary annual forage field. Before establishment of the experiment in 2023, the site had been used primarily for winter livestock confinement and had not previously been managed for crop production. Long-term livestock activity resulted in organic manure accumulation, creating a nutrient-enriched soil environment with substantial potential for forage crop production.
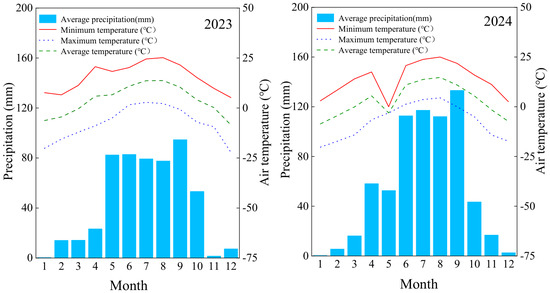
Monthly precipitation and temperature during the 2023 and 2024 growing seasons are presented in Figure 2.
Figure 2.
Monthly precipitation and temperature at the experimental site during 2023 and 2024.
Soil samples were collected at harvest in both 2023 and 2024. A five-point sampling method was applied, with five sampling points selected within each experimental plot. Soil subsamples from each plot were thoroughly mixed; plant roots and litter debris were removed. The composite soil sample was then divided into two aliquots. One aliquot was placed in 20 mL sterile centrifuge tubes, preserved in liquid nitrogen, and sent to Shanghai Personalbio Biotechnology Co., Ltd. (Shanghai, China) for high-throughput sequencing. The second aliquot was packed into sterile plastic zip-lock bags and transported back to the laboratory for the determination of soil physicochemical properties. The samples were air-dried, ground, and sieved before chemical analysis. Soil organic matter was determined using the potassium dichromate oxidation–external heating method according to NY/T 1121.6-2006 [13]. Total nitrogen was determined using the Kjeldahl method according to LY/T 1228-2015 [14]. Total phosphorus was determined after sodium hydroxide (NaOH) fusion using the molybdenum–antimony colorimetric method according to LY/T 1232-2015 [15]. Total potassium was determined after NaOH fusion using flame photometry according to LY/T 1234-2015 [16]. Alkali-hydrolyzable nitrogen was measured by the diffusion method according to LY/T 1228-2015; available phosphorus was measured by molybdenum-antimony colorimetry after extraction according to LY/T 1232-2015; available potassium was determined by flame photometry after ammonium.
The initial soil properties of the experimental site measured before sowing in 2023 were as follows: soil organic matter, 69.31 g·kg−1; total nitrogen, 2.36 g·kg−1; total phosphorus, 0.98 g·kg−1; total potassium, 13.35 g·kg−1; alkali-hydrolyzable nitrogen, 173.28 mg·kg−1; available phosphorus, 6.95 mg·kg−1; available potassium, 117.19 mg·kg−1.
2.3. Experimental Design and Crop Management
After livestock were transferred to summer pastures, the manure accumulated naturally during winter confinement was spread as evenly as possible across the corral surface. Excess surface manure was removed, leaving an approximately 1–2 cm manure-containing surface layer. The field was then deeply tilled using a rotary tiller. Gravel and residual shrub roots were removed, large soil clods were broken up, and the soil surface was leveled before sowing. Because manure deposition and removal varied under routine corral management, the mass and nutrient composition of the residual manure incorporated into the soil were not quantified. The fertility status of the cultivated soil was therefore characterized using soil physicochemical properties measured after field preparation and before sowing.
The experiment was independently established in May 2023 and May 2024 using a completely randomized design. The plots were newly laid out and independently randomized in each year; therefore, the plots used in 2023 and 2024 were not the same. Five sowing treatments were evaluated: sole oat (MO), sole forage pea (MP), and three oat–forage pea mixtures with different sowing ratios (O2P, OP, and OP2). The mixture ratios and corresponding seeding rates are presented in Table 1.
Table 1.
Mixture ratios and seeding rates of oat and forage pea under different cropping systems.
Each treatment comprised four independently randomized replicate plots in each year, and each plot measured 8 m × 16 m (128 m2). The monoculture seeding rates were 187.5 kg ha−1 for oat and 120 kg ha−1 for forage pea. The seeding rates for each species in mixed-sown plots were calculated as a proportion of their respective optimal monoculture seeding rates, which were determined based on long-term local field cultivation practice in alpine pastoral areas. For the mixed-sowing treatments, the seeding rates of the two species were adjusted proportionally relative to their respective monoculture rates. All treatments were established by broadcast sowing. No additional fertilizer, irrigation, or pest-control measures were applied after sowing.
2.3.1. Forage Yield Determination and Sampling
Forage was harvested on 28 September 2023 and 15 September 2024. At harvest, oat plants were mainly at the heading to milk stage, whereas forage pea plants were mainly at the flowering to early pod-setting stage, representing the typical forage utilization stage under the short growing-season conditions of alpine regions.
Two representative sampling quadrats (5 m × 5 m) were randomly selected within each plot while avoiding border effects. Aboveground biomass was harvested separately from each quadrat, and the measurements from the two quadrats were averaged to obtain a single plot-level value. Each plot was treated as the experimental unit, resulting in four independent replicates per treatment within each year (n = 4).
Samples were first oven-dried at 105 °C for 40 min as a short high-temperature pretreatment to rapidly inactivate enzymes before subsequent drying at 65 °C [17]. Dry matter concentration was calculated as the ratio of dry weight to fresh weight. Dry matter yield was calculated by multiplying fresh biomass yield by dry matter concentration and expressed as kg ha−1.
For mixed cropping treatments, harvested biomass was manually separated into oat and forage pea components before drying to determine species-specific biomass contribution and for subsequent nutritional analysis.
2.3.2. Forage Nutritional Quality Analysis
After drying, forage samples were ground and passed through a suitable sieve before chemical analysis. The samples were thoroughly homogenized to ensure uniformity and used for the determination of forage nutritional quality traits. Crude protein (CP) content was determined using the Kjeldahl method according to DIN EN ISO 20483:2013 [18]. The underlying principle and analytical procedure of the Kjeldahl method have been comprehensively described in a previous review [19]. Ether extract (EE) content was determined by the Soxhlet extraction method according to ISO 659:1998 [20]; relevant methodological descriptions can be found in Thiex et al. [21]. Acid detergent fiber (ADF) and neutral detergent fiber (NDF) contents were determined by the Van Soest method according to ISO 13906:2008 [22,23]. Crude ash (Ash) content was measured following AOAC Official Method 942.05 (ISO 5984:2022 [24]). A detailed collaborative validation of this official method has been reported by Thiex et al. [25].
2.3.3. Land Use and Interspecific Relationships
(1) Land equivalent ratio (LER) [26]:
where LERp and LERo represent the partial land equivalent ratios of forage pea and oat in the oat–forage pea mixed-sowing system, respectively. Ypo and Yop represent the yields of forage pea and oat in the mixed-sowing system, respectively, whereas Ypp and Yoo represent their corresponding monoculture yields. An LER value greater than 1 indicates a land-use advantage of mixed sowing relative to the corresponding monocultures.
Yield increase rate (YIR) [27]:
where YIR represents the yield increase rate of the oat–forage pea mixed-sowing system; Ypo and Yop represent the yields of forage pea and oat in the mixed-sowing system, respectively, whereas Ypp and Yoo represent their corresponding monoculture yields. Pp and Po represent the sowing proportions of forage pea and oat in the mixed-sowing system, respectively, with Pp + Po = 1.
Relative yield (RY) [28]:
where RYp and RYo are the relative yields of pea and oat, respectively; Pp and Po are the mixing ratios of pea and oat, respectively, with Pp + Po = 1; Ypp and Yoo are the monoculture yields of pea and oat, respectively; Ypo is the yield of pea in the pea–oat mixed-sowing system; Yop is the yield of oat in the pea–oat mixed-sowing system.
Competition ratio (CR) [29]:
where CRp is the competitive ratio of pea in the mixed-sowing system; CRo is the competitive ratio of oat in the mixed-sowing system.
Aggressivity (AG) [26]:
where AGp is the aggressivity of pea in the mixed-sowing system; AGo is the aggressivity of oat in the mixed-sowing system; when AGp > 0 and AGo < 0, pea is the dominant species in the mixture; when the opposite is true, oat is the dominant species; when AGp = AGo = 0, the two forage species have equal competitive ability.
The system productivity index (SPI), following Odo (1991) [30], was used to evaluate overall system productivity of mixed-sown communities. This index converts legume forage-pea yield into oat-equivalent yield using the monoculture yield ratio, and it is suitable for broadcast mixed-sowing systems in which species do not occupy spatially separated sub-plots.
where Yop and Ypo are mixed-sown yields of oat and forage pea in mixed-sown plots, respectively; Yoo is the yield of oat under monoculture; Ypp is the yield of forage pea under monoculture.
2.4. Economic Analysis
Economic performance of oat–forage pea mixtures was evaluated based on partial budget analysis. The costs considered included seed inputs, machinery operations, and labor requirements. Seed costs were calculated according to the actual seeding rates of each treatment. The seed prices were 5.5 CNY kg−1 for oat and 14.0 CNY kg−1 for forage pea.
Because the experiment was conducted at a small field scale, machinery and labor costs were calculated based on the actual field operation expenses and converted to a hectare basis. The total field operation cost was estimated at 4900 CNY ha−1, including machinery (2500 CNY ha−1) and labor (2400 CNY ha−1).
Gross revenue was calculated using local forage prices provided by the field-site management staff in Haiyan County, Qinghai Province. The prices represented prevailing local purchase prices during the corresponding harvest years. Oat hay was valued at 1500 and 1600 CNY t−1 in 2023 and 2024, respectively; oat–forage pea mixed hay was valued at 1550 and 1650 CNY t−1, respectively; and forage pea hay was valued at 1700 and 1800 CNY t−1, respectively. Net return was calculated as gross revenue minus total production cost. The benefit–cost ratio (BCR) was calculated as gross revenue divided by total production cost.
2.5. Statistical Analysis
Statistical analyses were performed using SPSS Statistics 26.0 (IBM Corp., Armonk, NY, USA) and R software version 4.5.2. Within each experimental year, differences among cropping treatments were evaluated using one-way analysis of variance (ANOVA), followed by Tukey’s HSD multiple range test for mean separation at p < 0.05. These analyses were used to compare dry matter yield, crude protein yield, nutritional quality traits, interspecific interaction indices, and system performance indices among the applicable treatments.
To assess the effects of inter-annual variation on forage productivity, dry matter yield and crude protein yield were analyzed using two-way ANOVA, with year (2023 and 2024), cropping treatment (MO, O2P, OP, OP2, and MP), and their interaction as fixed effects. For dry matter yield and crude protein yield, four field replicates per treatment within each year were used. Crude protein yield was calculated for each replicate as the product of plot-level dry matter yield and the corresponding crude protein concentration.
A separate two-way ANOVA was conducted to evaluate the effects of year, mixture ratio, and their interaction within the mixed-sowing systems. This analysis included only the three mixed-sowing treatments (O2P, OP, and OP2), because interspecific interaction indices were defined specifically for mixed stands. Response variables included nutritional quality traits (CP, EE, Ash, ADF, and NDF) of the oat component, forage pea component, and harvested mixed forage; component-level interspecific interaction indices, including partial land equivalent ratio (LER), relative yield (RY), competition ratio (CR), and aggressivity (AG); and system-level performance indices, including land equivalent ratio (LER), yield increase rate (YIR), and system productivity index (SPI). Year (2023 and 2024), mixture ratio (O2P, OP, and OP2), and their interaction were treated as fixed effects.
Redundancy analysis (RDA) was used to examine multivariate associations between interspecific interactions and forage nutritional quality. At the component level, CP, EE, ADF, and NDF were treated as response variables, with partial LER and CR as explanatory variables for oat and forage pea separately. At the system level, mixed-forage CP, EE, ADF, and NDF were treated as response variables, whereas LER, YIR, and SPI were used as explanatory variables. The significance of the overall RDA models, canonical axes, and marginal effects of explanatory variables was evaluated using permutation tests. Adjusted R2 was used to quantify the proportion of explained variation, and variance inflation factors were examined for the system-level explanatory variables to assess multicollinearity.
Spearman correlation analysis was additionally performed to quantify pairwise associations between nutritional quality traits and interspecific interaction or system performance indices. At the component level, CP, EE, ADF, and NDF were correlated with partial LER, RY, CR, and AG for oat and forage pea separately. At the system level, mixed-forage CP, EE, ADF, and NDF were correlated with LER, YIR, and SPI. Statistical significance was assessed at p < 0.05. Figures were generated using Origin 2021 and R.
For all statistical analyses, the plot was treated as the experimental unit. The two quadrat-level measurements within each plot were averaged before analysis; therefore, each treatment had four independent plot-level replicates within each year (n = 4).
3. Results
3.1. Effects of Mixture Ratios on Forage Productivity
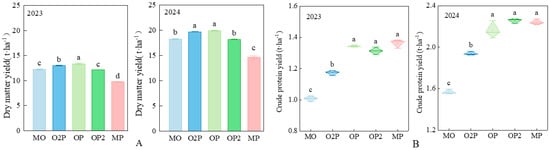
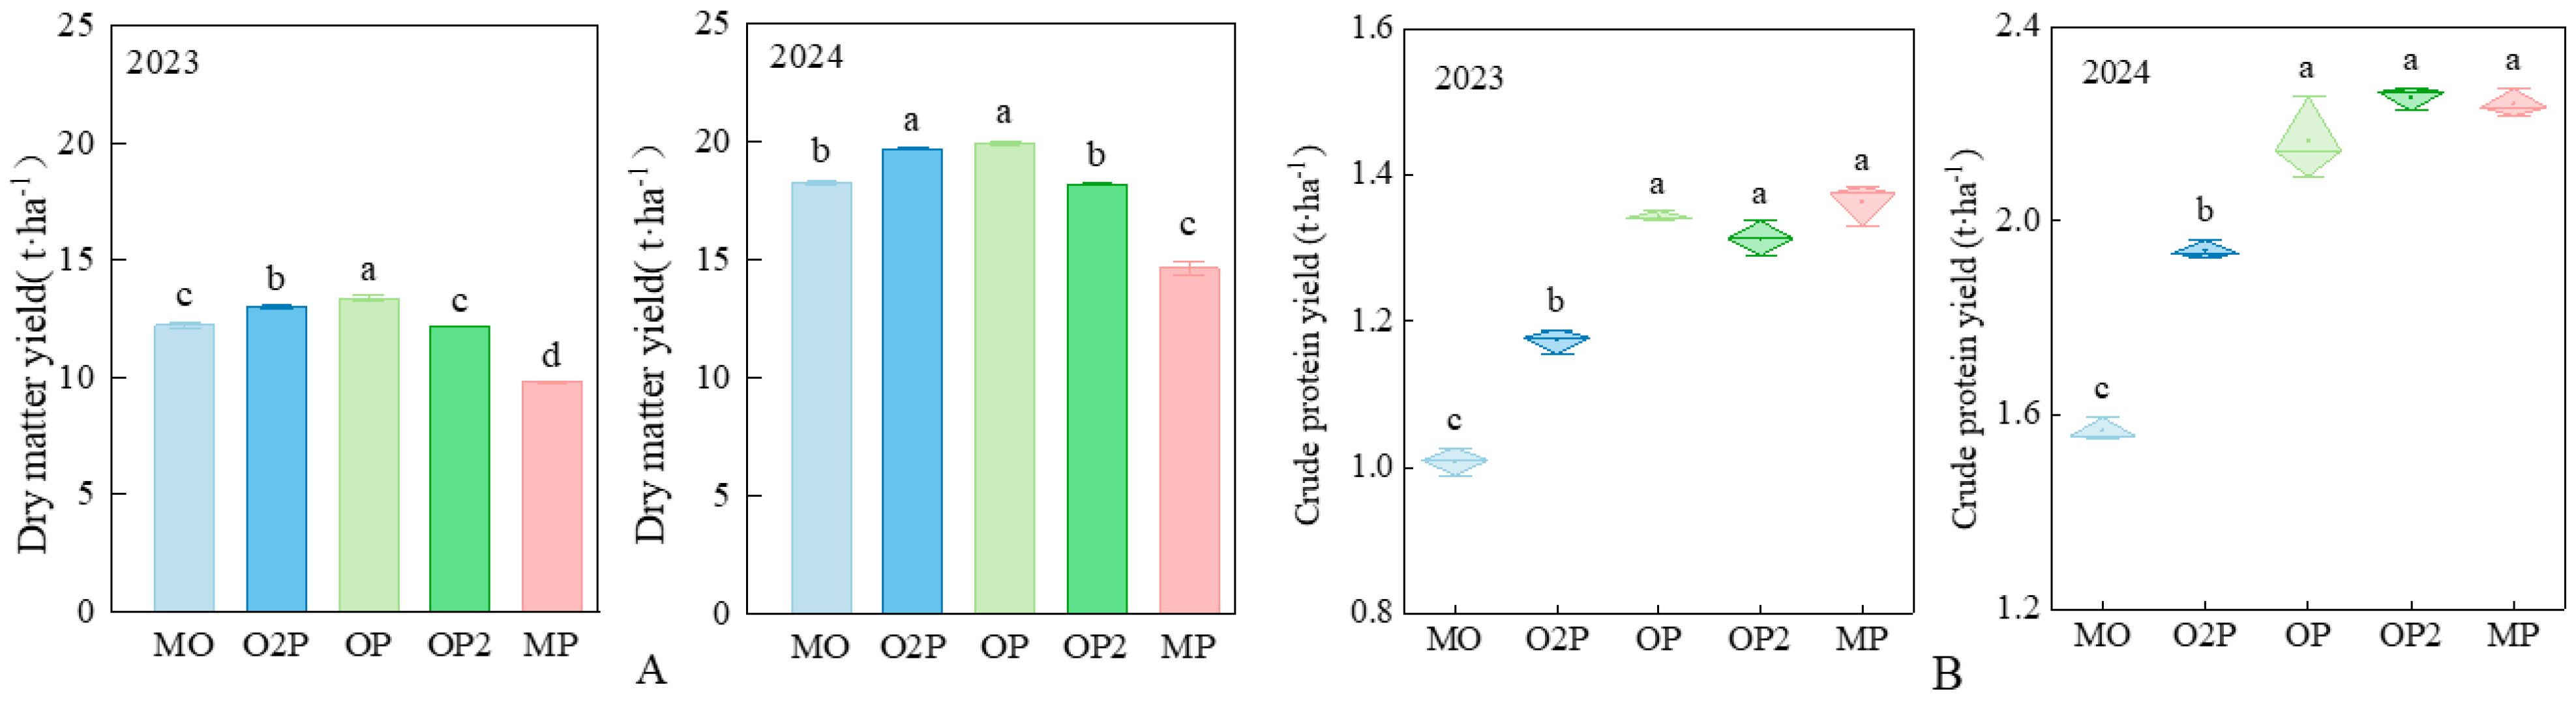
Mixed sowing significantly affected dry-matter yield (p < 0.05; Figure 3A). Dry-matter yield of mixed treatments was higher than that of forage-pea monoculture. The O2P and OP mixtures produced higher dry-matter yield than sole oat. Across years, OP had the greatest dry-matter yield among mixed-sowing groups, while MP had the lowest dry-matter yield.
Figure 3.
Effects of oat–forage pea mixture ratios on dry matter yield and crude protein yield of the mixed-sowing system. (A) Dry matter yield; (B) Crude protein yield. Note: MO represents oat monoculture; O2P is a 2:1 oat–forage pea mixture; OP is a 1:1 oat–forage pea mixture; OP2 refers to an oat–forage pea mixture at a 1:2 ratio; MP indicates forage pea monoculture. Different lowercase letters above bars within the same subplot indicate significant differences among treatments according to Tukey’s HSD multiple range test at p < 0.05.
Crude-protein yield differed significantly among cropping treatments (Figure 3B). All mixed treatments had higher crude-protein yield than oat monoculture. MP recorded the highest crude-protein yield across all treatments, and OP had the highest crude-protein yield among mixed treatments.
Two-way ANOVA revealed significant main effects of year and cropping treatment, and a significant year × cropping-treatment interaction on dry-matter yield and crude protein yield (all p < 0.001; Table 2).
Table 2.
Effects of year, cropping treatment, and their interaction on dry matter yield and crude protein yield in oat–forage pea cropping systems.
3.2. Nutritional Quality Responses of Oat, Forage Pea, and Mixed Forage Communities Under Different Mixture Ratios
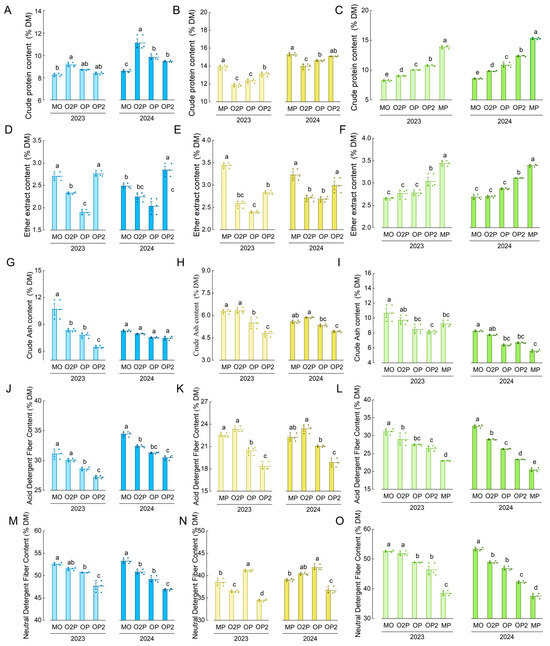
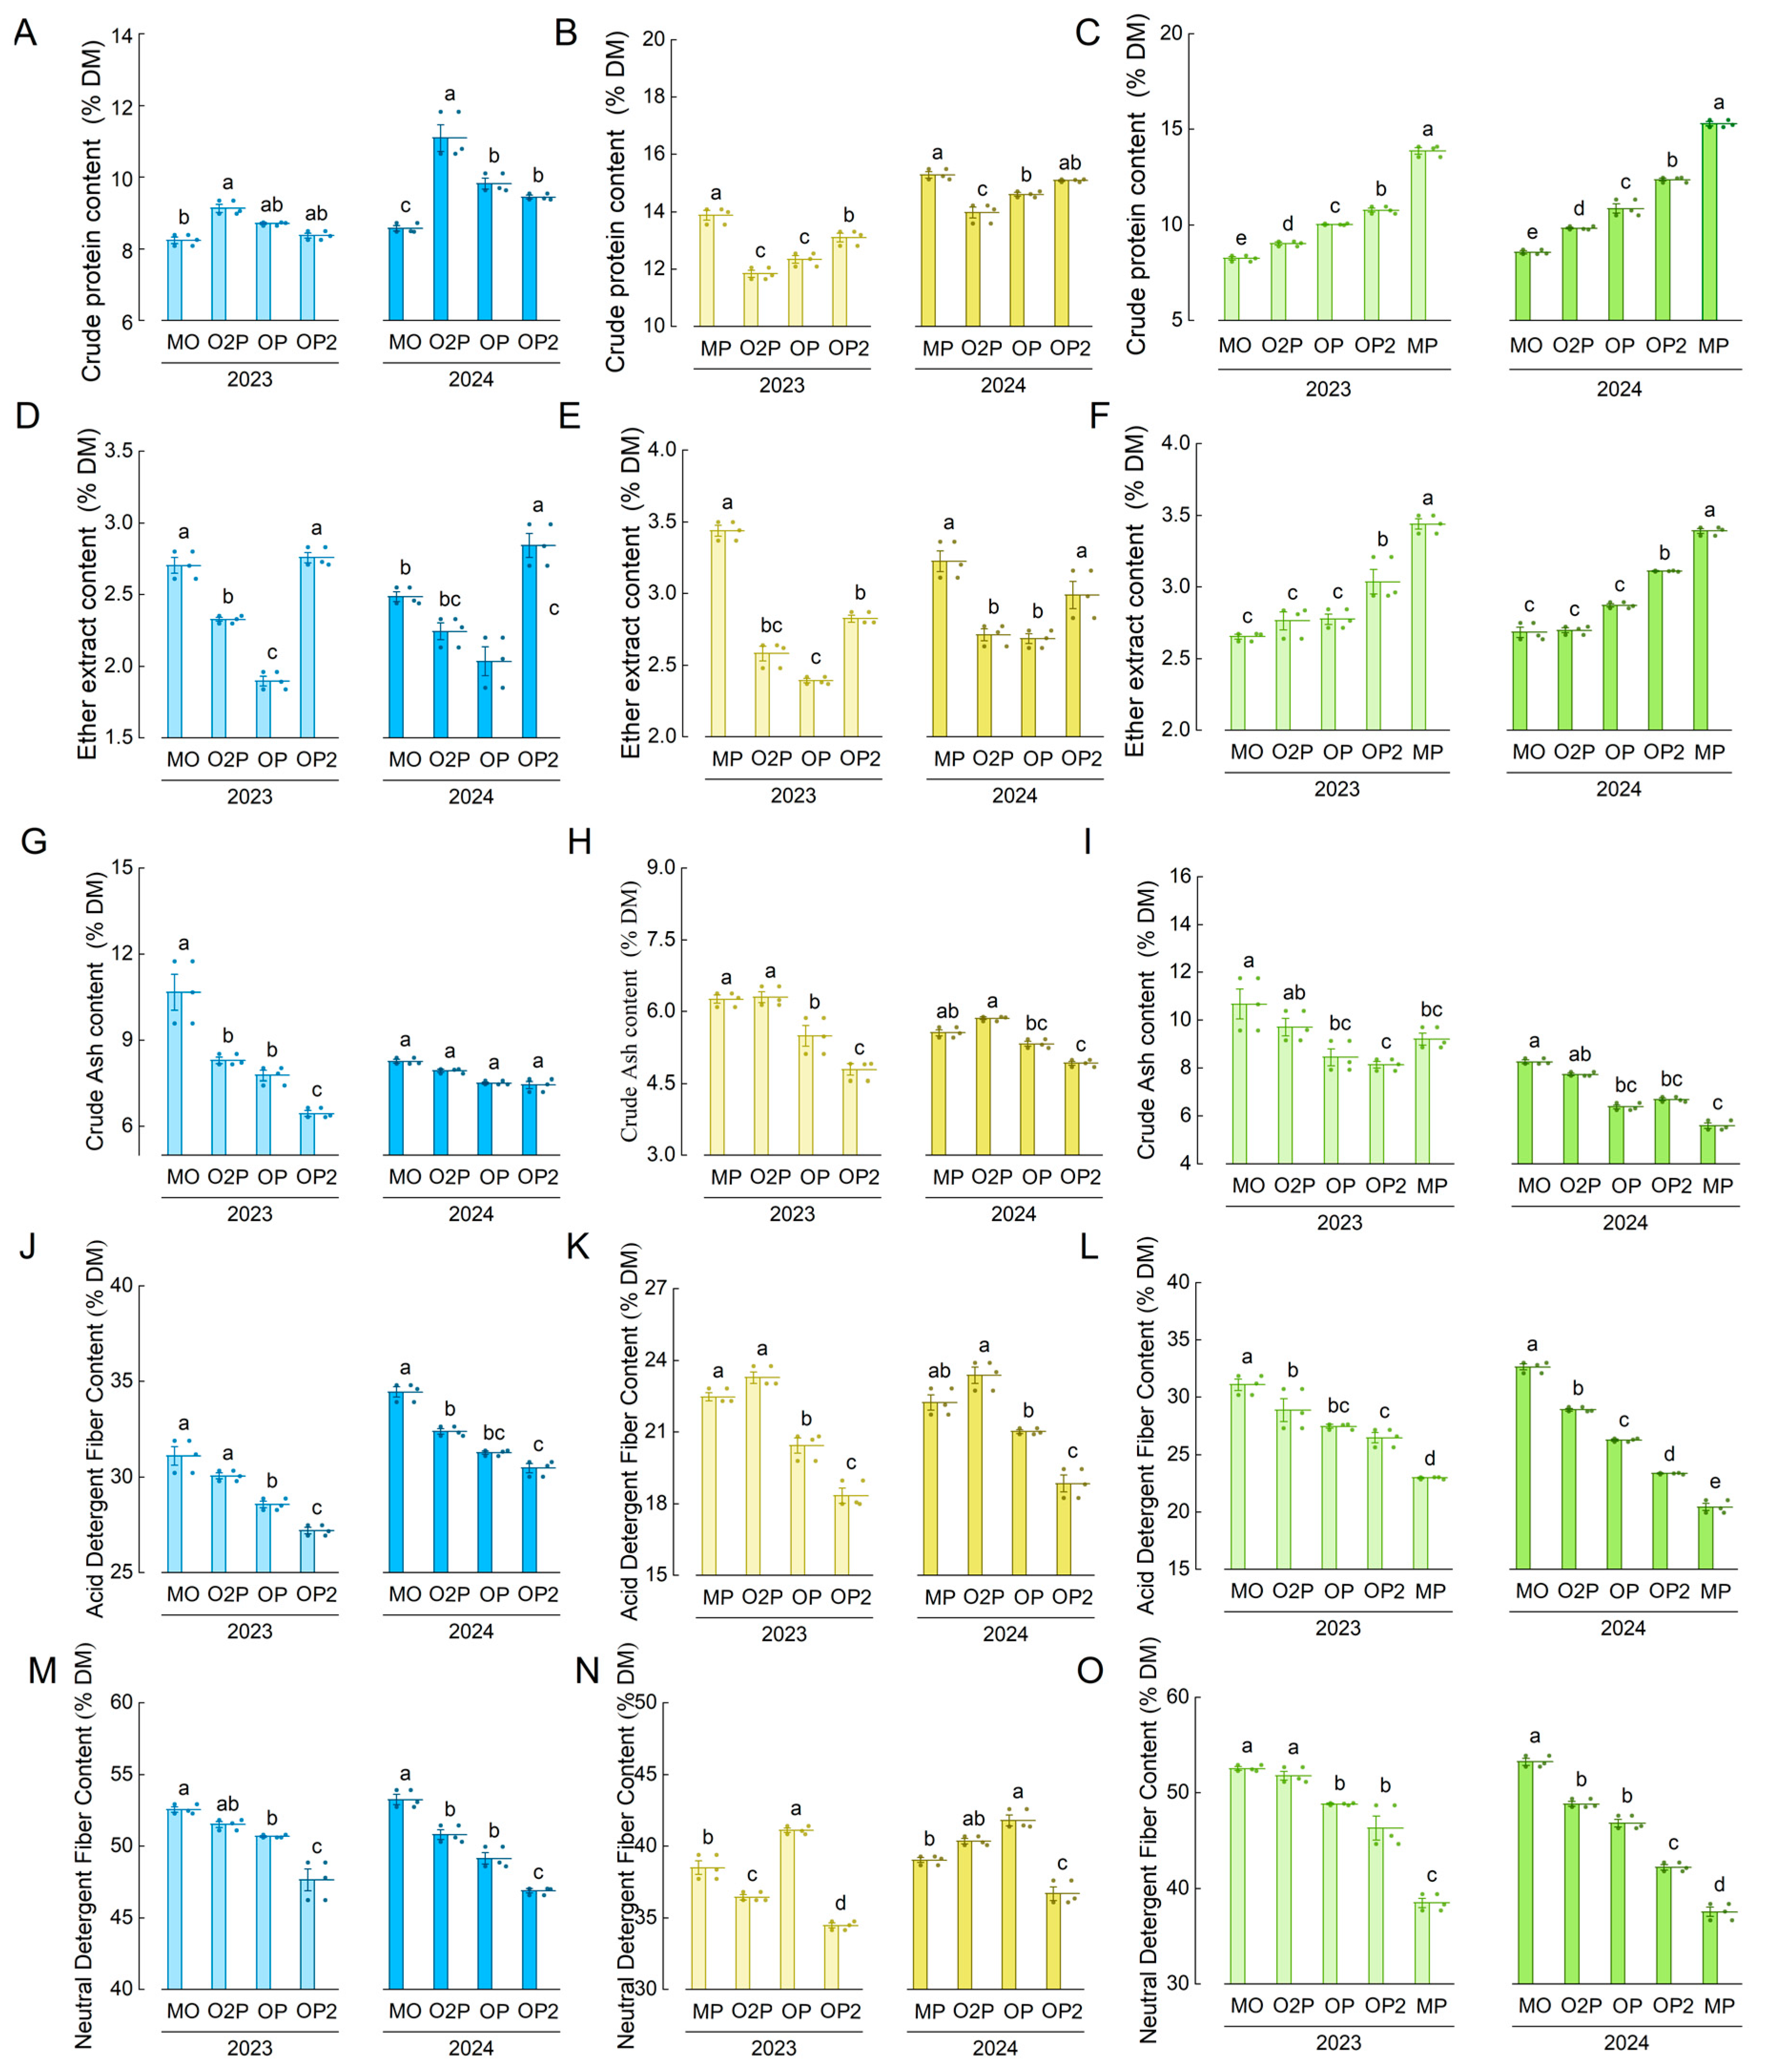
Nutritional quality varied systematically with forage-pea proportion, with response magnitudes differing between mixed forage and its individual components (Figure 4). At the whole-mixture level, crude-protein rose while ADF and NDF declined as forage-pea share increased. MP had the highest CP and lowest fiber concentrations, whereas MO showed the reverse pattern. EE tended to increase with forage-pea proportion; ash responses were inconsistent across years. For the oat component, O2P produced the highest CP and MO the lowest. Oat ADF and NDF peaked under MO and reached minima under OP2. For forage pea, MP generally had the highest CP and EE, while O2P had the lowest values among mixtures; fiber concentrations decreased with rising forage-pea proportion.
Figure 4.
Nutritional quality traits of oat–forage pea mixtures under different mixture ratios. (A,D,G,J,M) Crude protein (CP), ether extract (EE), crude ash (Ash), acid detergent fiber (ADF), and neutral detergent fiber (NDF) contents of oat components; (B,E,H,K,N) CP, EE, Ash, ADF, and NDF contents of forage pea components; (C,F,I,L,O) CP, EE, Ash, ADF, and NDF contents of whole mixed forage communities. Treatments: MO, oat monoculture; O2P, oat:forage pea = 2:1; OP, oat:forage pea = 1:1; OP2, oat:forage pea = 1:2; MP, forage pea monoculture. Bars represent means ± SE (n = 4). Different lowercase letters above bars within the same subplot indicate significant differences among treatments according to Tukey’s HSD multiple range test at p < 0.05.
Two-way ANOVA for mixed-sowing treatments (O2P, OP, OP2) showed significant main effects of mixing ratio on all measured nutritional quality indices (p < 0.001; Table 3). Year exerted variable effects on different quality variables, and significant year × mixing-ratio interactions were observed for several nutritional traits.
Table 3.
Effects of year, mixing ratio, and their interaction on nutritional quality, interspecific interactions, and system performance of oat–forage pea mixtures.
3.3. Interspecific Competition and Complementarity Under Different Mixture Ratios
3.3.1. Relative Yield and Land Equivalent Ratio
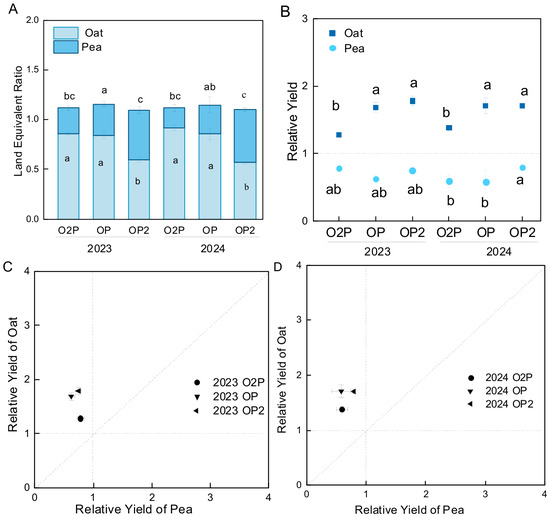
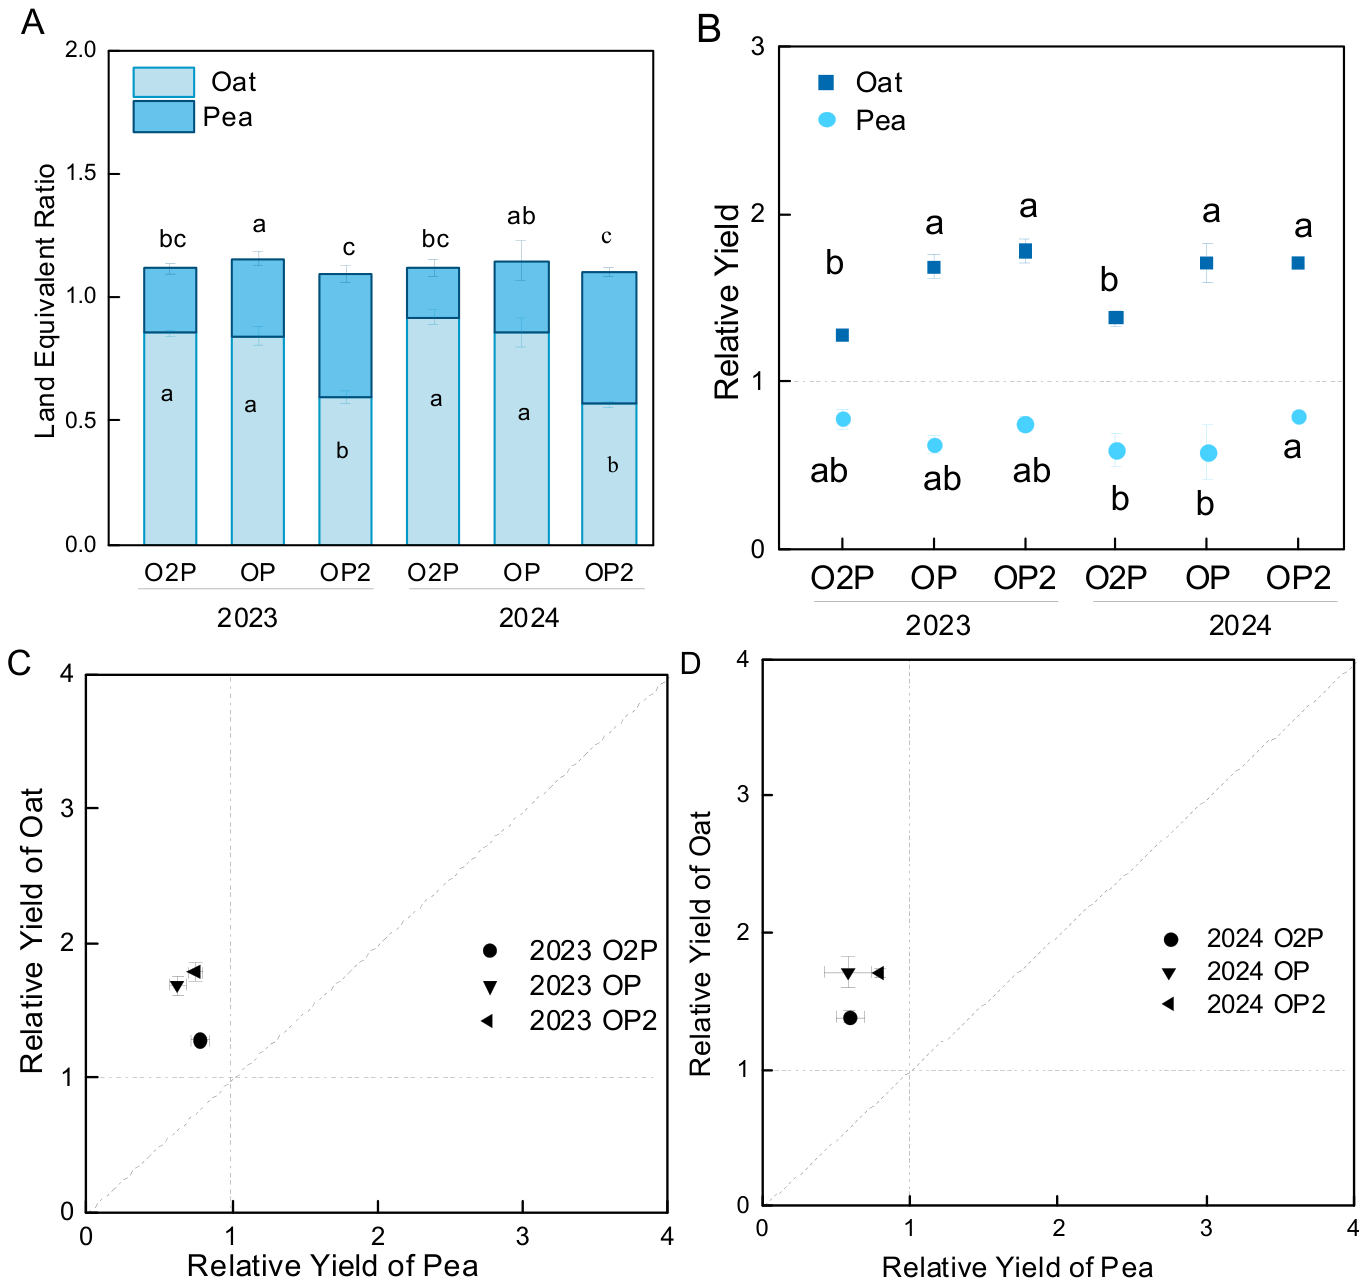
LER values were greater than one for all mixed-sowing treatments in both experimental years (Figure 5A). OP had the highest LER, and OP2 had the lowest LER among mixtures. As forage-pea proportion increased, the partial LER of oat declined and the partial LER of forage pea increased.
Figure 5.
Relative yield and land equivalent ratio of oat–forage pea mixtures under different mixture ratios. (A) Land equivalent ratio (LER) of oat–forage pea mixed-sowing systems; (B) relative yields of oat (RYo) and forage pea (RYp); (C,D) relationships between relative yields of oat and forage pea in 2023 and 2024, respectively. Treatments: MO, oat monoculture; O2P, oat:forage pea = 2:1; OP, oat:forage pea = 1:1; OP2, oat:forage pea = 1:2; MP, forage pea monoculture. Bars represent means ± SE (n = 4). Different lowercase letters above bars within the same subplot indicate significant differences among treatments according to Tukey’s HSD multiple range test at p < 0.05.
Relative yield further showed asymmetric species responses (Figure 5B). RYo exceeded one in every mixture and increased from 1.33 in O2P to 1.70 in OP and 1.75 in OP2 on a two-year mean basis. In contrast, Ryp remained below one, with the lowest value in OP. Oat therefore produced more biomass than expected from its sowing proportion, whereas forage pea produced less than expected.
3.3.2. Competitive Relationships Between Oat and Forage Pea
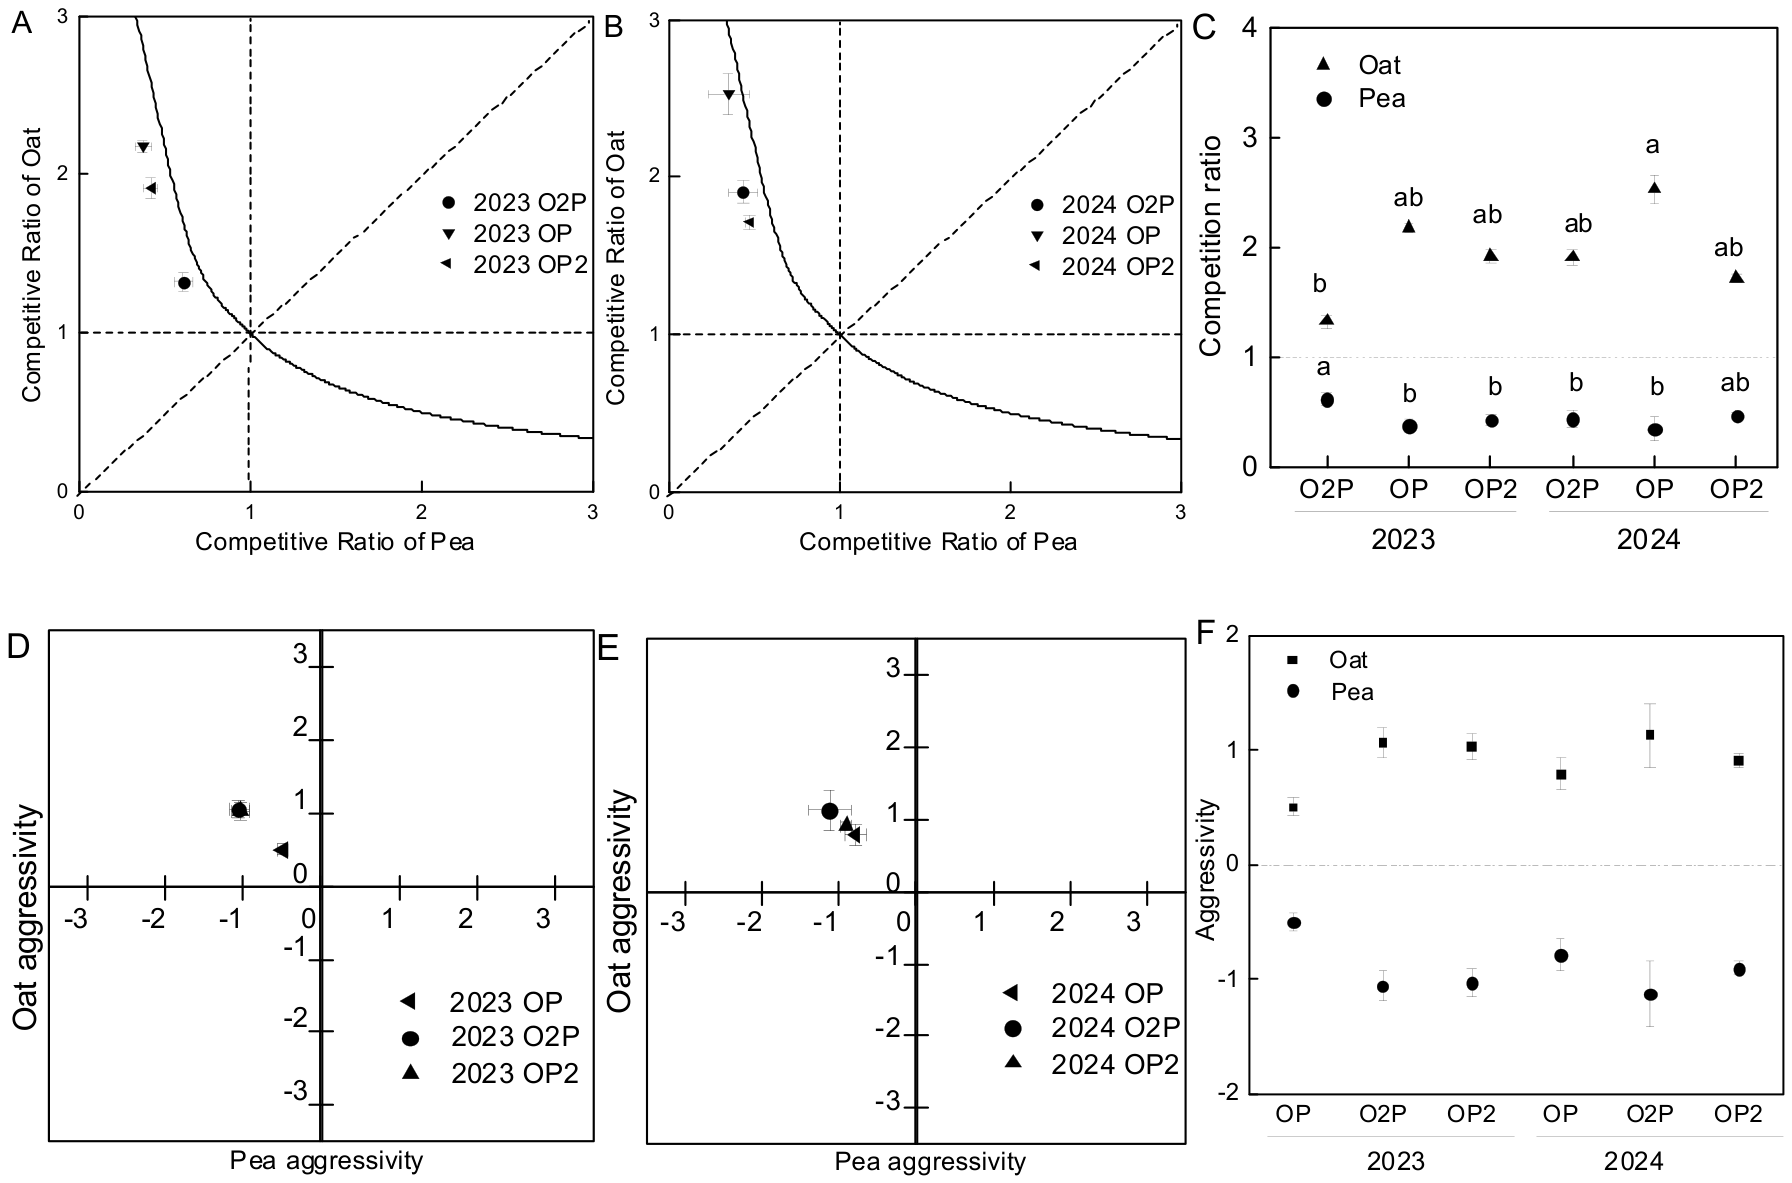
Competition indices confirmed the dominance of oat (Figure 6). CRo remained > 1 and CRp < 1 across all mixture ratios, with the strongest contrast under OP. A significant between-year difference in CRp occurred only for O2P (p < 0.05).
Figure 6.
Competitive relationships between oat and forage pea under different mixture ratios. (A,B) Distribution of competitive ratios (CR) between oat and forage pea in 2023 and 2024, respectively; (C) competitive ratio values of oat and forage pea under different mixture ratios; (D,E) distribution of aggressivity (AG) between oat and forage pea in 2023 and 2024, respectively; (F) aggressivity values of oat and forage pea under different mixture ratios. Treatments: O2P, oat:forage pea = 2:1; OP, oat:forage pea = 1:1; OP2, oat:forage pea = 1:2. Bars represent means ± SE (n = 4). Different lowercase letters above bars within the same subplot indicate significant differences among treatments according to Tukey’s HSD multiple range test at p < 0.05.
Aggressivity showed the same directional pattern: AGo was positive and AGp negative in every mixed treatment (Figure 6D–F). Although the magnitude varied with mixture ratio, the sign of the indices was stable across years. Thus, changing the sowing ratio altered the intensity of competition but did not reverse species dominance.
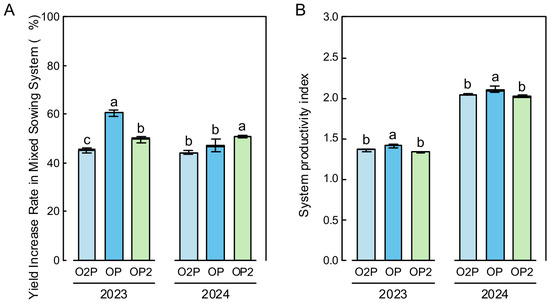
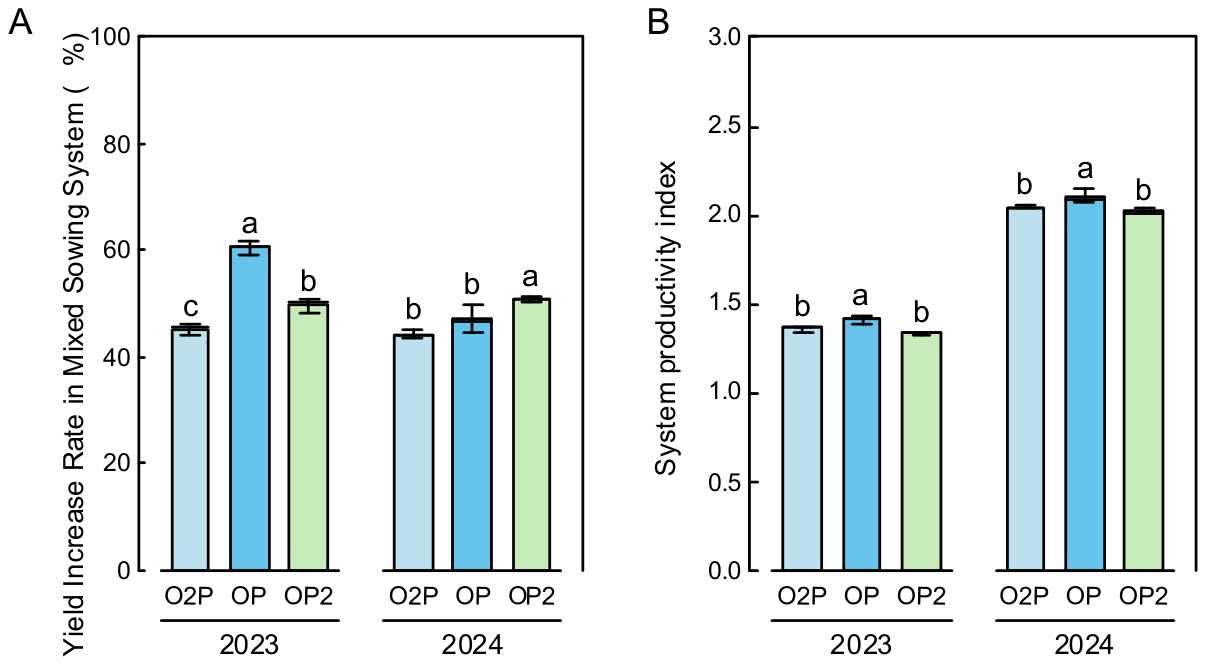
YIR was positive for every mixture in both years (Figure 7A), but the ranking among ratios changed between years. In 2023, YIR was 45.38%, 60.70%, and 49.89% for O2P, OP, and OP2, respectively; in 2024, the corresponding values were 44.14%, 47.21%, and 50.80%. OP therefore showed the greatest yield advantage in 2023, whereas OP2 was highest in 2024.
Figure 7.
Yield increase rate and system productivity index of oat–forage pea mixtures under different mixture ratios. (A) Yield increase rate (YIR) of mixed-sowing systems; (B) system productivity index (SPI) under different mixture ratios. Treatments: O2P, oat:forage pea = 2:1; OP, oat:forage pea = 1:1; OP2, oat:forage pea = 1:2. Bars represent means ± SE (n = 4). Different lowercase letters above bars within the same subplot indicate significant differences among treatments according to Tukey’ s HSD multiple range test at p < 0.05.
SPI increased markedly from 2023 to 2024 but showed a more stable treatment ranking (Figure 7B). OP had the highest SPI in both years (1.41 and 2.10), followed by O2P (1.36 and 2.05) and OP2 (1.34 and 2.02). The consistent SPI ranking, together with the yield results, identifies OP as the most productive mixed configuration across years.
Two-way ANOVA (Table 3) showed that mixing ratio significantly affected most interspecific interaction indices. Several indices exhibited significant year × mixing-ratio interactions. LER was not significantly influenced by year or the year-by-ratio interaction. SPI and YIR showed significant effects of year, mixing ratio, and their interaction (p < 0.001).
3.4. Linking Interspecific Interactions with Forage Productivity and Nutritional Quality
3.4.1. Component-Level Relationships Between Interspecific Interactions and Nutritional Traits
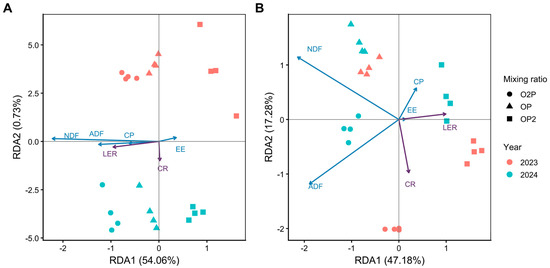
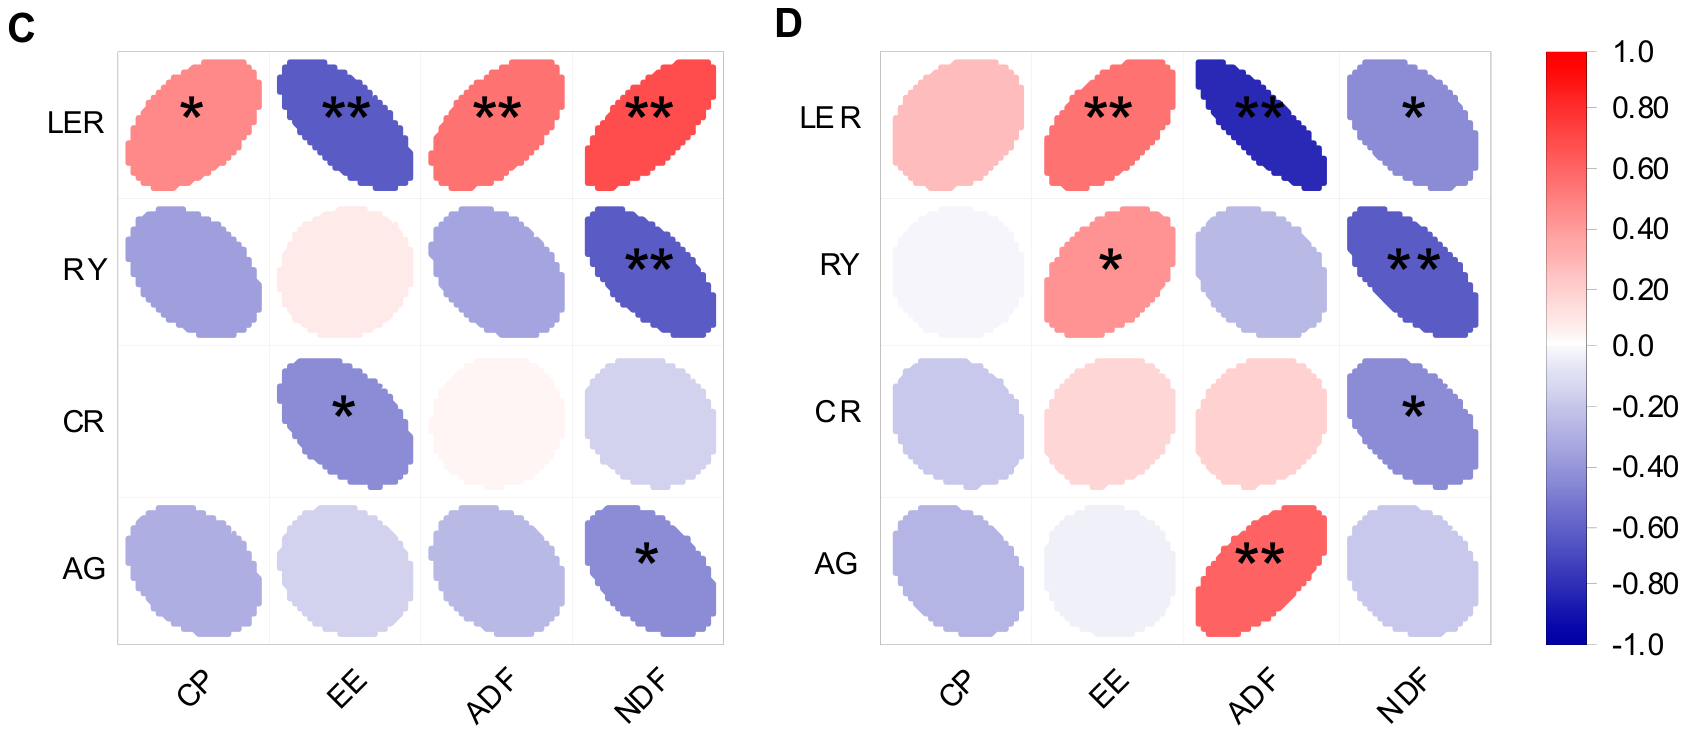
Redundancy analysis (RDA) revealed species-specific links between interspecific interaction indices and nutritional-quality traits (Figure 8A,B). For oat, LER and CR together explained 54.79% of nutritional-quality variation; the overall model was significant (F = 12.722, p < 0.001, adjusted R2 = 0.548). Only LER exerted a significant marginal effect (F = 25.098, p < 0.001), while CR did not (F = 2.458, p = 0.089). For forage pea, LER and CR jointly accounted for 64.46% of quality variation (adjusted R2 = 0.611), with both LER and CR showing significant independent contributions (p < 0.001).
Figure 8.
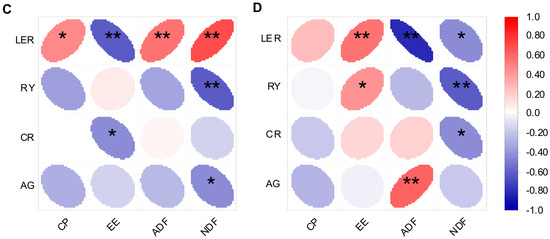
Relationships between interspecific interaction indices and nutritional quality traits of oat and forage pea under different mixing ratios in 2023 and 2024. (A,B) Redundancy analysis (RDA) of nutritional quality traits in oat (A) and forage pea (B), with land equivalent ratio (LER) and competition ratio (CR) as explanatory variables. (C,D) Spearman correlation analysis between interspecific interaction indices and nutritional quality traits of oat (C) and forage pea (D), respectively. In the RDA plots, colors represent years and symbols represent mixing ratios. In the correlation plots, red and blue ellipses represent positive and negative correlations, respectively, with color intensity and ellipse shape indicating correlation strength. CP, crude protein; EE, ether extract; ADF, acid detergent fiber; NDF, neutral detergent fiber; LER, land equivalent ratio; RY, relative yield; CR, competition ratio; AG, aggressivity. * p < 0.05; ** p < 0.01.
Spearman correlation supported the RDA results (Figure 8C,D). In oat, LER was significantly positively correlated with CP, ADF and NDF, and negatively correlated with EE. Additional significant correlations existed between RY-NDF, CR-EE and AG-NDF. For forage pea, LER correlated positively with CP and EE and negatively with ADF and NDF. Significant correlations were also found for RY-EE, RY-NDF, CR-NDF and AG-ADF. RDA and correlation outputs showed differing associations between interspecific interaction indices and nutritional quality for oat versus forage pea: LER was the main index linked to oat quality variation, whereas both LER and CR contributed to forage-pea quality responses.
3.4.2. System-Level Relationships Between Productivity Advantages and Mixed-Forage Nutritional Quality
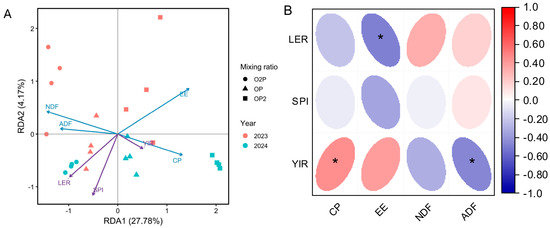
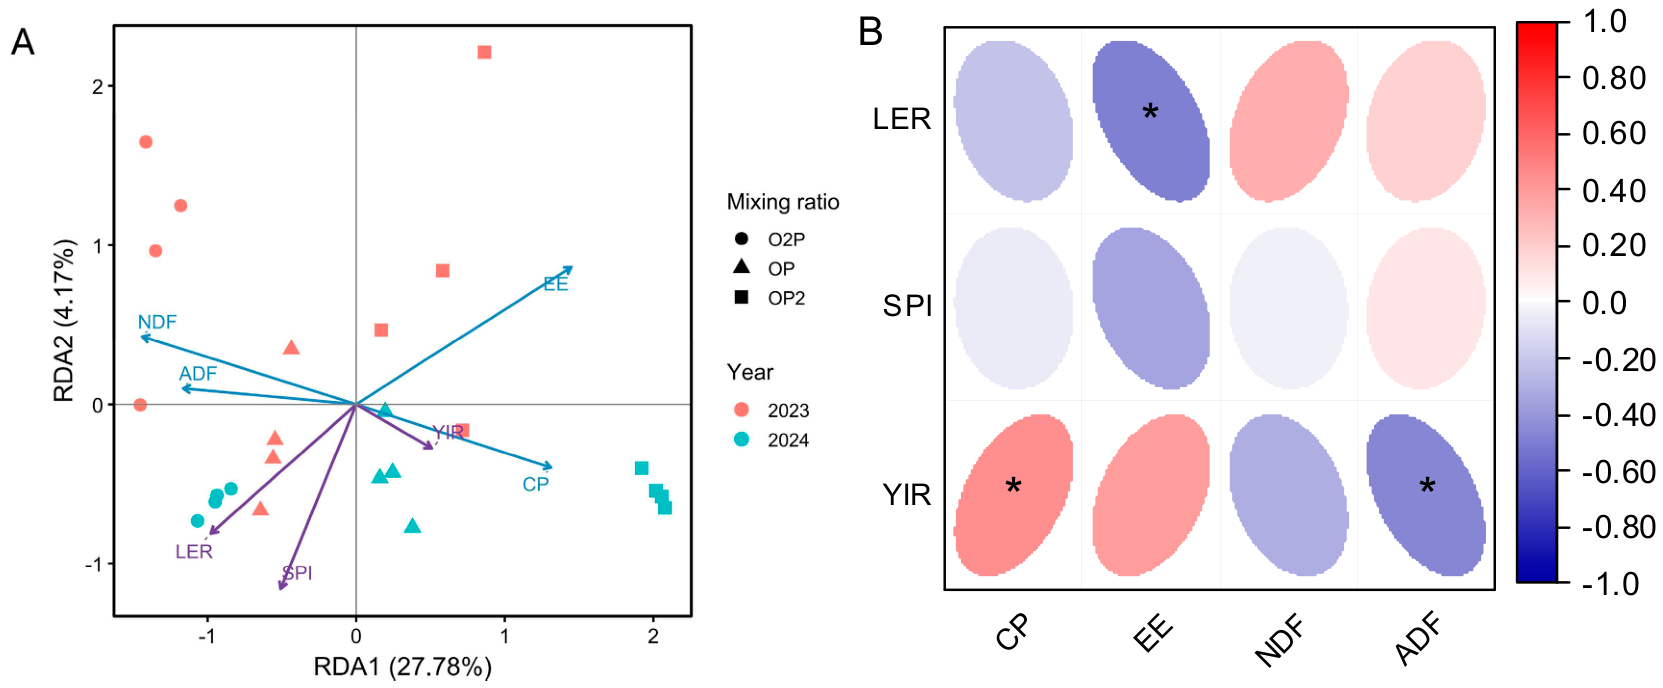
At the system level, RDA showed that LER, YIR, and SPI jointly explained 32.31% of mixed-forage nutritional-quality variation (adjusted R2 = 0.222; Figure 9A). The overall model was significant (F = 3.182, p = 0.0369). RDA1 (27.78%) was significant, while RDA2 (4.17%) was not. Variance-inflation-factor values (1.98–2.93) indicated low multicollinearity among predictors. Marginal permutation tests revealed significant independent explanatory effects for LER (F = 7.244, p = 0.0082) and YIR (F = 5.276, p = 0.0274), whereas SPI’s contribution was non-significant (F = 2.301, p = 0.128).
Figure 9.
Relationships between system-level productivity advantages and mixed-forage nutritional quality. (A) Redundancy analysis (RDA) showing the relationships of land equivalent ratio (LER), yield increase rate (YIR), and system productivity index (SPI) with mixed-forage nutritional traits. Colors indicate years, and symbols indicate mixing ratios. (B) Spearman correlations between system-level productivity indices and mixed-forage nutritional traits. Red and blue ellipses indicate positive and negative correlations, respectively, with ellipse shape and color intensity representing correlation strength. CP, crude protein; EE, ether extract; ADF, acid detergent fiber; NDF, neutral detergent fiber; LER, land equivalent ratio; YIR, yield increase rate; SPI, system productivity index. * p < 0.05.
RDA ordination displayed contrasting orientations for the three indices along RDA1. YIR aligned positively with CP and EE, while LER oriented toward ADF and NDF. SPI was positioned on the non-significant RDA2 axis. Spearman correlation analysis corroborated key RDA patterns (Figure 9B). YIR was positively correlated with CP (p < 0.05) and negatively correlated with ADF (p < 0.05). LER showed a significant negative correlation only with EE (p < 0.05). No significant correlations were found between SPI and any nutritional variable. LER and YIR were more closely linked to mixed-forage nutritional variation than SPI.
3.5. Economic Performance of Oat–Forage Pea Mixtures
Oat–forage pea mixtures generated greater economic returns than the monocultures (Table 4). Production costs increased as the forage pea proportion increased because forage pea seed was more expensive, ranging from 5931 CNY ha−1 in MO to 6580 CNY ha−1 in MP.
Table 4.
Economic performance of oat–forage pea cropping systems under alpine corral conditions.
The additional seed investment was offset when mixture productivity remained high. OP produced the highest two-year mean dry matter yield (16.66 t ha−1) and the greatest net return (20,564 CNY ha−1). O2P produced a similar net return (20,221 CNY ha−1) and, together with OP, the highest BCR (4.29). By contrast, the lower biomass production of OP2 reduced its economic advantage despite its higher forage pea proportion.
These results show that the agronomic optimum was also economically competitive: the 1:1 mixture maximized net return, while the 2:1 mixture provided nearly equivalent input-use efficiency. The economic ranking therefore reinforces, rather than contradicts, the productivity results.
4. Discussion
The central finding of this two-year trial was that the comprehensive performance of oat–forage pea mixtures in manure-enriched alpine corrals depended on sowing mixture ratio rather than simply increasing forage-pea proportion. The 1:1 (OP) mixture achieved consistently high dry-matter and crude-protein yields, a favorable land equivalent ratio (LER), the maximum system productivity index (SPI), and the greatest net economic return, despite persistent competitive dominance of oat across all mixed treatments. This indicates that superior system-level performance does not require equal competitive capacity of the two species. Instead, optimal outcomes occur when oat competitive dominance is balanced by sufficient forage-pea input to improve forage quality while maintaining interspecific complementary resource-use. In high-fertility soils, grasses may gain competitive advantages through rapid mineral-nitrogen uptake, whereas legumes can rely more on soil-derived nitrogen and reduce the contribution of symbiotic N2-fixation [12]. Our phenotypic observations align with such a competitive-balance shift. Nevertheless, since symbiotic N2 fixation and below-ground N transfer were not directly quantified in this experiment, this mechanistic interpretation remains plausible rather than empirically proven.
The yield patterns observed here provide empirical evidence for this ratio-dependent species balance. Mixed-sowing treatments out-yielded forage-pea monoculture; O2P and OP also surpassed sole-oat productivity. Comparable yield benefits of oat–forage pea mixtures have been documented under non-alpine conditions [8], confirming the general agronomic potential of this species pairing. Complementary resource capture is a widely accepted explanation for mixture over-yielding in cereal–legume systems [31]. Structural complementarity may further contribute: erect cereal stems offer physical support for climbing legume canopies [32,33], and divergent rooting architectures can diminish below-ground resource-use overlap [34]. However, canopy light interception and root-system distribution were not measured in the present study, so these hypothetical mechanisms cannot be directly validated from our dataset. Among tested ratios, OP produced the highest dry-matter yield in both years, whereas further elevation of forage-pea proportion (OP2) depressed total community biomass, demonstrating that maximum yield occurred at an intermediate rather than maximum legume share [8].
Marked inter-annual differences in overall forage productivity were detected, with substantially higher yields in 2024 relative to 2023. Because experimental plots were newly established and re-randomized each year, yield divergence cannot be attributed to residual legacy effects from the previous-year cropping; inter-annual climatic variation is the most plausible driver. The biomass reduction observed at the highest forage-pea proportion also highlights the necessity of maintaining adequate cereal abundance within oat–forage pea mixtures [9]. Lodging was not assessed in this work; therefore, the inferior performance of OP2 should be attributed to imbalanced species composition instead of unmeasured lodging risk.
Nutritional results illustrate the productivity-quality trade-off inherent to these mixed communities. Relative to oat monoculture, mixed sowing increased crude-protein yield, and mixed-forage crude-protein concentration rose progressively with a greater forage-pea proportion, consistent with earlier cereal–legume intercropping reports [35]. Gains in crude-protein output originate from the combined effects of total biomass and legume-derived high-protein tissue [36]. Previous work demonstrated that N supply can modify symbiotic N2-fixation of pea in oat–pea intercropping systems [37], and interspecific root interactions can reshape nitrogen acquisition and allocation within mixtures [38]. Even with a higher legume proportion, OP2 failed to maximize area-based crude-protein yield because biomass losses offset quality improvements. This carries important practical implications: simply increasing the share of forage pea will not automatically maximize land-unit protein production, and the 1:1 ratio delivered the best compromise between biomass output and nutritive value in our test. The earlier phenological stage of harvested forage pea (flowering-early pod-setting) compared with that of oat (heading-milk stage) partly explains the lower dry-matter concentration and higher crude-protein values of pea monoculture. Consequently, high pea crude-protein concentration alone could not translate into the highest areal protein yield due to its intrinsically lower biomass potential.
Consistently positive LER values across all mixtures confirm land-use advantages relative to monocultures, a hallmark of successful intercropping systems [39]. LER was strongly governed by mixture ratio but insensitive to year-to-year variation, showing that mixing-derived relative complementarity is more stable than absolute realized productivity. By contrast, SPI and yield-increase rate (YIR) exhibited significant year and year-by-ratio interactive effects. This differentiates two dimensions of mixture performance: sowing composition determines the inherent relative complementarity potential, while annual growing conditions set the magnitude of actual on-site productivity. Functional trait dissimilarity underpins such complementarity [40], yet the concrete below-ground pathways operating within manure-rich corral soils still require further verification.
Competition-index outputs clarify why the intermediate OP ratio performed optimally. Oat maintained CR > 1 and positive aggressivity (AG), while forage pea showed CR < 1 and negative AG across treatments, revealing stable oat competitive dominance. Such density-dependent interspecific competition is also reported in cereal–legume intercropping systems [33]. Even under such asymmetric competition, OP attained the highest SPI and a favorable LER. This supports the concept that productive mixtures can emerge from competitive imbalance, provided functional trait divergence enables complementary resource exploitation [41]. Multivariate RDA and correlation analyses further showed that LER and YIR better reflected nutritional-quality variation than SPI. Pure biomass-based evaluation cannot fully capture mixture agronomic merit; optimal sowing combinations require balancing cereal-driven productivity with legume-derived forage-quality gains.
Economic assessments extend these agronomic findings to local alpine pastoral production contexts. OP achieved the highest mean net return, and O2P obtained a comparable benefit–cost ratio. Seasonally vacant livestock corrals, pre-enriched by winter-housing animal manure, represent under-utilized land resources. Producing annual mixed forage on these sites supplies conserved feed for the critical winter–spring forage shortage and promotes recycling of livestock-origin nutrients [42]. It should be noted that our partial-budget analysis only quantified direct monetary outputs; ecological benefits such as reduced grazing pressure on natural grasslands were not monetized and should be treated as potential secondary system-level advantages.
This two-year experiment was conducted at a single alpine corral site. Although cross-year consistency in LER and productivity responses indicates promising practical value for oat–forage pea mixed sowing, multi-site and longer-term trials are needed to test broader applicability. Key below-ground processes including symbiotic nitrogen fixation and rhizosphere nutrient dynamics were not directly measured, so mechanistic interpretations are inferred from phenotypic agronomic data. Economic outputs depend strongly on local forage prices and production costs, limiting straightforward extrapolation to other pastoral regions. Moreover, only three mixing ratios of one cereal–legume combination were evaluated; finer seeding-ratio gradients and alternative species pairings remain to be explored in future work.
5. Conclusions
Oat–forage pea mixed sowing is a promising management strategy for the productive utilization of manure-enriched alpine corral land. Although all mixtures achieved a land-use advantage (LER > 1), the 1:1 oat–forage pea mixture provided the best overall balance among forage yield, system productivity, nutritional quality, and economic return. Its seasonal cultivation could complement natural pasture by using temporarily idle corral land to produce forage locally during the winter–spring feed shortage while improving the utilization of accumulated manure-derived nutrients. Longer-term and multi-site studies are needed to evaluate the stability of these benefits and to quantify the associated nitrogen cycling, soil processes, and potential environmental effects.
Author Contributions
Conceptualization, Y.M. and Y.Z.; methodology, X.L., Y.M., G.L. and Y.Z.; software, Y.M.; validation, Y.M. and Y.Z.; formal analysis, Y.M.; investigation, Y.M.; resources, Y.M., Y.Z. and C.X.; data curation, Y.Z. and Y.M.; writing—original draft preparation, Y.M.; writing—review and editing, Y.Z.; visualization, Y.M.; supervision, Y.Z.; project administration, Y.M., C.X., G.L., H.Y., T.W., J.X. and S.W.; funding acquisition, X.L. and Y.Z. All authors have read and agreed to the published version of the manuscript.
Funding
This research was funded by the Gansu Provincial University Industry-Support Program (Grant No. 2026CYZC-044); Young Tutor Support Fund Project (Grant No. GAU-QDFC-2025-03); Gannan Prefecture Science and Technology Major Project (Grant No. 2025ZZ1N001); Science and Technology Innovation Project of Gansu Provincial Department of Natural Resources (Grant No. GSZRZYT-202610). The funding provided financial support for conducting field experiments, sample collection, and laboratory analyses.
Data Availability Statement
The datasets generated and analyzed during the current study are available from the corresponding author upon reasonable request. The data can also be provided to the editors and reviewers for verification during the peer-review process.
Conflicts of Interest
The authors declare no conflicts of interest.
References
- Xu, C. Countermeasures of grassland ecological environment management in Haiyan County, Qinghai Province. Heilongjiang J. Anim. Sci. Vet. Med. Sci. 2009, 33–35. [Google Scholar] [CrossRef]
- Zhang, S. Suggestions on strengthening the construction and development of grass industry in Haiyan County. Qinghai Prataculture 2016, 25, 42–45. [Google Scholar]
- Song, G.; Pubu, G.; Qin, J. The planting and application prospect of enclosure forage grass in the pastoral area of northern Tibet. Tibet. Agric. Sci. Technol. 2019, 41, 71–73. [Google Scholar]
- Wang, J. Current status and prospects of oat cultivation in household nests in Huzhu County, Qinghai Province. Anim. Breed. Feed. 2009, 86–87. [Google Scholar] [CrossRef]
- Shang, Z.; Wang, Y.; An, M.; Chen, X.; Kulyar, M.F.-e.-A.; Tan, Z.; Liu, S.; Li, K. The successional trajectory of bacterial and fungal communities in soil are fabricated by yaks’ excrement contamination in plateau, China. Front. Microbiol. 2022, 13, 1016852. [Google Scholar] [CrossRef] [Scilit]
- Hao, F.; Yu, T.; Gao, K.; Xiong, M.; An, H. Production performance and stability of mixed forage grasslands improved by planting proportion and mode in Horqin sandy land, China. Sci. Rep. 2025, 15, 14683. [Google Scholar] [CrossRef] [Scilit]
- Caram, N.; Sollenberger, L.E.; Wallau, M.O.; Dubeux, J.C.B. Nitrogen niche differentiation and overyielding along a legume proportion gradient in a subtropical grass-legume mixture. Plant Soil 2025, 513, 1085–1100. [Google Scholar] [CrossRef] [Scilit]
- Tamiru, M.; Alkhtib, A.; Belachew, B.; Demeke, S.; Worku, Z.; Wamatu, J.; Burton, E. Oat–Field Pea Intercropping for Sustainable Oat Production: Effect on Yield, Nutritive Value and Environmental Impact. Sustainability 2023, 15, 3514. [Google Scholar] [CrossRef] [Scilit]
- Dangi, S. Oat as green fodder and its intercropping benefits: A review. Agric. Rev. 2021, 42, 66–72. [Google Scholar] [CrossRef] [Scilit]
- Zhao, C.; Fan, Z.; Coulter, J.A.; Yin, W.; Chai, Q. High Maize Density Alleviates the Inhibitory Effect of Soil Nitrogen on Intercropped Pea. Agronomy 2020, 10, 248. [Google Scholar] [CrossRef] [Scilit]
- Bailey-Elkin, W.; Carkner, M.K.; Entz, M. Intercropping organic field peas with barley, oats, and mustard improves weed control but has variable effects on grain yield and net returns. Can. J. Plant Sci. 2021, 102, 515–528. [Google Scholar] [CrossRef] [Scilit]
- Deligiannis, E.; Alexandrou, F.S.A.; Papakaloudis, P.; Michalitsis, A.; Manessis, G.; Basdagianni, Z.; Bossis, I.; Dordas, C. Evaluating the Performance of Intercropping Cereals and Legumes to Reduce Weed Pressure. Proceedings 2026, 134, 25. [Google Scholar] [CrossRef] [Scilit]
- NY/T 1121.6-2006; Soil Testing. Part 6: Method for Determination of Soil Organic Matter. Standards Press of China: Beijing, China, 2006.
- LY/T 1228-2015; Nitrogen Determination Methods of Forest Soils. Standards Press of China: Beijing, China, 2015.
- LY/T 1232-2015; Phosphorus Determination Methods of Forest Soils. Standards Press of China: Beijing, China, 2015.
- LY/T 1234-2015; Potassium Determination Methods of Forest Soils. Standards Press of China: Beijing, China, 2015.
- Alomar, D.; Fuchslocher, R.; Stockebrand, S. Effects of oven- or freeze-drying on chemical composition and NIR spectra of pasture silage. Anim. Feed. Sci. Technol. 1999, 80, 309–319. [Google Scholar] [CrossRef] [Scilit]
- ISO 20483:2013; Cereals and Pulses—Determination of the Nitrogen Content and Calculation of the Crude Protein Content—Kjeldahl Method. ISO: Geneva, Switzerland, 2013.
- Sáez-Plaza, P.; Michałowski, T.; Navas, M.J.; Asuero, A.G.; Wybraniec, S.-A. An Overview of the Kjeldahl Method of Nitrogen Determination. Part I. Early History, Chemistry of the Procedure, and Titrimetric Finish. Crit. Rev. Anal. Chem. 2013, 43, 178–223. [Google Scholar] [CrossRef] [Scilit]
- ISO 659:1998; Oilseeds—Determination of Oil Content (Reference Method). ISO: Geneva, Switzerland, 1998.
- Thiex, N.J.; Anderson, S.; Gildemeister, B. Crude Fat, Hexanes Extraction, in Feed, Cereal Grain, and Forage (Randall/Soxtec/Submersion Method): Collaborative Study. J. AOAC Int. 2003, 86, 899–908. [Google Scholar] [CrossRef] [Scilit]
- Van Soest, P.J.; Robertson, J.B.; Lewis, B.A. Methods for dietary fiber, neutral detergent fiber, and nonstarch polysaccharides in relation to animal nutrition. J. Dairy Sci. 1991, 74, 3583–3597. [Google Scholar] [CrossRef] [Scilit]
- ISO 13906:2008; Animal Feeding Stuffs—Determination of Tryptophan Content. ISO: Geneva, Switzerland, 2008.
- ISO 5984:2022; Animal Feeding Stuffs—Determination of Crude Ash. ISO: Geneva, Switzerland, 2022.
- Thiex, N.; Novotny, L.; Crawford, A. Determination of ash in animal feed: AOAC official method 942.05 revisited. J. AOAC Int. 2012, 95, 1392–1396. [Google Scholar] [CrossRef] [Scilit]
- Mead, R.; Willey, R.W. The Concept of a ‘Land Equivalent Ratio’ and Advantages in Yields from Intercropping. Exp. Agric. 1980, 16, 217–228. [Google Scholar] [CrossRef] [Scilit]
- Ren, Y.; Zhang, L.; Yan, M.; Zhang, Y.; Chen, Y.; Palta, J.A.; Zhang, S. Effect of sowing proportion on above- and below-ground competition in maize–soybean intercrops. Sci. Rep. 2021, 11, 15760. [Google Scholar] [CrossRef] [Scilit]
- Li, C.; Stomph, T.; Makowski, D.; Li, H.; Zhang, C.; Zhang, F.; van der Werf, W. The productive performance of intercropping. Proc. Natl. Acad. Sci. USA 2023, 120, e2201886120. [Google Scholar] [CrossRef] [Scilit]
- Dhima, K.V.; Lithourgidis, A.S.; Vasilakoglou, I.B.; Dordas, C.A. Competition indices of common vetch and cereal intercrops in two seeding ratio. Field Crops Res. 2006, 100, 249–256. [Google Scholar] [CrossRef] [Scilit]
- Odo, P.E. Evaluating Short and Tall Sorghum Varieties in Mixtures with Cowpea in the Sudan Savanna of Nigeria: LER, Grain Yield and System Productivity Index. Exp. Agric. 1991, 27, 435–441. [Google Scholar] [CrossRef] [Scilit]
- Baxevanos, D.; Tsialtas, I.T.; Voulgari, O.; Pankou, C.I.; Vlachostergios, D.; Lithourgidis, A.S. Oat genotypic requirement for intercropping with vetch under Mediterranean conditions. J. Agric. Sci. 2020, 158, 695–706. [Google Scholar] [CrossRef] [Scilit]
- Wang, Y.; Han, X.; Zhao, X.; Zhang, Y.; Qi, B.; Li, L. Grain yield and interspecific competition in an oat-common vetch intercropping system at varying sowing density. Front. Plant Sci. 2024, 15, 1344110. [Google Scholar] [CrossRef] [Scilit]
- Qu, J.; Li, L.; Zhao, P.; Zhang, T.; Chen, G.; Yang, J.; Han, D. Effects of Intercropping Oat and Common Vetch on Plant Biomass Yield and Soil Nitrogen and Phosphorus Availability in Different Soil Characteristics. J. Soil Sci. Plant Nutr. 2023, 23, 3258–3270. [Google Scholar] [CrossRef] [Scilit]
- Jiao, Y.; Zhang, Q.; Miao, F. Forage yield, competition, and economic indices of oat and common vetch intercrops in a semi-arid region. Front. Sustain. Food Syst. 2024, 8, 1385296. [Google Scholar] [CrossRef] [Scilit]
- Wang, B.; Deng, J.; Wang, T.; Ni, W.; Feng, Q.; Lan, J. Effect of Seeding Options on Interspecific Competition in Oat (Avena sativa L.)–Common Vetch (Vicia sativa L.) Forage Crops. Agronomy 2022, 12, 3119. [Google Scholar] [CrossRef] [Scilit]
- Lodwig, E.M.; Hosie, A.H.F.; Bourdès, A.; Findlay, K.; Allaway, D.; Karunakaran, R.; Downie, J.A.; Poole, P.S. Amino-acid cycling drives nitrogen fixation in the legume-Rhizobium symbiosis. Nature 2003, 422, 722–726. [Google Scholar] [CrossRef] [Scilit]
- Neugschwandtner, R.W.; Kaul, H.P.; Moitzi, G.; Klimek-Kopyra, A.; Lošák, T.; Wagentristl, H. A low nitrogen fertiliser rate in oat–pea intercrops does not impair N2 fixation. Acta Agric. Scand. Sect. B Soil Plant Sci. 2021, 71, 182–190. [Google Scholar] [CrossRef] [Scilit]
- Sun, Y.; Wu, Z.; Hu, F.; Fan, H.; He, W.; Zhao, L.; Guo, C.; Bao, X.; Chai, Q.; Zhao, C. Maize and Pea Root Interactions Promote Symbiotic Nitrogen Fixation, Thereby Accelerating Nitrogen Assimilation and Partitioning in Intercropped Pea. Agronomy 2025, 15, 1615. [Google Scholar] [CrossRef] [Scilit]
- Liu, Z.; Nan, Z.; Lin, S.; Meng, W.; Xie, L.; Yu, H.; Zhang, Z.; Wan, S. Peanut-based intercropping systems altered soil bacterial communities, potential functions, and crop yield. PeerJ 2024, 12, e16907. [Google Scholar] [CrossRef] [Scilit]
- Wagg, C.; Ebeling, A.; Roscher, C.; Ravenek, J.; Bachmann, D.; Eisenhauer, N.; Mommer, L.; Buchmann, N.; Hillebrand, H.; Schmid, B.; et al. Functional trait dissimilarity drives both species complementarity and competitive disparity. Funct. Ecol. 2017, 31, 2320–2329. [Google Scholar] [CrossRef] [Scilit]
- Evers, J.B.; van der Werf, W.; Stomph, T.J.; Bastiaans, L.; Anten, N.P.R. Understanding and optimizing species mixtures using functional–structural plant modelling. J. Exp. Bot. 2019, 70, 2381–2388. [Google Scholar] [CrossRef] [Scilit]
- Luo, F.; Liu, W.; Mi, W.; Ma, X.; Liu, K.; Ju, Z.; Li, W. Legume-grass mixtures increase forage yield by improving soil quality in different ecological regions of the Qinghai-Tibet Plateau. Front. Plant Sci. 2023, 14, 1280771. [Google Scholar] [CrossRef] [Scilit]

Disclaimer/Publisher’s Note: The statements, opinions and data contained in all publications are solely those of the individual author(s) and contributor(s) and not of MDPI and/or the editor(s). MDPI and/or the editor(s) disclaim responsibility for any injury to people or property resulting from any ideas, methods, instructions or products referred to in the content. |
© 2026 by the authors. Licensee MDPI, Basel, Switzerland. This article is an open access article distributed under the terms and conditions of the Creative Commons Attribution (CC BY) license.