Article

Surface Defect and Malformation Characteristics Detection for Fresh Sweet Cherries Based on YOLOv8-DCPF Method

by
Yilin Liu
1,
Xiang Han
2,
Longlong Ren
2,
Wei Ma
3,
Baoyou Liu
4,
Changrong Sheng
1,
Yuepeng Song
2,* and
Qingda Li
1,*
1
College of Engineering, Heilongjiang Bayi Agricultural University, Daqing 163319, China
2
College of Mechanical and Electronic Engineering, Shandong Agricultural University, Tai’an 271018, China
3
Institute of Urban Agriculture, Chinese Academy of Agricultural Sciences, Chengdu 610213, China
4
Yantai Academy of Agricultural Sciences, Yantai 265500, China
*
Authors to whom correspondence should be addressed.
Agronomy 2025, 15(5), 1234; https://doi.org/10.3390/agronomy15051234
Submission received: 11 April 2025 / Revised: 10 May 2025 / Accepted: 12 May 2025 / Published: 19 May 2025

Abstract

:
The damaged and deformed fruits of fresh berries severely restrict the economic value of produce, and accurate identification and grading methods have become a global research hotspot. To address the challenges of rapid and accurate defect detection in intelligent cherry sorting systems, this study proposes an enhanced YOLOv8n-based framework for sweet cherry defect identification. First, the dilation-wise residual (DWR) module replaces the conventional C2f structure, allowing for the adaptive capture of both local and global features through multi-scale convolution. This enhances the recognition accuracy of subtle surface defects and large-scale damages on cherries. Second, a channel attention feature fusion mechanism (CAFM) is incorporated at the front end of the detection head, which enhances the model’s ability to identify fine defects on the cherry surface. Additionally, to improve bounding box regression accuracy, powerful-IoU (PIoU) replaces the traditional CIoU loss function. Finally, self-distillation technology is introduced to further improve the mode’s generalization capability and detection accuracy through knowledge transfer. Experimental results show that the YOLOv8-DCPF model achieves precision, mAP, recall, and F1 score rates of 92.6%, 91.2%, 89.4%, and 89.0%, respectively, representing improvements of 6.9%, 5.6%, 6.1%, and 5.0% over the original YOLOv8n baseline network. The proposed model demonstrates high accuracy in cherry defect detection, providing an efficient and precise solution for intelligent cherry sorting in agricultural engineering applications.

1. Introduction

Berries are highly favored among young people, with cherries standing out as a prominent representative. As one of the earliest fruit-bearing trees among northern deciduous species, cherries are often referred to as the “first fruit of spring”. The cherry offers high economic value and substantial market potential, making it a key driver for rural revitalization and increasing farmers’ income [1,2,3]. Currently, the cherry sorting process still largely relies on manual labor, resulting in low efficiency, high costs, and inconsistent sorting standards [4]. Moreover, cherries are susceptible to mechanical damage or microbial contamination during natural growth or harvesting. Some fruits may develop surface defects or even decay. If not promptly sorted and removed, these damaged fruits can contaminate healthy ones, adversely affecting their overall quality and shelf life. Due to inefficiency and labor costs, manual sorting is no longer suitable for large-scale, high-frequency operations. Therefore, developing an efficient and intelligent cherry defect detection method will address the limitations of manual sorting and significantly improve sorting efficiency.
In recent years, deep learning methods have been applied by researchers, both domestically and internationally, to study fruit defect classification, making significant progress [5]. Classical object detection algorithms, such as fast R-CNN and the YOLO series, are widely used in fruit defect detection [6,7,8,9]. Fast R-CNN [10], a two-stage object detection model, first generates candidate regions and then classifies and regresses the samples using a convolutional neural network. For instance, Wei et al. [11] optimized the faster R-CNN model to improve cherry surface defect detection, enhancing sorting efficiency and accuracy. Zhang et al. [12] developed a fast R-CNN-based detection algorithm for apple damage regions, enabling the fast and accurate identification of small defective areas in apples under complex backgrounds. YOLO [13], a one-stage detection method, extracts feature directly from the network, classifies, and localizes the target. This approach improves training speed and reduces model complexity. Wu et al. [14] proposed the flaw-YOLOv5s model to address the inefficiency of traditional methods and the excessive computational demands of existing deep learning models in potato surface defect detection. Liu et al. [15] optimized the YOLOX model by introducing the focal loss function and integrating the CBAM attention mechanism, significantly improving cherry defect detection and grading performance. Experimental results showed an average defect detection accuracy of 97.59%. Feng et al. [16] proposed an enhanced deep learning model based on YOLOX to achieve the real-time multi-type detection of surface defects on oranges by introducing neck network residual connectivity and cascading, an attention mechanism module, and an optimized loss function. Lu et al. [17] developed the YOLO-FD model combined with the PSO-ELM algorithm and a dual-camera data acquisition system, enabling efficient citrus peel defect detection and the accurate evaluation of fruit morphology. Yao et al. [18] proposed a defect detection model for kiwifruit based on the YOLOv5 algorithm, improving model performance by adding a small target detection layer, embedding an SE layer for enhanced feature extraction, introducing a CIoU loss function for better regression accuracy, and optimizing the training process with a cosine annealing algorithm. Li et al. [19] developed an improved YOLOv8-Orah model for detecting surface defects on citrus fruits. Compared with the original model, the improved model achieved increases of 4.0% in precision, 1.7% in recall, and 3.0% in average precision. Liang et al. [20] proposed an improved YOLOv8n algorithm, named ASE-YOLOv8n, for the rapid and accurate detection of cherry tomato ripeness in natural environments. The experimental results demonstrate that the improved model achieves 91.83% accuracy, 89.79% recall, 90.80% F1 score, 96.40% mAP50, and 80.85% mAP50-95, outperforming the original YOLOv8n model and other related models.
Substantial progress has been achieved in the development of algorithms for fruit defect identification, particularly in the domains of small-scale object detection, morphological analysis, and the accurate classification of defects characterized by indistinct or ambiguous boundaries. This study optimizes the existing detection model to address the low accuracy in identifying small targets, irregular defect shapes, and inaccurate classification of defects with unclear boundaries. Using sweet cherries as the study object, a cherry defect detection method based on the improved YOLOv8n model, YOLOv8-DCPF, is proposed. The C2f module is substituted with the DWR module at the neck, facilitating dynamic adjustments and improving the capture of small targets. In addition, the CAFM attention mechanism is integrated into the detection head to enhance feature extraction, enabling the better differentiation of defects with unclear boundaries. To address the challenge of accurately fitting bounding boxes using CIoU for defects with fuzzy boundaries and irregular shapes, the regression loss in the original network is replaced by PIoU loss, resulting in improved detection accuracy. This modification significantly enhances the overall performance of the model. Furthermore, the application of self-distillation further refines detection capabilities. The proposed method offers a robust and precise solution for the intelligent detection of cherry defects.

2. Materials and Methods

2.1. Image Data Acquisition and Preprocessing

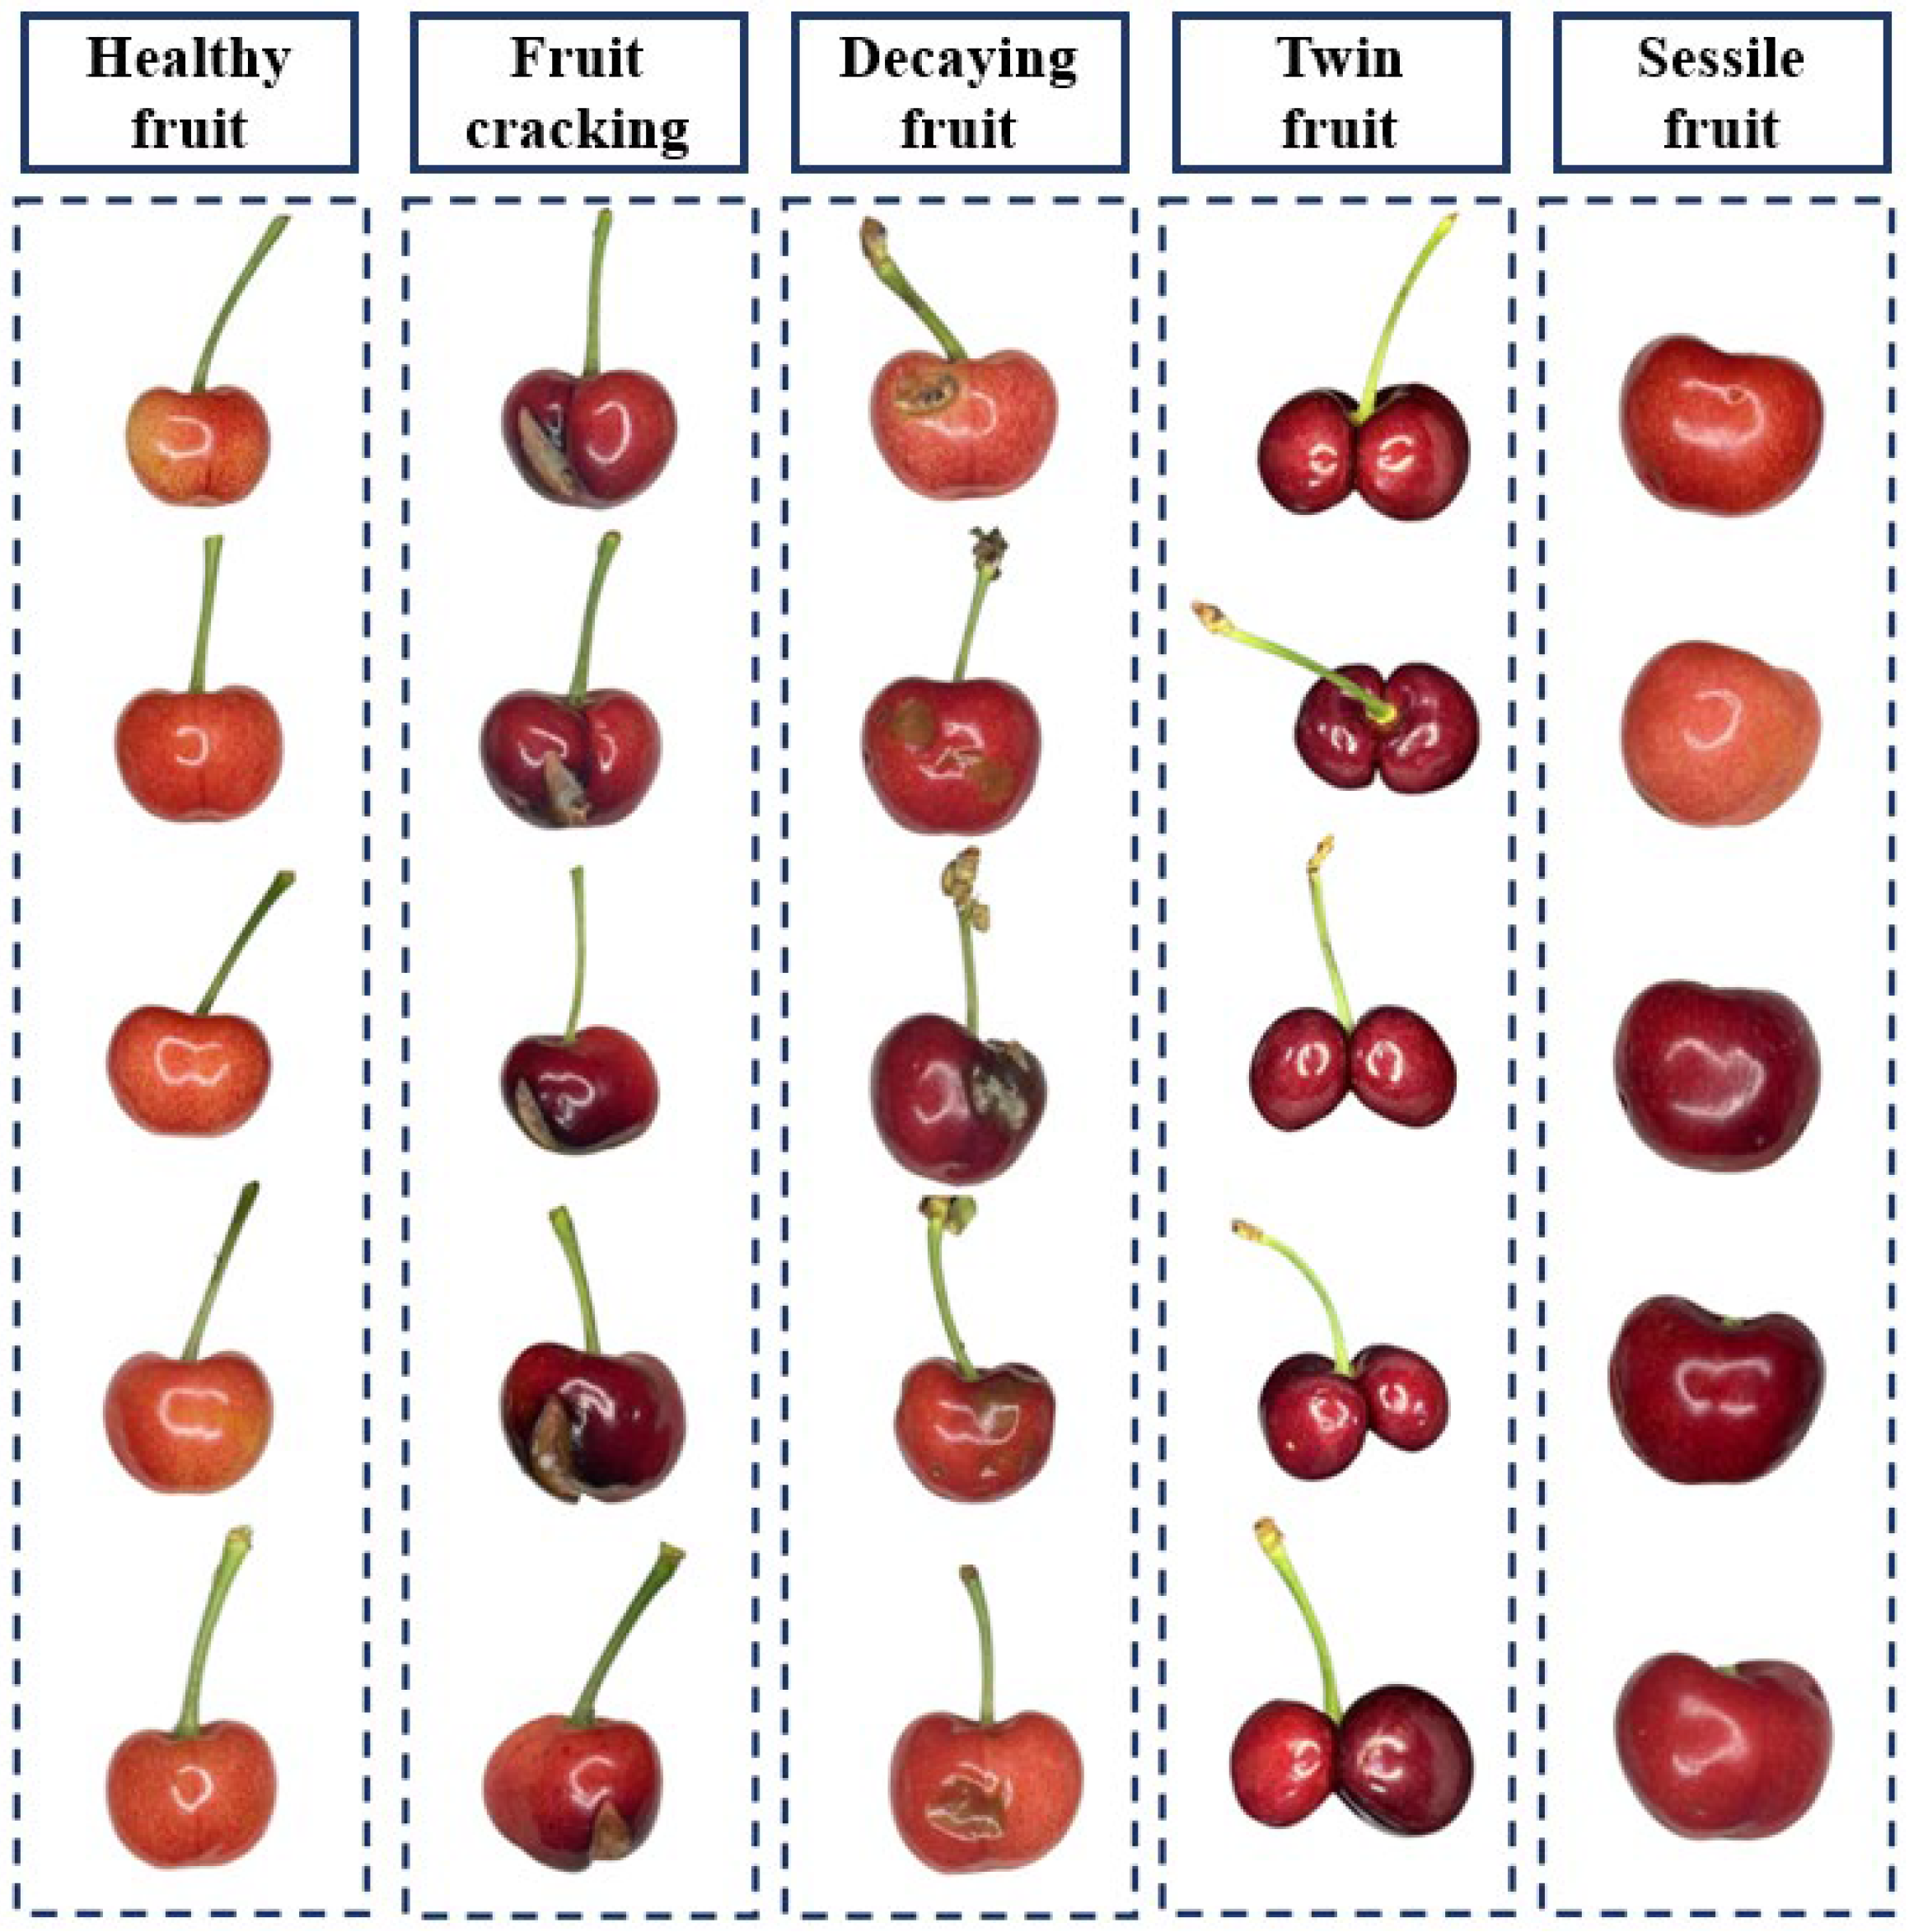
2.1.1. Data Collection

The experimental dataset was collected from a sweet cherry orchard in Tai’an City, Shandong Province (36.00° N, 117°36′ E) on 13 May 2024. To standardize the acquisition of sweet cherry images, an image acquisition platform was constructed, consisting of a phone holder, an iPhone 14 Pro, and a supplemental lighting device. The images were saved in JPG format with a resolution of 3024 × 4032 pixels, captured at a height of 200 mm with the phone under normal lighting conditions. In total, 2080 sweet cherry images were acquired. Of these, 620 images depicted healthy fruits, characterized by intact stems, bright colors, and undamaged skin. The remaining 1460 images contained defective fruits, including cracked, rotted, double-born, and sessile fruits, each with various types of defects.
To improve image quality and highlight defect features, the original images were preprocessed before data analysis. This preprocessing included noise removal, contrast optimization, and other steps to ensure the accuracy of subsequent detection and classification. According to national standards and expert recommendations, cherry defects are classified into the following four categories: cracked fruit, rot, double fruit, and sessile fruit, as shown in Figure 1.

2.1.2. Dataset Production

To address the insufficient samples of cracked and decayed fruits and alleviate the overfitting caused by class imbalance, this study applies image enhancement techniques, including rotation, noise addition, mirroring, and luminance adjustment, to augment the minority class samples and improve dataset balance. By improving both global and local feature representations of cherry images, the feature differences between classes are significantly increased, enhancing the training effectiveness of the deep network and improving the model’s robustness and generalization ability. In total, 3147 cherry image samples were acquired. YOLOv8 uses 640 × 640 pixels as the default input image size. This design strikes an effective balance between detection accuracy and computational efficiency, ensuring high recognition accuracy and fast inference speed, which enhances YOLOv8’s performance in practical applications. During training, the captured images (3024 × 4032 pixels) were uniformly resized to 640 × 640 pixels for YOLOv8 input.
The adjusted images were manually labelled with cherry targets and bounding boxes using LabelImg software, and a corresponding txt file was generated. The dataset was randomly partitioned into three subsets, training, validation, and testing, with a distribution ratio of 7:2:1. This resulted in 2203 images allocated to the training set, 629 images to the validation set, and 315 images to the test set. Additionally, the number of training epochs was set to 100, and the batch size was set to 32 based on preliminary tests.

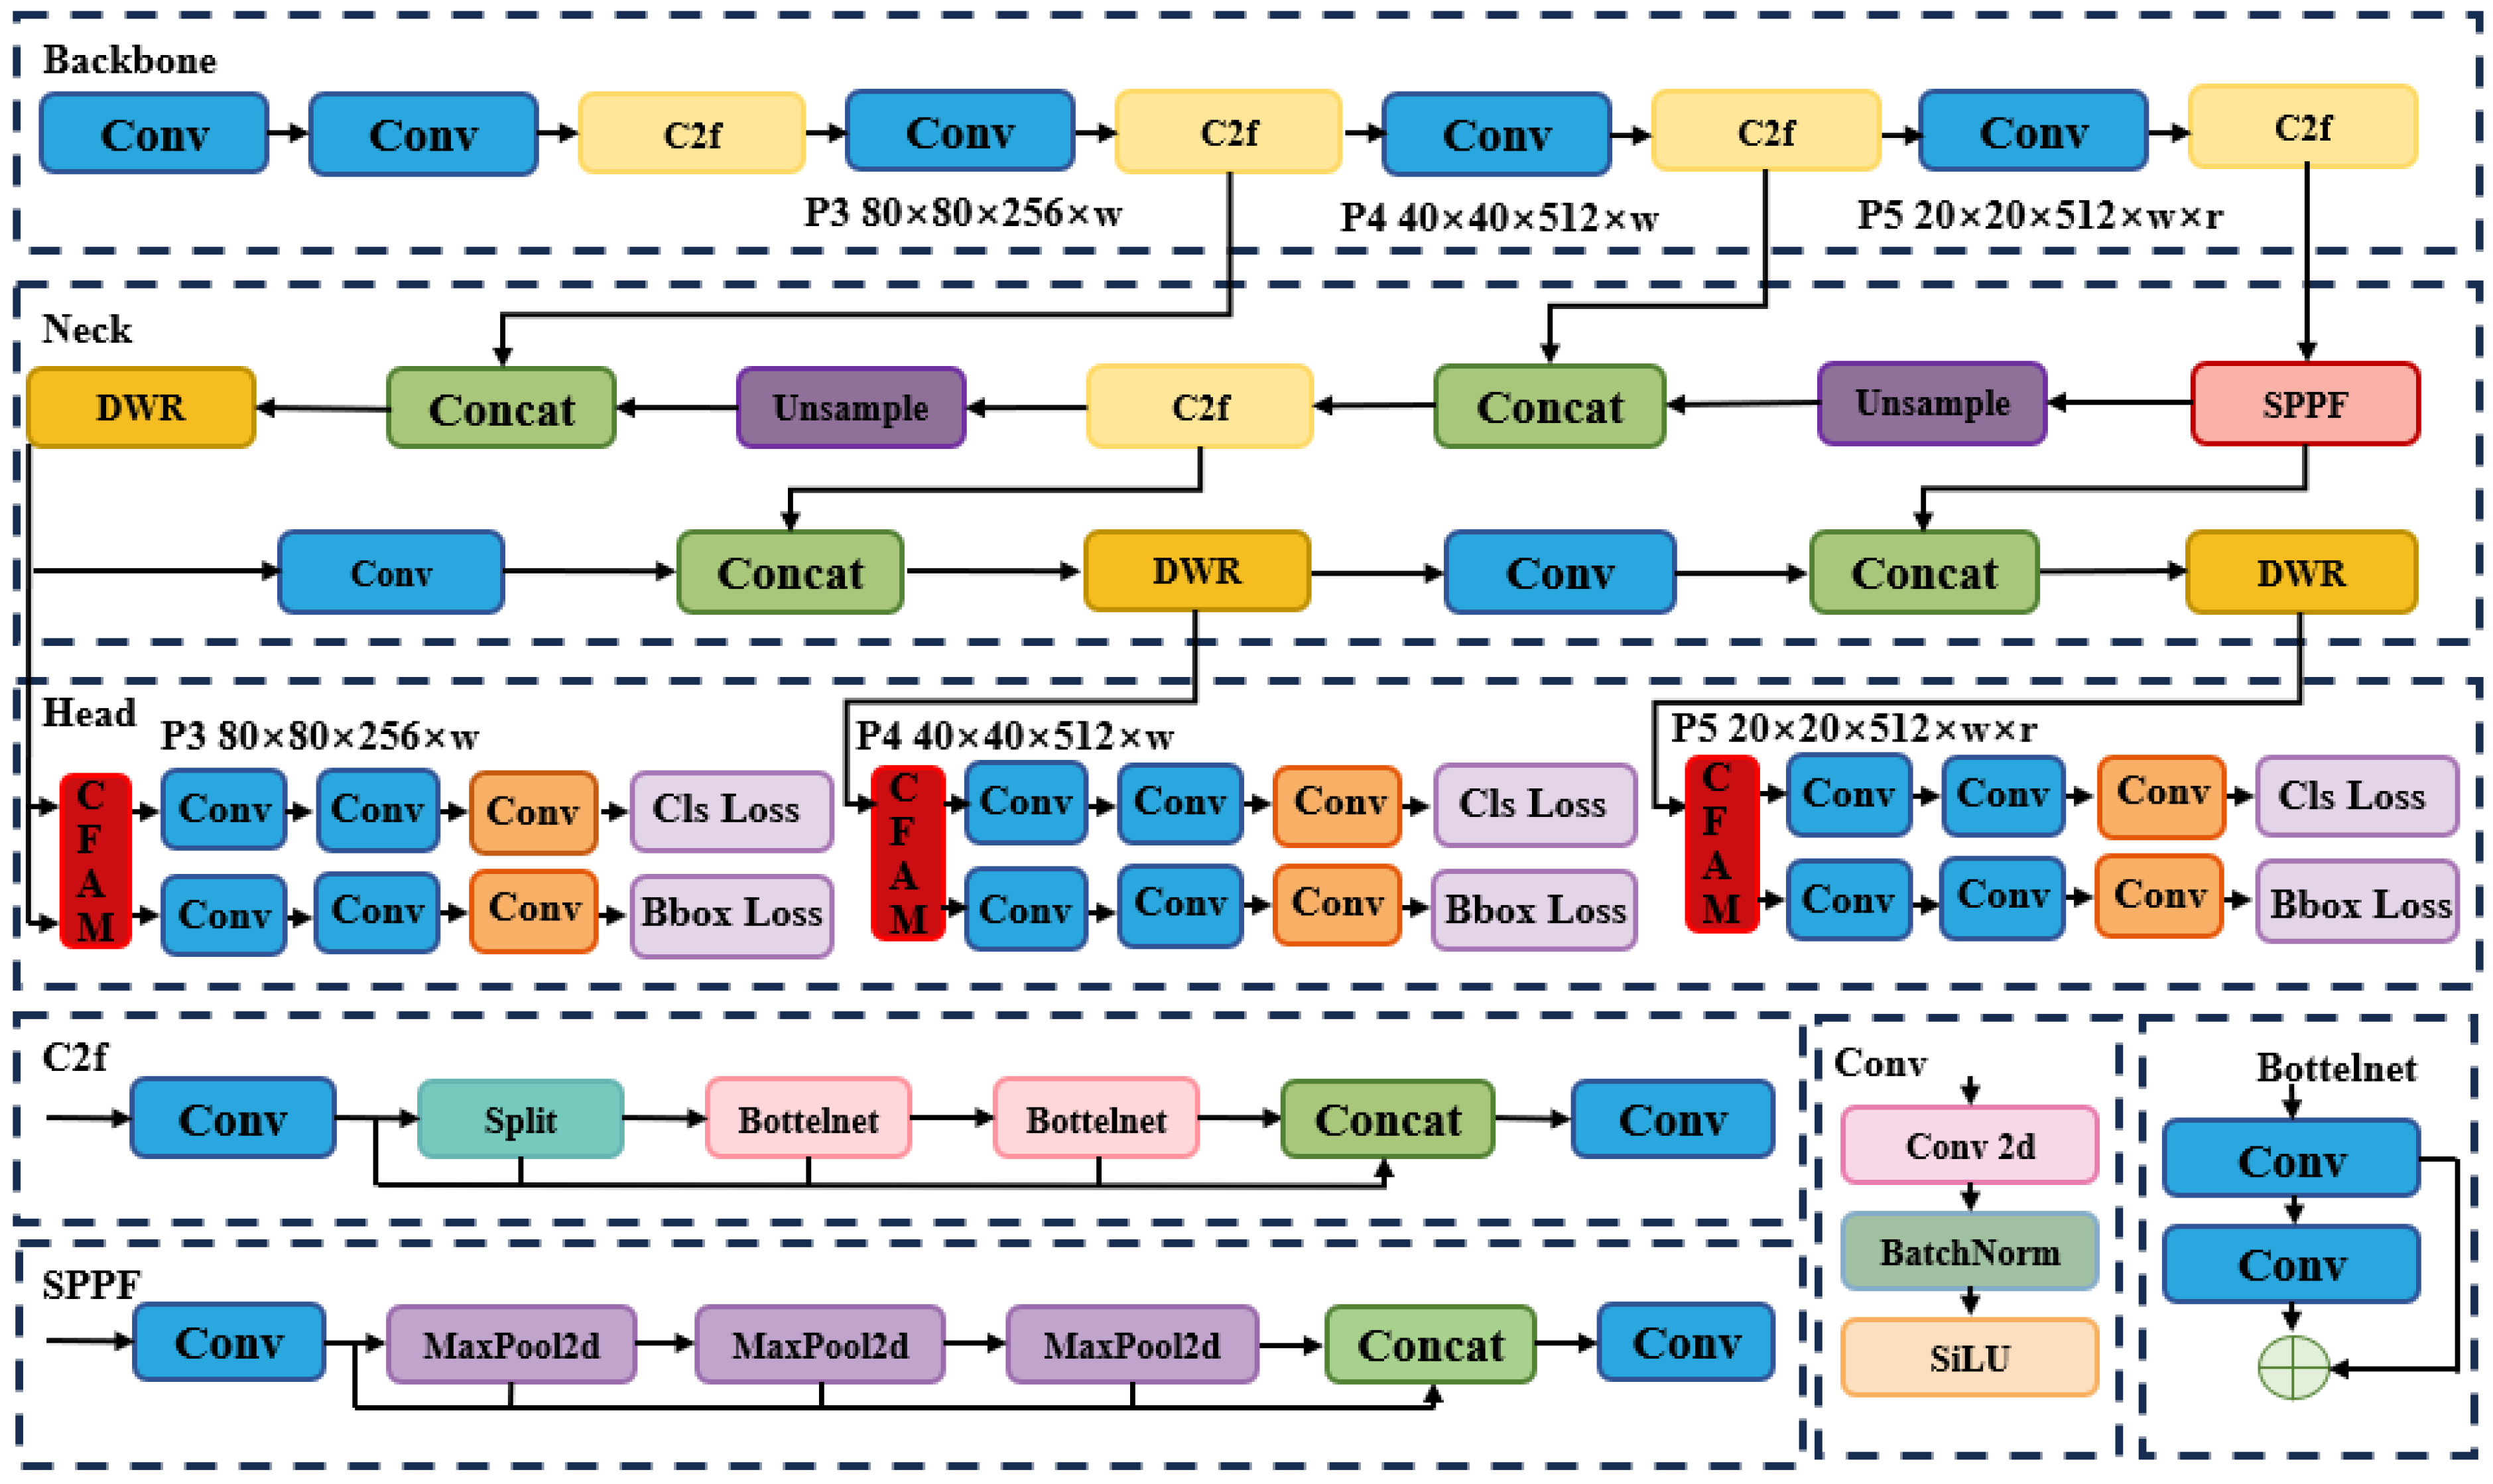
2.2. Construction of the YOLO-DCPF Model
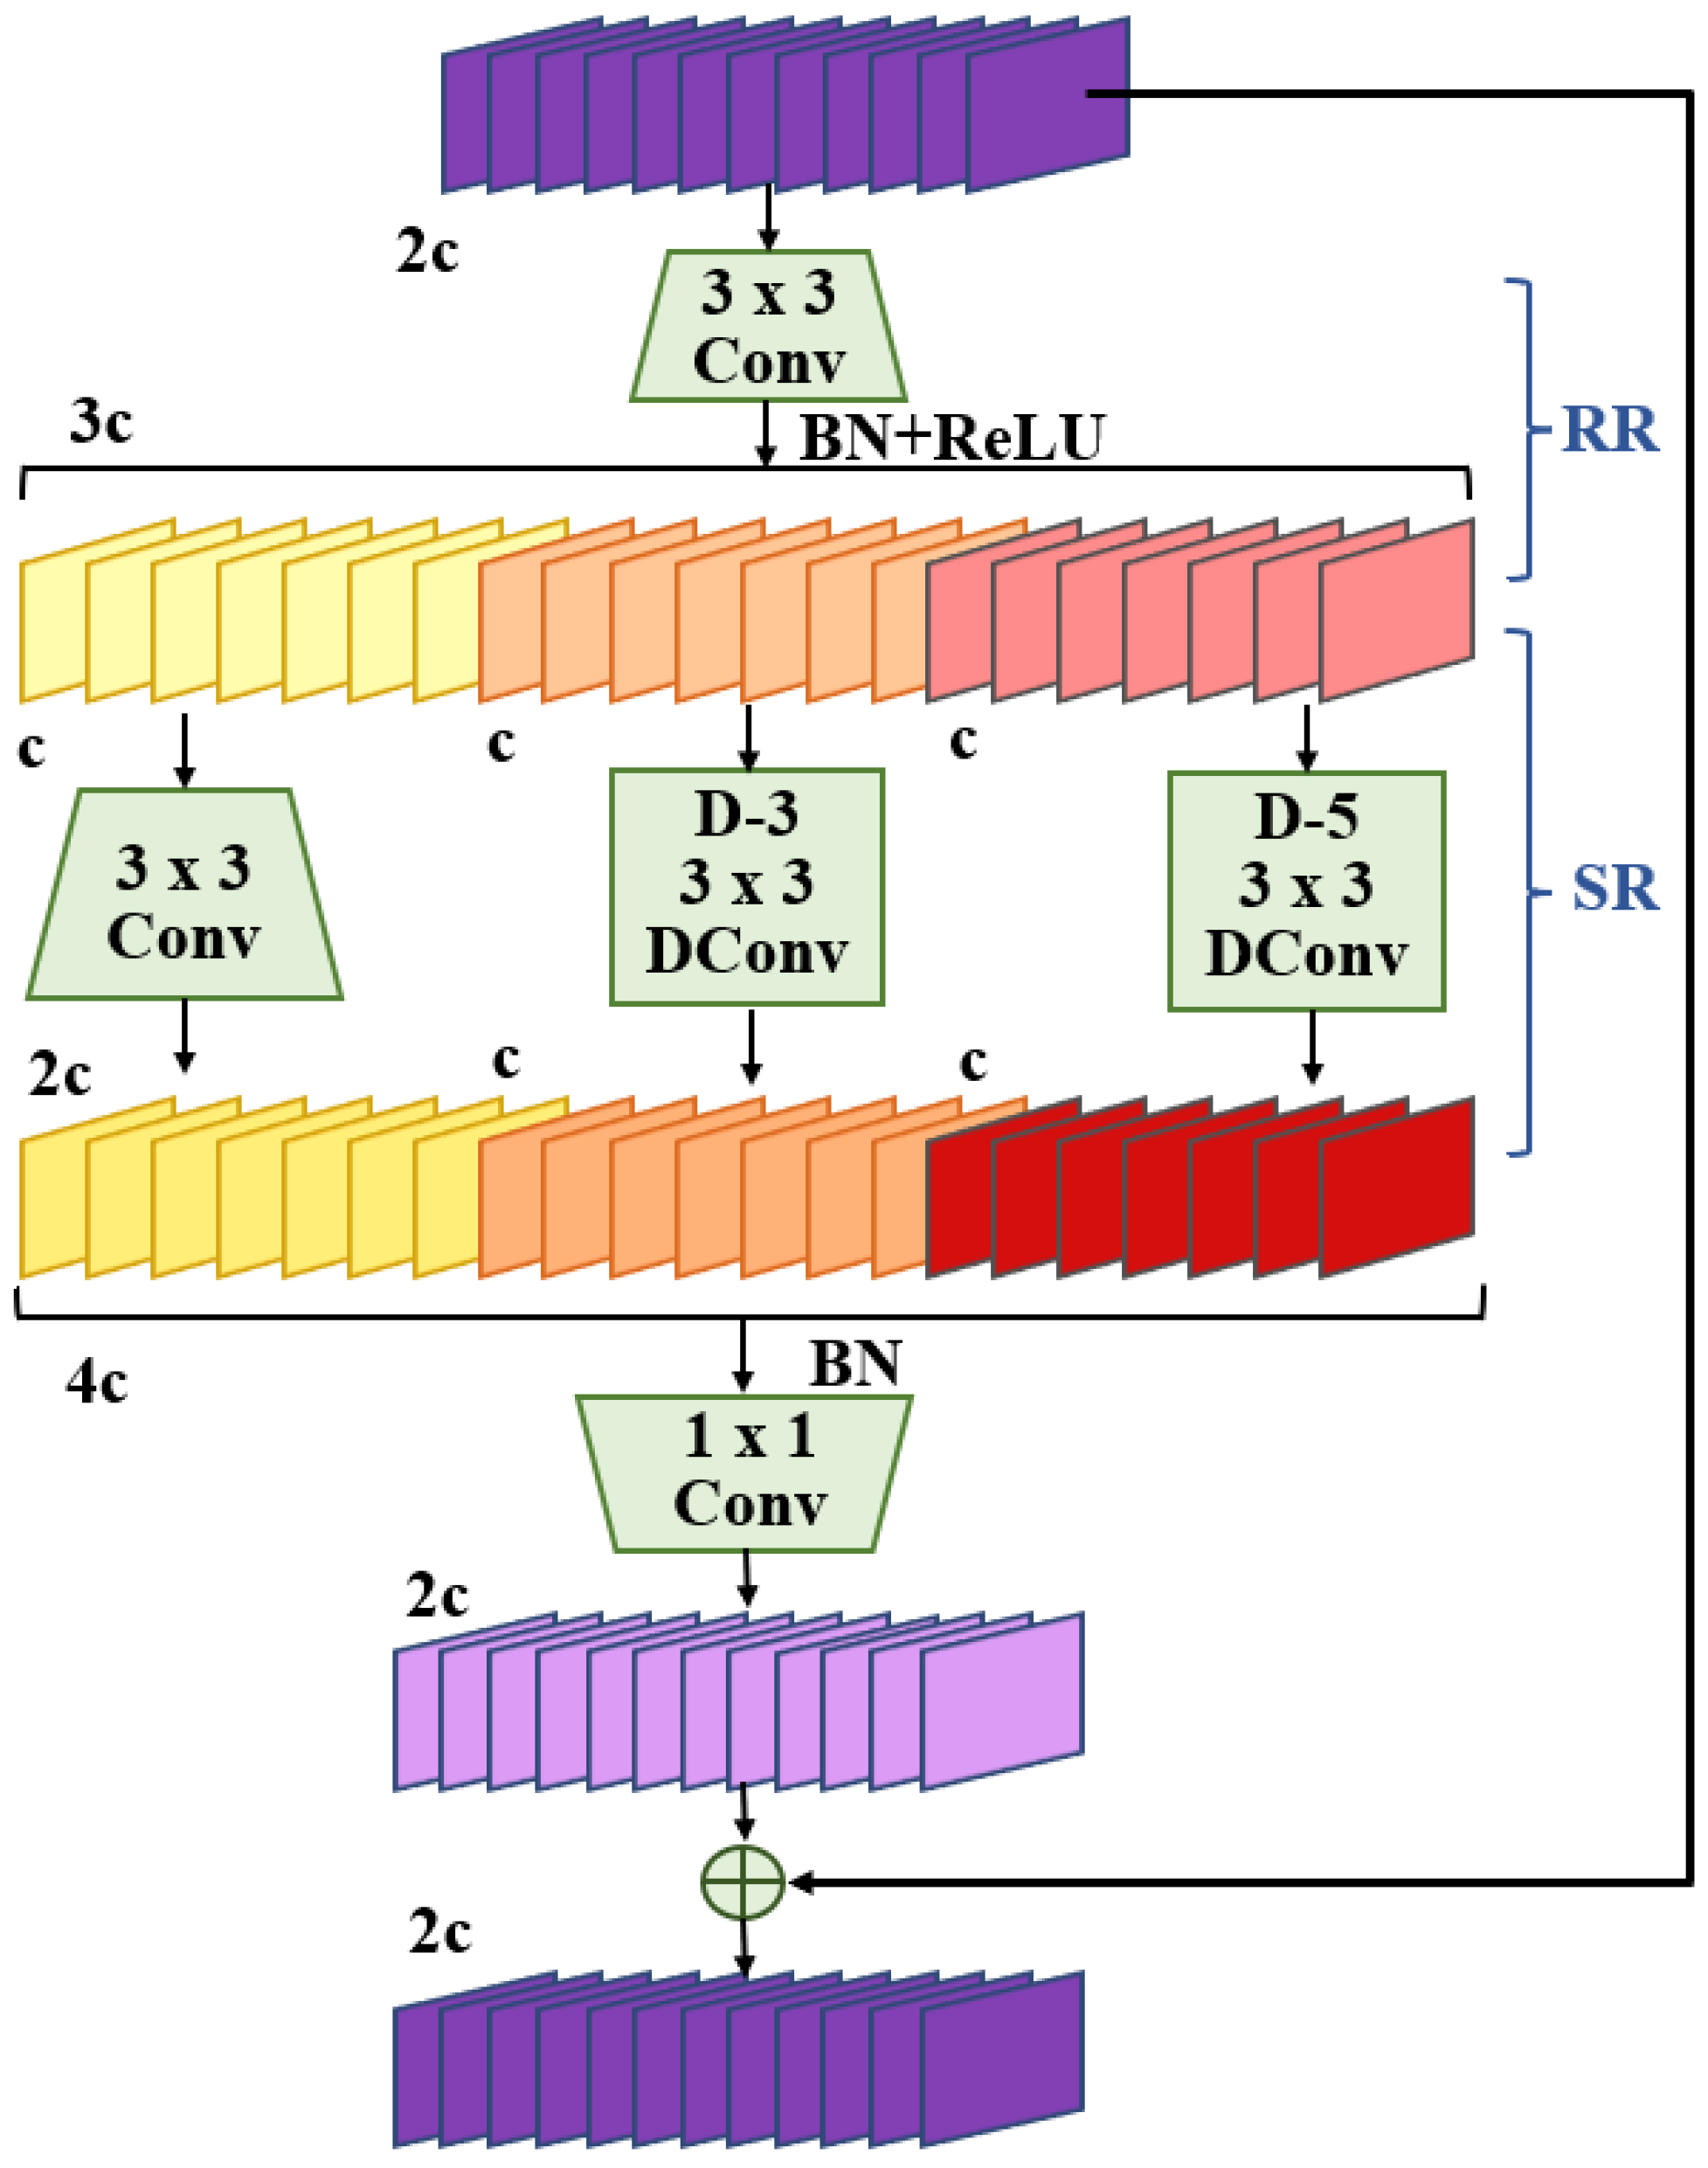
This study tailors the YOLOv8n model’s network structure to address the specific characteristics of cherry target detection, improving the model in four key areas to enhance both performance and practicality. First, the DWR module is adopted in the neck module, which adapts flexibly to features at different scales by dynamically adjusting feature weights, significantly improving the efficiency of multi-scale information capture. Second, to address the limitations of the traditional inspection head in feature extraction, the CAFM attention mechanism is introduced at the front end. This mechanism improves detection accuracy by enhancing the feature response of small targets and defective regions. Additionally, to address the insufficient accuracy of bounding box regression, this study uses the PIoU loss function to replace the traditional regression loss function. PIoU enhances bounding box regression accuracy by incorporating geometric and angular information of the target. Finally, this study introduces a self-distillation strategy to further improve model performance without increasing computational complexity or parameter count to enhance detection accuracy. The structure of the improved network model is illustrated in Figure 2.

2.2.1. DWR Module

The C2f structure in YOLOv8n enhances object detection at different scales by combining features from both lower and higher layers through cross-stage feature fusion, effectively utilizing feature information across different stages. Although this feature fusion enhances the model’s expressive power, its complex structure increases computational and memory demands. Furthermore, as the network depth increases, the first and last convolutional layers of the C2f module lack residual connections [21], which may lead to gradient vanishing, thereby reducing the performance of object detection.
To address the computational bottleneck caused by frequent cross-stage feature transfer in traditional C2f structures for target detection tasks, the dilation-wise residual (DWR) [22] module is employed as a replacement. The DWR module captures both local details and global contextual information through multi-scale convolution, thereby improving the recognition accuracy of small, localized defects as well as large-scale surface damage on cherries. Due to the variability in morphology and scale of cherry surface defects, the DWR module adaptively adjusts the receptive field based on the size and shape of irregular defects. This adaptive mechanism significantly enhances defect recognition accuracy and allows the model to effectively handle the diversity and complexity of defects in cherry surface detection.
The DWR module adopts a two-step approach to extract multi-scale contextual information using residual structures. First, a feature map is generated by applying a 3 × 3 convolutional layer, followed by a batch normalization (BN) layer and a ReLU activation function. Semantic information at different scales is then captured through an expansive convolution operation. Subsequently, morphological filtering is applied to optimize the receptive field configuration, improving the organization of the learning process, while preserving multi-scale contextual information. Finally, multi-scale information is aggregated through the BN layer, and feature fusion is performed using 1 × 1 convolution to establish residual connections, yielding a more comprehensive feature representation. In layer 15, the DWR module is introduced to enhance the capture of small target details by dynamically adjusting the feature map resolution; in layer 18, an adaptive weighting strategy is introduced to improve small target detection accuracy by dynamically adjusting the weights based on target scale and contextual information; and in layer 21, the simultaneous detection of small and large targets is enhanced by combining multi-scale feature fusion with feature maps of varying resolutions. Experimental results show that the DWR module significantly enhances small target detection accuracy, improves scale adaptation, and reduces computational burden, while maintaining inference efficiency. The specific structure of the DWR module is shown in Figure 3.

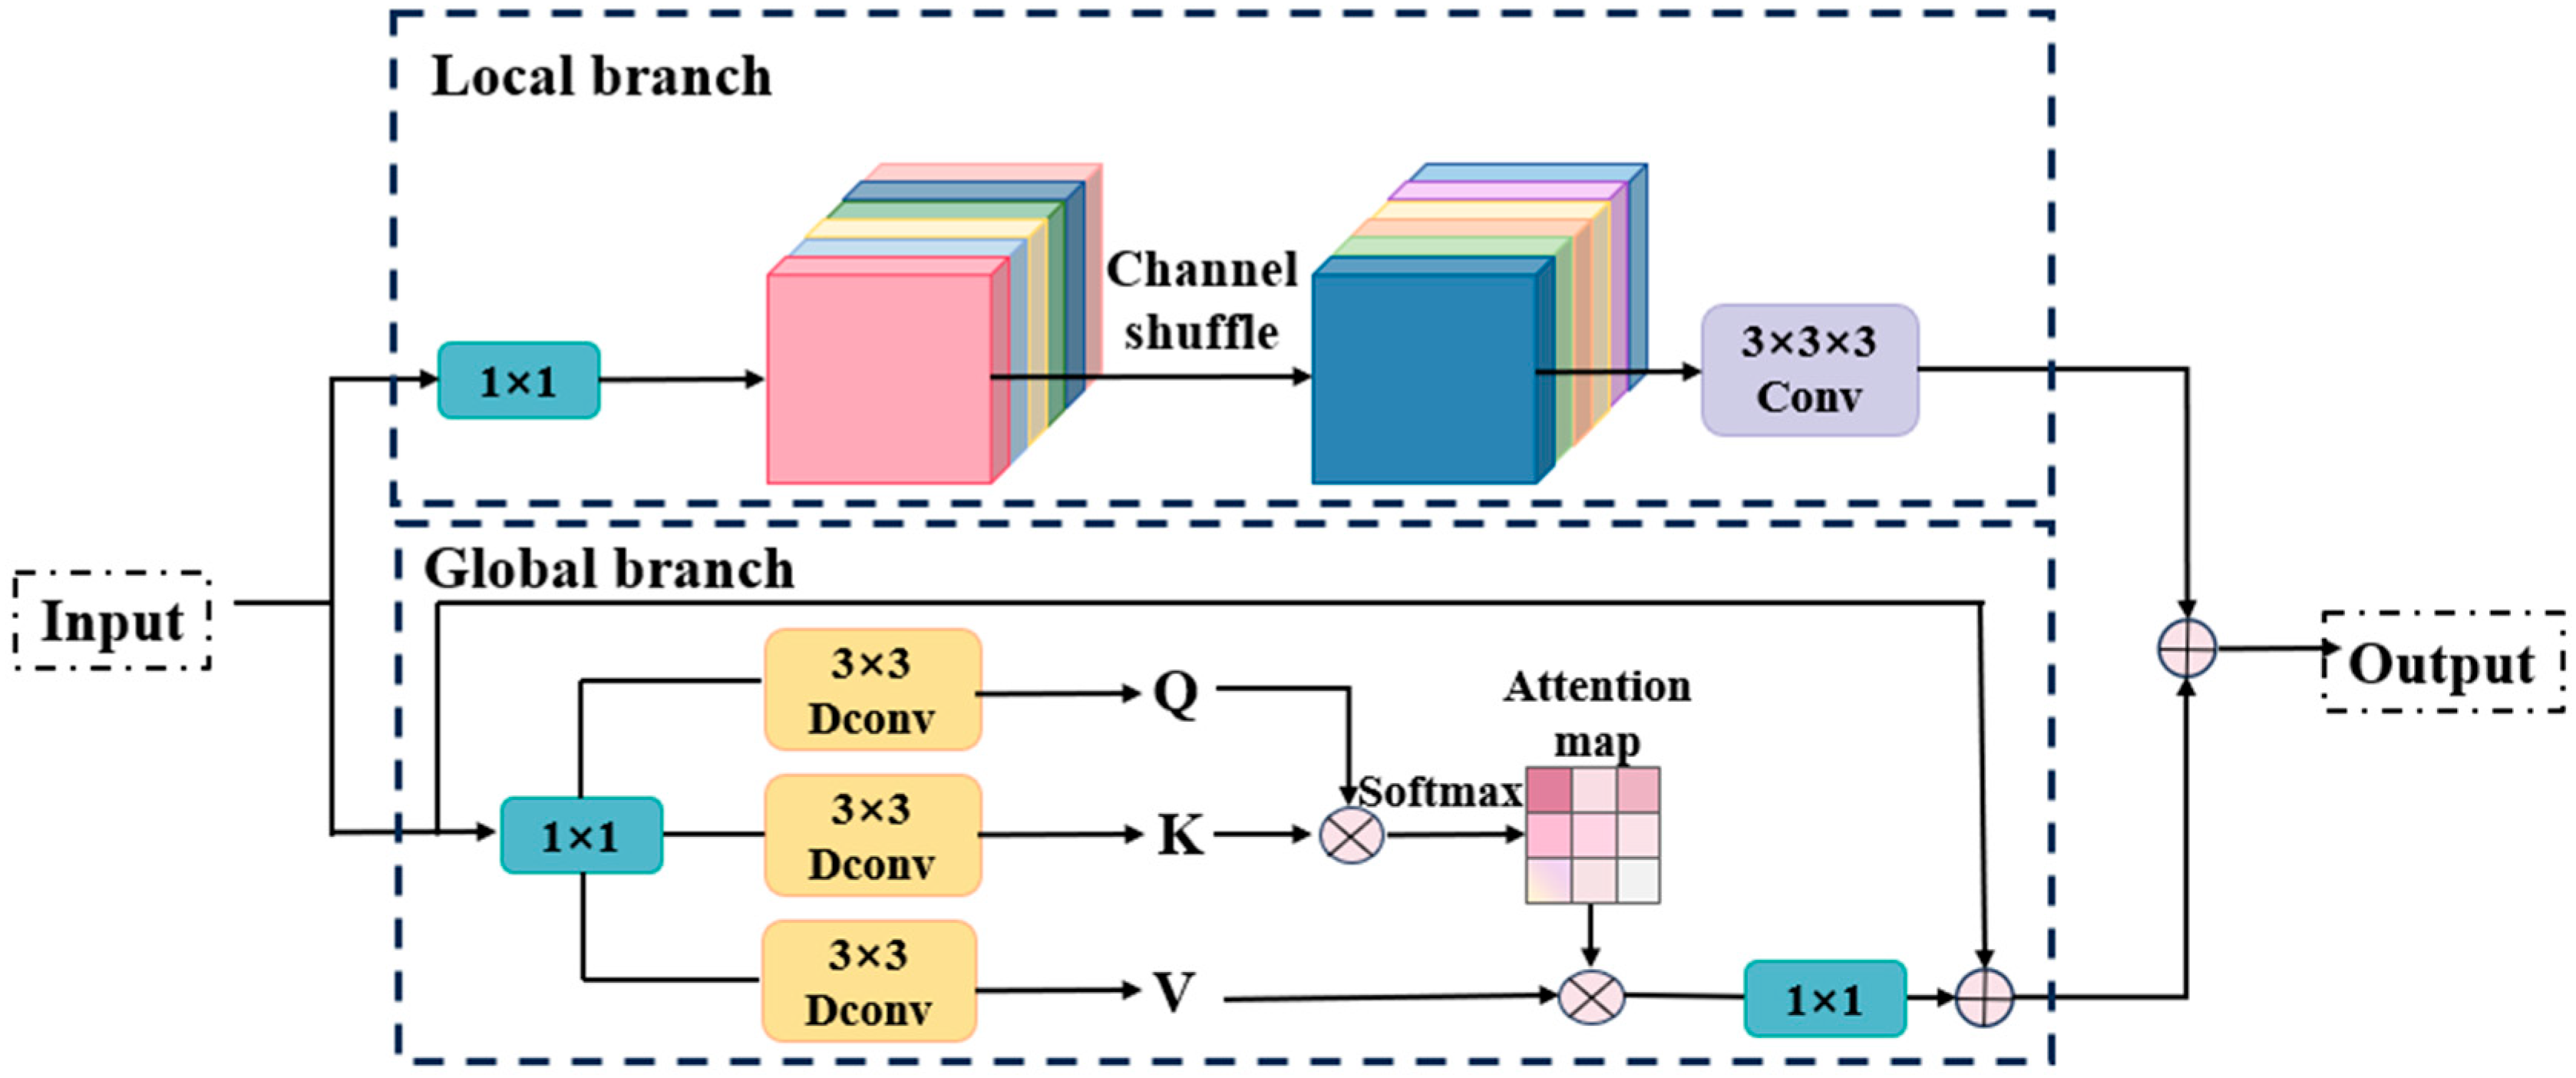
2.2.2. CAFM Attention Mechanisms

To enhance the defective feature extraction capabilities of the YOLOv8-DCPF cherry detection model, this study introduces the convolution and attention fusion module (CAFM) [23] before the detection head, thereby enhancing its ability to extract both global and local features, as shown in Figure 4.
CAFM consists of global and local branches, as illustrated in Figure 4. The global branch primarily extracts global information from the entire feature map and boosts attention on critical features using the attention mechanism. Meanwhile, the local branch fine-tunes the attention mechanism through local contextual information, improving the model’s sensitivity to fine details.
In the global branch of CAFM, the query ( Q ^ ), key ( K ^ ), and value ( V ^ ) are initially generated through 1 × 1 convolution and 3 × 3 deep convolution, and their shapes are adjusted for subsequent processing. Reconfiguring the query ( Q ^ ) and key ( K ^ ) enables effective interaction in the global attention mechanism, enhancing the capture of global information. Compared to traditional global attention methods, CAFM reduces computational overhead by eliminating unnecessary operations and avoiding the generation of large, rule-based attention matrices. The output of the global branch is defined as follows:
F a t t = W 1 × 1 A t t e n t i o n ( Q ^ , K ^ , V ^ ) + Y
A t t e n t i o n ( Q ^ , K ^ , V ^ ) = V ^ S o f t max ( K ^ Q ^ / α )
where W 1 × 1 is 1 × 1 convolution; A t t e n t i o n ( Q ^ , K ^ , V ^ ) is the computation of the attention mechanism, where Q ^ is the query matrix, K ^ is the key matrix, V ^ and is the value matrix; and α is the scaling factor.
By calculating local attention maps in local branching, local branching can better capture small targets or fine-grained features and strengthen the key information in local regions, thus improving the recognition of small targets and targets in complex backgrounds. Local branching enhances the sensitivity of the model to spatial relationships, and local branching F c o n v is expressed as follows:
F conv = W 3 × 3 × 3 ( C S ( W 1 × 1 ( Y ) ) )
where W 3 × 3 × 3 is a 3 × 3 × 3 convolution, and W 1 × 1 is a 1 × 1 convolution. C S denotes the channel shuffle operation, and Y denotes the input features.
Finally, the CAFM module calculates the output equation as follows:
F o u t = F a t t + F c o n v
Therefore, introducing CAFM to the front of the inspection head enhances detection across various scales and defect types, particularly small defects, by precisely weighting channels and spatial features, suppressing noise in redundant channels, and mitigating the impact of background complexity on detection results.

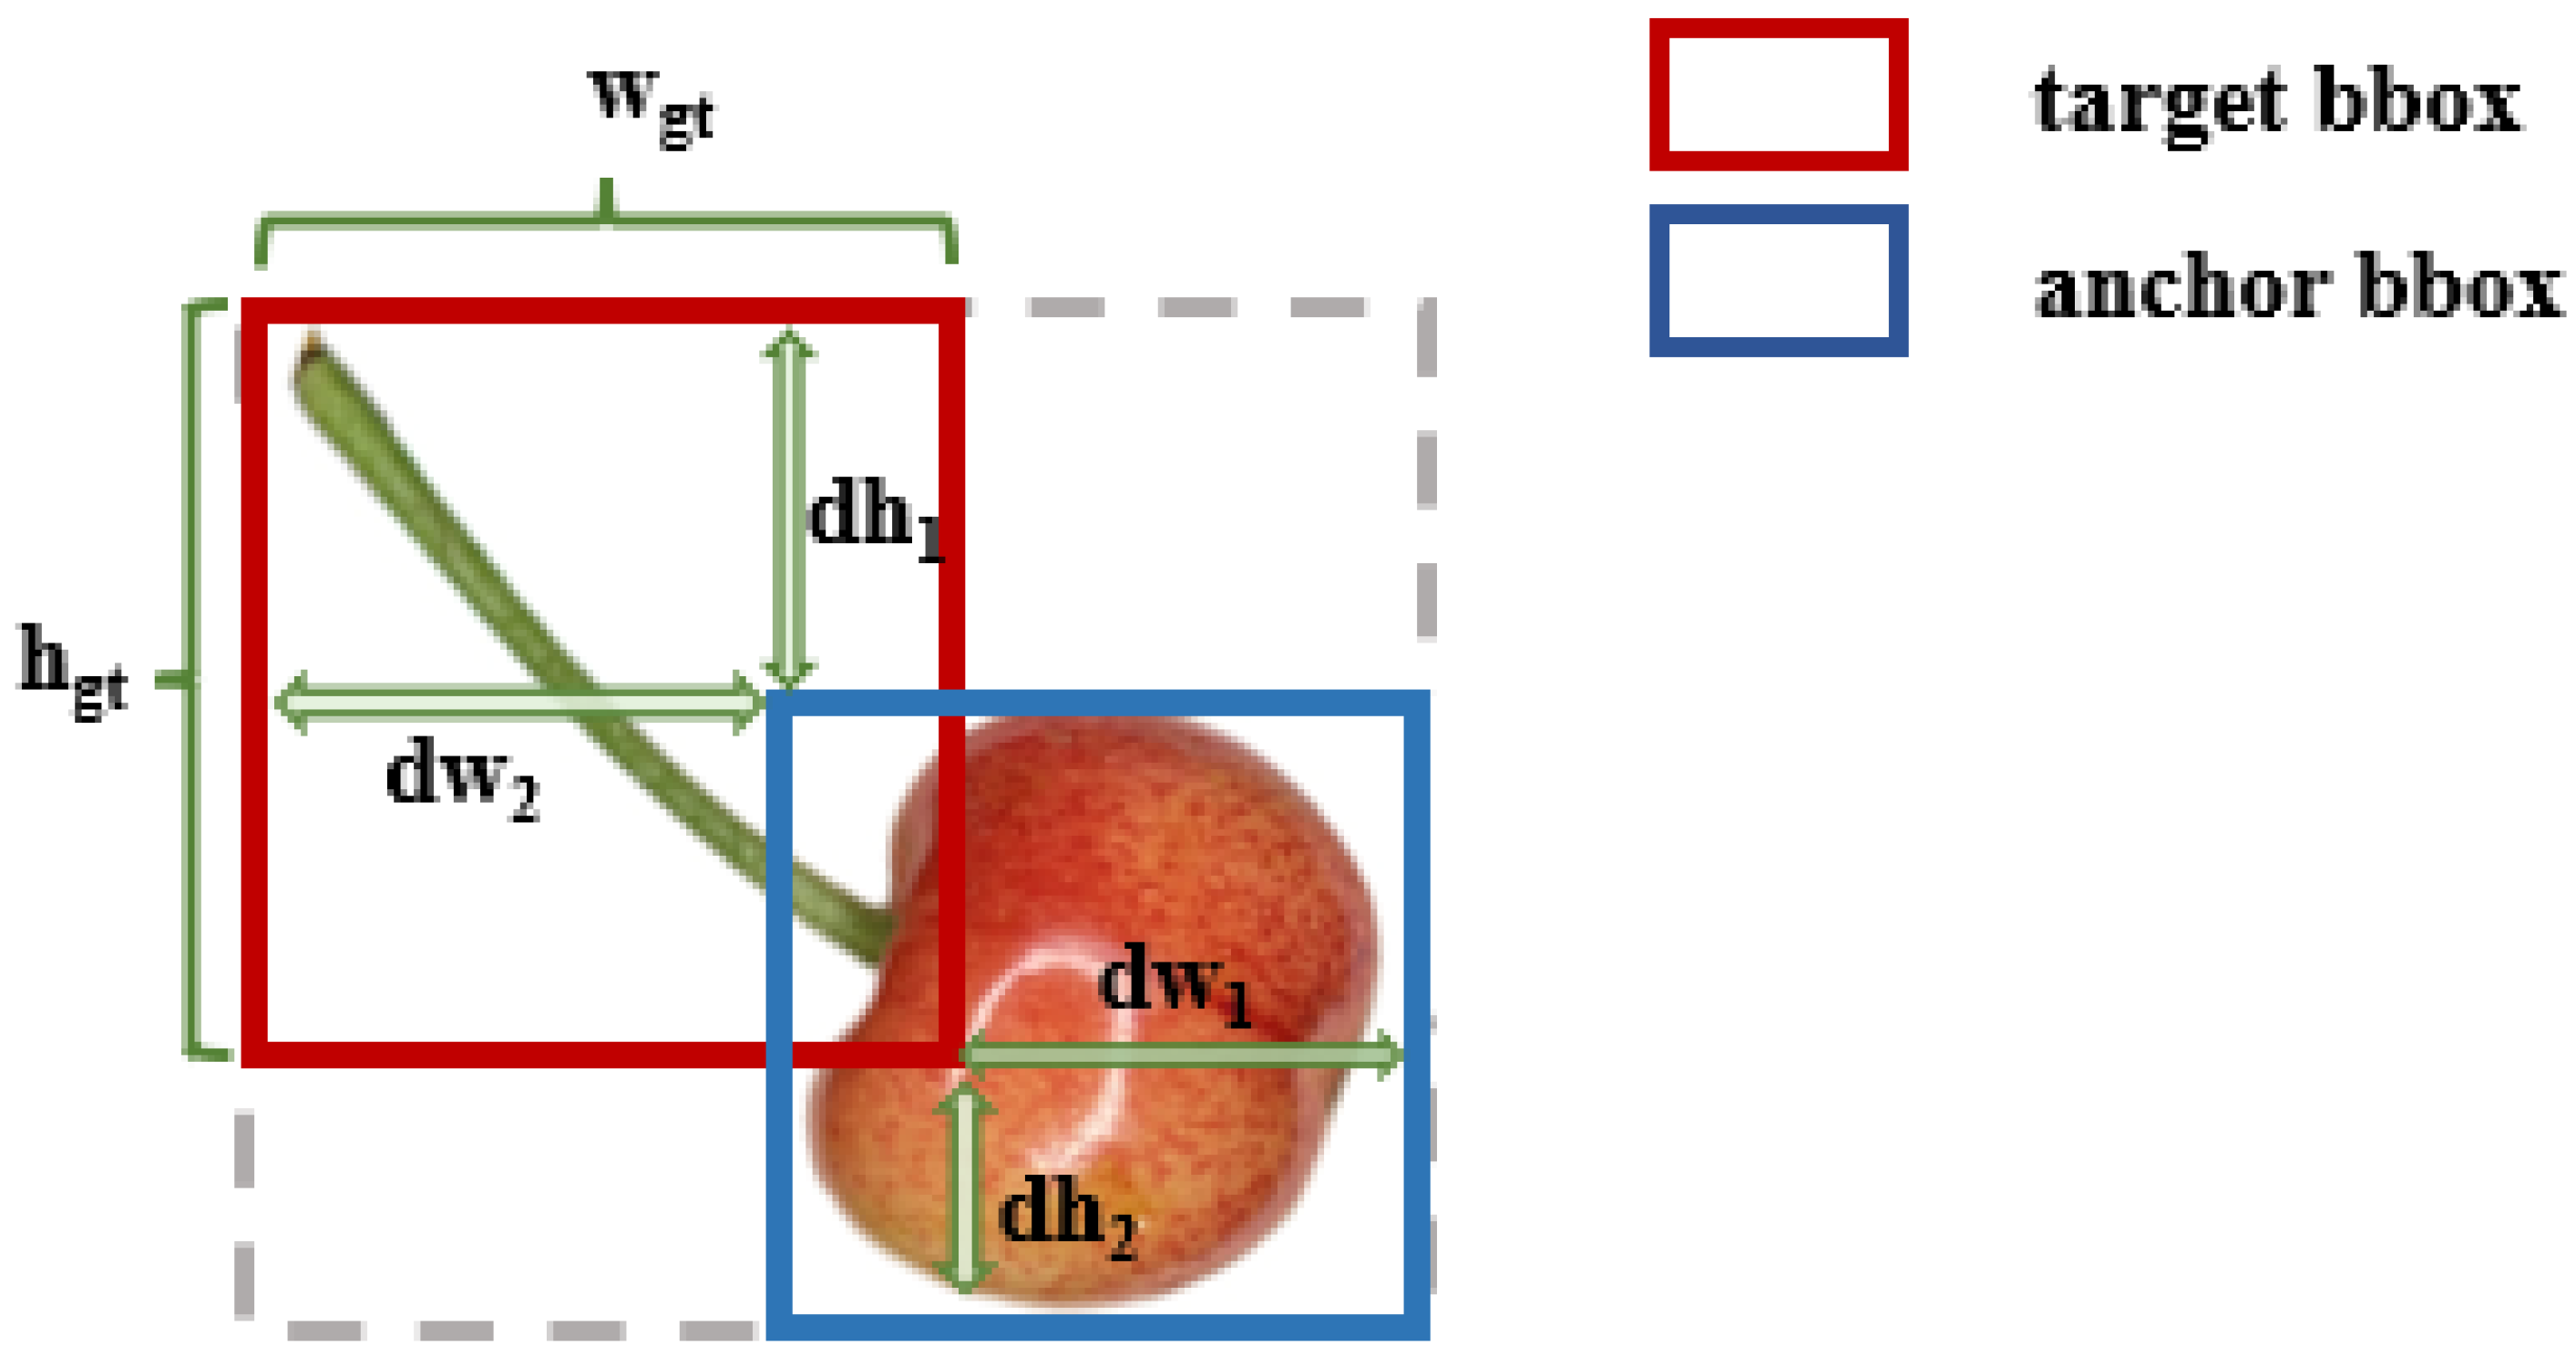
2.2.3. PIoU Loss Function

CIoU used in YOLOv8n has limitations in defect detection, especially for cherry epidermal defects, due to their diverse morphologies, scale variations, and boundary blurring. In particular, for defects with fuzzy boundaries and irregular shapes, CIoU struggles to accurately fit the bounding box regression loss. When there are fluctuations in training data quality or outlier samples, it significantly impacts the model’s generalization and convergence performance. Therefore, powerful-IoU (PIoU) [24] is chosen over CIoU, as shown in Figure 5.
PIoU is a loss function that combines a target size-adaptive penalty factor with a gradient adjustment based on the anchor frame quality, aiming to accelerate the convergence of bounding box regression and enhance target detection performance. It addresses the anchor frame expansion issue caused by the traditional IoU loss function. The penalty factor formula is shown below:
P = ( d w 1 w g t + d w 2 w g t + d h 1 h g t + d h 2 h g t ) / 4
where d w 1 , d w 2 , d h 1 , and d h 2 are the absolute distances between the corresponding edges of the prediction frame and the target frame, and w g t and h g t denote the width and height of the target frame, as shown in Figure 5.
The formula for PIoU is as follows:
L P I o U = L I o U + 1 e P 2 , 0 L P I o U 2

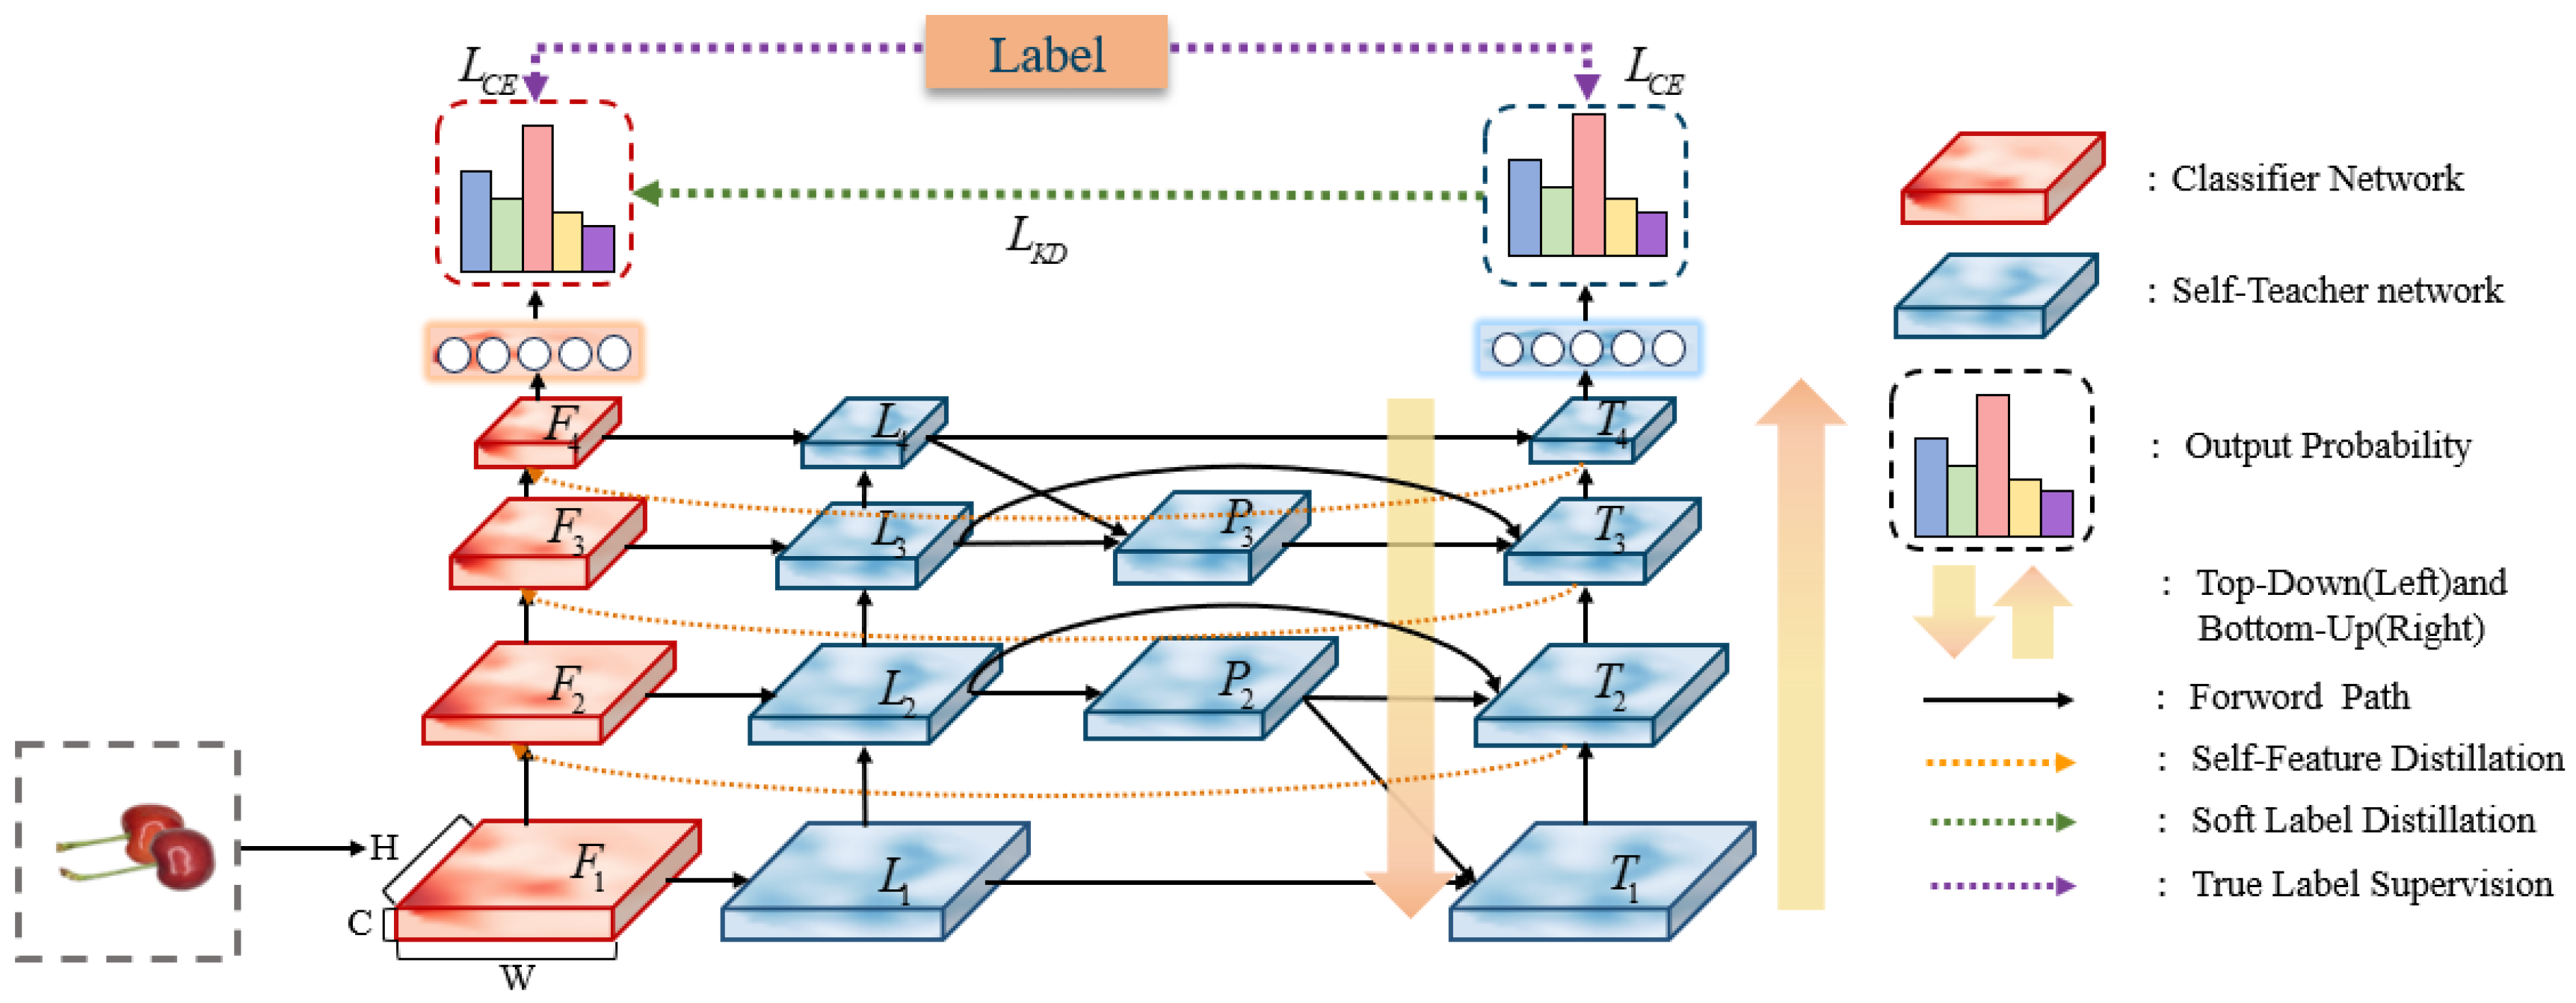
2.2.4. Self-Distillation

Self-distillation [25] is a form of knowledge distillation that does not require large teacher models, unlike traditional knowledge distillation. It can improve model accuracy and enhance generalization ability without additional computational cost. This study introduces a feature refinement method through self-knowledge distillation (FRSKD) [26], which leverages feature graph extraction and soft labeling. The structure of FRSKD is shown in Figure 6.
The self-teacher network performs multi-level fusion of the feature maps generated by the classifier network via top-down and bottom-up feature aggregation paths to output the refined feature maps along with their corresponding soft labels:
P i = C onv ( w i , 1 P L i + w i , 2 P Resize ( P i + 1 ) ; d i )
T i = C onv ( w i , 1 T L i + w i , 2 T P i + w i , 3 T Resize ( T i 1 ) ; d i )
where P i denotes the i layer of the top-down path; w i , 1 P and w i , 2 P are the weight parameters; L i is the teacher model feature of the layer; d i denotes the number of output channels or feature dimension of the i the layer; and T i is the i layer of the bottom-up path.
Subsequently, the feature distillation loss function (FDL) is utilized to direct the classifier network to mimic the feature maps generated by the self-teacher network in order to enhance the model’s ability to capture localized features, defining the FDL as L F :
L F ( T , F ; θ c , θ t ) = i = 1 n ϕ ( T i ) ϕ ( F i ) 2
where T i is the feature map of the self-teacher network; F i is the feature map of the classifier network; ϕ is the channel pooling function; and θ c is the parameters of the classifier network.
Furthermore, the soft label distillation loss function based on KL divergence is employed to guide the classifier network in fitting the soft label distribution of the self-teaching network, thereby enhancing the model’s generalization performance, as follows:
L K D ( x ; θ c , θ t , K ) = D K L ( s o f t max ( f c ( x ; θ c ) K ) s o f t max ( f t ( x ; θ t ) K )
where x is the input data; f c and f t are the outputs of the classifier network and the self-teacher network, respectively; and K is the temperature parameter.
Finally, the above loss function is combined with the traditional cross-entropy loss function to construct the total loss function as follows:
L F R S K D ( x , y ; θ c , θ t , K ) = L C E ( x , y ; θ c ) + L C E ( x , y ; θ t ) + α L K D ( x ; θ c , θ t , K ) + β L F ( T , F ; θ c , θ t )
where L C E is the cross-entropy loss function; L K D is the loss function of soft label distillation; L F is the feature loss function; α and β are the weight parameters.

2.3. Test Environment

The models in this study were trained on a Windows 10 (64-bit) operating system, equipped with 90 GB of RAM, an RTX 4090 GPU (24 GB), and an Intel(R) Xeon(R) Platinum 8352V CPU @2.10 GHz, running CUDA 12.1, with the development environment being python12.1, and use the PyTorch 2.3.0 deep learning framework. It was found through experiments that when the epoch was set to 100, the curve tended to be stable. Therefore, the number of training rounds was set to 100. Each time the number of input images is 32, the resolution of the input images is 640 × 640 pixels, the initial learning rate is set to 0.01, the weight decay coefficient is 0.0005, and the SGD optimizer is used for iterative optimization during model training.

2.4. Evaluation Indicators

In this study, precision (P), recall (R), mean average precision (mAP), and F 1 were used as model detection accuracy assessment metrics, as shown in Equations (12)–(15).
P = T P T P + F P × 100 %
R = T P T P + F N × 100 %
m A P = 0 1 P ( R ) d R × 100 %
F 1 = 2 × P r e c i s i o n × R e c a l l P r e c i s i o n + R e c a l l
where T P denotes a positive sample and was correctly predicted, F P denotes a positive sample but was incorrectly predicted, and F N denotes a negative sample but was incorrectly predicted.

3. Results and Discussion

3.1. Ablation Experiments

To evaluate the performance enhancements of the YOLOv8-DCPF model, this study conducts a phase-by-phase comparative analysis with the baseline YOLOv8 model to evaluate the effectiveness of each optimization module. The specific experimental results are presented in Table 1. As shown in Table 1, the improved network maintains the required detection performance after modifications such as replacing the C2f module, introducing the attention mechanism, and adjusting the loss function in the YOLOv8n baseline network. By replacing the traditional C2f with the DWR module at layers 15, 18, and 21, the precision, mAP, and recall increase by 0.6, 0.3, and 0.3 percentage points, respectively. Furthermore, when the CAFM attention mechanism is incorporated in front of the detection head, the mAP improves by 0.7 percentage points compared to the original YOLOv8 model, and precision increases by 2.5 percentage points over the DWR-modified model. These results demonstrate that the CAFM mechanism effectively enhances the detection accuracy of small targets with unclear boundaries and improves the feature extraction capability for various defects. The introduction of the PIoU loss function further boosts the accuracy of cracked and rotting fruit detection by 7.1 and 7.2 percentage points, respectively, indicating that the PIoU loss function can adapt to targets of different scales and distinguish similar features effectively. Finally, the model undergoes self-knowledge distillation, which compensates for the original model’s limitations in detecting cracked and rotting fruits, enhancing precision without additional computational or memory cost.
In summary, the ablation tests demonstrate that the improvements made to YOLOv8n in this study are effective. Compared to the baseline network, the enhanced model shows an increase in precision by 6.9 percentage points, with substantial improvements in detecting cracked and rotted fruits by 11.5 and 11.1 percentage points, respectively. Additionally, the mAP increases by 5.6 percentage points, recall improves by 6.1 percentage points, and F1 score improves by 5.0 percentage points.

3.2. Performance Analysis of Adding DWR Module at Different Locations

Based on the original YOLOv8 model, the C2f module is replaced, and the feature map is weighted and adjusted by introducing the DWR module. The DWR module offers higher flexibility and adaptability during multi-scale feature fusion compared to the traditional C2f module, allowing it to more accurately capture key features of targets at different scales. This not only enhances the model’s ability to recognize subtle defects but also improves the overall accuracy of cherry detection. Table 2 presents the performance after replacing the C2f module with the DWR module at various locations.
As shown in Table 2, the introduction of the DWR module leads to a noticeable improvement, with accuracy increasing as the depth of the feature map at the replacement location grows. However, the best results are achieved after replacing the module at layers 15, 18, and 21. By sequentially replacing layers, the DWR module optimizes feature extraction and information flow at multiple levels, thereby eliminating bottlenecks between layers and mitigating the issue of information imbalance caused by local replacements. As illustrated in Table 2, precision, mAP, and recall rates all improve after replacing the C2f module with the DWR module.

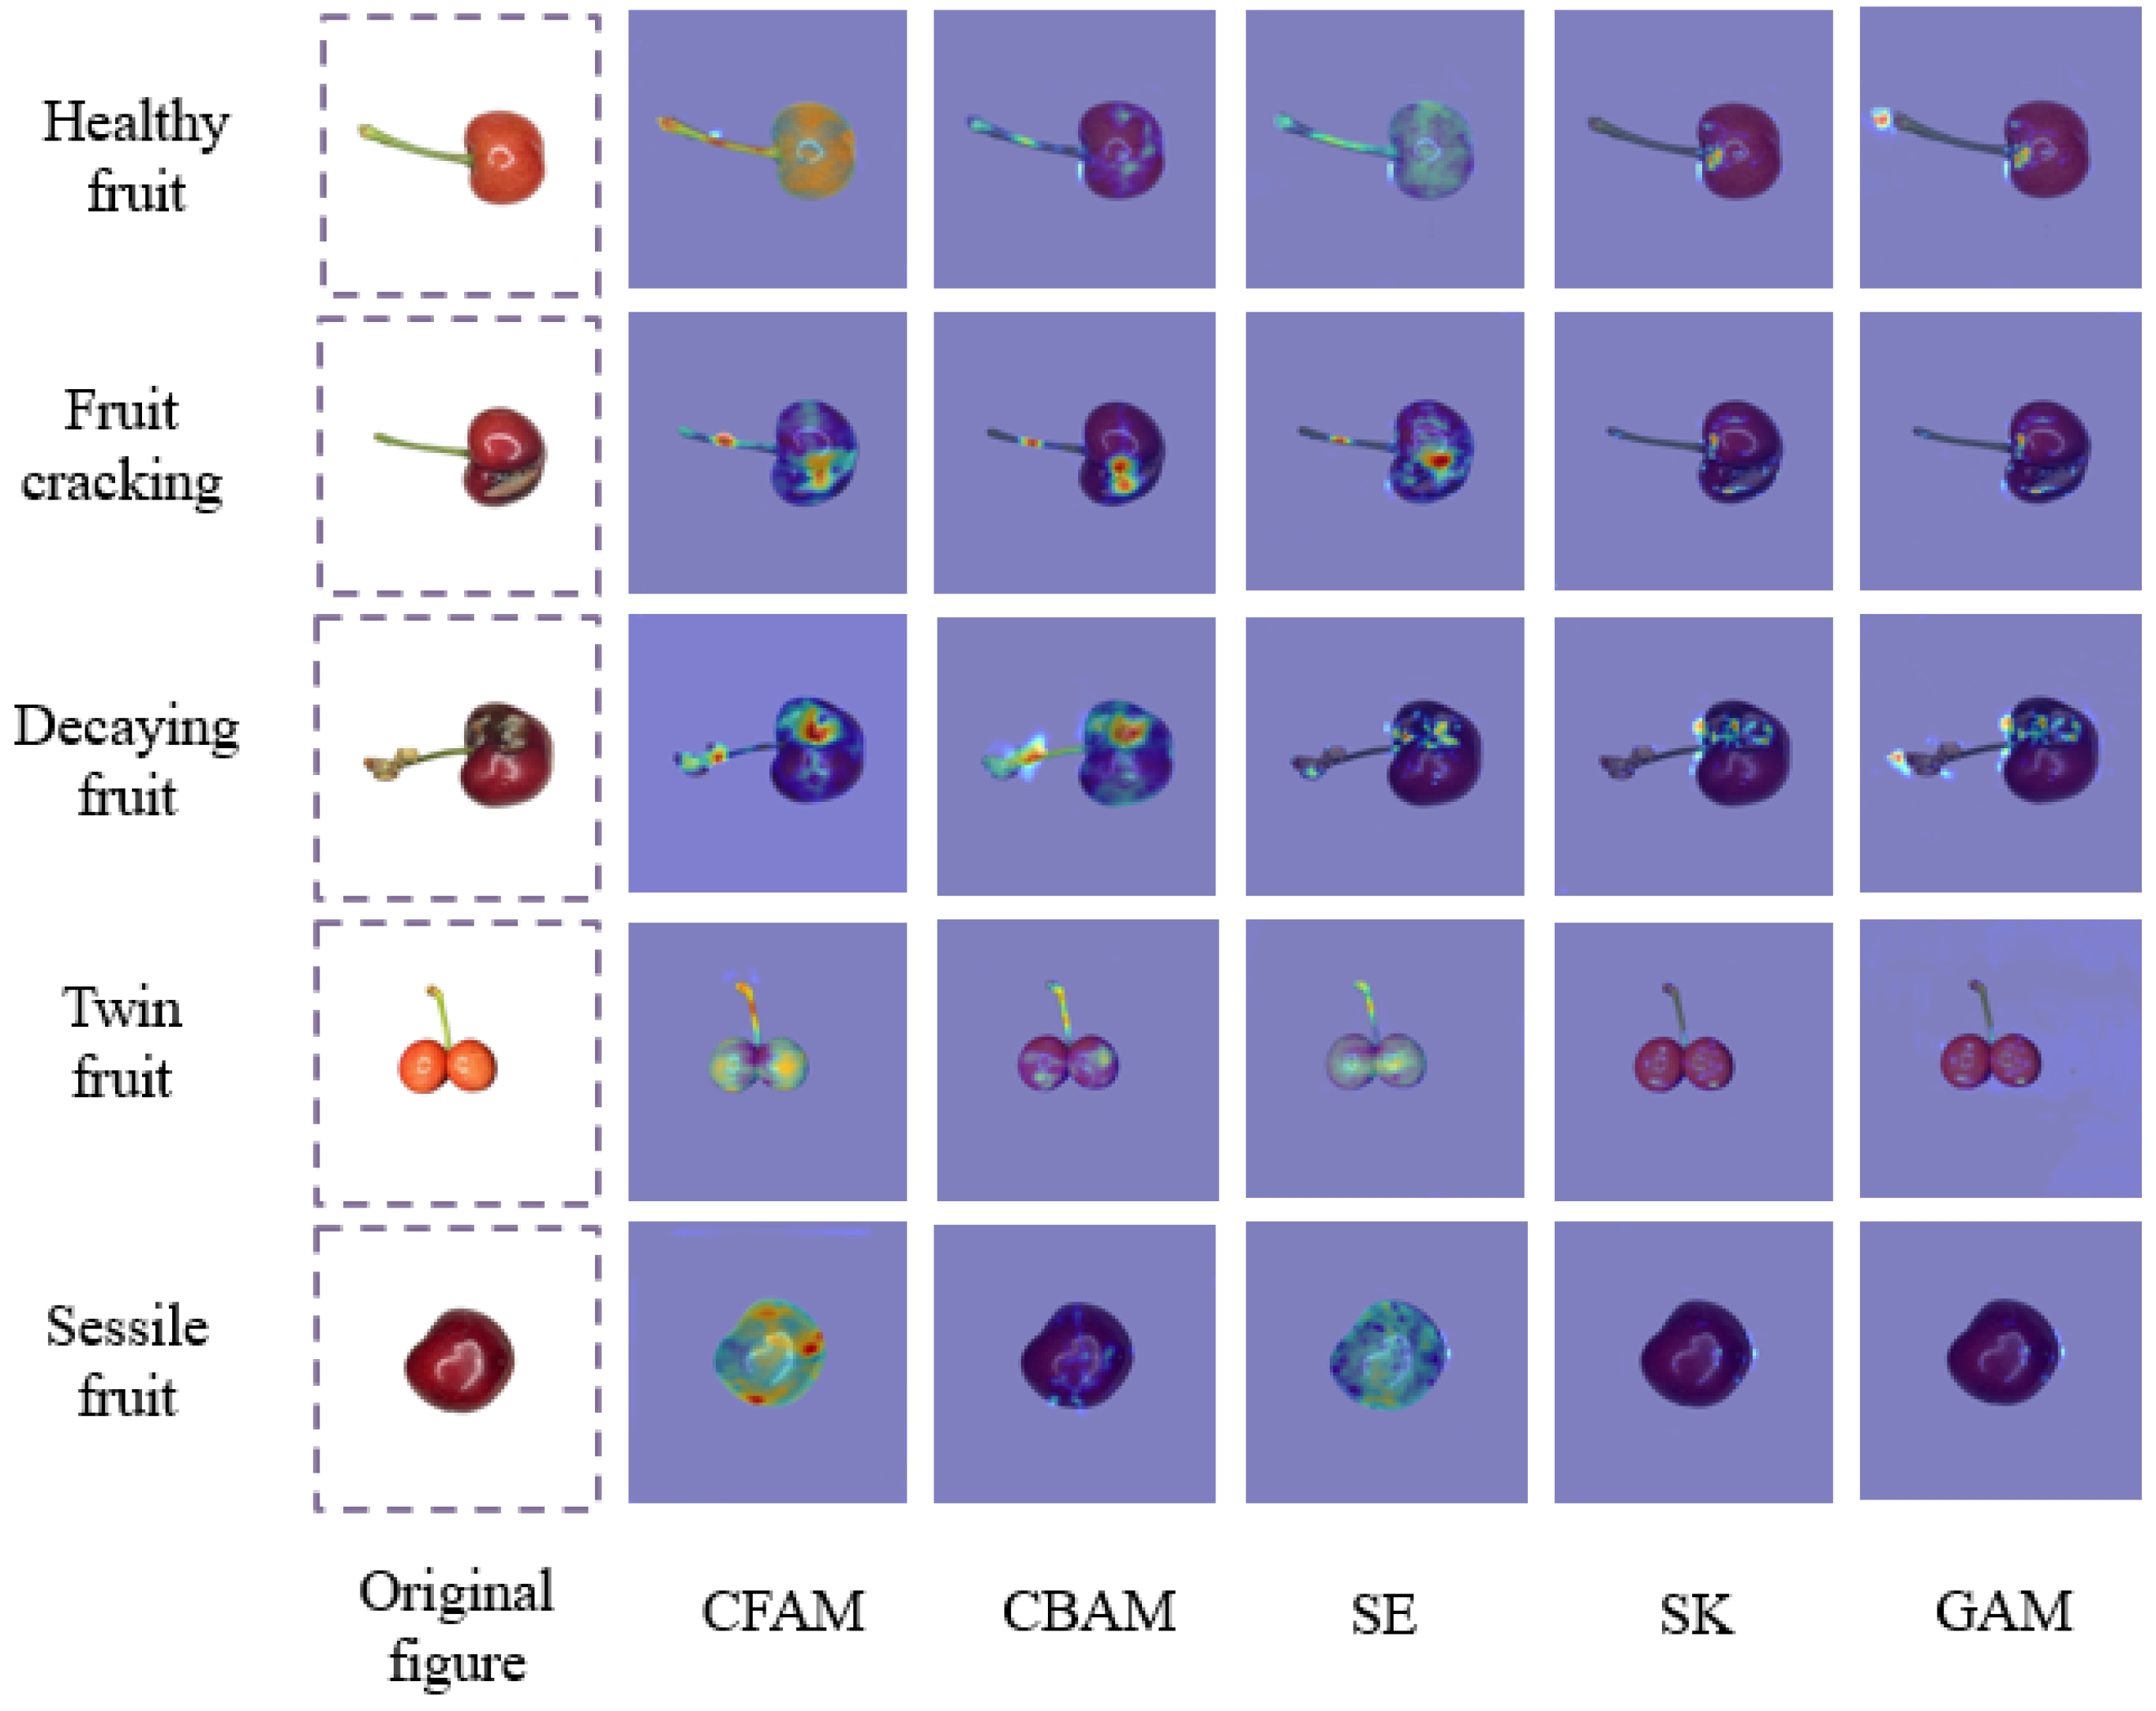
3.3. Comparison of Different Attention

Using YOLOv8 as the base model, the C2f module is replaced, and various attention mechanisms are introduced to enhance the model’s ability to extract key features more efficiently, thereby improving the accuracy and precision of target detection. According to the experimental results shown in Table 3, the CAFM attention mechanism outperforms CBAM, SE, SK, and GAM in terms of training accuracy, mAP, and recall. The performance of different attention mechanisms is detailed in Table 3.
To visualize the recognition of cherry defects by different attention mechanisms, the Grad-CAM [27] method was applied to generate class activation heatmaps, enabling the visualization and analysis of the three output layers of the model.
By displaying these heat maps, the interpretability of the model can be enhanced. A comparison of the experimental results is displayed in Figure 7, where the greater the brightness and area of the red region in the heat map, the greater the importance and attention of that region in the model prediction.
After replacing the C2f module in the neck with the DWR module, CFAM, CBAM, SE, SK, and GAM attention mechanisms were introduced for comparison. As shown in Figure 7, the SE and GAM attention mechanisms capture very little critical information. In contrast, the CFAM attention mechanism clearly enhances both the overall identification of cherries and the detection of local defects, accurately capturing the spatial location of small targets and pinpointing defect locations. Therefore, the CFAM attention mechanism is adopted in this study for cherry defect detection.

3.4. Comparison of Different Loss Functions

Prior to the enhancement, the YOLOv8 object detection model employs CIoU as the bounding box regression loss function, which offers strong fitting capabilities during training. However, it struggles to effectively address issues related to blurred defect boundaries and irregular shapes. In this experiment, SIoU [28], WIoU [29], EIoU [30], and PIoU are adopted, respectively, and the effects of these improvements are compared; then, the improvement method with the best effect is selected. The experimental comparison results are shown in Table 4.
As shown in Figure 8, the EIoU curve fluctuates a lot, and there is an oscillation phenomenon, which is not conducive to fast and stable convergence. WIoU only considers the overlap of the prediction frame and the real frame, which has a certain bias on the evaluation results, and it is difficult to adapt to the diversity of defects. When SIoU is used, the convergence speed is the slowest, and the loss value after convergence is high. In contrast, the gradient of the model decreases the fastest when PIoU is trained and has better stability and convergence. Combined with Table 4, it can be seen that PIoU is 2.7%, 1.9%, 4.4%, and 1% higher than CIoU in precision, mAP, recall, and F1 score, respectively. Its ability to adapt to different scales of features by introducing a finer frame matching mechanism significantly improves the precision and robustness of the model, making it more suitable for cherry defect detection tasks.

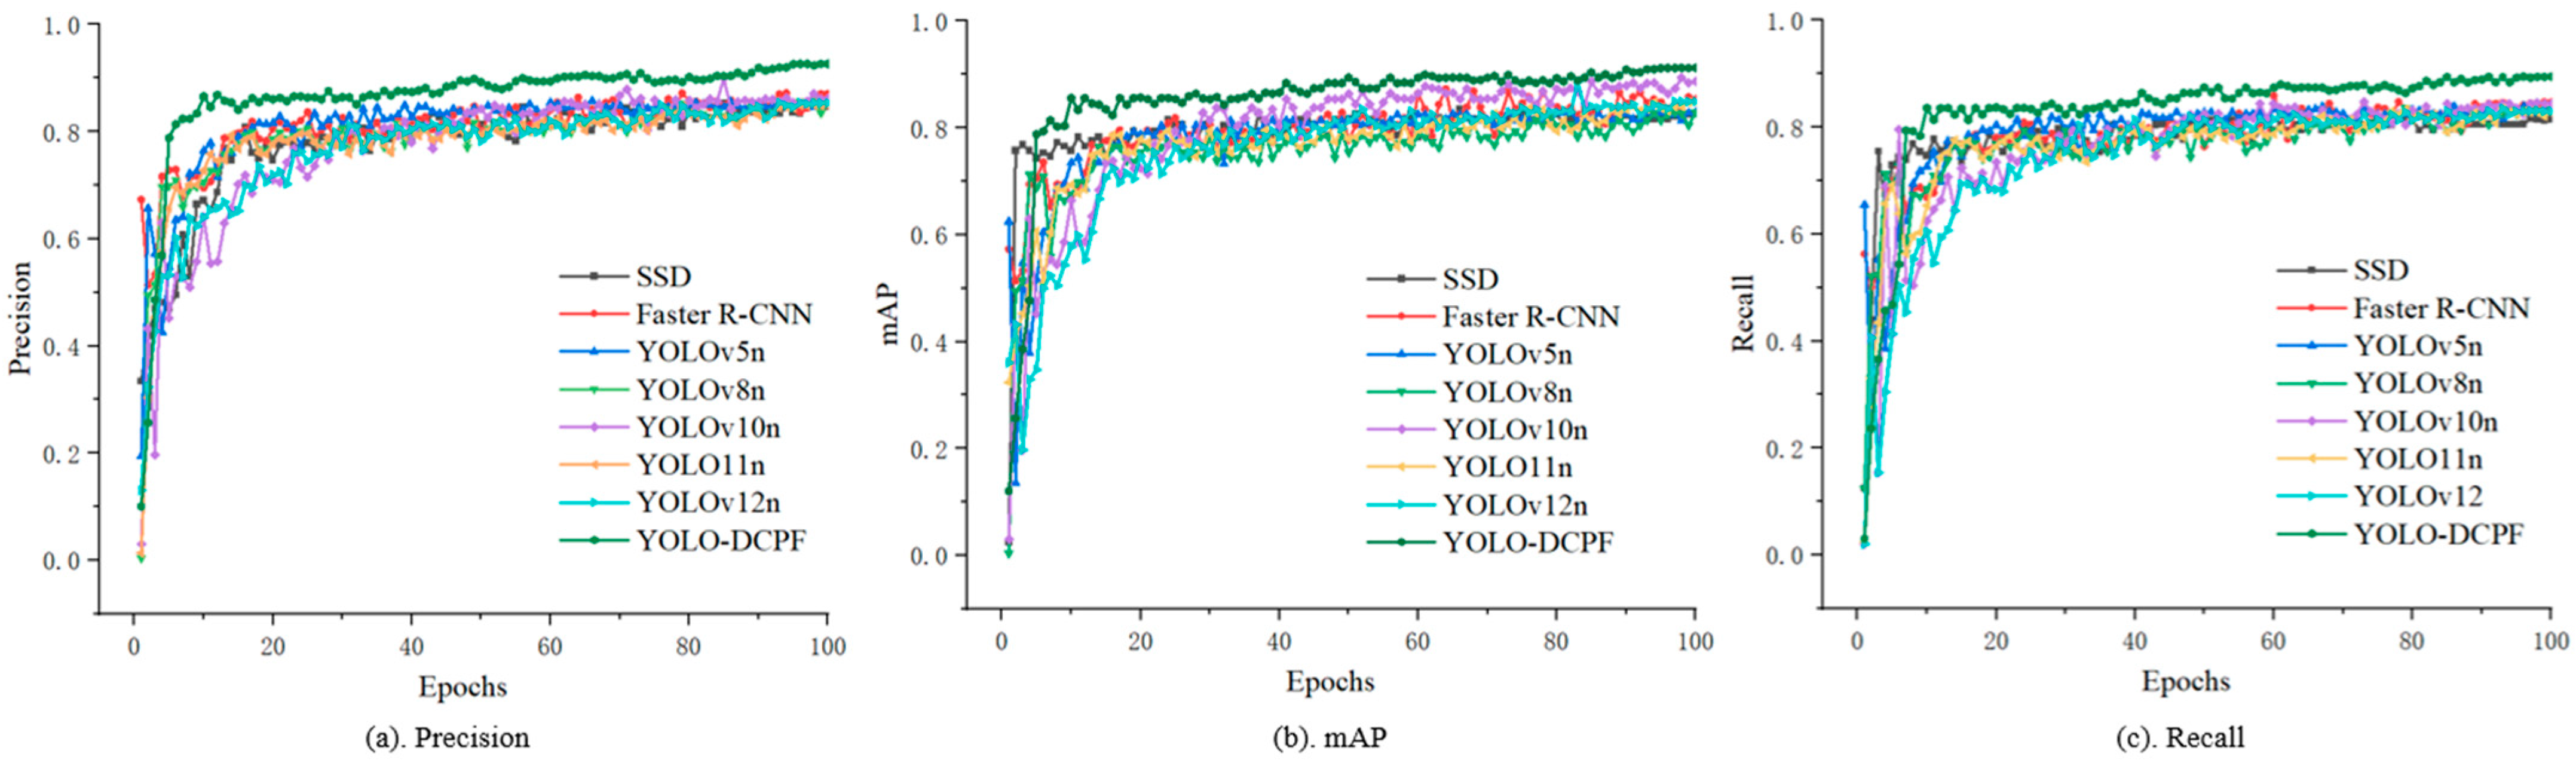
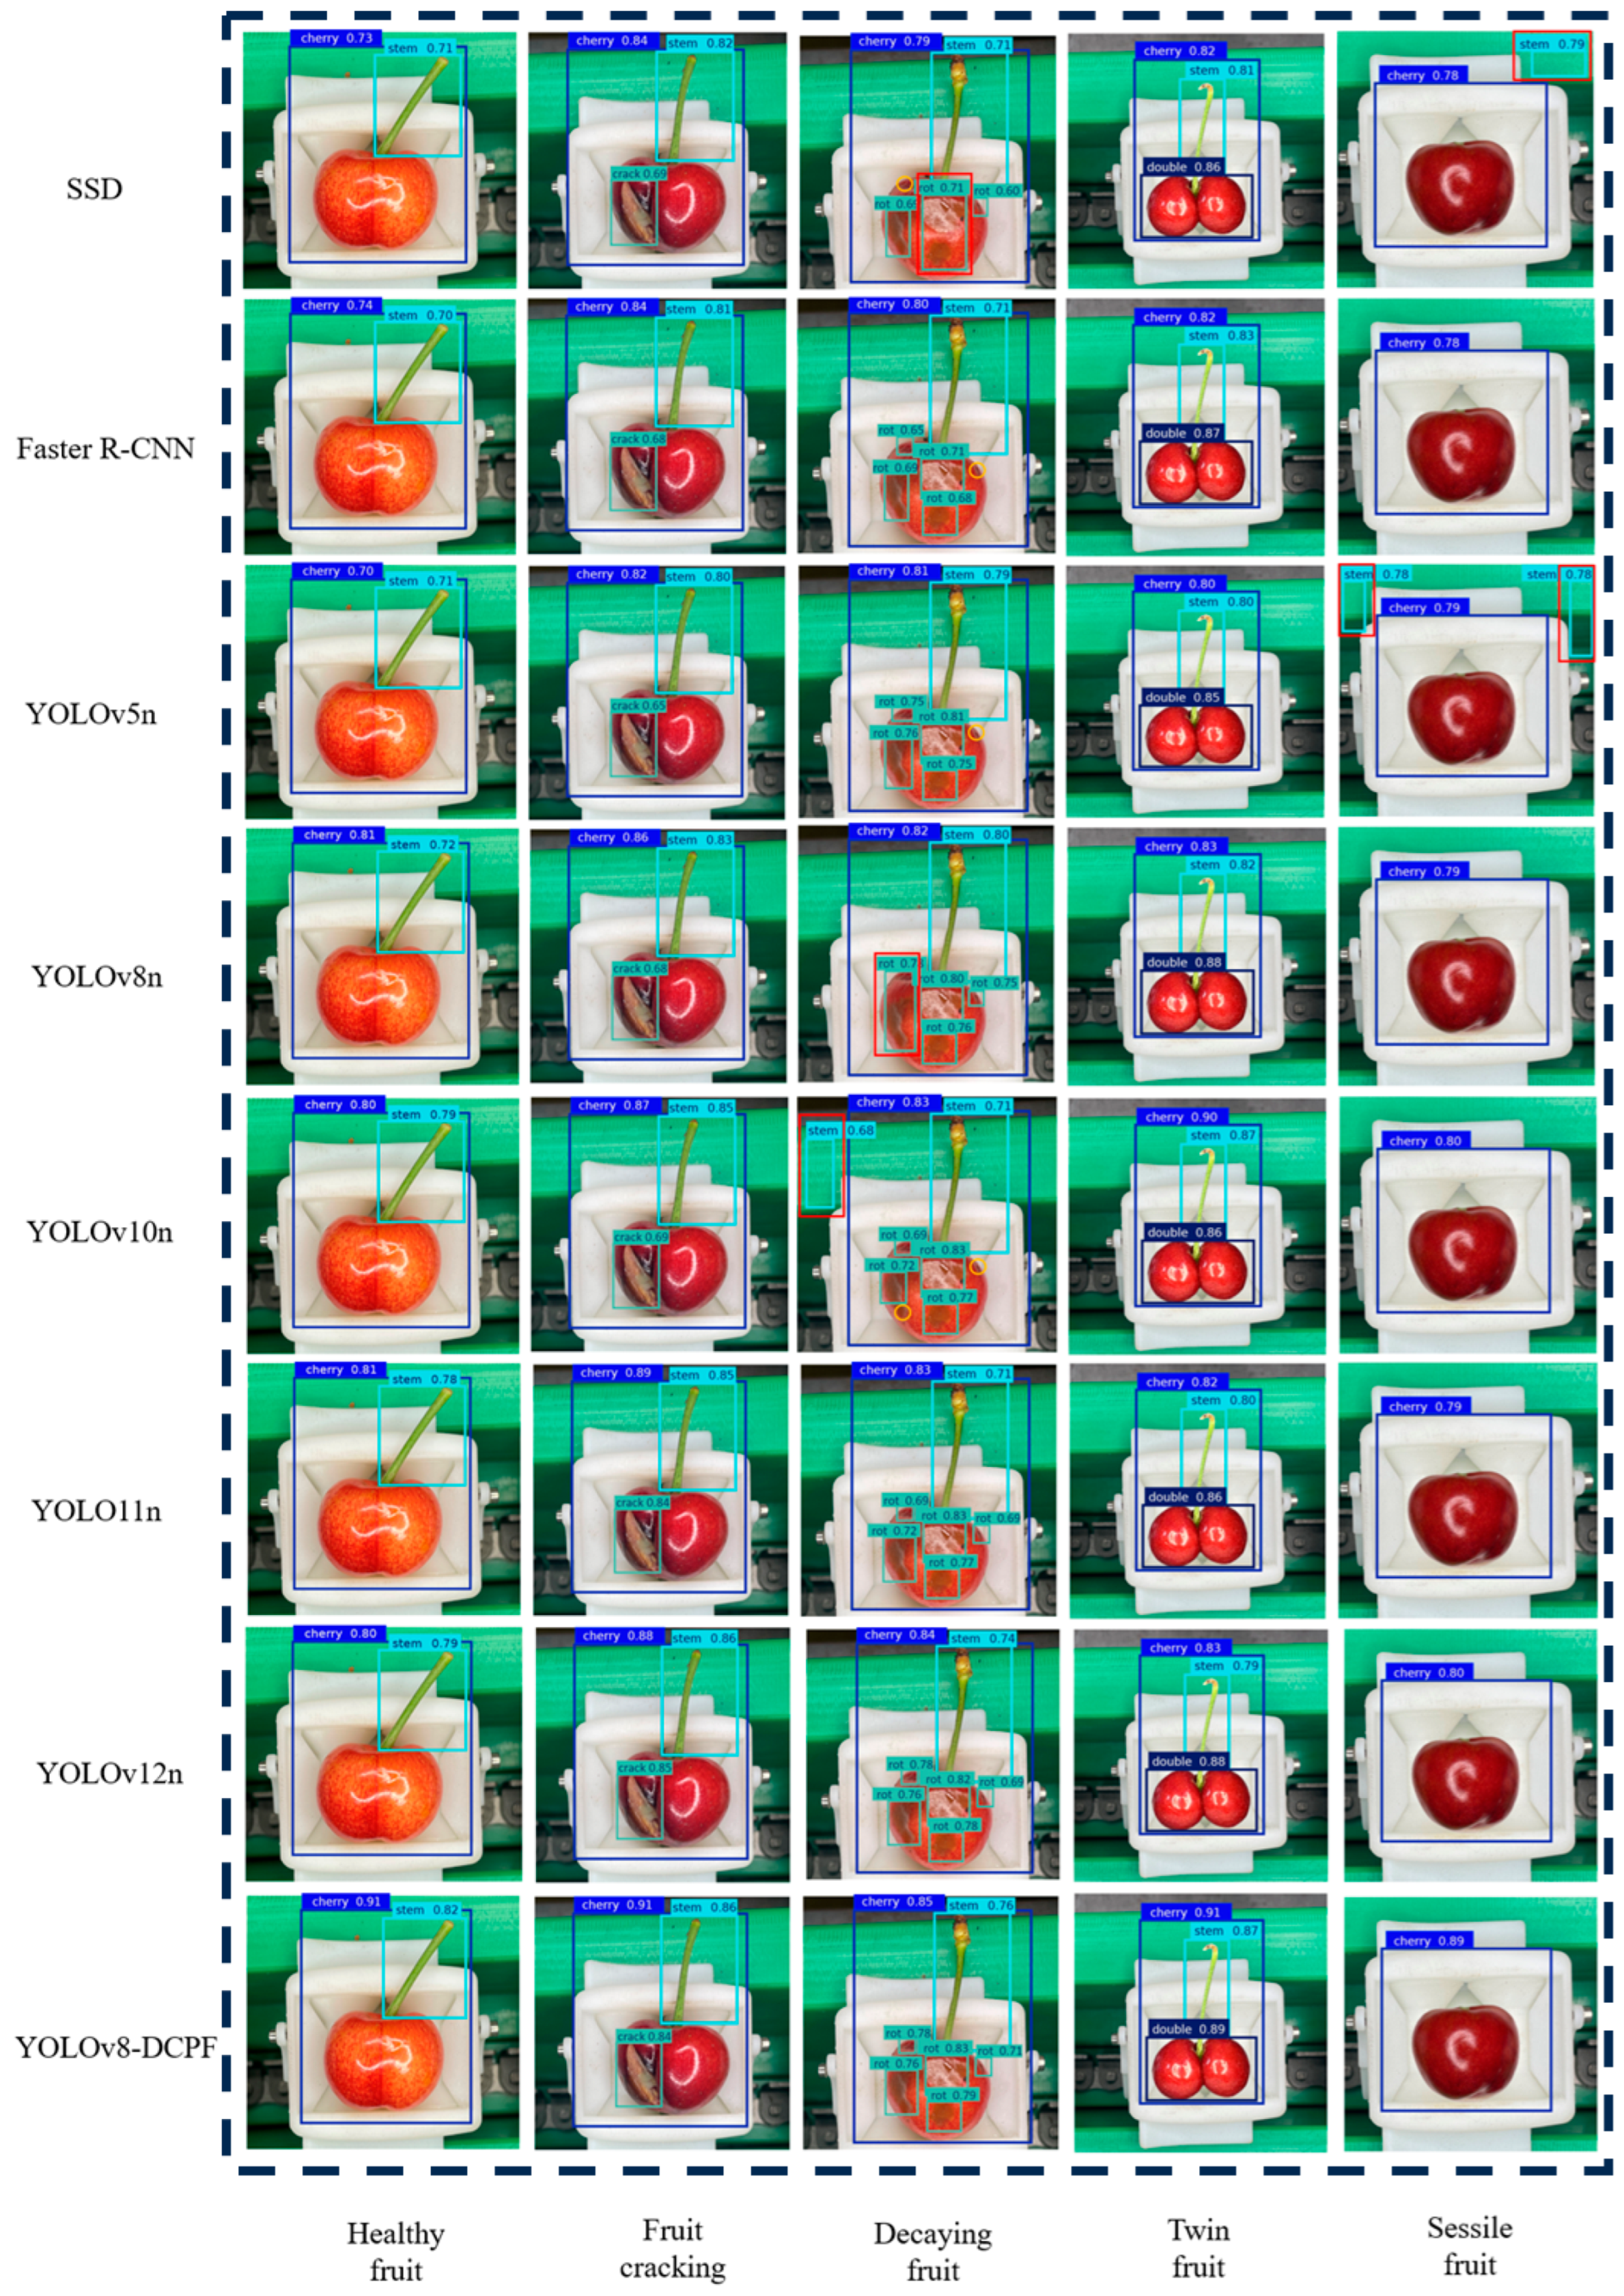
3.5. Comparison of Algorithms for the YOLO Series

In order to evaluate the performance of the YOLOv8n-DCPF algorithm in cherry target detection, the precision rate and mAP recall rate are selected as the evaluation indexes in this study, and it is compared and analyzed with SSD, faster R-CNN, YOLOv5n, YOLOv8n, YOLOv10n, YOLO11n, and YOLOv12n algorithms under the same experimental conditions, and the specific results are shown in Table 5. The variation curves of precision, mAP, and recall of each model are shown in Figure 9.
As shown in Table 5, both the SSD and faster R-CNN models exhibit suboptimal performance in terms of accuracy and struggle with the detection of small targets. Although YOLOv10n has a relatively high accuracy rate, as shown in Figure 9, the curves of accuracy, mAP, and recall for YOLOv10n and YOLOv12n exhibit significant fluctuations, indicating that their detection performance is not sufficiently stable. This indicates that their detection performance is not sufficiently stable. Additionally, Figure 10 reveals that YOLOv10n is prone to missed detections when dealing with small targets. In complex backgrounds, YOLOv10n also exhibits false detection phenomena, such as mistaking the green background for fruit stems. YOLO11n and YOLOv12n do not perform as well as YOLOv8n in terms of accuracy, mAP, and detection speed. Therefore, YOLOv8n is deemed more suitable as the baseline network for sweet cherry defect detection. The test results indicate that YOLOv8-DCPF outperforms other models in terms of accuracy, mAP, recall rate, and detection speed. Specifically, the mAP of YOLOv8-DCPF is 8.7, 5.9, 8.4, 5.6, 2.5, 6.5, and 6.3 percentage points higher than that of SSD, faster R-CNN, YOLOv5n, YOLOv8n, YOLOv10n, YOLO11n, and YOLOv12n, respectively. In terms of accuracy, YOLOv8-DCPF is 7.9, 5.5, 7.5, 6.9, 6.5, 7.7, and 7.3 percentage points higher than these models, respectively. Therefore, compared with other models, the enhanced YOLOv8-DCPF model demonstrates superior performance in cherry defect detection. For a more intuitive comparison, the detection results of the YOLOv8-DCPF model are illustrated in Figure 10. It is worth noting that the original YOLOv8n model failed to detect defects in rotten fruits. This highlights the improved model’s enhanced ability to depict defect boundaries more accurately and identify subtle similarities.

4. Conclusions

This study introduces an enhanced YOLOv8-DCPF model, built upon YOLOv8n, for cherry defect detection. It tackles challenges, such as low recognition accuracy for small targets, unclear boundaries, and the biased detection of irregularly shaped defects. The key findings are as follows:
(1) The C2f modules were replaced with DWR modules at various positions to enhance the extraction capability for small-scale defect features. The introduction of the CFAM attention mechanism significantly enhances the detection accuracy of defects with unclear boundaries. Additionally, adopting the PIoU loss function further reduces the likelihood of cherry defect misdetection. Lastly, knowledge distillation improves accuracy without increasing computational load or memory requirements. The experimental evaluation indicates that the proposed YOLOv8-DCPF model attains a precision of 92.6%, a mAP of 91.2%, and a recall of 89.4%, establishing a solid technical foundation for the subsequent development of intelligent cherry sorting systems.
(2) Five sets of ablation tests confirm the effectiveness of these improvements. The YOLOv8-DCPF model outperforms YOLOv8n, showing a 6.9 percentage point increase in overall precision. Notably, the detection of cracked and rotted fruit saw significant gains, with precision improving by 11.1 and 12.4 percentage points, mAP improving by 7.9 percentage points, and recall improving by 7.3 percentage points.
(3) The enhanced YOLOv8-DCPF model yields superior results on the cherry dataset. Compared to the original YOLOv8n model, YOLOv8-DCPF shows improvements of 6.9%, 5.6%, 3.1%, and 5.0% in precision, mAP, recall, and F1 score, respectively, and demonstrates strong visual detection performance.
At present, there are various varieties of sweet cherries, and different varieties vary in fruit size, shape, and color. These differences may still pose some challenges in practical applications. In the future, the scale and diversity of the dataset can be expanded to include cherry datasets of different varieties and under different environmental conditions. This will help improve the generalization ability and adaptability of the model in complex agricultural environments. Additionally, the scope of research can be expanded to other berry varieties to explore more efficient network architectures and training strategies. This will enhance the model’s adaptability to the surface characteristics of different berries and reduce the false detection rate. These efforts have laid a solid foundation for the development of intelligent sorting technology.

Author Contributions

Conceptualization, Y.L. and X.H.; writing—original draft preparation, Y.L.; writing—review and editing, Y.L. and X.H.; data curation, B.L. and L.R.; visualization and validation, W.M. and C.S.; supervision and funding acquisition, Y.S.; investigation and resources, Q.L. All authors have read and agreed to the published version of the manuscript.

Funding

We would like to acknowledge the financial support from the Innovation Team Fund for Fruit Industry of Modern Agricultural Technology System in Shandong Province (SDAIT-06-12, SDAIT-06-11), the Basic Research Support Plan for Outstanding Young Teachers in Heilongjiang Provincial Universities (YQJH2023019), and the Key R&D Program of Shandong Province, China (2024TZXD045, 2024TZXD038).

Institutional Review Board Statement

Not applicable.

Informed Consent Statement

Not applicable.

Data Availability Statement

The original contributions presented in this study are included in the article. Further inquiries can be directed to the corresponding authors.

Conflicts of Interest

The authors state no conflicts of interest.

References

  1. Tian, J.; Wang, N.; Qin, L.; Wang, C.; Qian, C.; Zhao, Z.; Tian, J.; Sun, Y. Analysis on the Development of Facility Cherry Industry in Chifeng City. Analysis on the Development of Facility Cherry Industry in Chifeng City. North. Fruits 2024, 06, 59–62. [Google Scholar]
  2. Zou, Y.; Li, H.; Teng, F.; Jin, Z. The trade status, challenges and coping strategies of sweet cherry export trade in China. China Fruits 2024, 09, 134–140+150. [Google Scholar]
  3. Tang, Z. Research on the Problems and Countermeasures of Industrial Development of Cherry Industry in Shandong Province. China Fruit Veg. 2020, 40, 84–87. [Google Scholar]
  4. Wang, C.; Xiao, Z. Lychee Surface Defect Detection Based on Deep Convolutional Neural Networks with GAN-Based Data Augmentation. Agronomy 2021, 11, 1500. [Google Scholar] [CrossRef]
  5. Song, H.; Shang, Y.; He, D. Review on Deep Learning Technology for Fruit Target Recognition. Trans. Chin. Soc. Agric. Mach. 2023, 54, 1–19. [Google Scholar]
  6. Hou, J.; Che, Y.; Fang, Y.; Bai, H.; Sun, L. Early Bruise Detection in Apple Based on an Improved Faster RCNN Model. Horticulturae 2024, 10, 100. [Google Scholar] [CrossRef]
  7. Wang, D.; He, D. Channel pruned YOLO V5s-based deep learning approach for rapid and accurate apple fruitlet detection before fruit thinning. Biosyst. Eng. 2021, 210, 271–281. [Google Scholar] [CrossRef]
  8. Hu, G.; Zhou, J.; Chen, C.; Li, C.; Sun, L.; Chen, Y.; Zhang, S.; Chen, J. Fusion of the lightweight network and visual attention mechanism to detect apples in orchard environment. Trans. Chin. Soc. Agric. Eng. 2022, 38, 131–142. [Google Scholar]
  9. Sun, L.; Hu, G.; Chen, C.; Cai, H.; Li, C.; Zhang, S.; Chen, J. Lightweight apple detection in complex orchards using YOLOV5-PRE. Horticulturae 2022, 8, 1169. [Google Scholar] [CrossRef]
  10. Girshick, R. Fast r-cnn. arXiv 2015, arXiv:1504.08083. [Google Scholar]
  11. Wei, R.; Pei, Y.; Jiang, Y.; Zhou, P.; Zhang, Y. Detection of cherry defects based on improved Faster R-CNN model. Food Mach. 2021, 37, 98–105+201. [Google Scholar]
  12. Zhang, Q.; Cao, H. Improved Faster R-CNN based on apple defective region target detection. J. Anhui Sci. Technol. Univ. 2023, 37, 96–101. [Google Scholar]
  13. Redmon, J. You only look once: Unified, real-time object detection. In Proceedings of the IEEE Conference on Computer Vision and Pattern Recognition, Las Vegas, NV, USA, 27–30 June 2016. [Google Scholar]
  14. Wu, H.; Zhu, R.; Wang, H.; Wang, X.; Huang, J.; Liu, S. Flaw-YOLOv5s: A Lightweight Potato Surface Defect Detection Algorithm Based on Multi-Scale Feature Fusion. Agronomy 2025, 15, 875. [Google Scholar] [CrossRef]
  15. Liu, J.; Pei, Y.; Chang, Z.; Chang, Z.; Chai, Z.; Cao, P. Cherry defect and classification detection based on improved YOLOX model. Food Mach. 2023, 39, 139–145. [Google Scholar]
  16. Feng, J.; Wang, Z.; Wang, S.; Tian, S.; Xu, H. MSDD-YOLOX: An enhanced YOLOX for real-time surface defect detection of oranges by type. Eur. J. Agron. 2023, 149, 126918. [Google Scholar] [CrossRef]
  17. Lu, J.; Chen, W.; Lan, Y.; Qiu, X.; Huang, J.; Luo, H. Design of citrus peel defect and fruit morphology detection method based on machine vision. Comput. Electron. Agric. 2024, 219, 108721. [Google Scholar] [CrossRef]
  18. Yao, J.; Qi, J.; Zhang, J.; Shao, H.; Yang, J.; Li, X. A real-time detection algorithm for Kiwifruit defects based on YOLOv5. Electronics 2021, 10, 1711. [Google Scholar] [CrossRef]
  19. Li, H.; Wang, X.; Bu, Y.; David, C.C.; Chen, X. YOLOv8-Orah: An Improved Model for Postharvest Orah Mandarin (Citrus reticulata cv. Orah) Surface Defect Detection. Agronomy 2025, 15, 891. [Google Scholar] [CrossRef]
  20. Liang, X.; Jia, H.; Wang, H.; Zhang, L.; Li, D.; Wei, Z.; You, H.; Wan, X.; Li, R.; Li, W.; et al. ASE-YOLOv8n: A Method for Cherry Tomato Ripening Detection. Agronomy 2025, 15, 1088. [Google Scholar] [CrossRef]
  21. He, K.; Zhang, X.; Ren, S.; Sun, J. Deep residual learning for image recognition. In Proceedings of the IEEE Conference on Computer Vision and Pattern Recognition, Las Vegas, NV, USA, 27–30 June 2016; pp. 770–778. [Google Scholar]
  22. Wei, H.; Liu, X.; Xu, S.; Dai, Z.; Dai, Y.; Xu, X. DWRSeg: Rethinking efficient acquisition of multi-scale contextual information for real-time semantic segmentation. arXiv 2022, arXiv:2212.01173. [Google Scholar]
  23. Hu, S.; Gao, F.; Zhou, X.; Dong, J.; Du, Q. Hybrid Convolutional and Attention Network for Hyperspectral Image Denoising. IEEE Geosci. Remote Sens. Lett. 2024, 21, 1–5. [Google Scholar] [CrossRef]
  24. Liu, C.; Wang, K.; Li, Q.; Zhao, F.; Zhao, K.; Ma, H. Powerful-IoU: More straightforward and faster bounding box regression loss with a nonmonotonic focusing mechanism. Neural Netw. 2024, 170, 276–284. [Google Scholar] [CrossRef] [PubMed]
  25. Hou, Y.; Ma, Z.; Liu, C.; Loy, C.C. Learning lightweight lane detection cnns by self attention distillation. In Proceedings of the IEEE/CVF International Conference on Computer Vision, Seoul, Republic of Korea, 27 October–2 November 2019; pp. 1013–1021. [Google Scholar]
  26. Ji, M.; Shin, S.; Hwang, S.; Park, G.; Moon, I.C. Refine myself by teaching myself: Feature refinement via self-knowledge distillation. In Proceedings of the IEEE/CVF Conference on Computer Vision and Pattern Recognition, Nashville, TN, USA, 20–25 June 2021; pp. 10664–10673. [Google Scholar]
  27. Selvaraju, R.R.; Cogswell, M.; Das, A.; Vedantam, R.; Parikh, D.; Batra, D. Grad-CAM: Visual explanations from deep networks via gradient-based localization. Int. J. Comput. Vis. 2020, 128, 336–359. [Google Scholar] [CrossRef]
  28. Gevorgyan, Z. SIoU loss: More powerful learning for bounding box regression. arXiv 2022, arXiv:2205.12740. [Google Scholar]
  29. Tong, Z.; Chen, Y.; Xu, Z.; Yu, R. Wise-IoU: Bounding box regression loss with dynamic focusing mechanism. arXiv 2023, arXiv:2301.10051. [Google Scholar]
  30. Zhang, Y.-F.; Ren, W.; Zhang, Z.; Jia, Z.; Wang, L.; Tan, T. Focal and efficient IOU loss for accurate bounding box regression. Neurocomputing 2022, 506, 146–157. [Google Scholar] [CrossRef]
Figure 1. Dataset images.
Agronomy 15 01234 g001
Figure 2. Structure of the YOLOv8-DCPF model.
Agronomy 15 01234 g002
Figure 3. Structure of the DWR module.
Agronomy 15 01234 g003
Figure 4. Structure of the CAFM module.
Agronomy 15 01234 g004
Figure 5. Schematic diagram of PIoU loss function.
Agronomy 15 01234 g005
Figure 6. Diagram of FRSKD distillation.
Agronomy 15 01234 g006
Figure 7. Comparison of heat maps of different attention mechanisms.
Agronomy 15 01234 g007
Figure 8. Comparison of improved loss function.
Agronomy 15 01234 g008
Figure 9. Plots of precision, mAP, and recall changes for different models.
Agronomy 15 01234 g009
Figure 10. Test results of different models. The red box is the false detection target, and the orange box is the missed detection target.
Agronomy 15 01234 g010
Table 1. Results of ablation tests.
Precision/%
DWRCFAMPIoUSelf-DistillingHealthy FruitFruit CrackingDecaying FruitTwin FruitSessile FruitPrecision/%mAP0.5/%Recall%F1%
××××95.4%76.0%72.0%92.3%92.7%85.7%85.6%83.3%84.0%
×××95.3%76.9%73.2%93%93.2%86.3%85.9%83.6%85.0%
××96.6%79.4%76.7%94.5%93.7%88.2%86.3%85.5%85.0%
×97.3%83.1%79.2%95.1%94.3%90.0%88.2%87.9%86.0%
97.8%88.4%83.1%96.5%97.0%92. 6%91.2%89.4%89.0%
“×” indicates that the module was not used; “√” means the module was used.
Table 2. Performance comparison of C2f replacement.
ModelPrecision/%mAP0.5/%Recall/%F1/%
15 floors82.2%82.5%80.0%85.0%
18 floors82.7%83.9%81.2%85.0%
21 floors83.8%84.4%81.8%85.0%
15 + 18 floors85.1%84.5%82.9%84.0%
15 + 18 + 21 floors86.2%85.9%83.6%85.0%
Table 3. Comparison of different attention mechanisms.
MouldePrecision/%mAP0.5/%Recall/%F1/%
C2f_DWR + CBAM85.7%82.5%79.4%81.0%
C2f_DWR + SE84.6%85.4%83.1%84.0%
C2f_DWR + SK85.9%85.5%82.3%84.0%
C2f_DWR + GAM86.5%85.8%82.4%84.0%
C2f_DWR + CAFM87.1%86.3%83.5%85.0%
Table 4. Comparison of different loss functions.
ModelPrecision/%mAP0.5/%Recall/%F1/%
C2f_DWR + CAFM + CIoU87.1%86.3%83.5%85.0%
C2f_DWR + CAFM + SIoU87.6%84.8%82.3%83.0%
C2f_DWR + CAFM + WIoU86.8%86.1%83.1%84.0%
C2f_DWR + CAFM + EIoU84.0%85.3%81.0%83.0%
C2f_DWR + CAFM + PIoU89.8%88.2%87.9%86.0%
Table 5. Comparative results of YOLO series algorithm.
ModelPrecision/%mAP0.5/%Recall%F1/%Weights/MBFps/f s−1
SSD84.7%82.5%81.4%84.0%92.357.8
Faster R-CNN87.1%85.3%84.6%87.0%112.821.5
YOLOv5n85.1%82.8%83.2%88.0%3.975
YOLOv8n85.7%85.6%83.3%84.0%5.898
YOLOv10n86.1%88.7%84.3%87.0%6.390
YOLO11n84.9%84.7%82.7%85.0%5.596
YOLOv12n85.3%84.9%82.9%86.0%5.489
YOLO-DCPF92.6%91.2%89.4%89.0%5.6126
Disclaimer/Publisher’s Note: The statements, opinions and data contained in all publications are solely those of the individual author(s) and contributor(s) and not of MDPI and/or the editor(s). MDPI and/or the editor(s) disclaim responsibility for any injury to people or property resulting from any ideas, methods, instructions or products referred to in the content.

