Article

Research on the Precise Regulation of Korla Fragrant Pear Quality Based on Sensitivity Analysis and Artificial Neural Network Model

1
College of Horticulture and Forestry Science, Tarim University, Alar 843300, China
2
Tarim Basin Biological Resources Protection and Utilization Key Laboratory, Xinjiang Production and Construction Corps, Alar 843300, China
3
Southern Xinjiang Special Fruit Trees High-Quality, High-Quality Cultivation and Deep Processing of Fruit Products Processing Technical National Local Joint Engineering Laboratory, Alar 843300, China
4
College of Horticulture and Forestry Science, Nanjing Agricultural University, Nanjing 210095, China
*
Author to whom correspondence should be addressed.
These authors contributed equally to this work.
Agronomy 2025, 15(5), 1236; https://doi.org/10.3390/agronomy15051236
Submission received: 9 April 2025 / Revised: 8 May 2025 / Accepted: 14 May 2025 / Published: 19 May 2025
(This article belongs to the Section Horticultural and Floricultural Crops)

Abstract

:
This study investigated the soil–leaf–fruit relationship in Korla fragrant pears (Pyrus sinkiangensis Yu) to establish a scientific cultivation framework by analyzing soil nutrients (alkali-hydrolyzable nitrogen, available phosphorus, available potassium, and pH at 0–60 cm depth) across key phenological stages (fruit setting, expansion, and maturation), combined with leaf and fruit quality indicators. Artificial neural network modeling demonstrated strong predictive capability (R2 > 0.85), while sensitivity analysis quantified the relative contributions of different factors, revealing that titratable acidity was optimized when available potassium (30–47 mg/kg) in 40–60 cm soil during fruit setting coincided with pH 7.4–7.8 in 20–40 cm, or when pH 7.3–7.7 in 40–60 cm at fruit setting interacted with alkali-hydrolyzable nitrogen (33.0–53.2 mg/kg) in 40–60 cm during maturation. Fruit shape index improvement required available potassium (40–60 mg/kg) in 40–60 cm at maturation combined with leaf total nitrogen (2.0–6.5 mg/kg) at fruit setting, or specific maturation-stage alkali-hydrolyzable nitrogen levels paired with fruit setting SPAD (Soil and Plant Analysis Development) values (30–41). Furthermore, synergistic effects between expansion stage available phosphorus in 40–60 cm soil and leaf SPAD (Soil and Plant Analysis Development) values simultaneously enhanced the soluble solids content while reducing peel thickness. These findings provide precise nutrient management thresholds for quality optimization, offering practical guidance for orchard management to enhance Korla fragrant pears quality through targeted agricultural practices.

1. Introduction

The Korla fragrant pear (Pyrus sinkiangensis Yu) is a premium fruit cultivar endemic to China’s Xinjiang region. Its distinctive flavor profile, delicate texture, and exceptional nutritional composition have established its prominence in domestic and international high-end fruit markets [1]. Extensive research demonstrates that the fruit quality formation of this cultivar is coordinately regulated by multiple factors, including environmental conditions, cultivation practices, and postharvest treatments. This study aims to innovatively employ artificial neural network (ANN) technology to develop a precise prediction model for soil–leaf–fruit quality relationships, thereby providing scientific foundations and technical support for standardized cultivation protocols. Consequently, systematic analysis of the key factors influencing Korla fragrant pear quality formation and their interaction mechanisms hold significant theoretical and practical value for establishing standardized cultivation systems and achieving precise quality regulation [2].
As the fundamental substrate for fruit tree growth, soil physicochemical properties and mineral element dynamics directly influence tree physiological metabolism and fruit quality development [3]. Contemporary agricultural practice primarily utilizes laboratory chemical analyses for soil nutrient assessment (for example, the Kjeldahl method for nitrogen) [4], Olsen method for phosphorus [5], flame photometry for potassium [5], with the increasing adoption of portable sensors and remote sensing technologies. While satellite/airborne hyperspectral imaging and IoT-based sensor networks enable large-scale soil monitoring, these technologies exhibit notable limitations: (1) spectral interference from surface vegetation cover [6]; (2) reduced accuracy in heterogeneous sandy loam soils characteristic of our study area [6]; and (3) temporal resolution constraints that may miss critical phenological transitions [7].
The selection of 0–60 cm soil depth as our core research domain is well justified: Firstly, root architecture studies of 5-year-old pear trees demonstrate that over 85% of absorptive roots concentrate in this stratum, as evidenced in Kang et al. [8], with Wu et al. [9] confirming this layer’s particular sensitivity to irrigation management. Secondly, this depth range aligns perfectly with local agronomic protocols—Wang et al. [10] revealed most uniform water distribution occurs within 0–50 cm under flood irrigation, while Matsuoka [11] established the superior timeliness of shallow sampling for multi-element analysis. Furthermore, preliminary tests showed sub-60 cm nutrient variation coefficients <12% (below the 15–20% threshold proposed by Siatwiinda et al. [12]), indicating the limited sensitivity of deeper monitoring to nutrient dynamics Batista et al. [13].
The application of artificial neural networks (ANNs) provides an innovative technological pathway to address these complexities. ANNs’ capacity to process nonlinear [14], high-dimensional agricultural data [15] through brain-inspired neuronal connectivity enables the automatic identification of complex patterns in soil–plant systems—a capability unattainable by conventional statistical methods. Notably, AMF mycorrhizal symbiosis research demonstrates the particularly pronounced native fungal regulation of pear root morphology in 0–60 cm soils, providing a biological rationale for ANN feature selection [16]. Our methodology combines traditional wet chemistry with high-frequency in situ measurements during critical growth stages, not only overcoming remote sensing limitations but also achieving the precise monitoring of core nutrient absorption zones through an intelligent diagnostic framework [6].
This study pioneers ANN modeling approaches to resolve three fundamental scientific questions: (1) The quantification of nonlinear relationships between soil nutrient dynamics and fruit quality formation; (2) Determination of key factor contributions across phenological stages; and (3) Development of quality prediction models specifically adapted to Xinjiang’s sandy loam conditions. By constructing a canonical ANN architecture with input, hidden, and output layers optimized via backpropagation algorithms, we achieve the high-precision modeling of complex agricultural systems.
As the primary photosynthetic organs, leaves exhibit significant correlations with fruit quality development [17]. Specifically, the dynamic equilibrium of leaf nutrients (N, P, K) not only reflects tree nutritional status but also governs photosynthesis, respiration, and the synthesis/transport of organic compounds, directly influencing photoassimilate allocation and ultimately determining fruit flavor characteristics [18]. Furthermore, leaf chlorophyll content (typically measured as SPAD values) critically impacts the photosynthetic efficiency, thereby modulating fruit development and quality expression [19].
Given the profound influence of soil and leaf parameters on Korla fragrant pear quality, elucidating their relationships with key fruit indices (titratable acidity, soluble solids content, fruit shape index, and peel thickness) has emerged as a research priority [20]. Conventional statistical approaches often prove inadequate when addressing such multifactorial, complex interactions, failing to comprehensively reveal underlying mechanisms.
The evolution of computational technologies has propelled widespread ANN adoption in agricultural research [21,22,23], owing to their exceptional nonlinear mapping, self-learning capabilities, and complex data processing advantages. Particularly in precision agriculture, ANN systems can (1) integrate multi-source heterogeneous data (soil properties, leaf physiology, meteorological parameters) [24]; (2) autonomously identify critical features [24]; (3) establish high-accuracy prediction models [25]; and (4) enable dynamic updates and optimization [25]. These attributes make ANN ideal for addressing complex agricultural systems. Our ANN methodology specifically compensates for the spatiotemporal limitations of remote sensing by combining discrete laboratory measurements with continuous physiological monitoring, achieving dynamic quality predictions that account for microvariations in sandy loam soils while effectively uncovering latent patterns between multi-source data and fruit quality indicators [26,27].
Beyond revealing the relationships imperceptible to conventional methods, our systematic ANN implementation provides growers with (1) scientific fertilization timing guidance; (2) early warning systems for quality parameters; and (3) model-based precision management decision support. These advancements will directly contribute to the high-quality development of Xinjiang’s characteristic fruit industry.

2. Materials and Methods

2.1. Overview of the Experimental Site

The experimental site is located in the 15th Company of the 9th Regiment, Alar City, Xinjiang Production and Construction Corps, at 40°33′14′′ N, 81°0′40′′ E, with an altitude of 1017 m, situated on the north bank of the upper reaches of the Tarim River. This area has a typical warm temperate extreme continental arid desert climate, with an average annual precipitation of about 50 mm, scarce winter snowfall, and intense surface evaporation. However, it is rich in light and heat resources, with a large diurnal temperature range, and the soil is sandy loam.
The experimental materials consisted of 5-year-old central-leader-trained Korla fragrant pear (Pyrus sinkiangensis Yu) trees grafted onto ‘Duli’ pear (Pyrus betulifolia Bunge), planted in a high-density orchard system. The orchard was established through direct seeding in late March 2016, with grafting performed in late March 2017. Trees were planted in a north–south orientation with a well-developed central leader architecture at a spacing of 1.5 m × 4 m (1666 trees/ha). During the experimental period, conventional flood irrigation was applied following local practices, with a particular emphasis on ensuring adequate water supply during the pre-bloom stage to meet the physiological water demands.

2.2. Data Collection

Our team documented the phenological stages for these two years as follows: In 2022, the onset date of the fruit set was the 23 April 2022 (±2 days), the onset date of fruit expansion was 11 July 2022 (±2 days), and the onset date of fruit maturity (physiological maturity) was 20 September 2022 (±3 days). In 2023, the corresponding dates were 22 April 2023 (±2 days) for fruit set, 9 July 2023 (±3 days) for fruit expansion, and 18 September 2023 (±2 days) for fruit maturity.
To ensure the comparability of our methodology, we deliberately maintained consistent sampling dates across the two years. Specifically, sampling was conducted on the onset dates of the fruit set (23 April 2022, and 23 April 2023). This study rigorously selected 150 Korla fragrant pear trees (Pyrus sinkiangensis Yu) as research subjects, fruit expansion (11 July 2022, and 11 July 2023), and fruit maturity (20 September 2022, and 20 September 2023), five-point sampling method was adopted under each tree to collect soil samples [28] from 0–20 cm, 20–40 cm, and 40–60 cm depths [29]. The soil samples were naturally air-dried and passed through a 100 mesh sieve. Then [28], approximately 1 kg of mixed soil samples was retained by the quartering method and stored in self-sealing bags for soil nutrient determination [28].
Leaf sampling was conducted simultaneously with soil sampling. For each experimental treatment, thirty leaves were systematically harvested from current-year shoots located in the mid-to-upper canopy strata and peripheral branches of each tree. The collected samples were quickly brought back to the laboratory for washing. The washing sequence was tap water-0.1% detergent solution-ap water-distilled water, and the entire washing process did not exceed 2 min. After washing, the surface water of the samples was quickly absorbed, and they were blanched at a constant temperature of 105 °C for 30 min, then dried at 80 °C to a constant weight, sieved through a 60 mesh sieve, and stored in self-sealing bags for the determination of the leaf nutrient content.
Fruits were harvested during the maturity stage of the fragrant pear (20 September 2022, and 20 September 2023). Specifically, ten disease-free, pest-free, and undamaged fruits were collected from each of the four cardinal directions (east, south, west, and north) for every fragrant pear tree. The fruits were then labeled, transported to the laboratory, and stored at 4 °C in a refrigerator for subsequent analysis.(The flowchart of the sample collection experimental design is as follows, Figure 1).

2.3. Measurement of Soil Indicators

This study employed standardized methods to determine the contents of alkali-hydrolyzable nitrogen [30], available phosphorus [31], available potassium [32], and soil pH [33] for assessing the mineral elements in Korla fragrant pear orchards. Alkali-hydrolyzable nitrogen was measured using the alkaline hydrolysis diffusion method (modified from Bao’s method, with key steps including soil incubation with NaOH, boric acid absorption, and HCl titration) [34]. Available phosphorus was determined by 0.5 mol·L−1 NaHCO3 extraction followed by molybdenum-antimony anti-spectrophotometry (30 min extraction and colorimetric measurement at 700 nm wavelength) [35]. Available potassium was extracted with 1 mol·L−1 ammonium acetate (COOHNH4) solution (30 min shaking followed by flame photometric determination) [36]. The Soil pH was measured using the glass electrode method (soil–water ratio of 1:5), specifically by homogenizing 5.0 g of air-dried soil (passed through a 100 mesh sieve) with 25 mL of CO2-free distilled water, shaking at 180 rpm for 3 min, filtering through 12.5 cm neutral filter paper, and measuring with a calibrated pH meter (accuracy ± 0.01) [37]. All determinations were performed in triplicate with certified reference materials included, and instruments were calibrated daily using standard buffer solutions and standard solutions to ensure data accuracy.

2.4. Leaf Index Indicators

This study employed standardized methods to determine the total nitrogen (N), phosphorus (P), potassium (K) contents and relative chlorophyll levels in the leaves of Korla fragrant pear. The detailed analytical procedures were as follows: Precisely weighed 0.2000 g of dried leaf powder was placed in a 100 mL digestion tube, moistened with distilled water, and then digested with 5 mL concentrated H2SO4 using gradient heating (initial low temperature, increasing after the white fumes appeared). When the solution turned dark brown, the tube was removed and 300 g·L−1 H2O2 was added dropwise (10 drops per cycle, repeated 2–3 times) until the digest became clear, followed by the final 10-min heating to remove residual H2O2. The digested solution was diluted to 100 mL, with total N determined by Nessler’s method [38], total P by molybdenum–antimony colorimetry [20], and total K by flame photometry [39]. Chlorophyll content was measured immediately after collection using a SPAD-502 chlorophyll meter (three replicates per leaf). Leaves were sampled from the middle-upper canopy and current-year shoots of each pear tree, with 30 leaves collected from each cardinal direction (east, south, west, and north) [40]. Certified reference materials and blank samples were included throughout the experiment, with instruments calibrated before each analytical batch to ensure data reliability.

2.5. Fruit Quality Indicators

The determination of fruit shape index and fruit peel thickness was carried out using a digital vernier caliper [41]. When measuring the fruit shape index, the longitudinal diameter (the maximum length from the top to the fruit stalk end) and the transverse diameter (the maximum diameter of the equatorial plane) were measured first. Three technical measurements were taken at standardized positions on each fruit, with the average representing that fruit’s value. Ten biological replicates (individual fruits) were measured per sampling orientation, yielding 30 raw measurements per parameter that were processed through two averaging steps, as described above. The single fruit shape index (longitudinal diameter/transverse diameter) was calculated. In the determination of fruit peel thickness, the fruit was cut transversely along the equatorial plane or the middle uncut area was directly located. At three evenly distributed points (avoiding vascular bundles), the thickness of the epidermis to the flesh was measured vertically at each point. The average value of the three measurements was taken as the single fruit peel thickness. Before measurement, the instrument was calibrated. During operation, the fruit was kept stable to reduce errors. Finally, the arithmetic mean of all samples within each group was used to represent the peel thickness of each sample.
The content of soluble solids (SSC) was determined using a handheld digital refractometer The sugar content was measured using an ATAGO PAL-1 digital refractometer (accuracy ±0.1% Brix; ATAGO Co., Ltd., Tokyo, Japan), with an accuracy of 0.1% Brix) [42]. During the measurement, each sample was independently taken from the top, middle, and bottom of the fruit after peeling. The removed flesh was chopped and homogenized, and the clarified juice was obtained by filtration. Before use, the instrument was calibrated with distilled water (at a constant temperature of 20 °C). One to two drops of the juice were added to the prism surface to avoid interference from the bubbles. The Brix value was read, and the average value of the three measurements was taken as the single fruit SSC value.
The titratable acid content was determined by the acid-base neutralization titration method [43]. During the measurement, after peeling each fruit, the pulp was cut into small pieces and homogenized. Distilled water was added to boil for 30 s to inactivate enzymes, then centrifuged (4000 r/min, 10 min), and the supernatant was taken to adjust the volume to 100 mL 0.1 mol/L NaOH standard solution was used as the titrant, and phenolphthalein was used as the indicator (the endpoint was pH 8.2). Ten microliters of the sample solution was accurately measured with a ten microliter pipette, and titrated until a slight red color appeared and did not fade within 30 s. The volume of NaOH consumed (V, mL) was recorded. Each sample was titrated three times, and the single fruit result was calculated using the formula.
Titratable acid content (g/kg) = (C × V × K × F)/m.
where C is the NaOH concentration, K is the acid conversion coefficient, F is the dilution factor, and m is the sample mass. The blank test was used to correct the reagent error, and the average value of the three repetitions was taken as the titratable acid content of a single fruit.

2.6. Outlier Removal Using Mahalanobis Distance Method

There are abnormal components in the soil mineral data of Korla fragrant pear orchards and the measurement indicators of Korla fragrant pear leaves, which may interfere with the subsequent model prediction. To improve the stability and accuracy of the prediction model for Korla fragrant pear fruit quality, this study uses the Mahalanobis distance method [44] to remove the outliers in the data processing process. In the experiment, there were 150 sample data points. The Mahalanobis distance method was used to identify and remove five outliers. In addition, extreme values were also eliminated in the same type of data to improve the modeling effect, and 144 sample data points were obtained.
M D ( K ) = ( X K μ ) T 1 ( X K μ )
The formula of MD ( K ) involves calculating the Mahalanobis distance of various spectral curves within the K -th band by using the difference matrix X K , the mean vector μ, and the inverse of the covariance matrix 1 .

2.7. Statistical Analysis

We used R 4.4.0 to calculate the simple correlation coefficients between fruit shape index, soluble solids content, titratable acid content, peel thickness, and mineral elements in leaves and soil, and to draw the correlation heatmap. Data analysis was performed using the MATLAB software (version R2024b, MathWorks Inc., Natick, MA, USA); we used the mineral element values in the leaves and soil as the input layer (independent variables), and the single fruit weight, soluble solids content, and titratable acid content of Korla fragrant pear as the output layer (dependent variables) (Figure 2). To make better use of the neural network, we normalized the data of two layers. In this study, we used 70% (70% randomly selected out of 144 validated samples) of the data to train the ANN model, and the remaining 30% of the data for validating the ANN model. The following equation was used for data normalization [45].
T n = T T m i n T m a x T m i n
In the formula, there are the original data, the standardized output or input value, and the minimum and maximum values of the relevant variables. We use the MATLAB software (version 2024) to apply and test various training functions. For the artificial neural network, this study adopts the backpropagation training algorithm, the standard gradient descent method, and the gradient descent method with momentum to optimize the weights and biases of the neural network. The weight update rules formulas of these three training functions are given as Formulas (3)–(5). For the transfer function, Tansig (hyperbolic tangent S-shaped, Formula (6)) and Logsig (logarithmic S-shaped, Formula (8)) are used as input transfer functions, while the output transfer function adopts Purelin (linear, Formula (7)). The weight update rules formula for trainlm (Levenberg–Marquardt backpropagation).
Δ ω = ( J T J + μ I ) 1 J T e
J is the Jacobian matrix of the error with respect to the weights; μ is the damping factor (dynamically adjusted to balance gradient descent and Newton’s method); e is the error vector; I is the identity matrix.
The formula of the weight update rule for the standard gradient descent method (traingd).
Δ ω i j = η E ω i j
η is the learning rate (a fixed value); E ω ij is the loss function; E is the derivative of the loss function with respect to the weight ω ij .
The formula for the weight update rule of the training gradient descent method (with momentum).
Δ ω i j ( t ) = η
At time step Δ ω ij (iteration count), the update amount (adjustment value) of weight t determines the direction and magnitude of the weight change in the current iteration. η is a positive hyperparameter that controls the step size of each weight update.
Tansig (hyperbolic tangent S-shaped)
f ( x ) = t a n h ( x ) = e x e x e x + e x
Purelin (linear)
f ( x ) = x
Logsig (logistic S-shaped)
f ( x ) = 1 1 + e x
We tested various training functions, transfer functions, and hidden layers to find the final model, and determined the coefficient of determination (R2), root mean square error (RMSE), mean bias error (MBE), mean absolute error (MAE) and mean absolute percentage error (MAPE). The equations are as follows.
R 2 = i = 1 n ( M i M ¯ ) ( P i P ¯ ) i = 1 n ( M i M ¯ ) 2 i = 1 n ( P i P ¯ ) 2
M A E = 1 n i = 1 n | M i P i |
M B E = 1 n i = 1 n ( M i P i )
M A P E = 100 % n i = 1 n | M i P i M i |
R M S E = 1 n i = 1 n ( M i P i ) 2
M i is the i th true value; P i is the i th predicted value; M ¯ is the mean of the true value; P ¯ is the mean of the predicted value; and n is the number of samples.

3. Results and Analysis

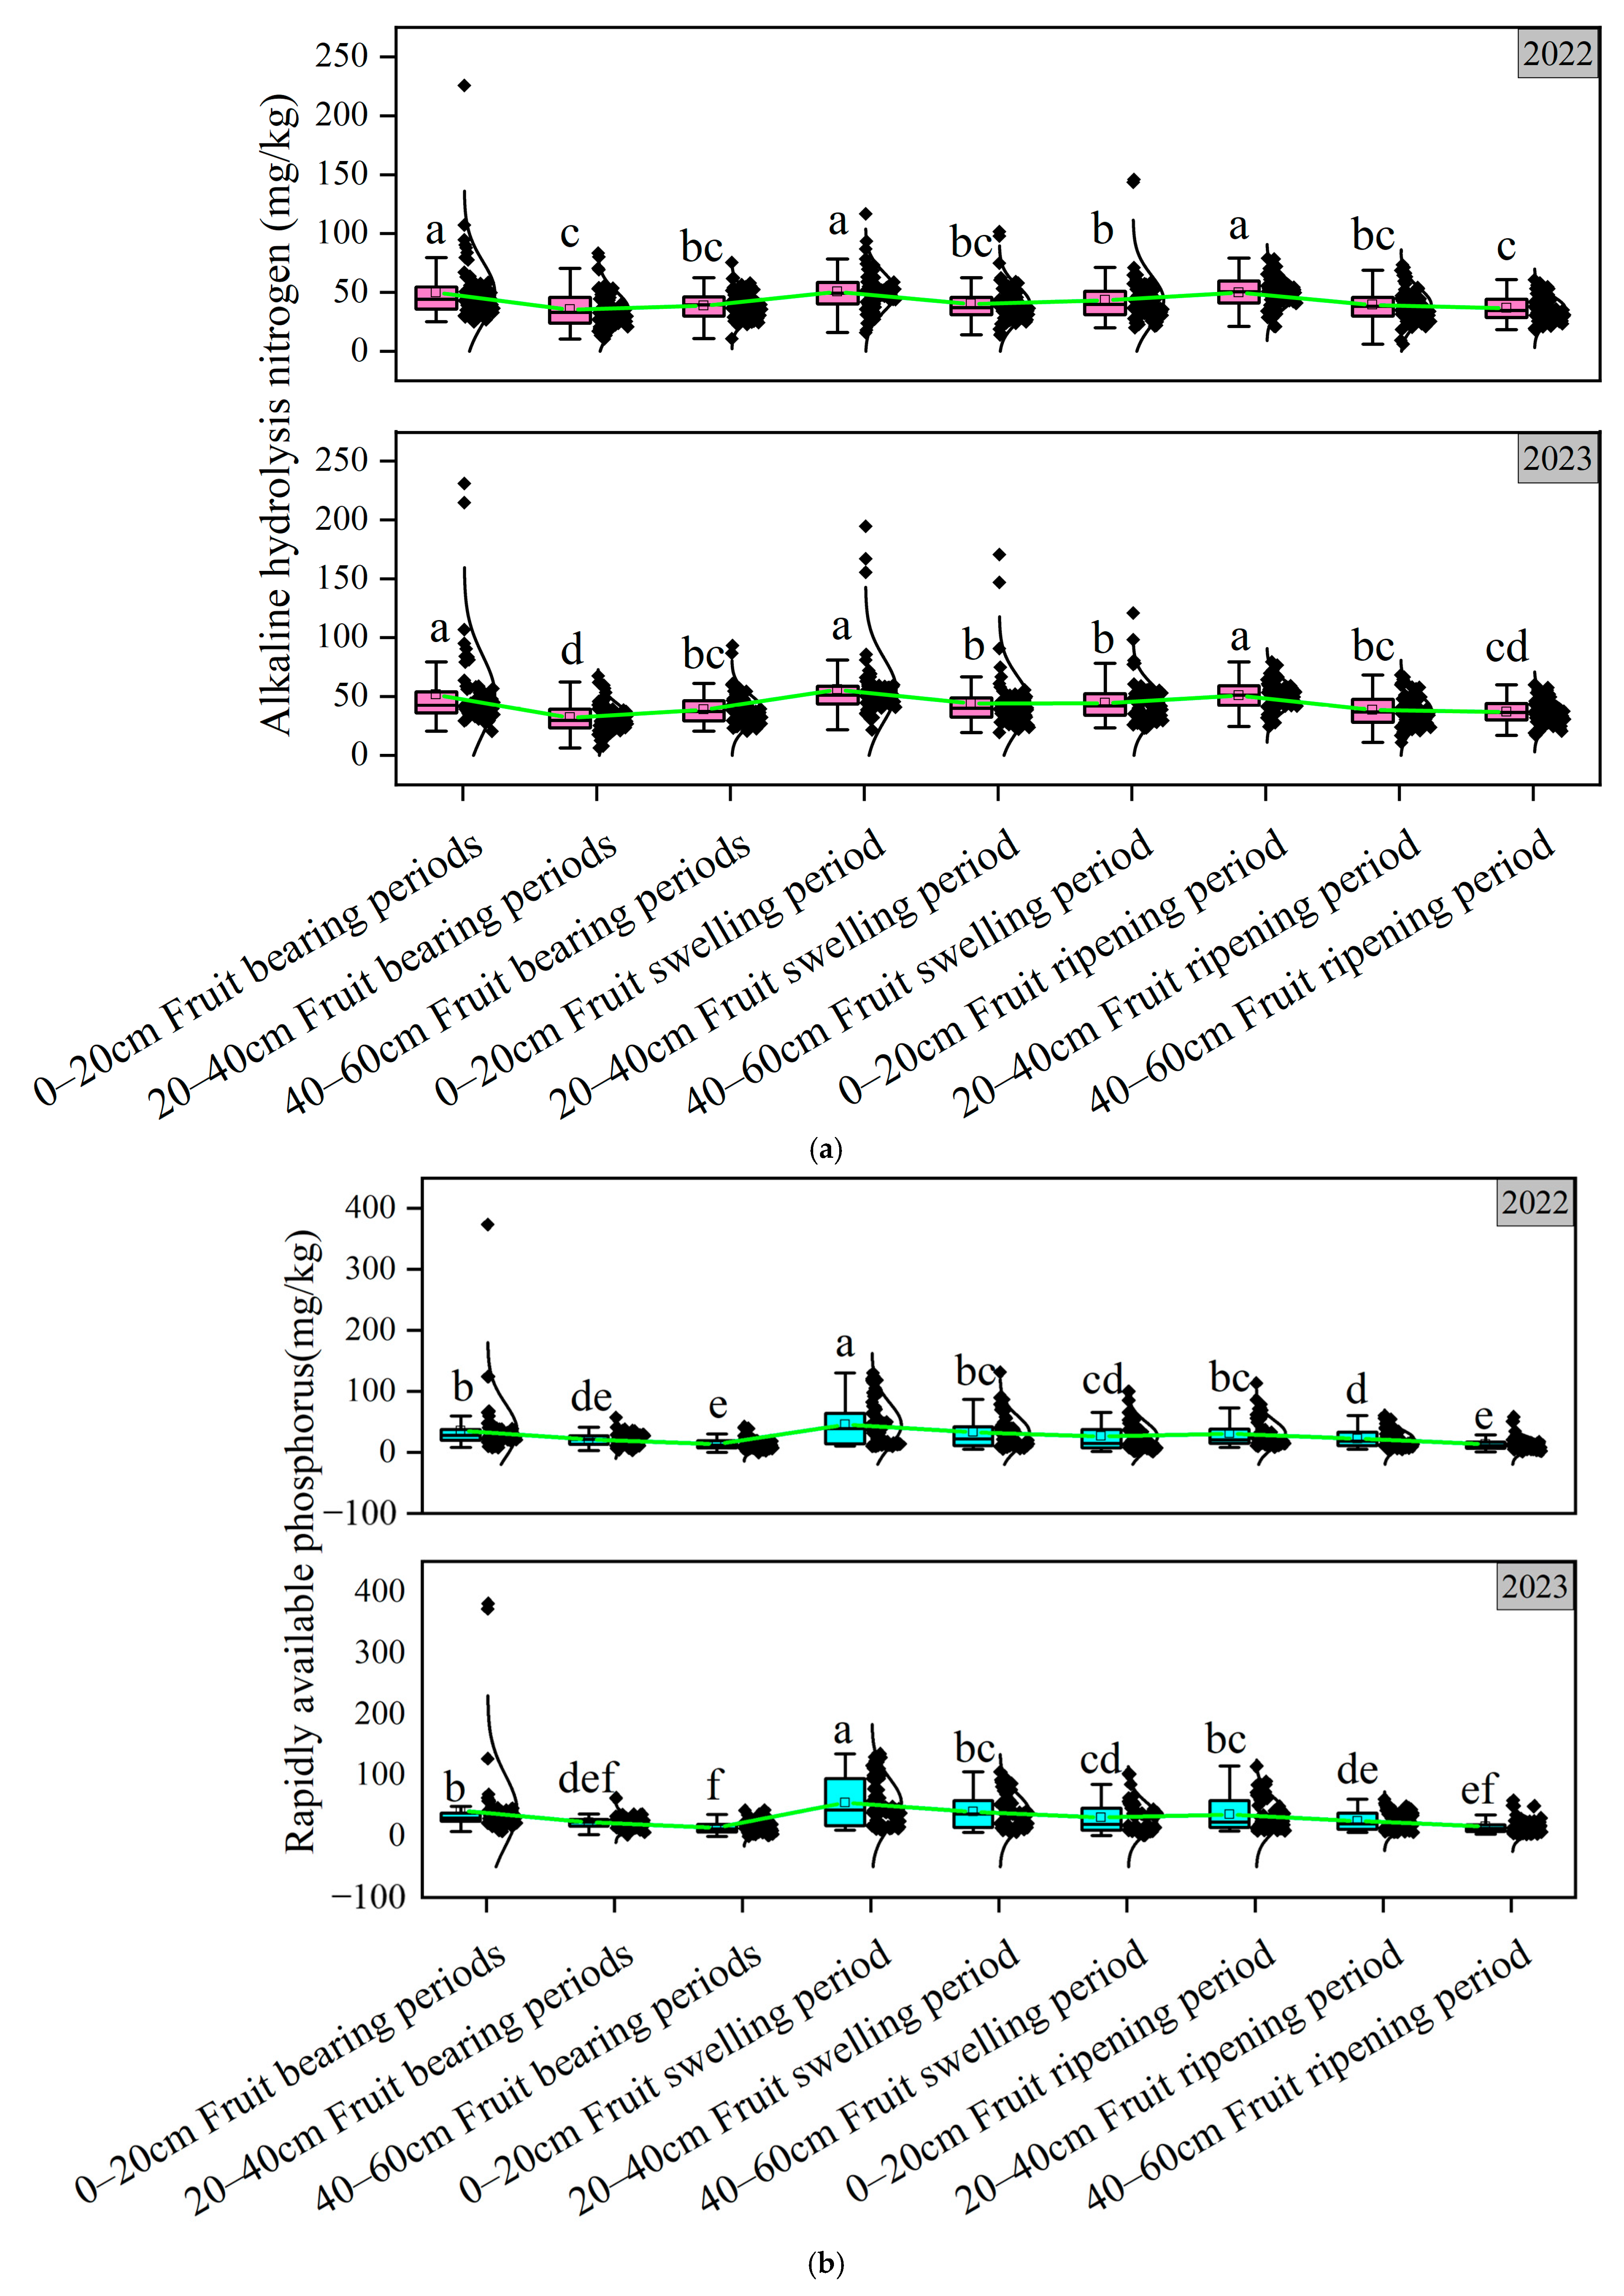
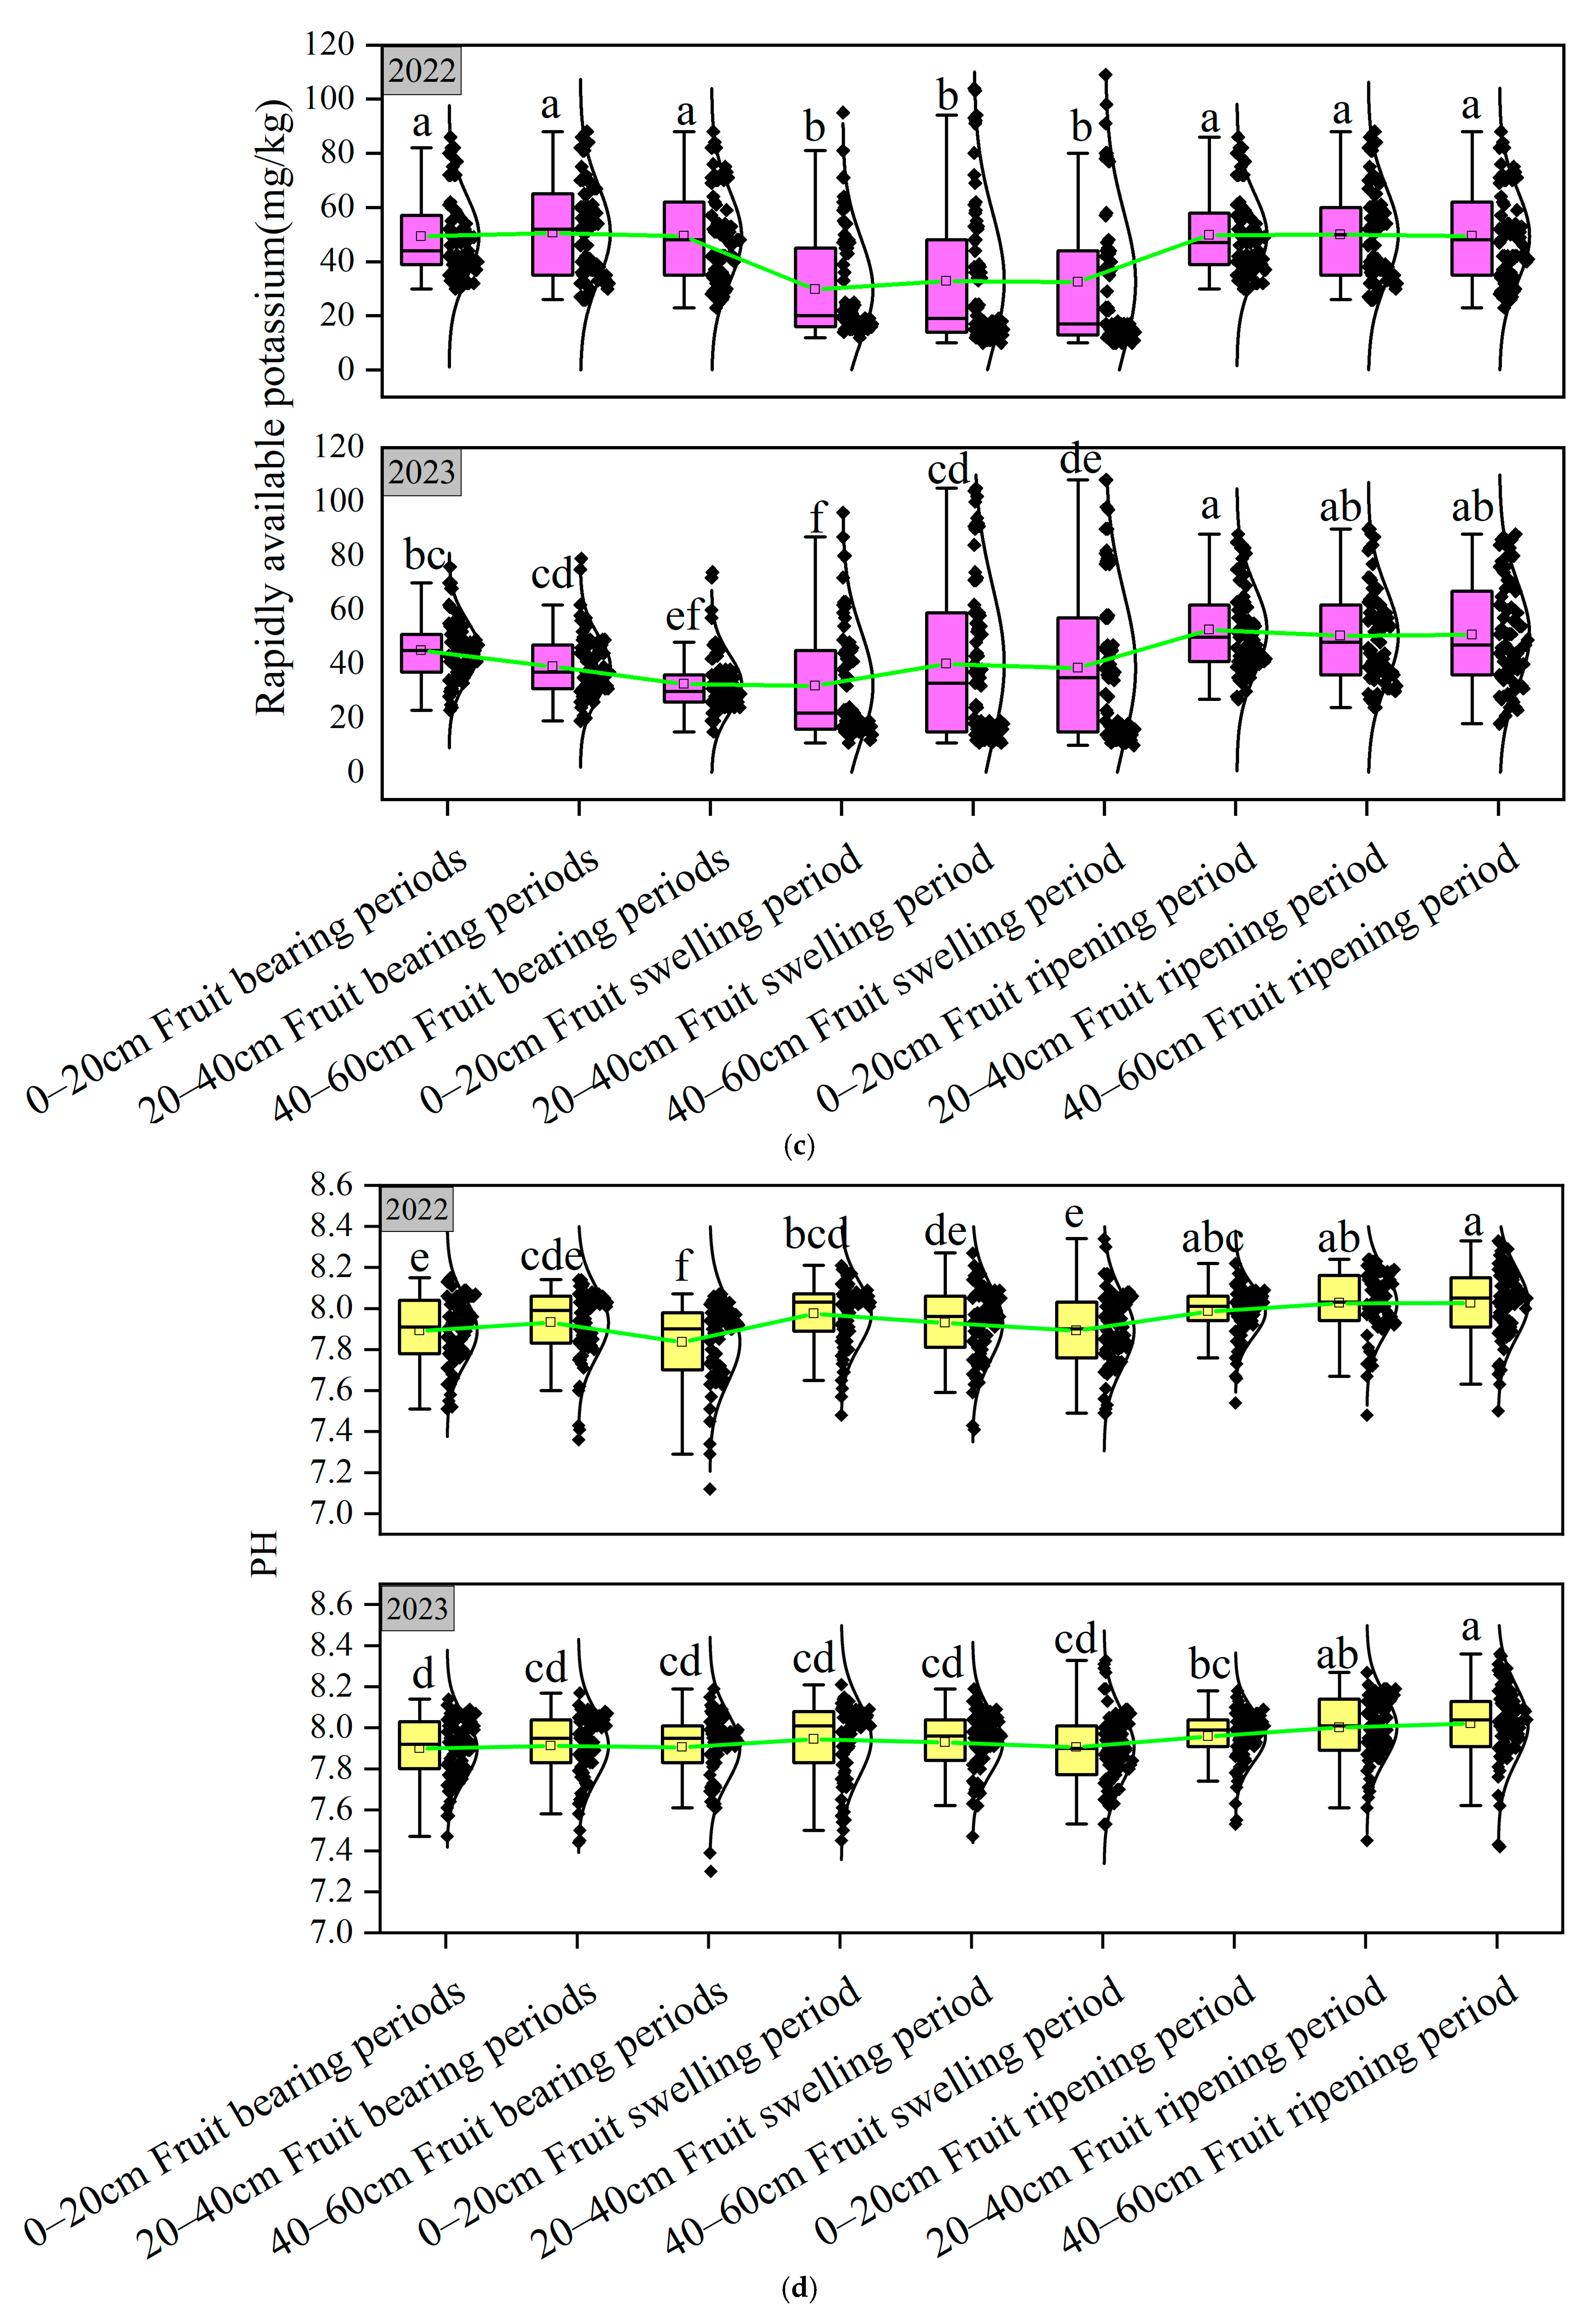
3.1. Soil Nutrient Analysis

In this study, four box plots were drawn to visually present the distribution characteristics of several key indicators of soil alkaline hydrolyzable nitrogen, available phosphorus, available potassium, and soil pH value during the period from 2022 to 2023. These indicators were measured at different depths (0–20 cm, 20–40 cm, 40–60 cm) and at different phenological stages of fruit trees (covering fruit setting period, expansion period, and maturity period).
(Figure 3a) clearly shows that, under different combinations of soil depth and phenological stages, the boxplots exhibit varying box lengths, median positions, and whisker extensions, with all indicator data demonstrating complex and diverse distribution patterns. The data from both 2022 and 2023 generally display an initial decreasing trend followed by an increasing trend. The highest mean values were observed at the 20–40 cm depth during the fruit-setting period (51.31 and 50.36, respectively), showing significant differences. This indicates that, under different conditions, the content varies significantly, with some data points appearing as outliers beyond the main structure of the boxplots. This suggests the potential influence of specific localized factors disrupting normal distribution, such as variations in local soil texture, uneven fertilization, or abnormal climatic conditions in certain years.
As shown in (Figure 3b) for the available phosphorus index, similarly, its distribution across different depths and phenological stages also exhibits significant variations. The changing width of the boxes reflects differing degrees of data dispersion. Among different periods, the 0–20 cm soil layer showed the lowest mean values, while the 20–40 cm layer during the fruit-setting period displayed the highest means (47.14 and 56.86). Data from certain periods demonstrated a certain degree of skewed distribution, which may be closely related to the characteristics of phosphorus uptake and utilization by Korla fragrant pear during corresponding growth stages, as well as the transformation processes of phosphorus in soil. Meanwhile, the comparison between the two years’ data reveals fluctuations in available phosphorus content across the years, reflecting the combined effects of external environmental factors and changes in orchard management practices.
For the available potassium content (Figure 3c), the boxplots across different soil depth intervals exhibited regular variation trends. As soil depth increased, the overall position of the boxes, the median values, and the data distribution ranges all showed corresponding changes. During periods of higher potassium demand such as the fruit expansion stage, characteristic fluctuations were observed, with the highest mean values occurring in the 40–60 cm soil layer during fruit maturation (52 and 51). The comparison between 2022 and 2023 data revealed dynamic interannual variations in available potassium content, which may involve interactive effects from multiple factors including fertilization rates, precipitation patterns, and soil microbial activities.
The soil pH values exhibited relatively stable distribution characteristics between different years (Figure 3d). Specifically, in terms of vertical distribution, the pH values across soil layers ranged from 7.93 to 8.03, with the highest mean values observed in the 40–60 cm layer during fruit maturation (8.03 for both years). Although the overall dataset contained few outliers, their presence indicated localized pH anomalies under specific conditions. These variations were associated with factors including soil parent material, long-term fertilization practices, and root exudates from fruit trees. Furthermore, the subtle interannual differences in pH values reflected the influence of external environmental factors and orchard management practices on soil acid-base balance.
In summary, these four ANOVA boxplots systematically and comprehensively reveal the spatiotemporal variations (across different depths, phenological stages, and years) of soil-related indicators. They provide intuitive and valuable visual data support for further in-depth investigation of soil-fruit tree system interaction mechanisms, the implementation of precision orchard management, and subsequent related scientific research.

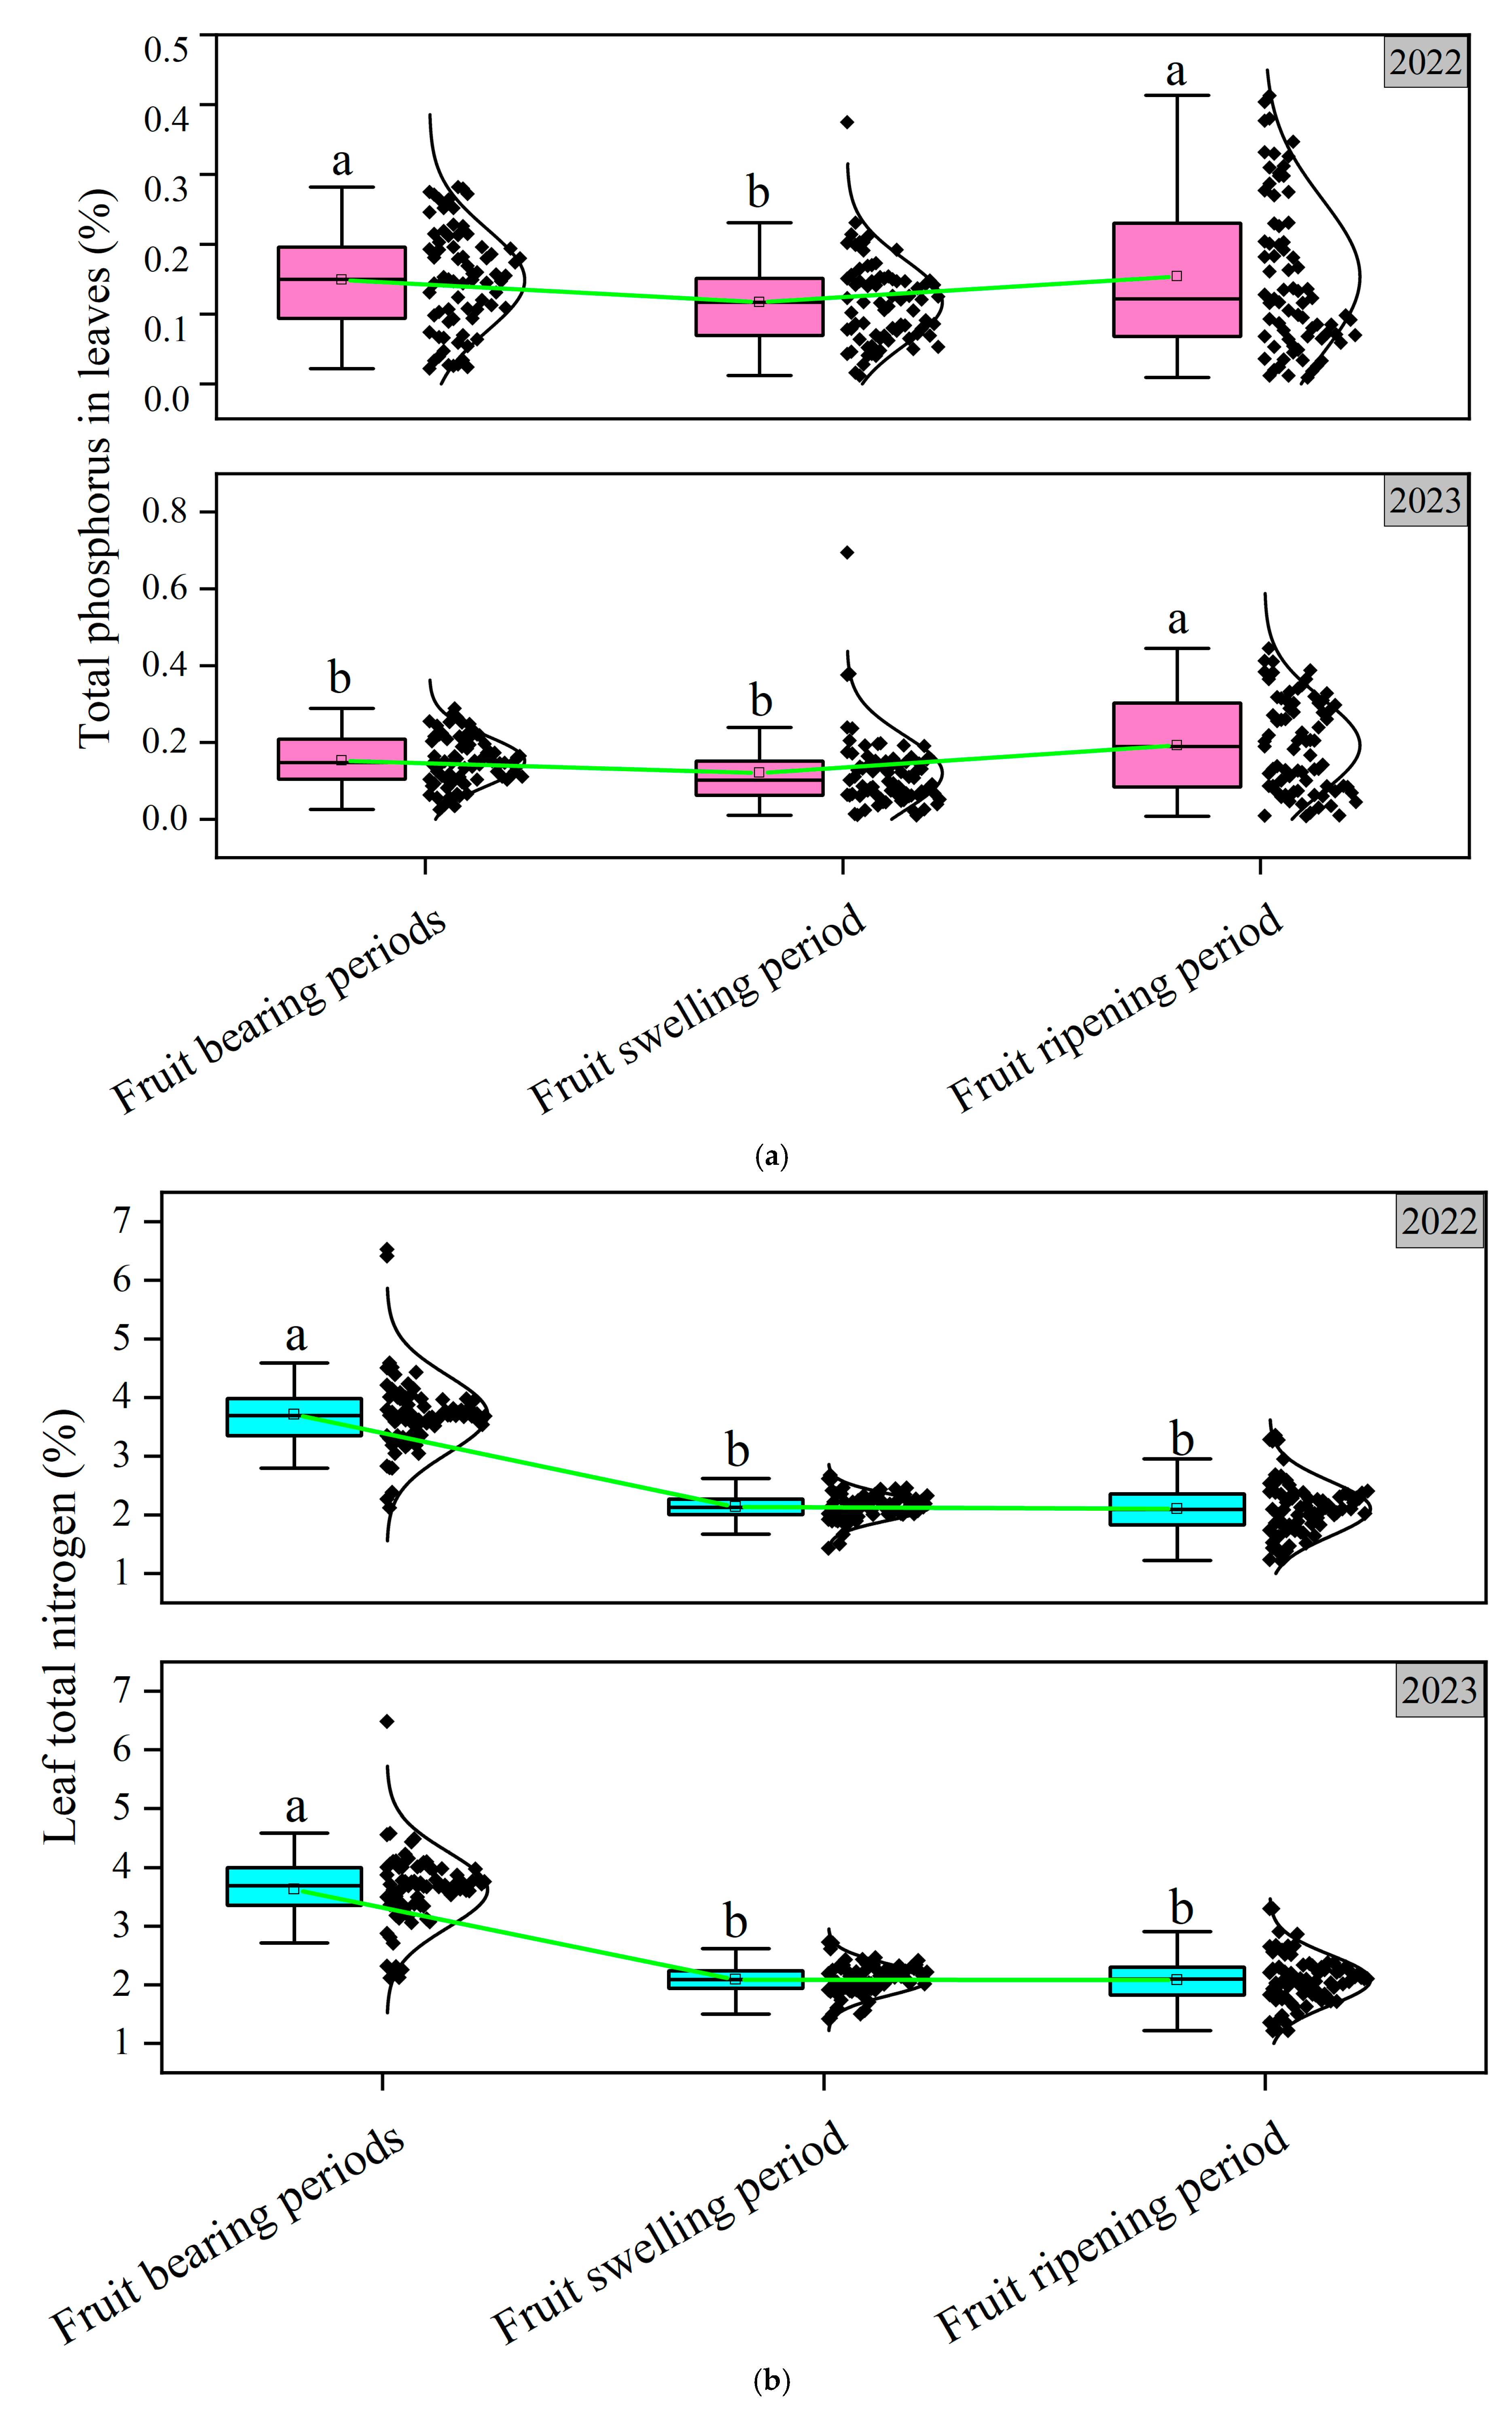
3.2. Analysis of Leaf Physiological Indicators

These four box plots present the distribution of total phosphorus, total nitrogen, total potassium contents and SPAD (soil and plant analysis development) values of the leaves of Korla fragrant pears during the fruit setting stage, expansion stage, and maturity stage in 2022 and 2023.
Leaf total phosphorus content (Figure 4a) showed distinct distribution patterns across years and phenological stages, with variations in boxplot positions and dispersion degrees. Both years nevertheless shared consistent overall trends featuring an initial decrease followed by an increase, reaching peak mean values during fruit maturation (111 and 111, respectively). Occasional outliers were observed, potentially linked to fertilization differences, climatic conditions or other factors, demonstrating dynamic phosphorus uptake and utilization patterns in pear trees across growth phases.
Leaf total nitrogen content (Figure 4b) demonstrated a declining overall trend in both 2022 and 2023, with significantly higher mean values observed during the fruit-setting period (111 and 111) compared to the fruit expansion and maturation stages. The variability in box lengths and the presence of outliers indicated fluctuations in total nitrogen content across different years and phenological stages, which may be associated with nitrogen translocation and allocation within the trees, as well as external nitrogen supply conditions.
For leaf total potassium content (Figure 4c), the box positions and data dispersion exhibited consistent patterns across phenological stages in both 2022 and 2023, with higher mean values during the fruit-setting period (111 and 111) compared to the fruit expansion and maturation stages. These findings reflect the characteristic potassium requirements of pear trees at different growth stages. The relatively higher potassium content during fruit-setting and its subsequent fluctuations during expansion and maturation demonstrate potassium’s functional role in fruit development and its dynamic equilibrium within the tree system.
The leaf SPAD (Soil and Plant Analysis Development) values (Figure 4d) exhibited distinct distribution patterns between 2022 and 2023 across different phenological stages, with lower values during fruit setting (111 and 111) and higher values during fruit expansion (111 and 111), though some datasets showed considerable dispersion with outliers. Values stabilized during fruit maturation. As SPAD (Soil and Plant Analysis Development) values reflect leaf chlorophyll content, their variations are closely associated with photosynthetic activity and growth status in pear trees. The observed differences between years and phenological stages may be influenced by environmental factors (light intensity, temperature, water availability), and tree nutritional status.
Collectively, these four figures present the distribution characteristics and variation patterns of key nutrient indicators and chlorophyll-related parameters in Korla fragrant pear leaves across different years and phenological stages through ANOVA boxplot visualization, providing crucial data visualization support for in-depth research on pear tree nutritional physiology and scientific fertilization management.

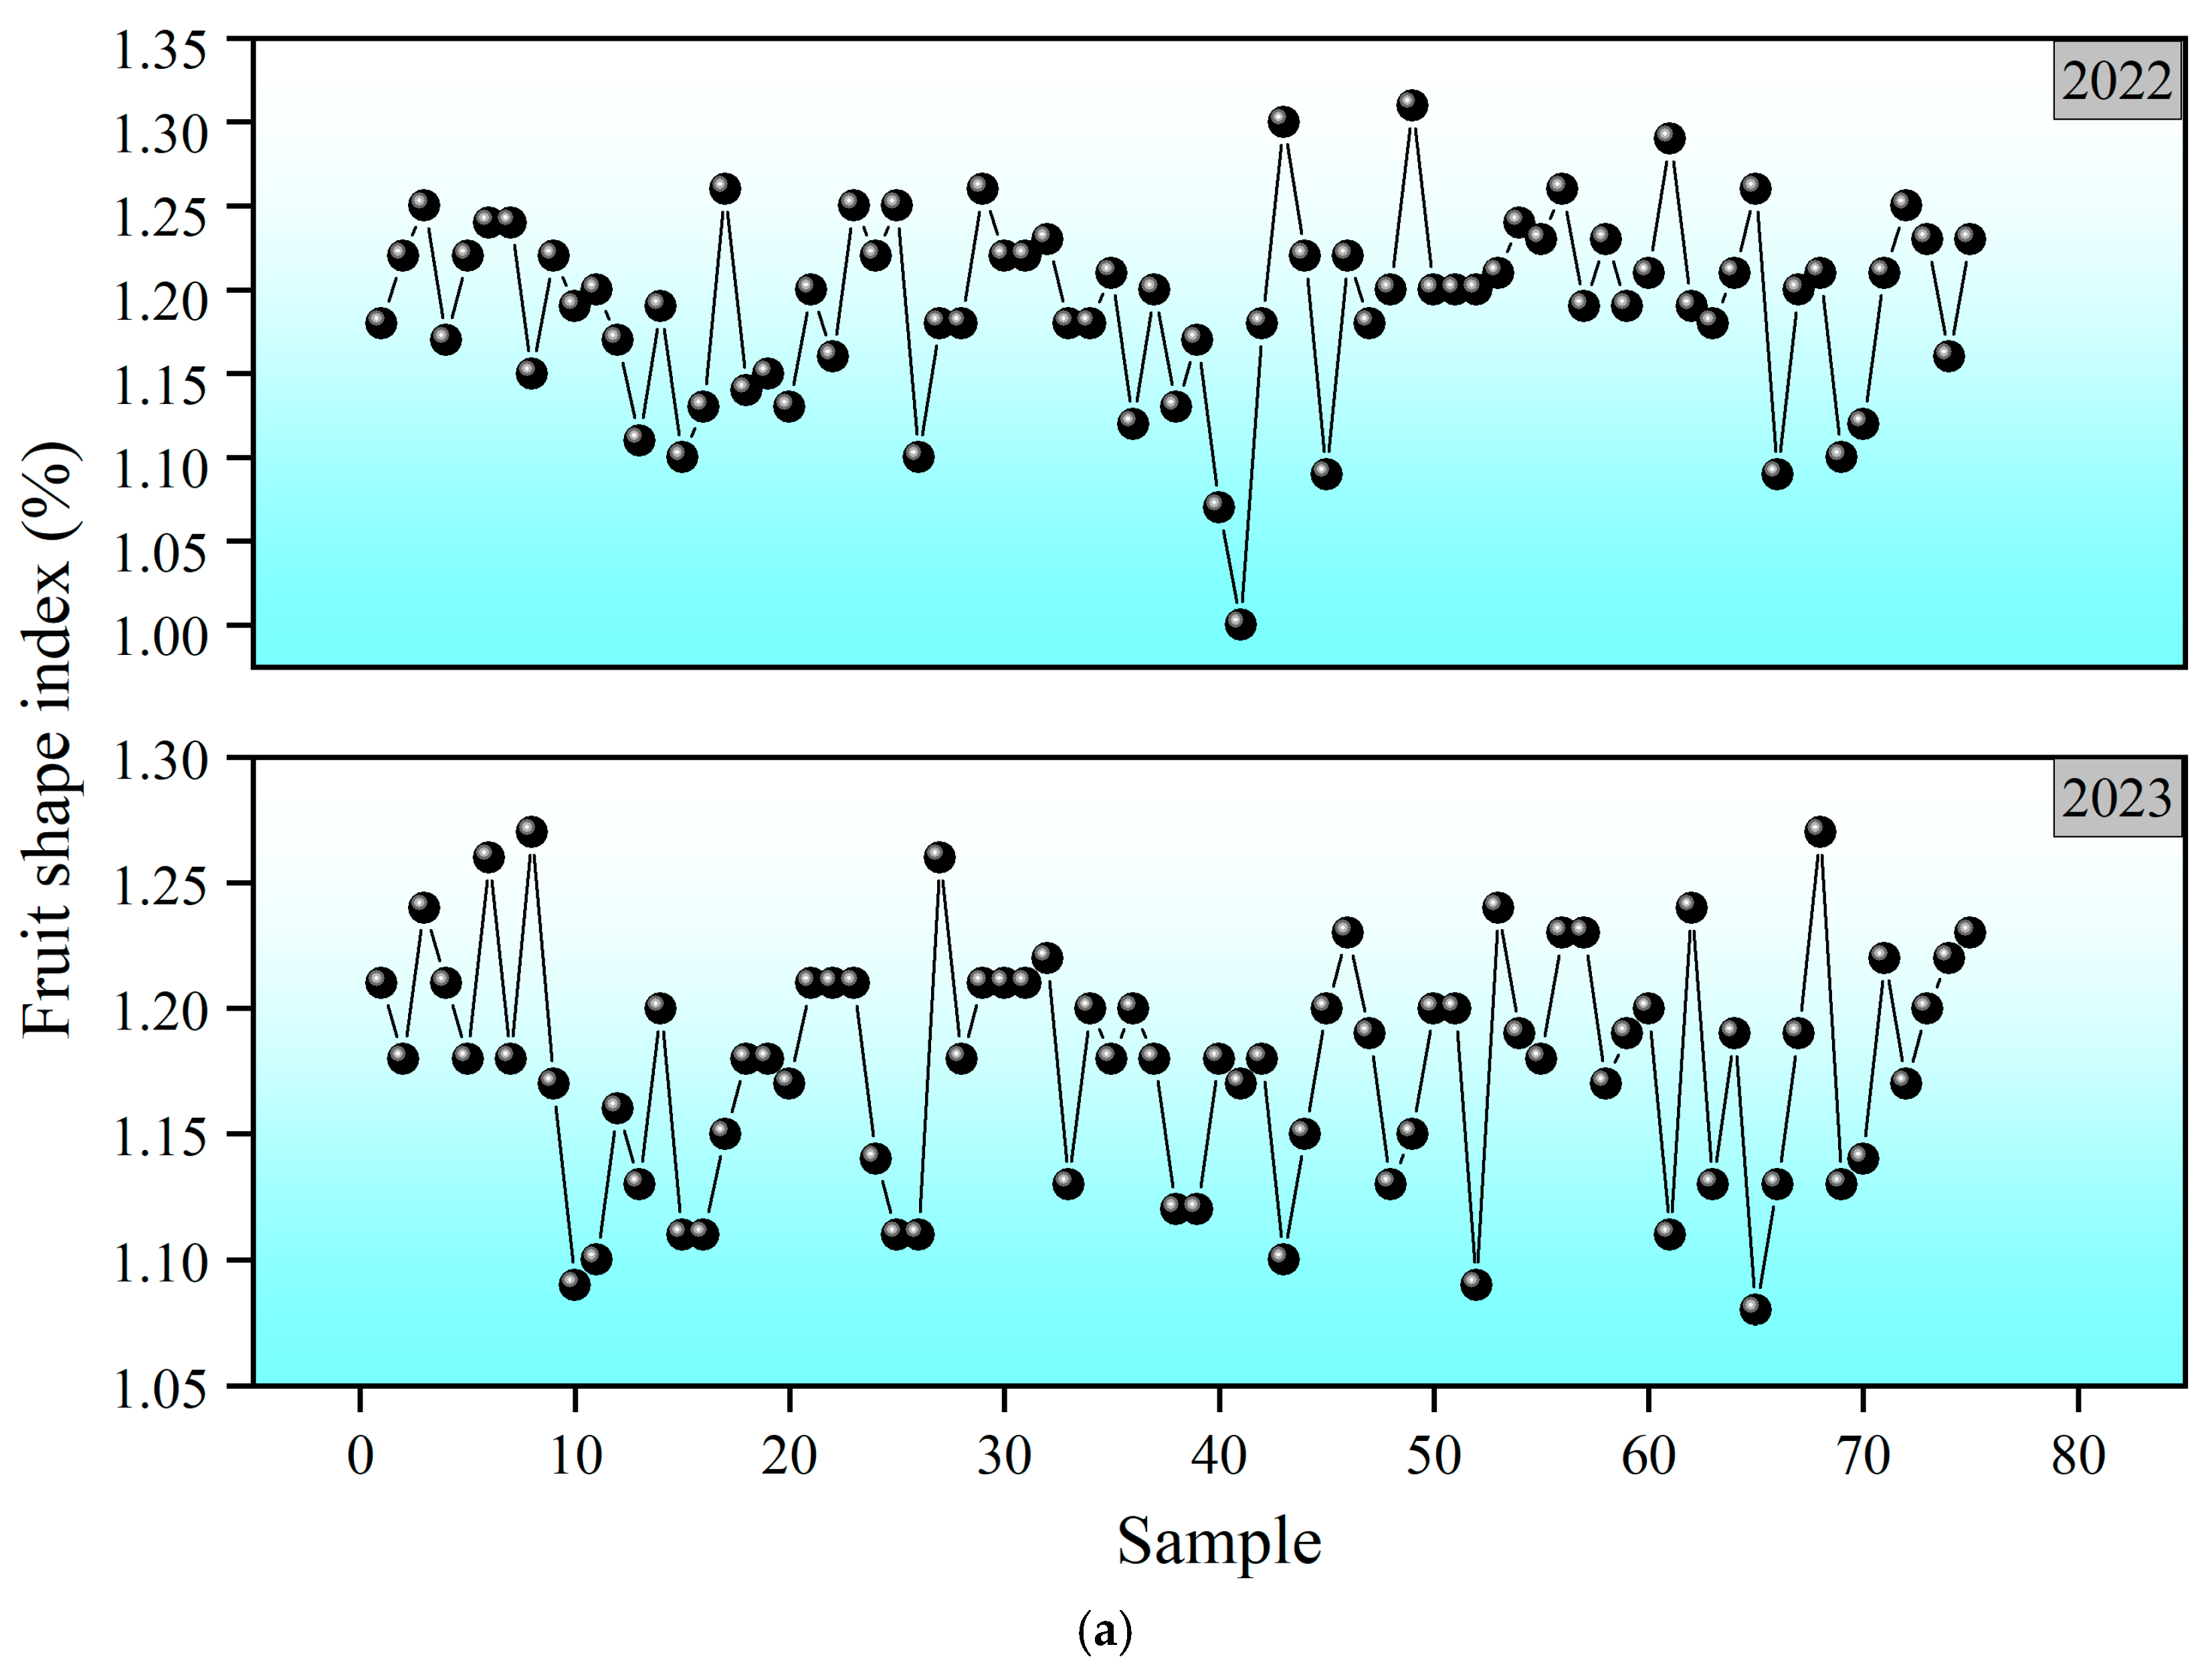
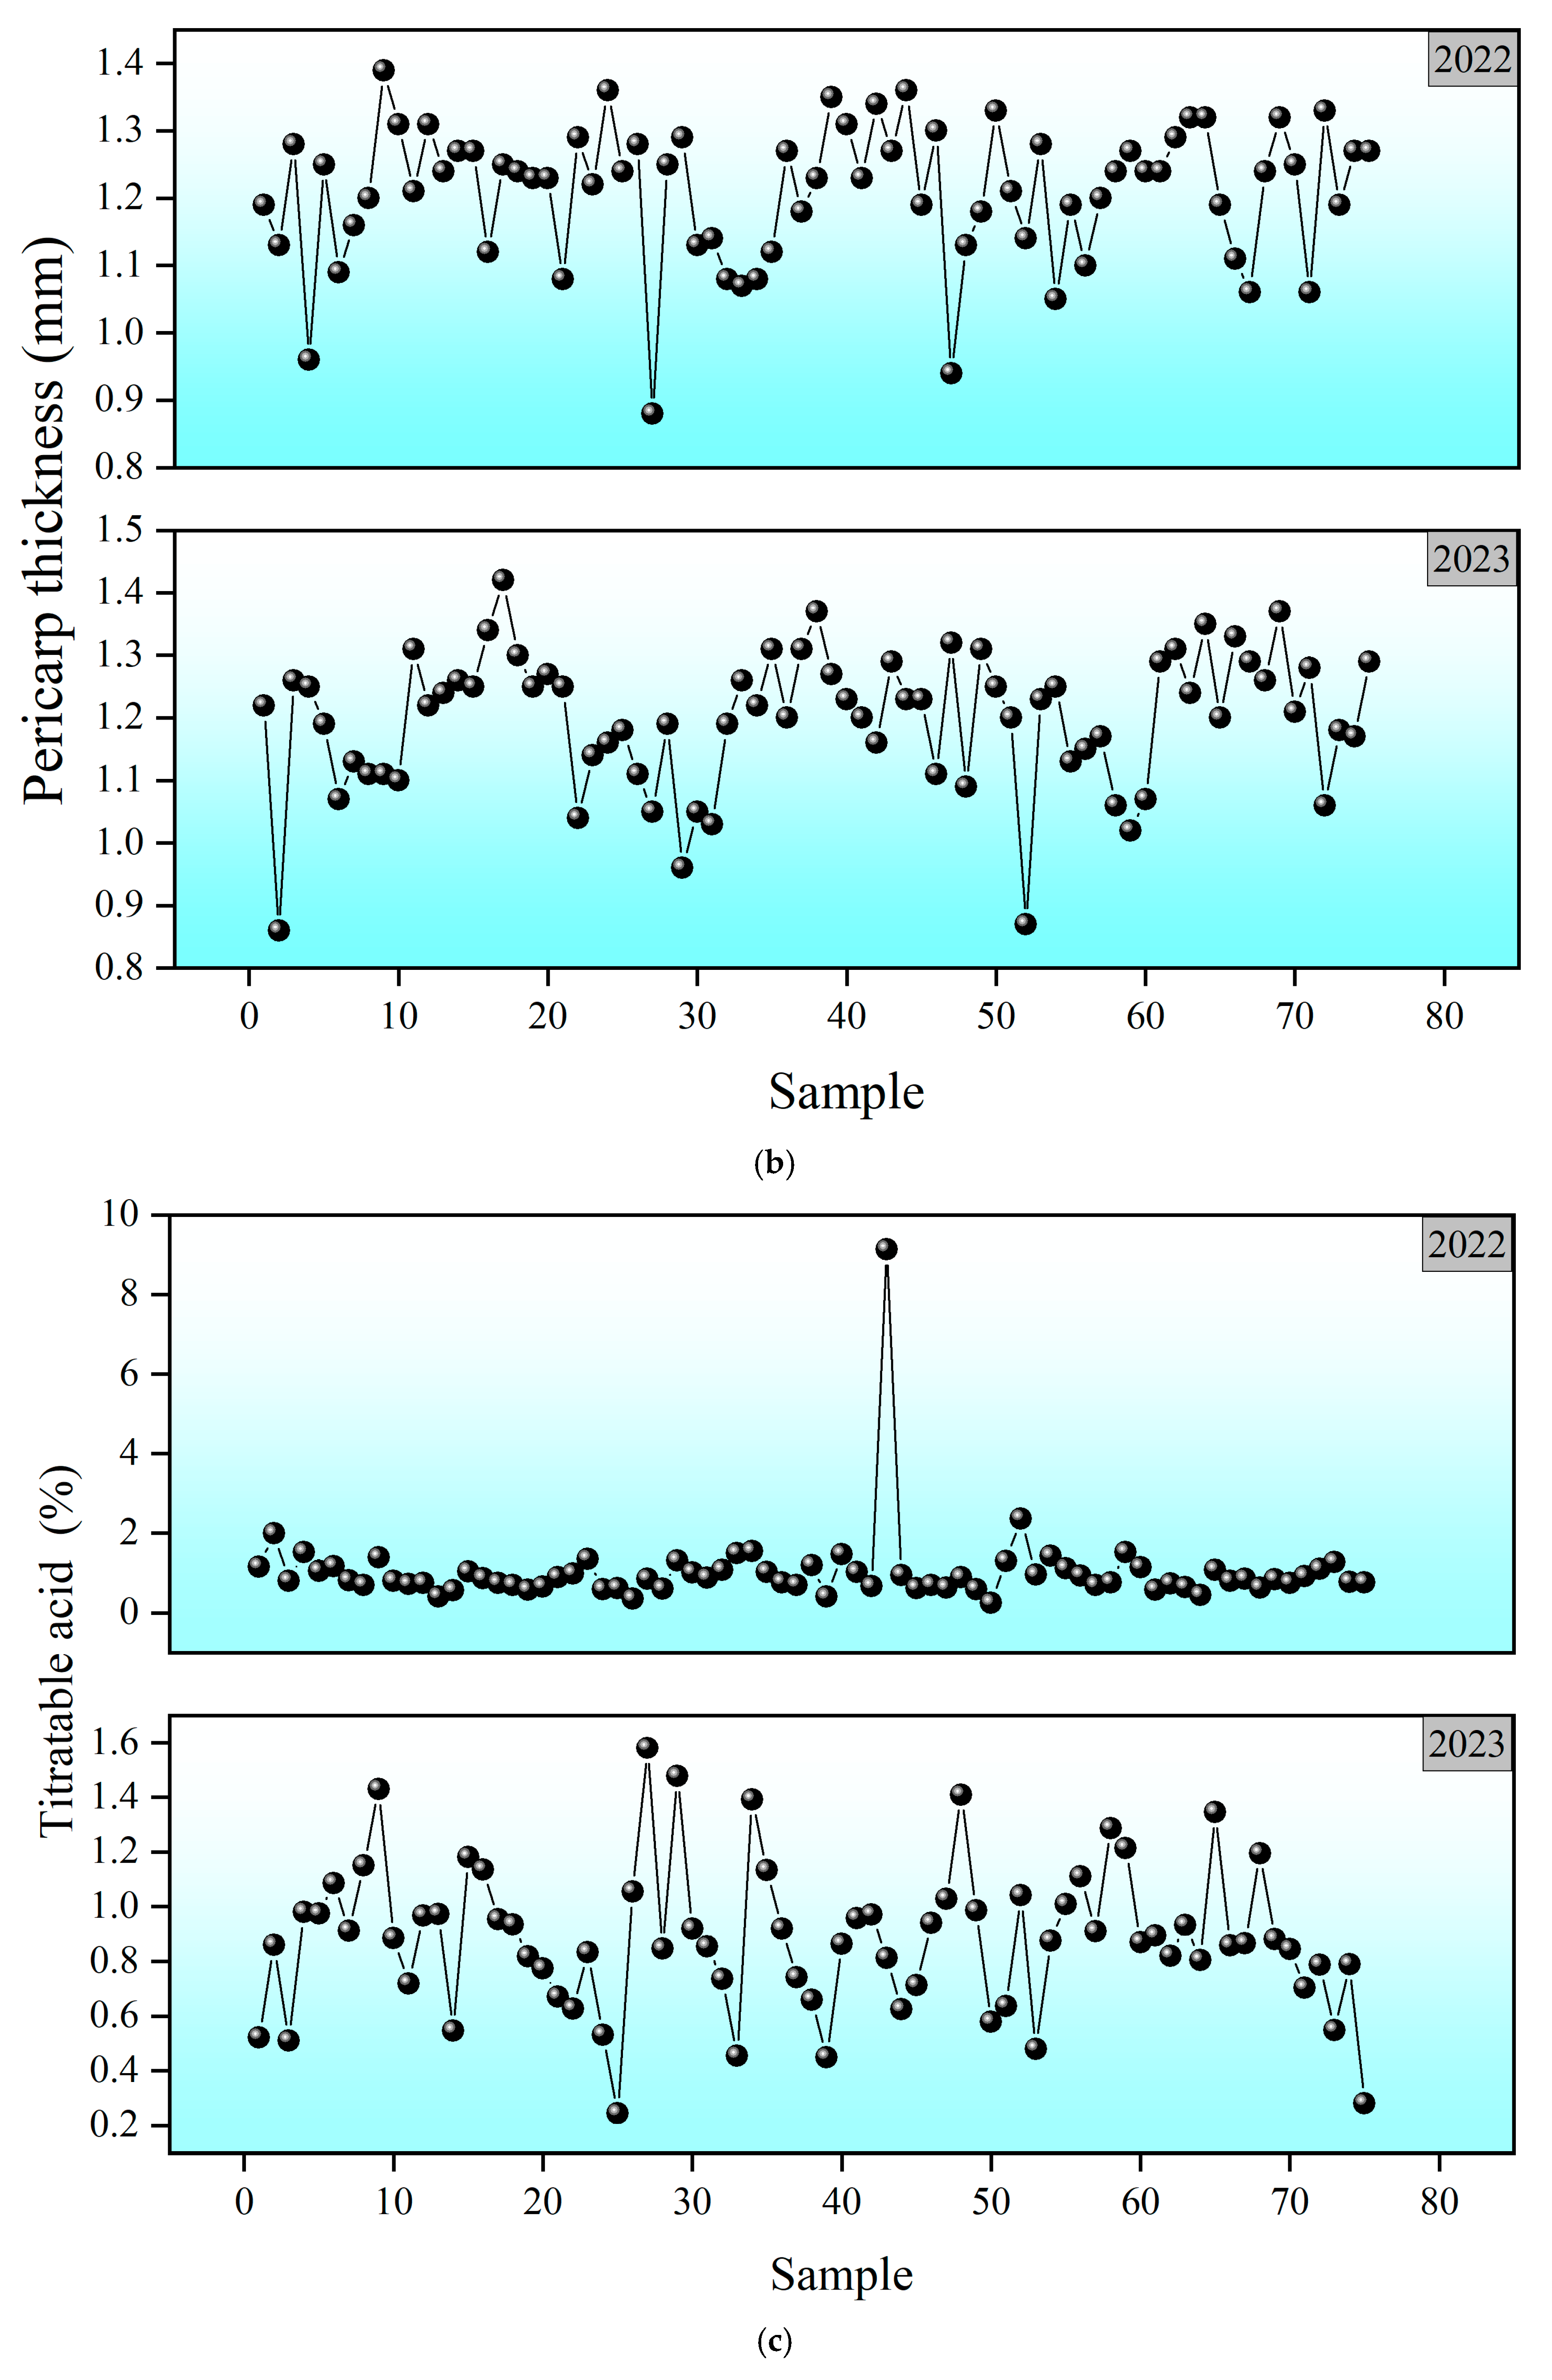
3.3. Visualization of Fruit Quality

These four plots show the distribution of the fruit shape index, peel thickness, titratable acid content and soluble solid content between different samples in 2022 and 2023, respectively.
From Figure 5a, the fruit shape index in 2022 and 2023 showed fluctuations between different samples. In 2022, the fruit shape index is mostly concentrated between 1.1 and 1.3, and the distribution range in 2023 is similar to that, but the specific numerical fluctuations are different. The deviation from the mean value of the fruit shape index of individual samples may be related to the cultivation management measures such as climatic conditions, unbalanced nutrient supply or pruning measures, and these factors may affect the growth and development process of pear trees, and thus cause the difference in fruit morphology.
In Figure 5b, sample data are given for 2022 and 2023. In 2022, some samples in 2022 were between 0.9 and 1.3 mm, and the overall distribution range in 2023 was similar but the numerical fluctuation pattern was different. This fluctuation may result from differences in environmental factors, such as light, temperature, and water, as well as the dynamic changes of tree nutrient distribution during fruit development, leading to different degrees of peel development.
Figure 5c shows the sample variation of titratable acid content in 2022 and 2023. In 2022, the overall titratable acid content is relatively low and the distribution is relatively concentrated, and the fluctuation range is expanded in 2023. Some high-value anomalies in 2022 may be caused by local physiological changes or measurement errors during fruit development; the fluctuations in 2023 reflect that the fruit organic acid metabolism may be affected by various factors, such as the accumulation of photosynthetic products and changes of respiratory intensity.
Figure 5d shows that the dissolved solids content fluctuated across samples in 2022 and 2023. Most 2022 and 2023 samples were between 10 and 15%, though some samples were beyond this range each year. Its fluctuation is closely related to the sugar accumulation of fruit sugar, which is regulated by factors such as light duration, temperature difference between day and night, fertilization level, and so on. The changes in these factors in different years lead to the difference of soluble solids content in fruits.

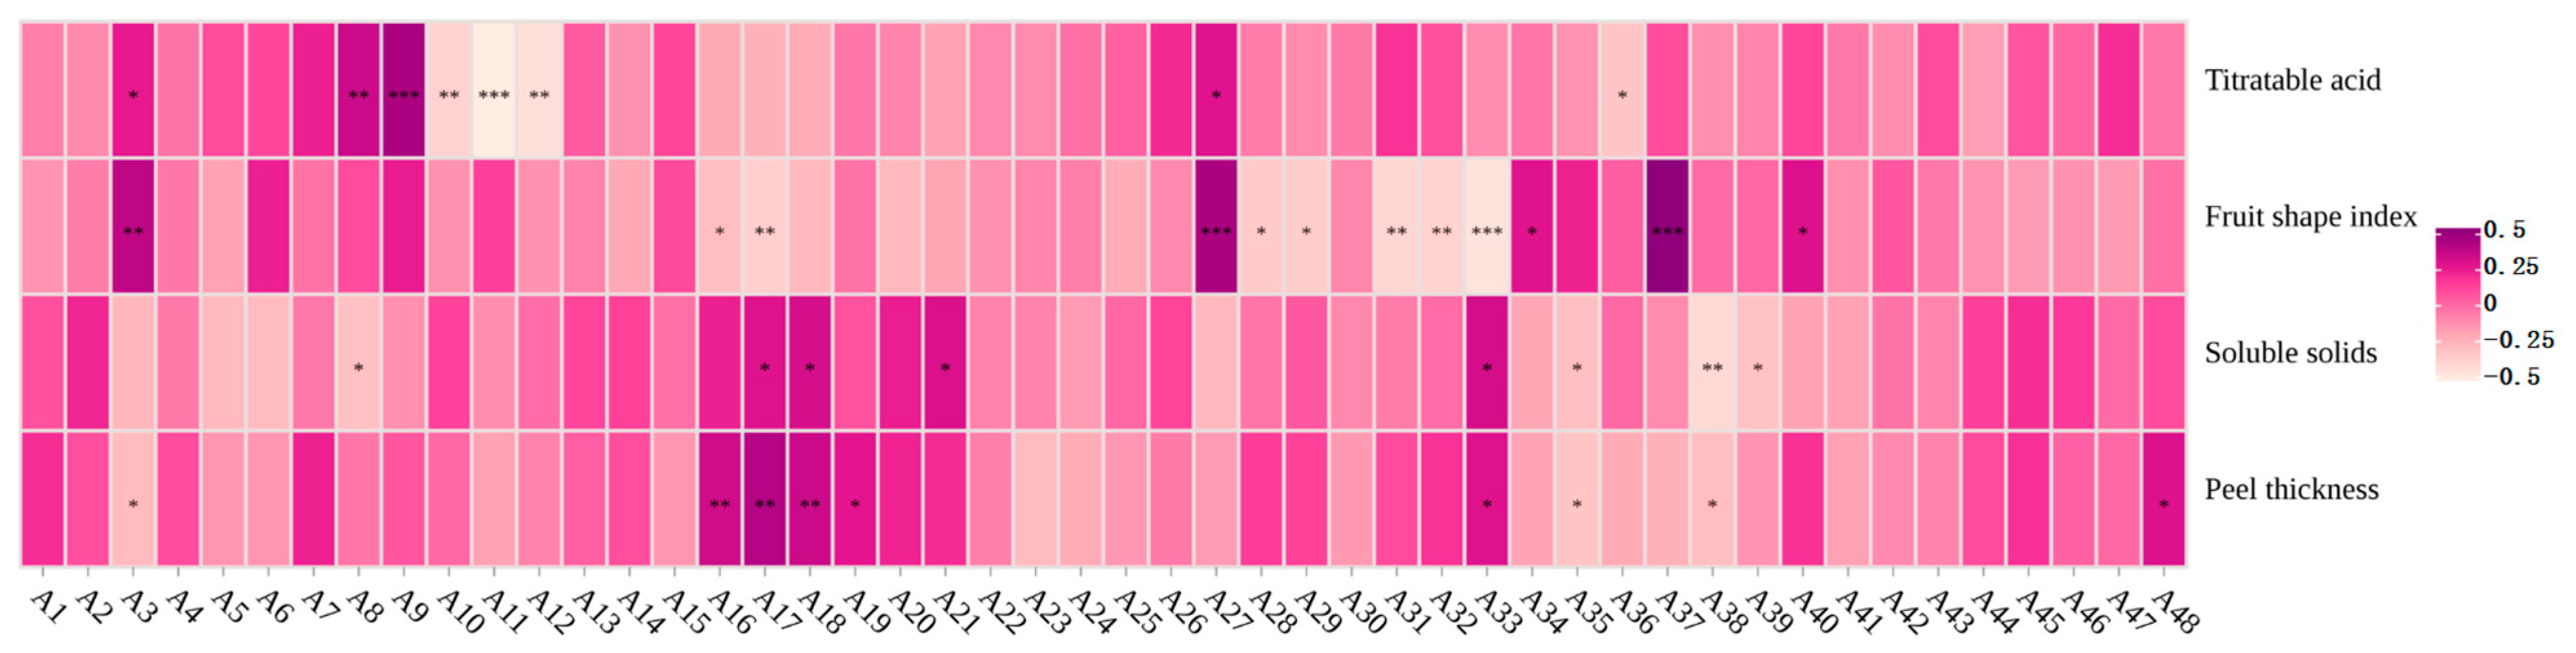
3.4. Feature Index Selection

In the related research on Korla fragrant pear, a simple correlation analysis was conducted between various indicators in leaves and soil and the titratable acid, soluble solids, fruit shape index, and fruit skin thickness. The corresponding results are presented in Figure 6. As shown in Figure 6, regarding the titratable acid, it shows a significant positive correlation with A3, A8, A9, and A27, indicating that, when the values of these indicators (A3, A8, A9, A27) change, the content of titratable acid will change in the same direction; while the titratable acid shows a significant negative correlation with A10, A11, A12, and A36, meaning that changes in the values of these indicators will cause a reverse trend in the content of titratable acid. In terms of fruit shape index, it shows a positive correlation with A3, A27, A34, A37, and A40, indicating that, as the values of the corresponding indicators increase or decrease, the fruit shape index will show an upward or downward trend accordingly; in contrast, the fruit shape index shows a significant negative correlation with A16, A17, A28, A29, A31, A32, and A33, meaning that the changes in these indicators will have an opposite effect on the fruit shape index.
For soluble solids, there is a significant positive correlation between them and indicators such as A17, A18, A21, and A33, indicating that changes in these indicators will lead to the corresponding change in the content of soluble solids; meanwhile, soluble solids show a significant negative correlation with A8, A35, A38, and A39, meaning that changes in the values of these indicators will cause the content of soluble solids to change in the opposite direction. Furthermore, fruit peel thickness shows a significant positive correlation with indicators such as A16, A17, A18, A19, A33, and A48, indicating that changes in these indicators will cause the fruit peel thickness to increase or decrease accordingly; while fruit peel thickness shows a negative significant correlation with A3, A35, and A38, meaning that changes in these indicators will have an opposite effect on the fruit peel thickness.
It is worth noting that the selection of input variables is of crucial importance in the construction of the artificial neural network (ANN) model. In this study on the Korla fragrant pear, based on the significant correlations between the input variables (see Table 1) and the fruit shape index, fruit peel thickness, soluble solids content, and titratable acid content of Korla fragrant pear, the corresponding input variables were carefully selected and determined. This laid the foundation for the subsequent construction and analysis of the ANN model, ensuring that the model could accurately reflect the intrinsic connections among various factors and the influence mechanisms on the relevant quality indicators of Korla fragrant pear.

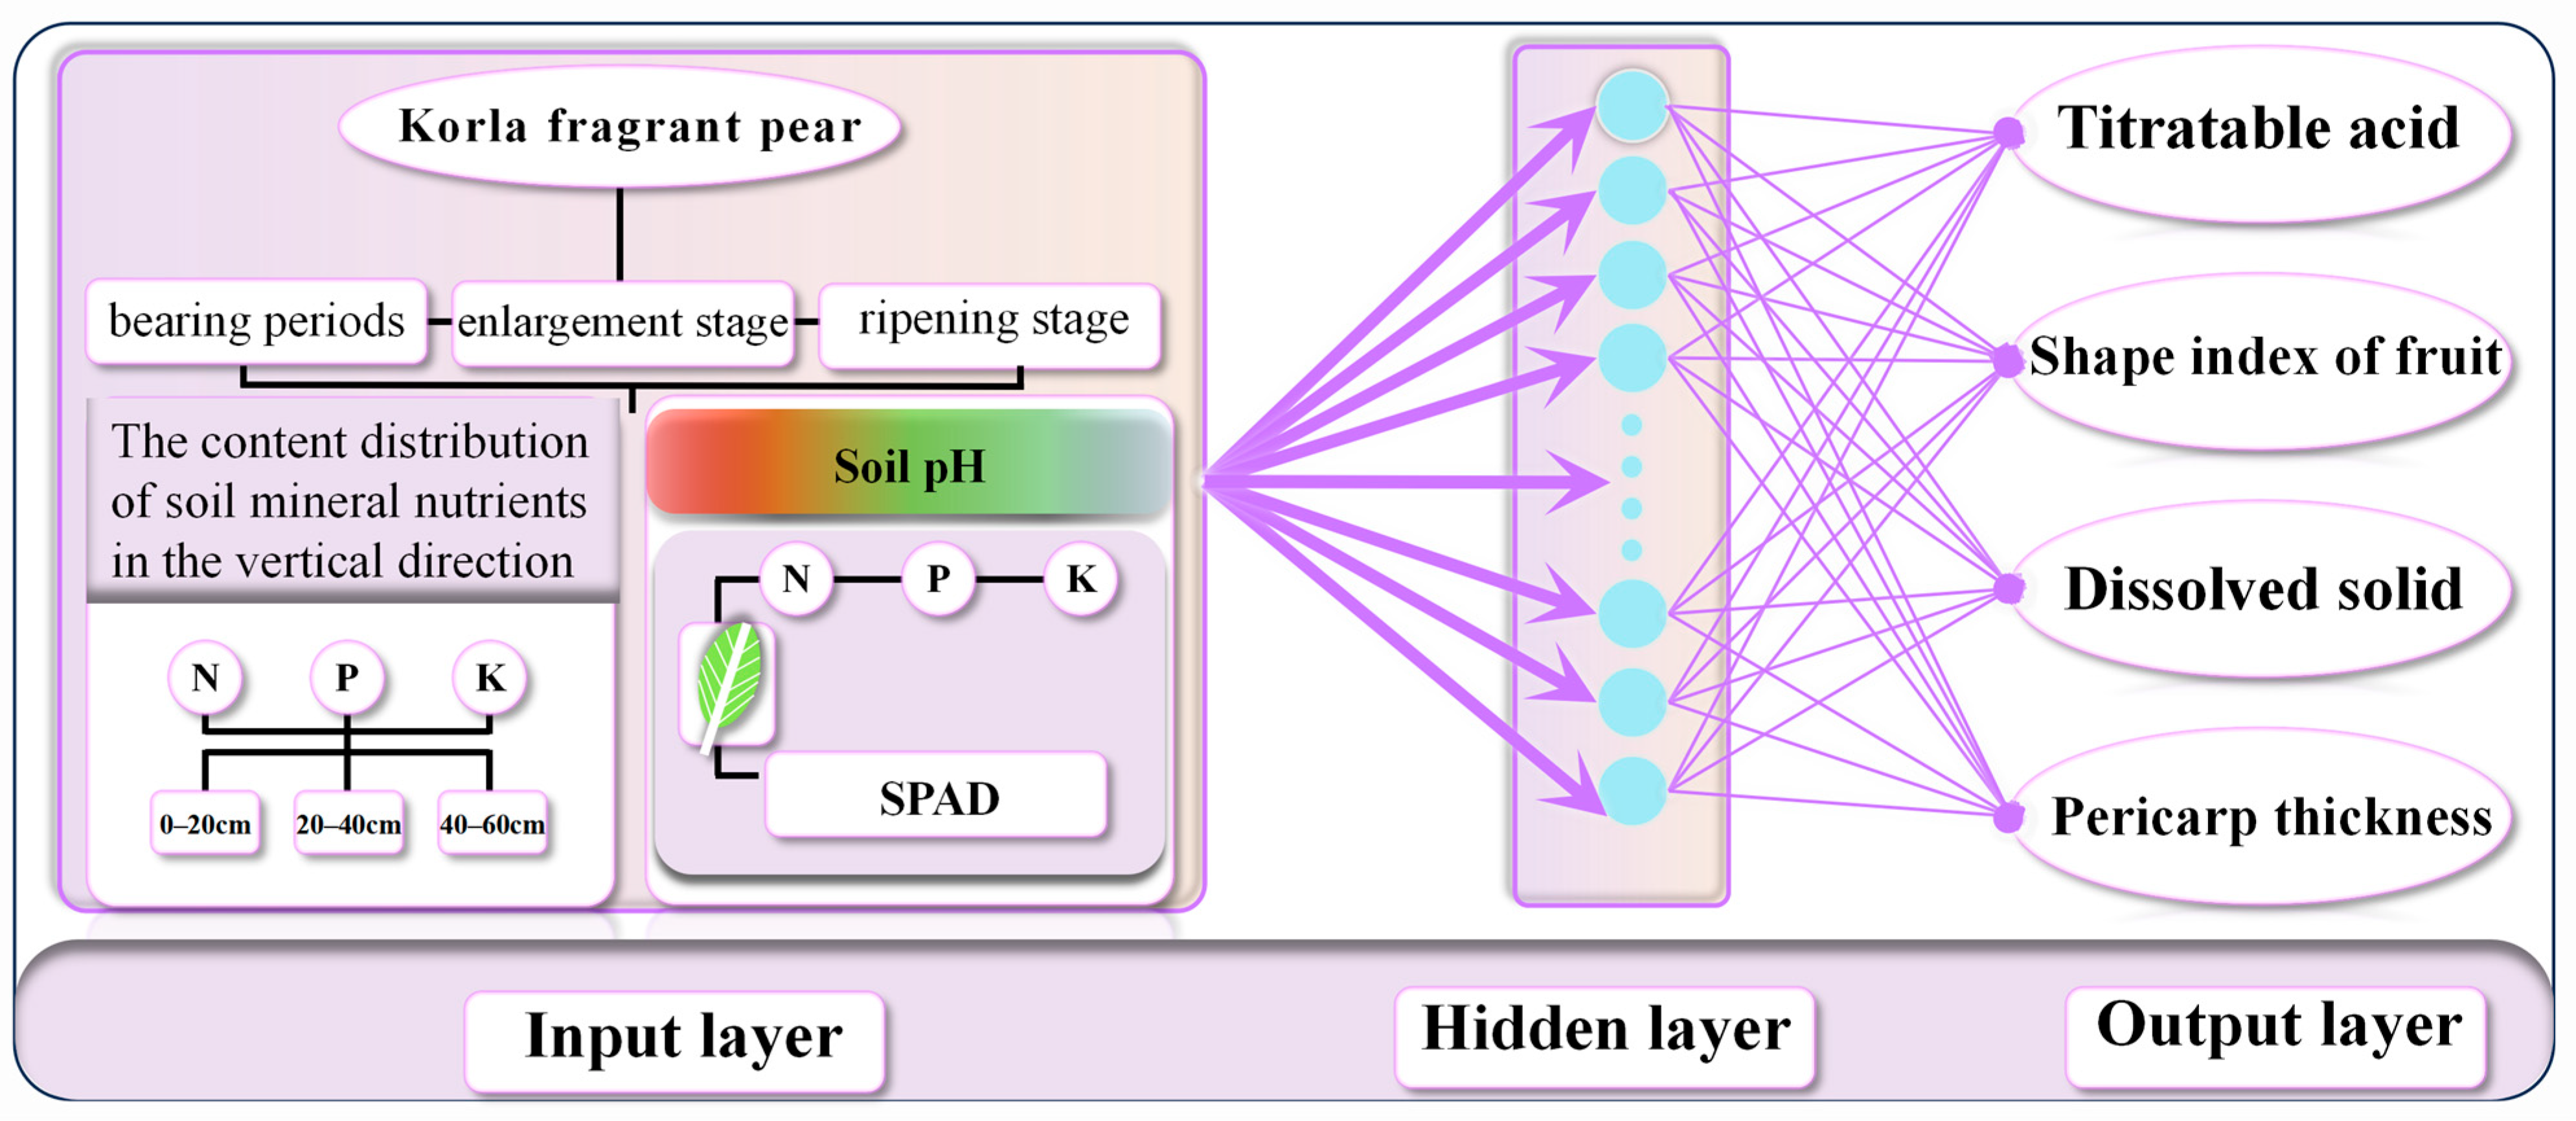
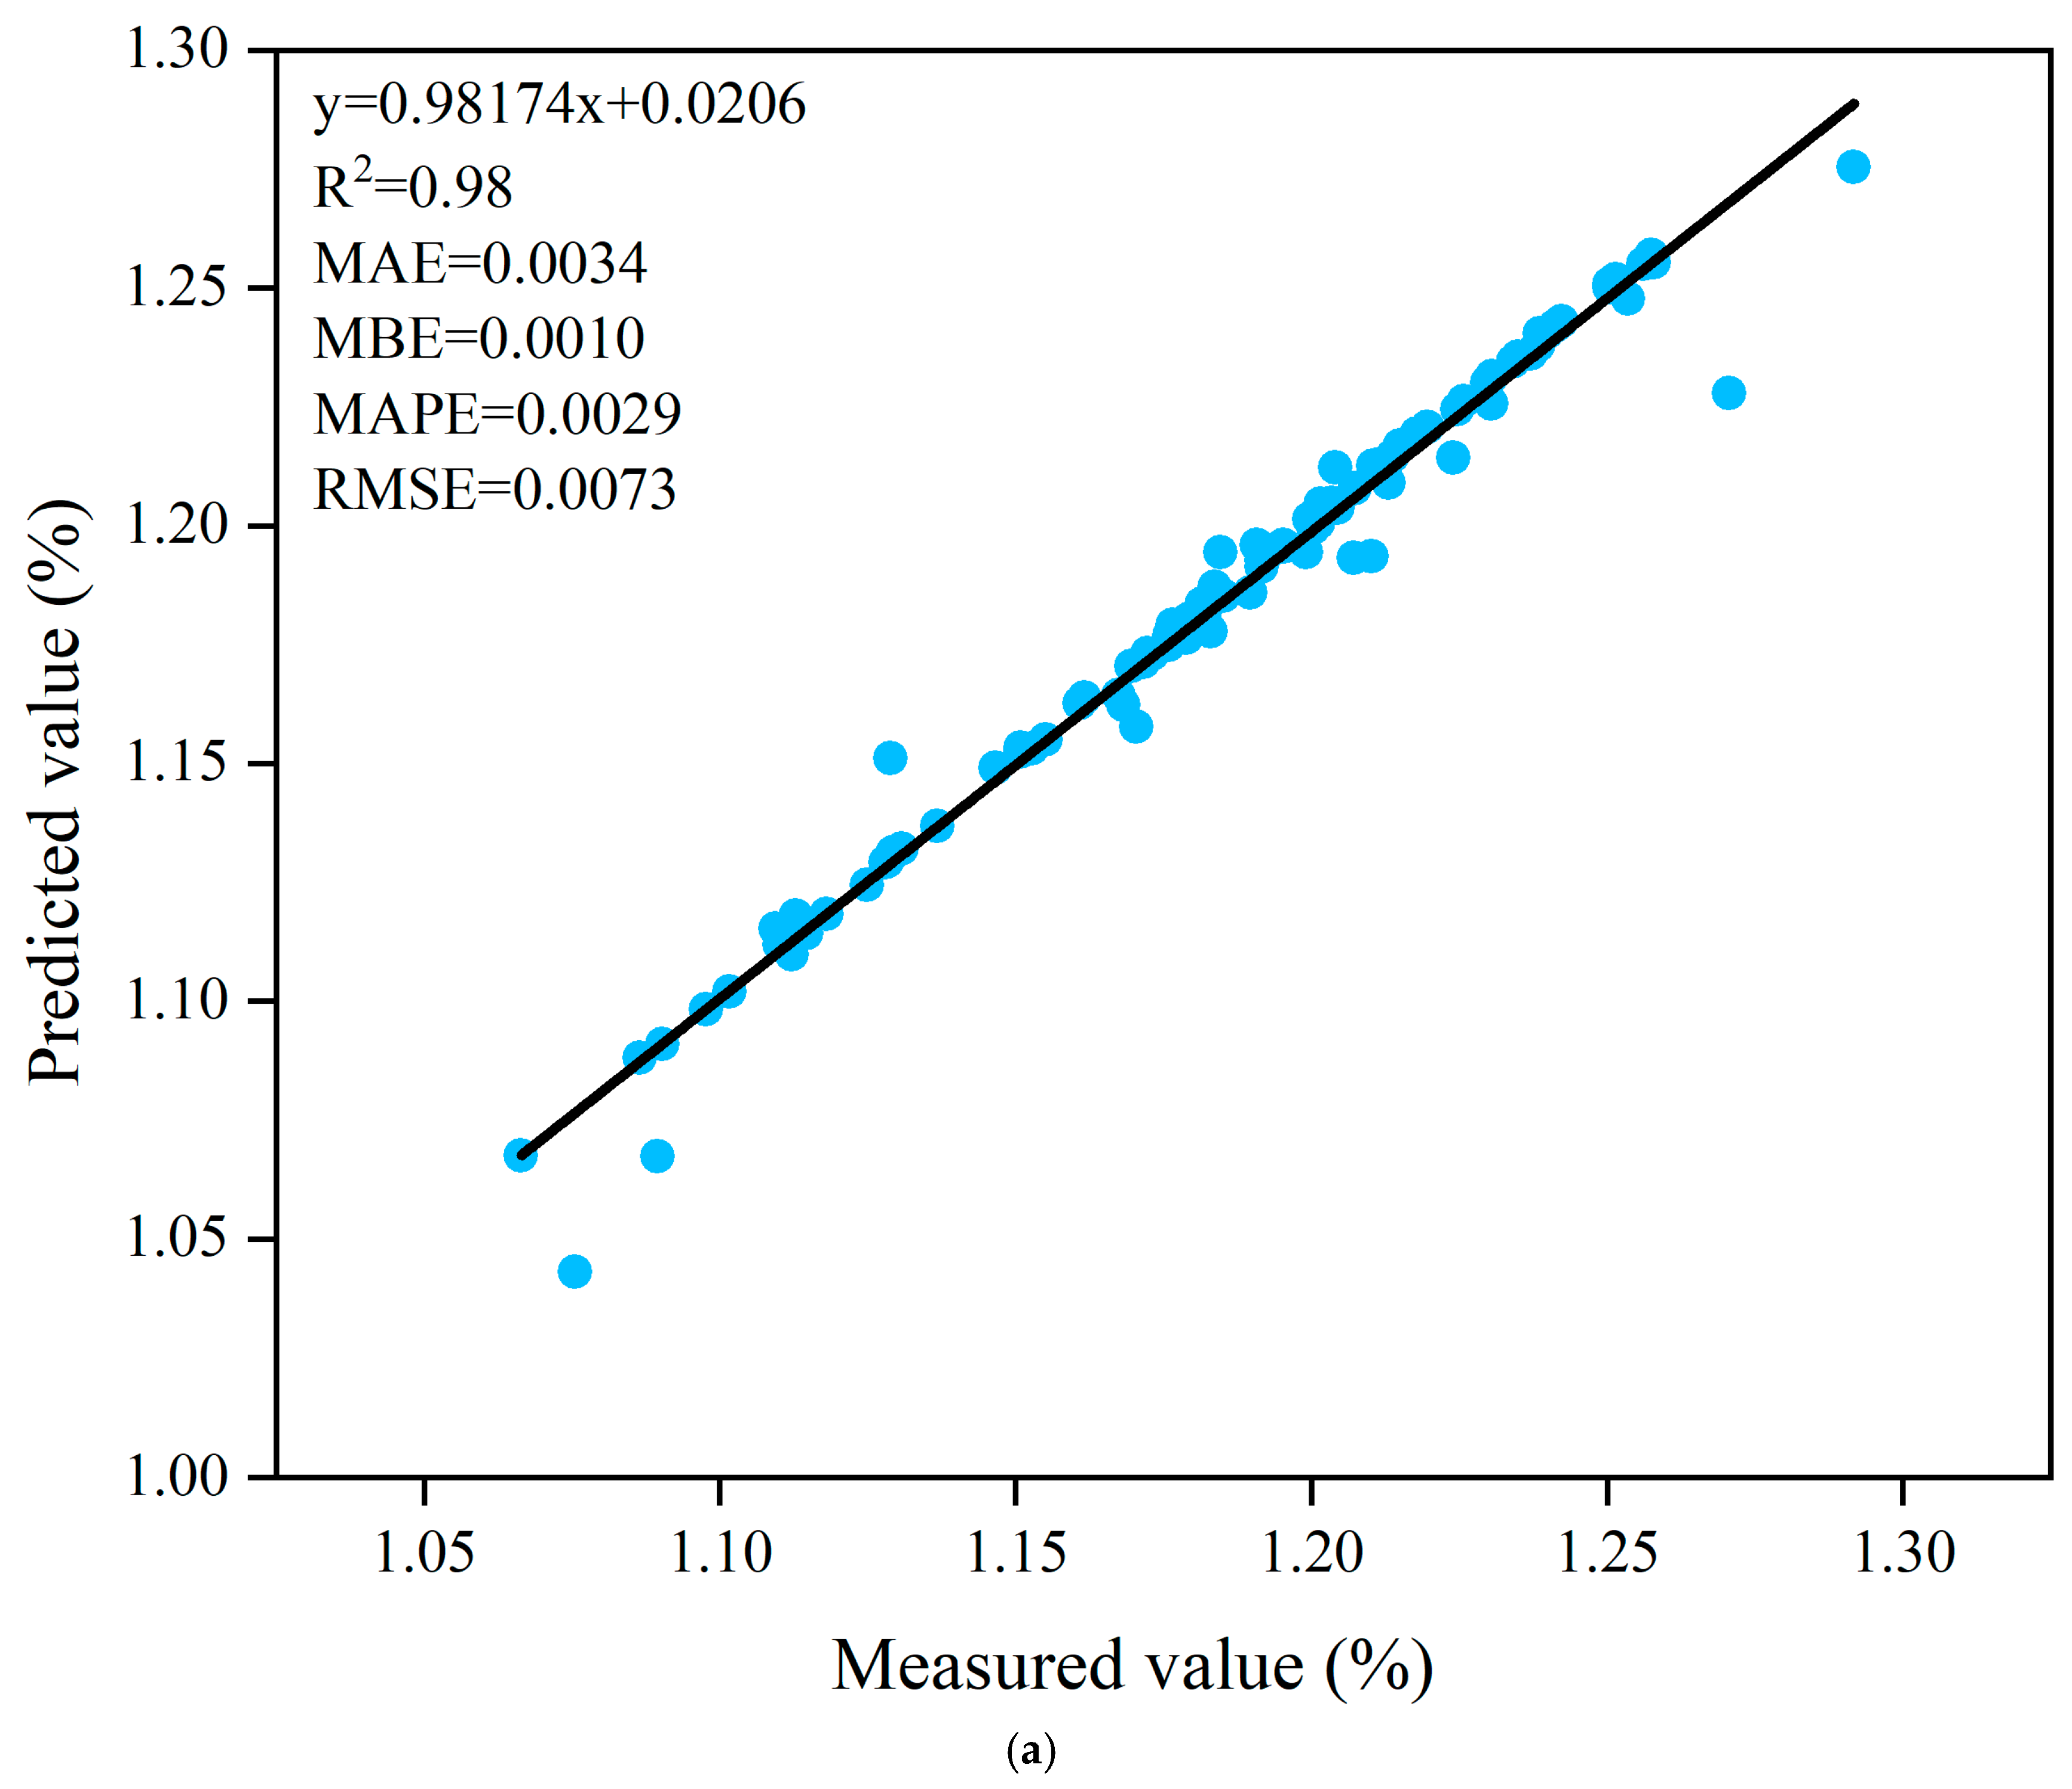
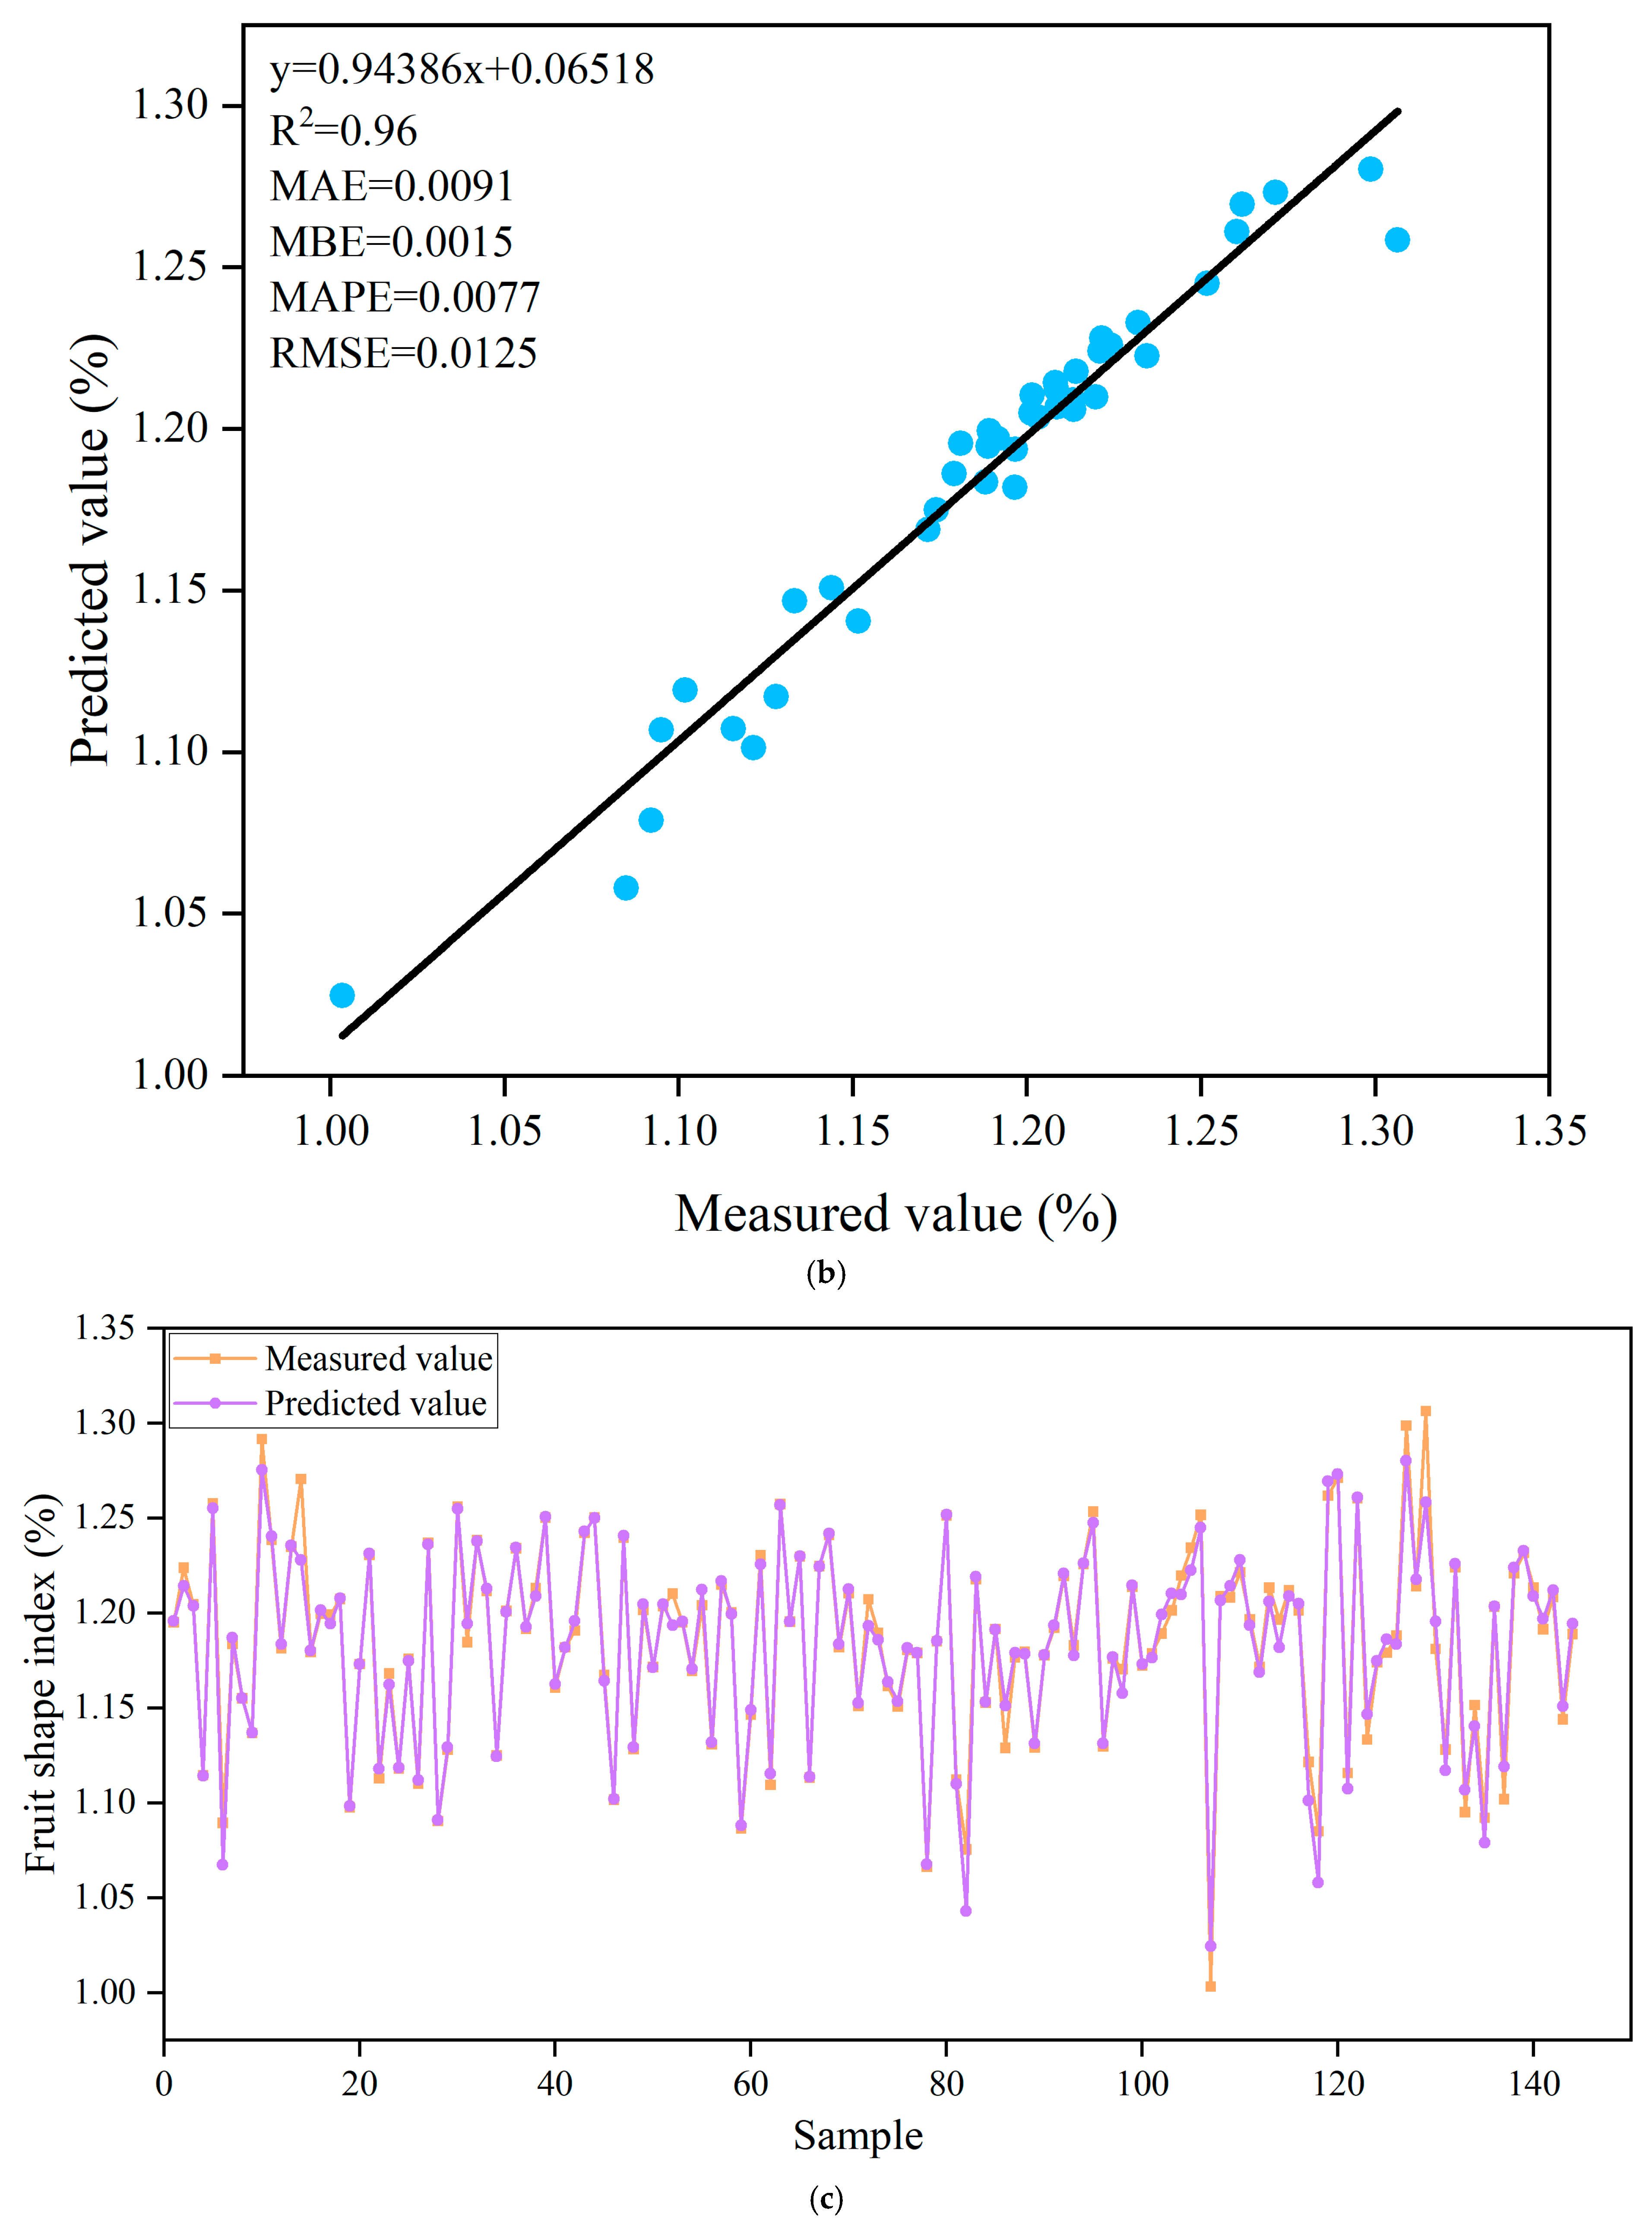
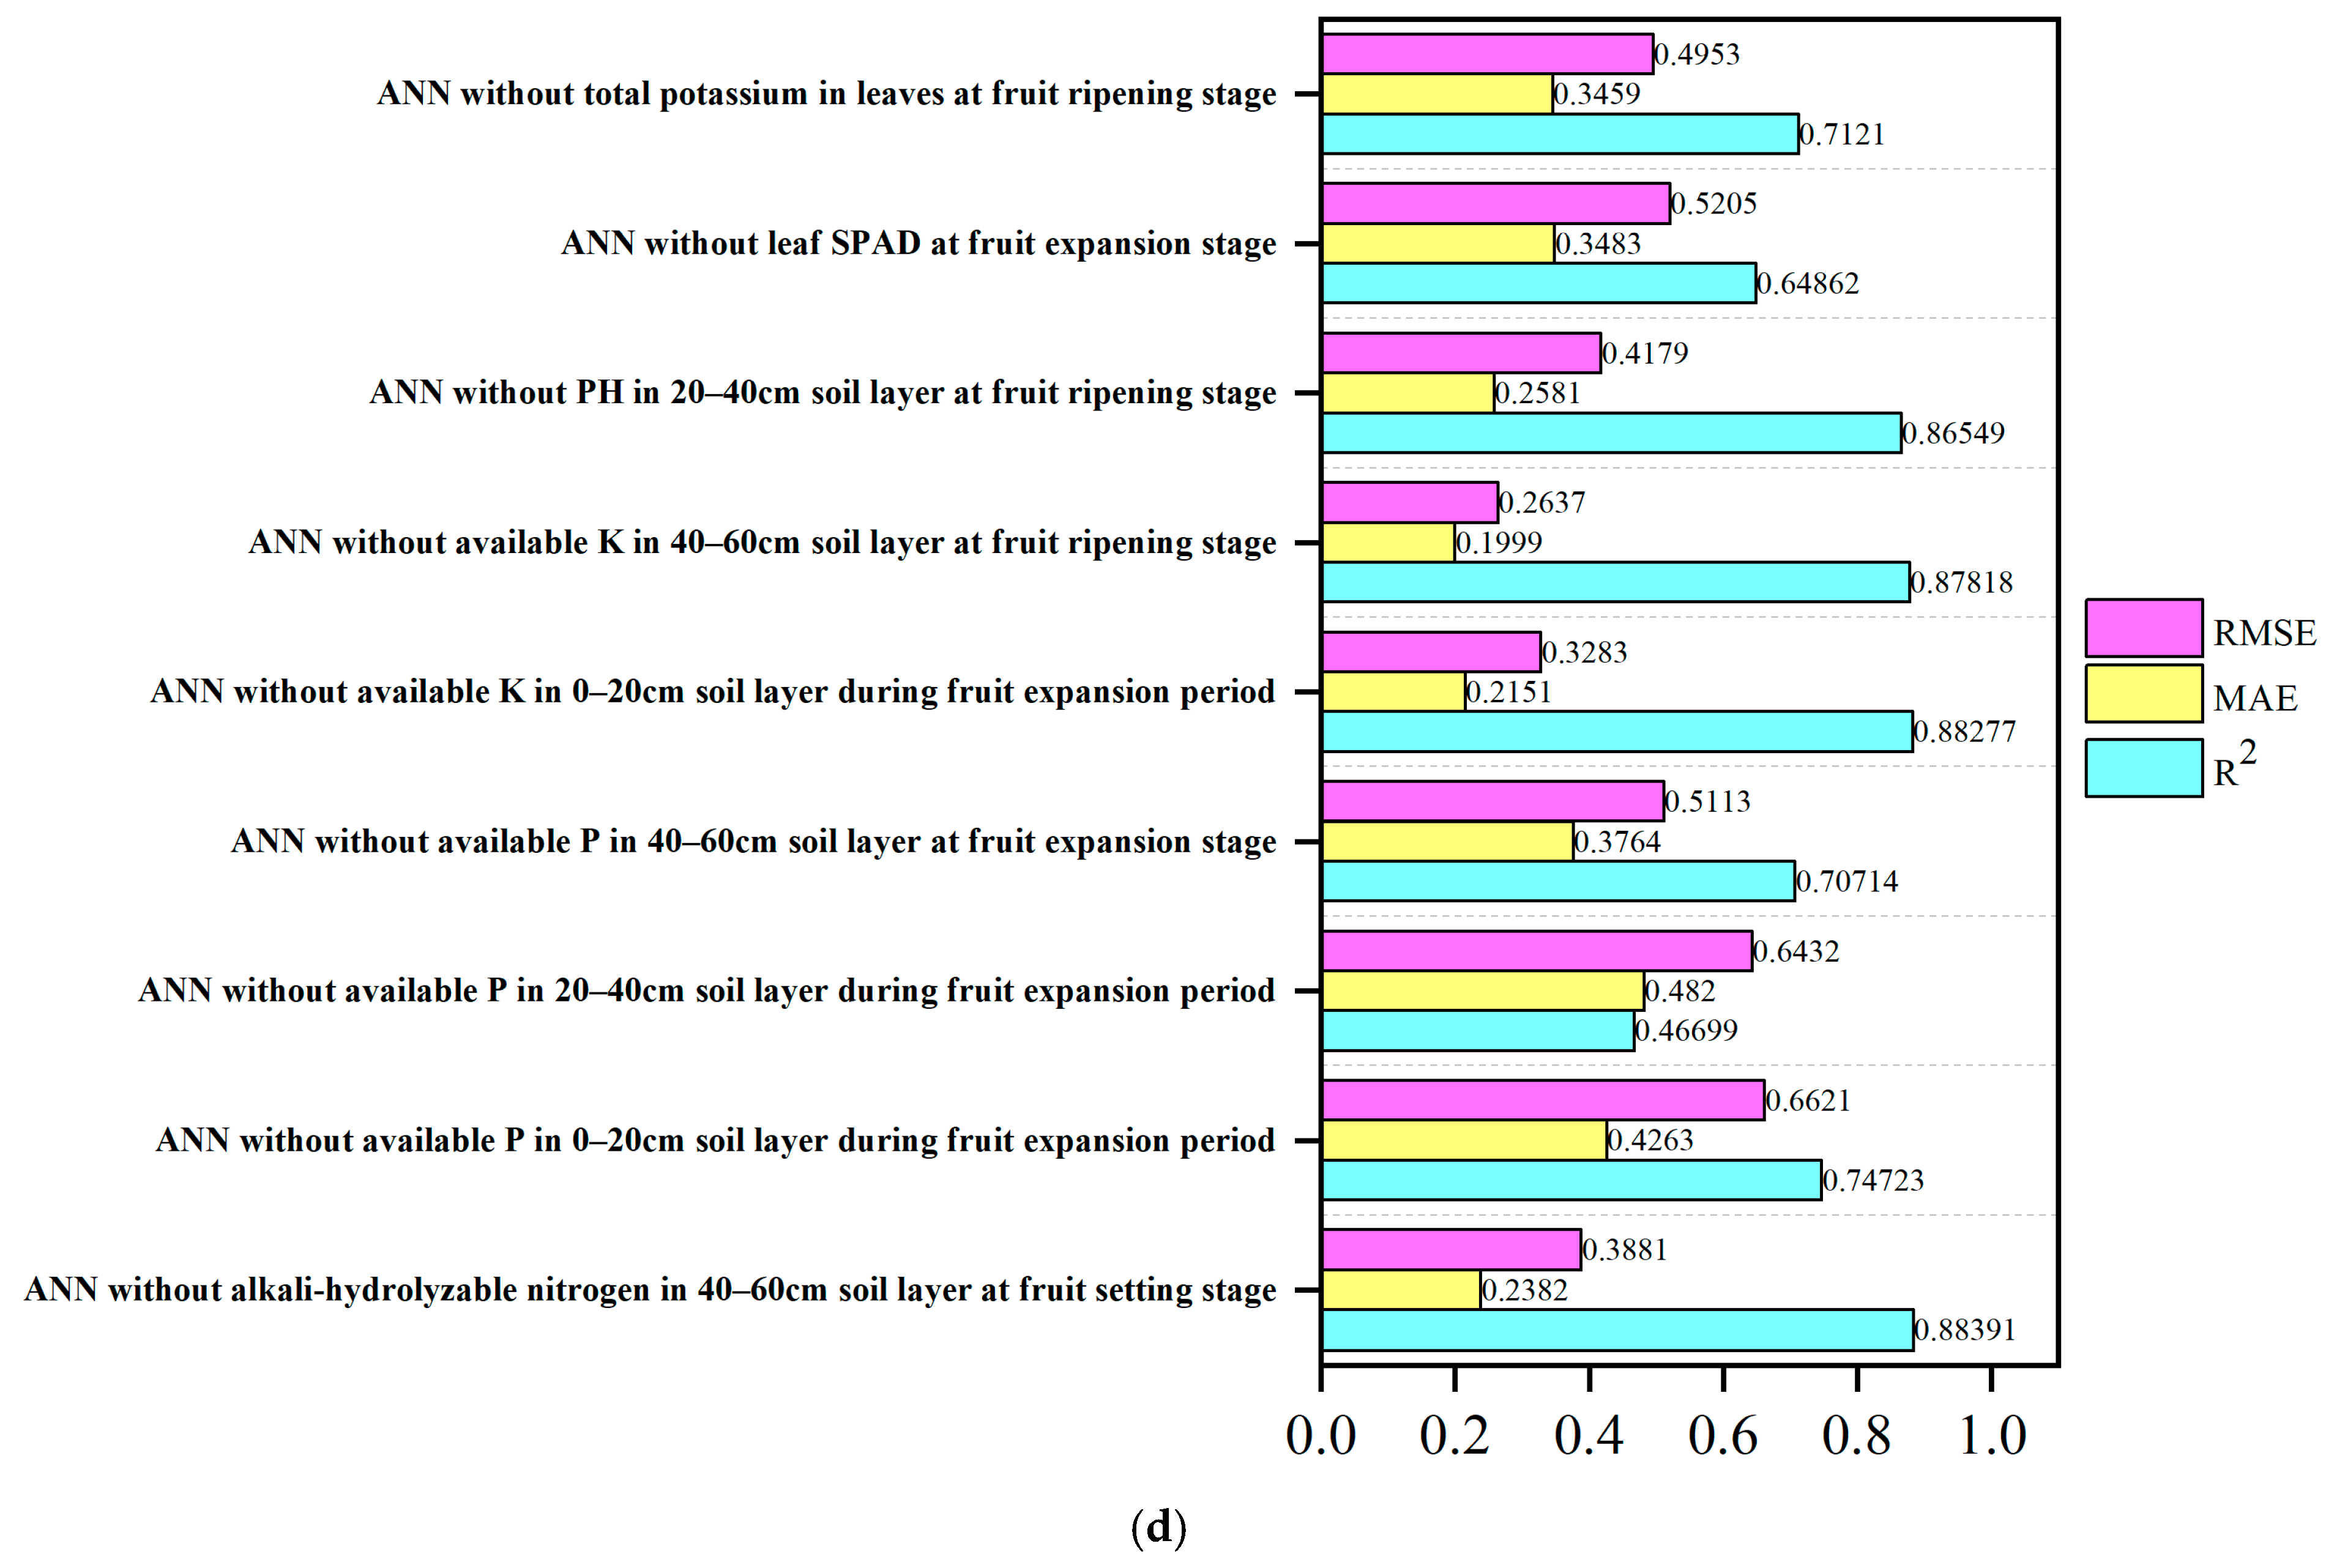
3.5. Prediction of Fruit Shape Index Based on ANN Algorithm

During the process of constructing an effective model for predicting the fruit shape index of Korla fragrant pears, we selected input variables (A3, A16, A17, A27, A28, A29, A31, A32, A33, A34, A37, A40), and through simulating three different training functions and two pairs of transfer functions, we constructed an artificial neural network (ANN) model aiming to explore the optimal model architecture that can accurately predict the fruit shape index. Meanwhile, five key statistical parameters were introduced, namely the determination coefficient (R2), mean absolute error (MAE), mean bias error (MBE), mean absolute percentage error (MAPE), and root mean square error (RMSE), to comprehensively and systematically evaluate the performance of each ANN model. The results of the optimal model corresponding to R2, MAE, MBE, MAPE, and RMSE for each series of ANN models are shown in Table 2. After analysis, it was found that, when using the Trainlm function for training, the artificial neural network equipped with Tansig-purelin and logsig-purelin transfer functions exhibited relatively higher accuracy in predicting the fruit shape index of Korla fragrant pears. Specifically, in the training set, the model equipped with Tansig-purelin transfer function had an R2 value of 0.98, while the model equipped with the logsig-purelin transfer function had an R2 value of 0.97. (All model results can be found in Table S1 of the Supplementary Materials).
In contrast, the performance of the other models in terms of prediction accuracy failed to meet the expected standards, so these underperforming models were discarded for the sake of considering the accuracy and effectiveness of the models. Further comparison reveals that the model equipped with the Tansig-purelin transfer function outperforms the one with the logsig-purelin transfer function in all performance indicators, especially in the validation set stage, where the former demonstrates more prominent advantages. The validation set of this model shows extremely excellent performance, with an average deviation error (MBE) as low as 0.001, a root mean square error (RMSE) of only 0.0073, and a highest coefficient of determination (R2). Taking into account the above advantages, in the subsequent research, we are more inclined to focus on the model equipped with the Tansig-purelin transfer function for in-depth exploration. The neural network structure of this model is 12-10-1, which shows good adaptability and efficiency in the overall prediction process. To conduct a more comprehensive and in-depth assessment of the stability of this ANN model, we carried out a detailed comparative analysis of the predicted and measured values of the fruit shape index during the training and validation stages. The results show that the predicted fruit shape index is highly consistent with the measured values in the distribution pattern (see Figure 7a,b), and all predicted values show significant consistency with the measured values in the changing trend (as shown in Figure 7c). The results indicate that this ANN model is reliable and effective in predicting the fruit shape index of Korla fragrant pear.

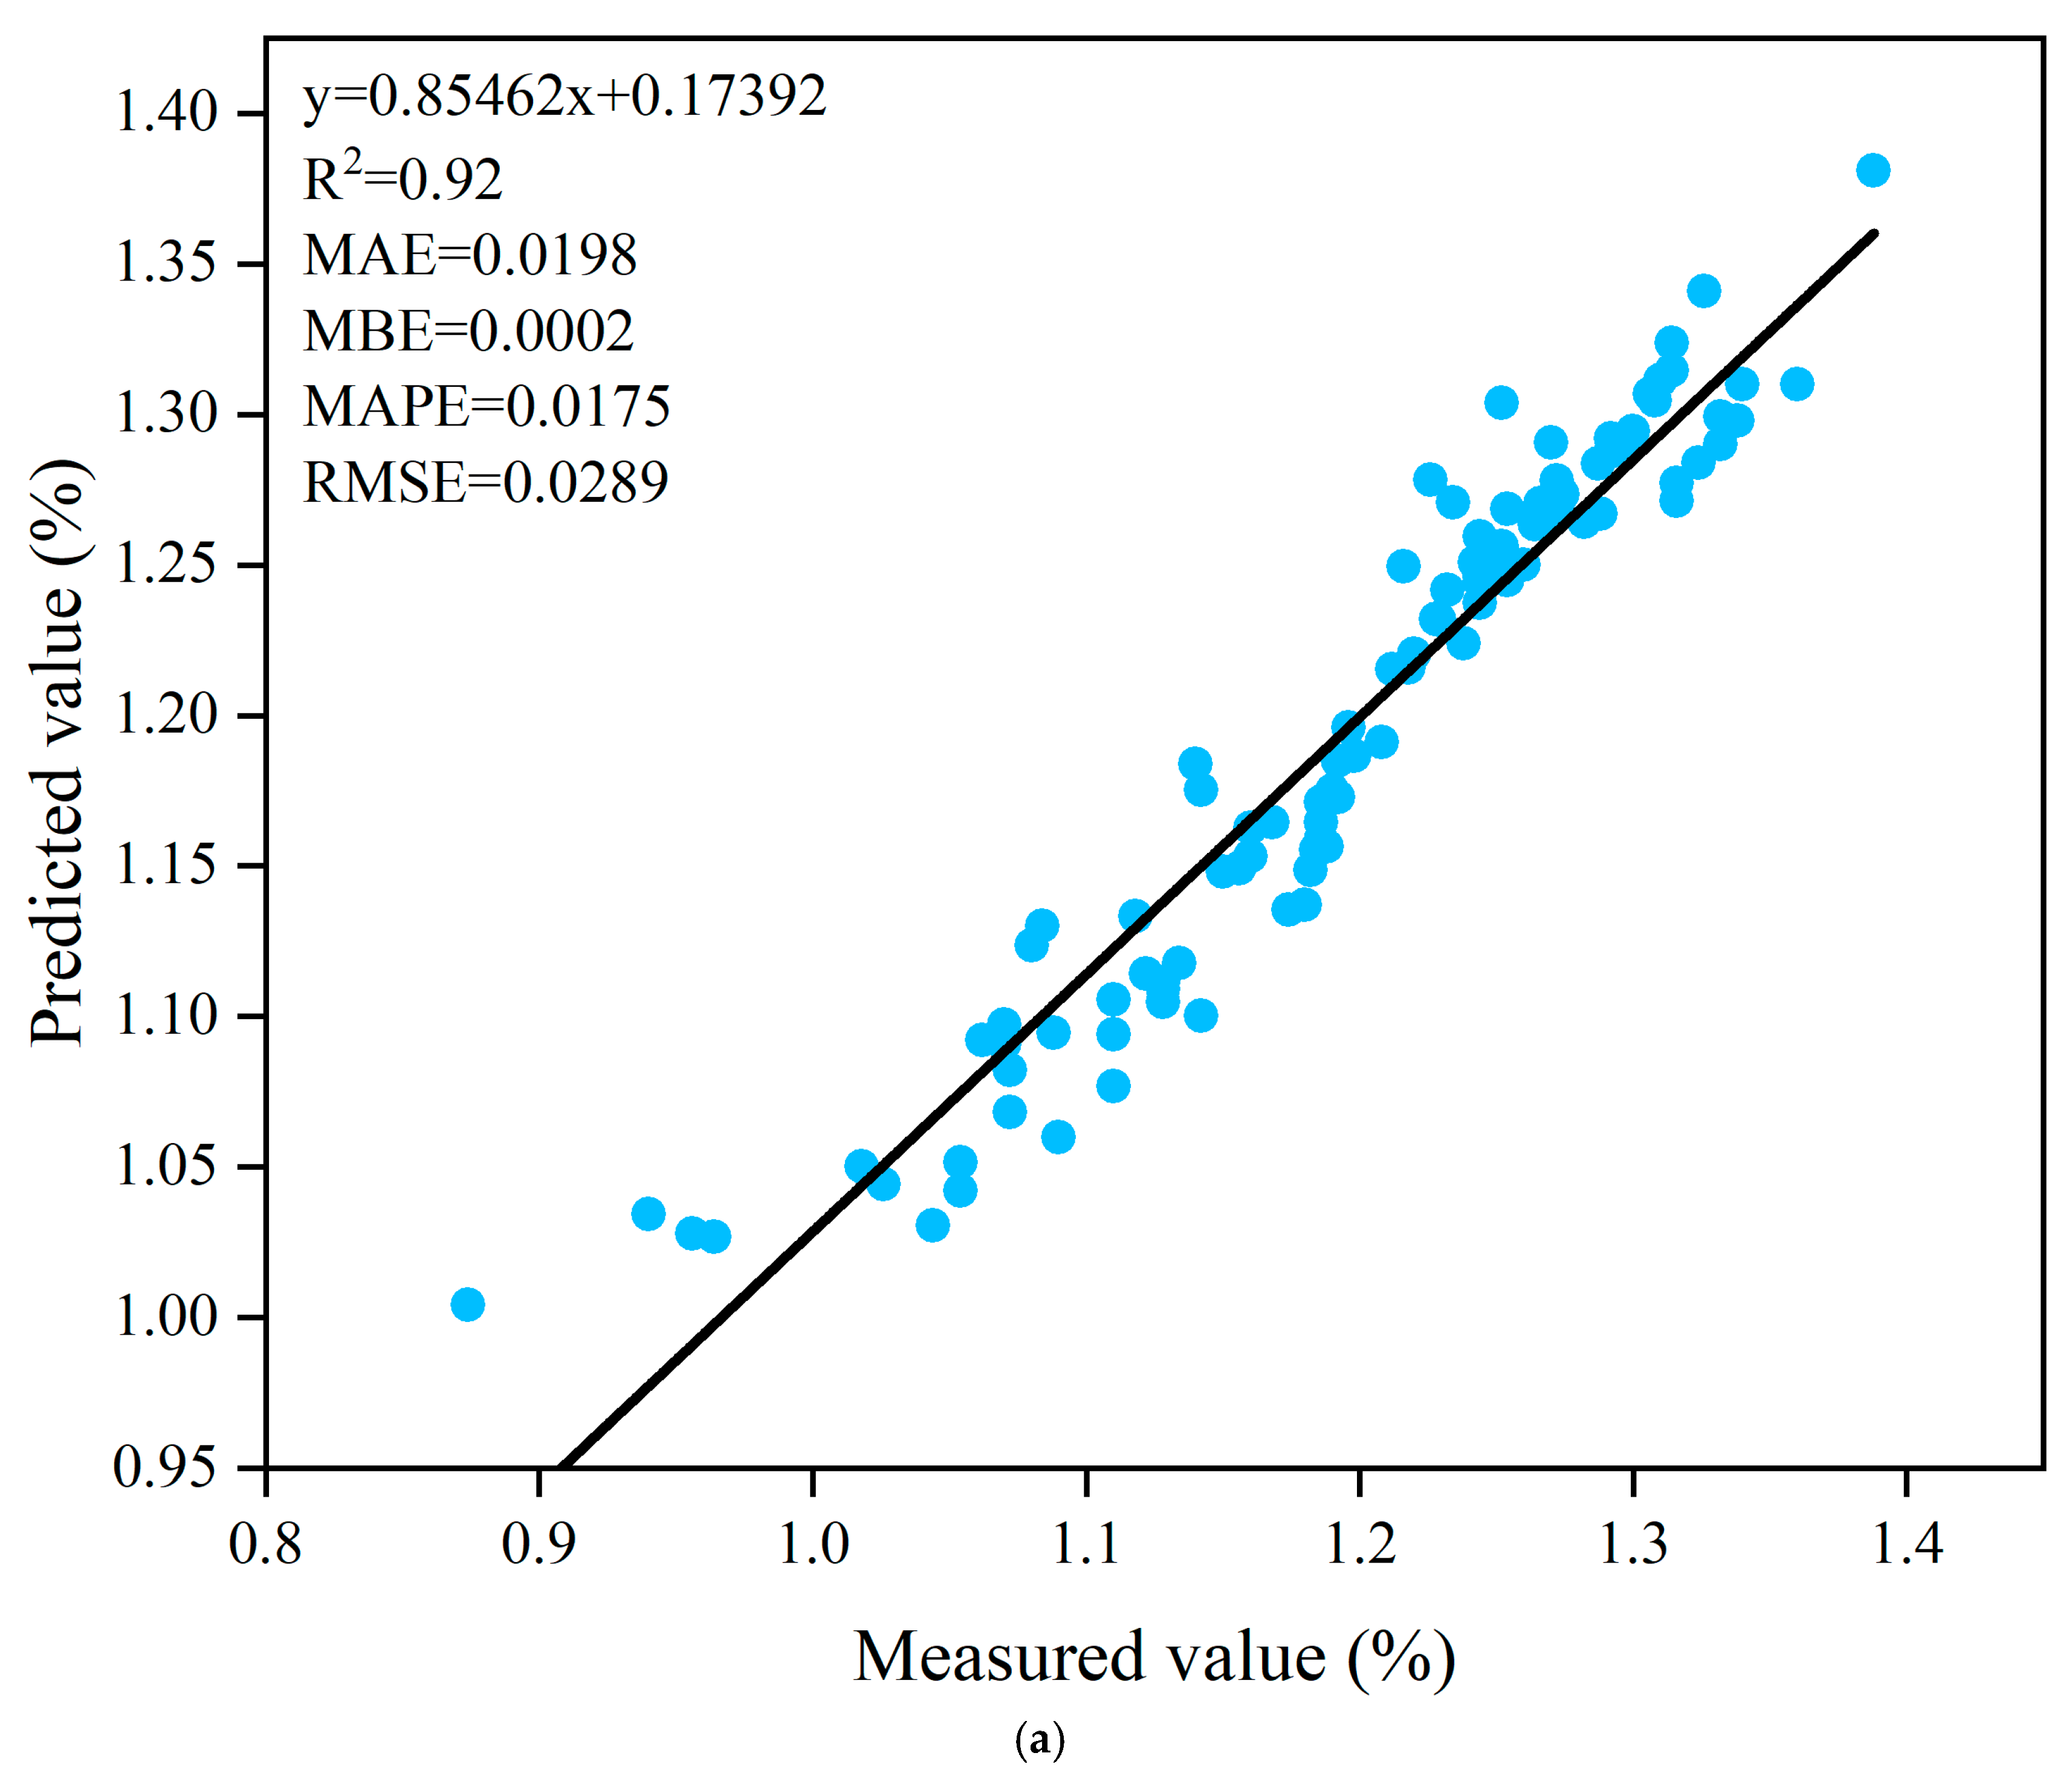
3.6. Prediction of Fruit Peel Thickness Based on ANN Algorithm

In the research on the prediction of the fruit peel thickness of Korla fragrant pears, we selected various indicators that were carefully screened out in the previous stage (A3, A16, A17, A18, A19, A33, A35, A38, A48) as input variables to construct an artificial neural network (ANN) model for conducting relevant prediction work.
After model training and analysis, the results are presented in Table 3. It can be seen that the artificial neural network model equipped with the Trainlm training function demonstrates the best performance. Specifically, for the artificial neural network models using Tansig-purelin and logsig-purelin as transfer functions, their determination coefficients (R2) in the training set stage all exceeded 0.90, indicating that, during the training process, the model had a high degree of fitting to the sample data and could better capture the intrinsic relationship between the input variables and the fruit peel thickness.
However, when further examining the performance of each model in the validation set, the differences become apparent. The performance of the artificial neural network model using logsig-purelin as the transfer function is relatively poor. Compared with the model using Tansig-purelin as the transfer function, the difference in its determination coefficient (R2) reached 0.06. This gap reflects that the Tansig-purelin transfer function model has stronger generalization ability and higher prediction accuracy for actual situations when faced with new data (validation set data). (All model results can be found in Table S2 of the Supplementary Materials).
From the perspective of all performance indicators, the Tansig-purelin transfer function model stands out among all the ANN models constructed, demonstrating the most outstanding performance. In terms of the training set, the model’s mean bias error (MBE) is as low as 0.0002, and the root mean square error (RMSE) is only 0.0289. These two indicators are at the lowest level among all models, fully demonstrating its high precision and low error characteristics in fitting sample data during the training stage. At the same time, its mean absolute error (MAE) is 0.0198, and its mean absolute percentage error (MAPE) is 0.0175. Compared with the ANN model using logsig-purelin transfer function, there is almost no significant difference, further indicating the stability and reliability of this model during the training process.
In the validation set stage, the R2 coefficient of the Tansig-purelin transfer function model reaches 0.90, which is the highest among all models’ validations. This means that the model can still maintain good prediction accuracy when faced with new data, effectively avoiding the occurrence of overfitting. In addition, its mean absolute error (MAE) is 0.0238, the mean bias error (MBE) is 0.0042, the mean absolute percentage error (MAPE) is 0.0213, and the root mean square error (RMSE) is 0.0363. These indicators are the minimum values among all models in the validation set, further strongly proving the high accuracy and stability of this model in practical prediction applications. The neural network structure of this model is 9-9-1. This structure shows good adaptability to data features and prediction targets throughout the prediction process, laying the foundation for the excellent performance of this model.
In order to comprehensively and deeply assess the stability of this ANN model, we conducted a detailed comparative analysis of the predicted peel thickness values and the measured ones during the training and validation stages. The results showed that the predicted peel thickness values were highly consistent with the measured values in the scatter plot in terms of distribution patterns (see Figure 8a,b), and all the predicted values presented significant consistency with the measured values in terms of changing trends (as shown in Figure 8c). The results indicate that this ANN model is reliable and effective in predicting the peel thickness of Korla fragrant pears.

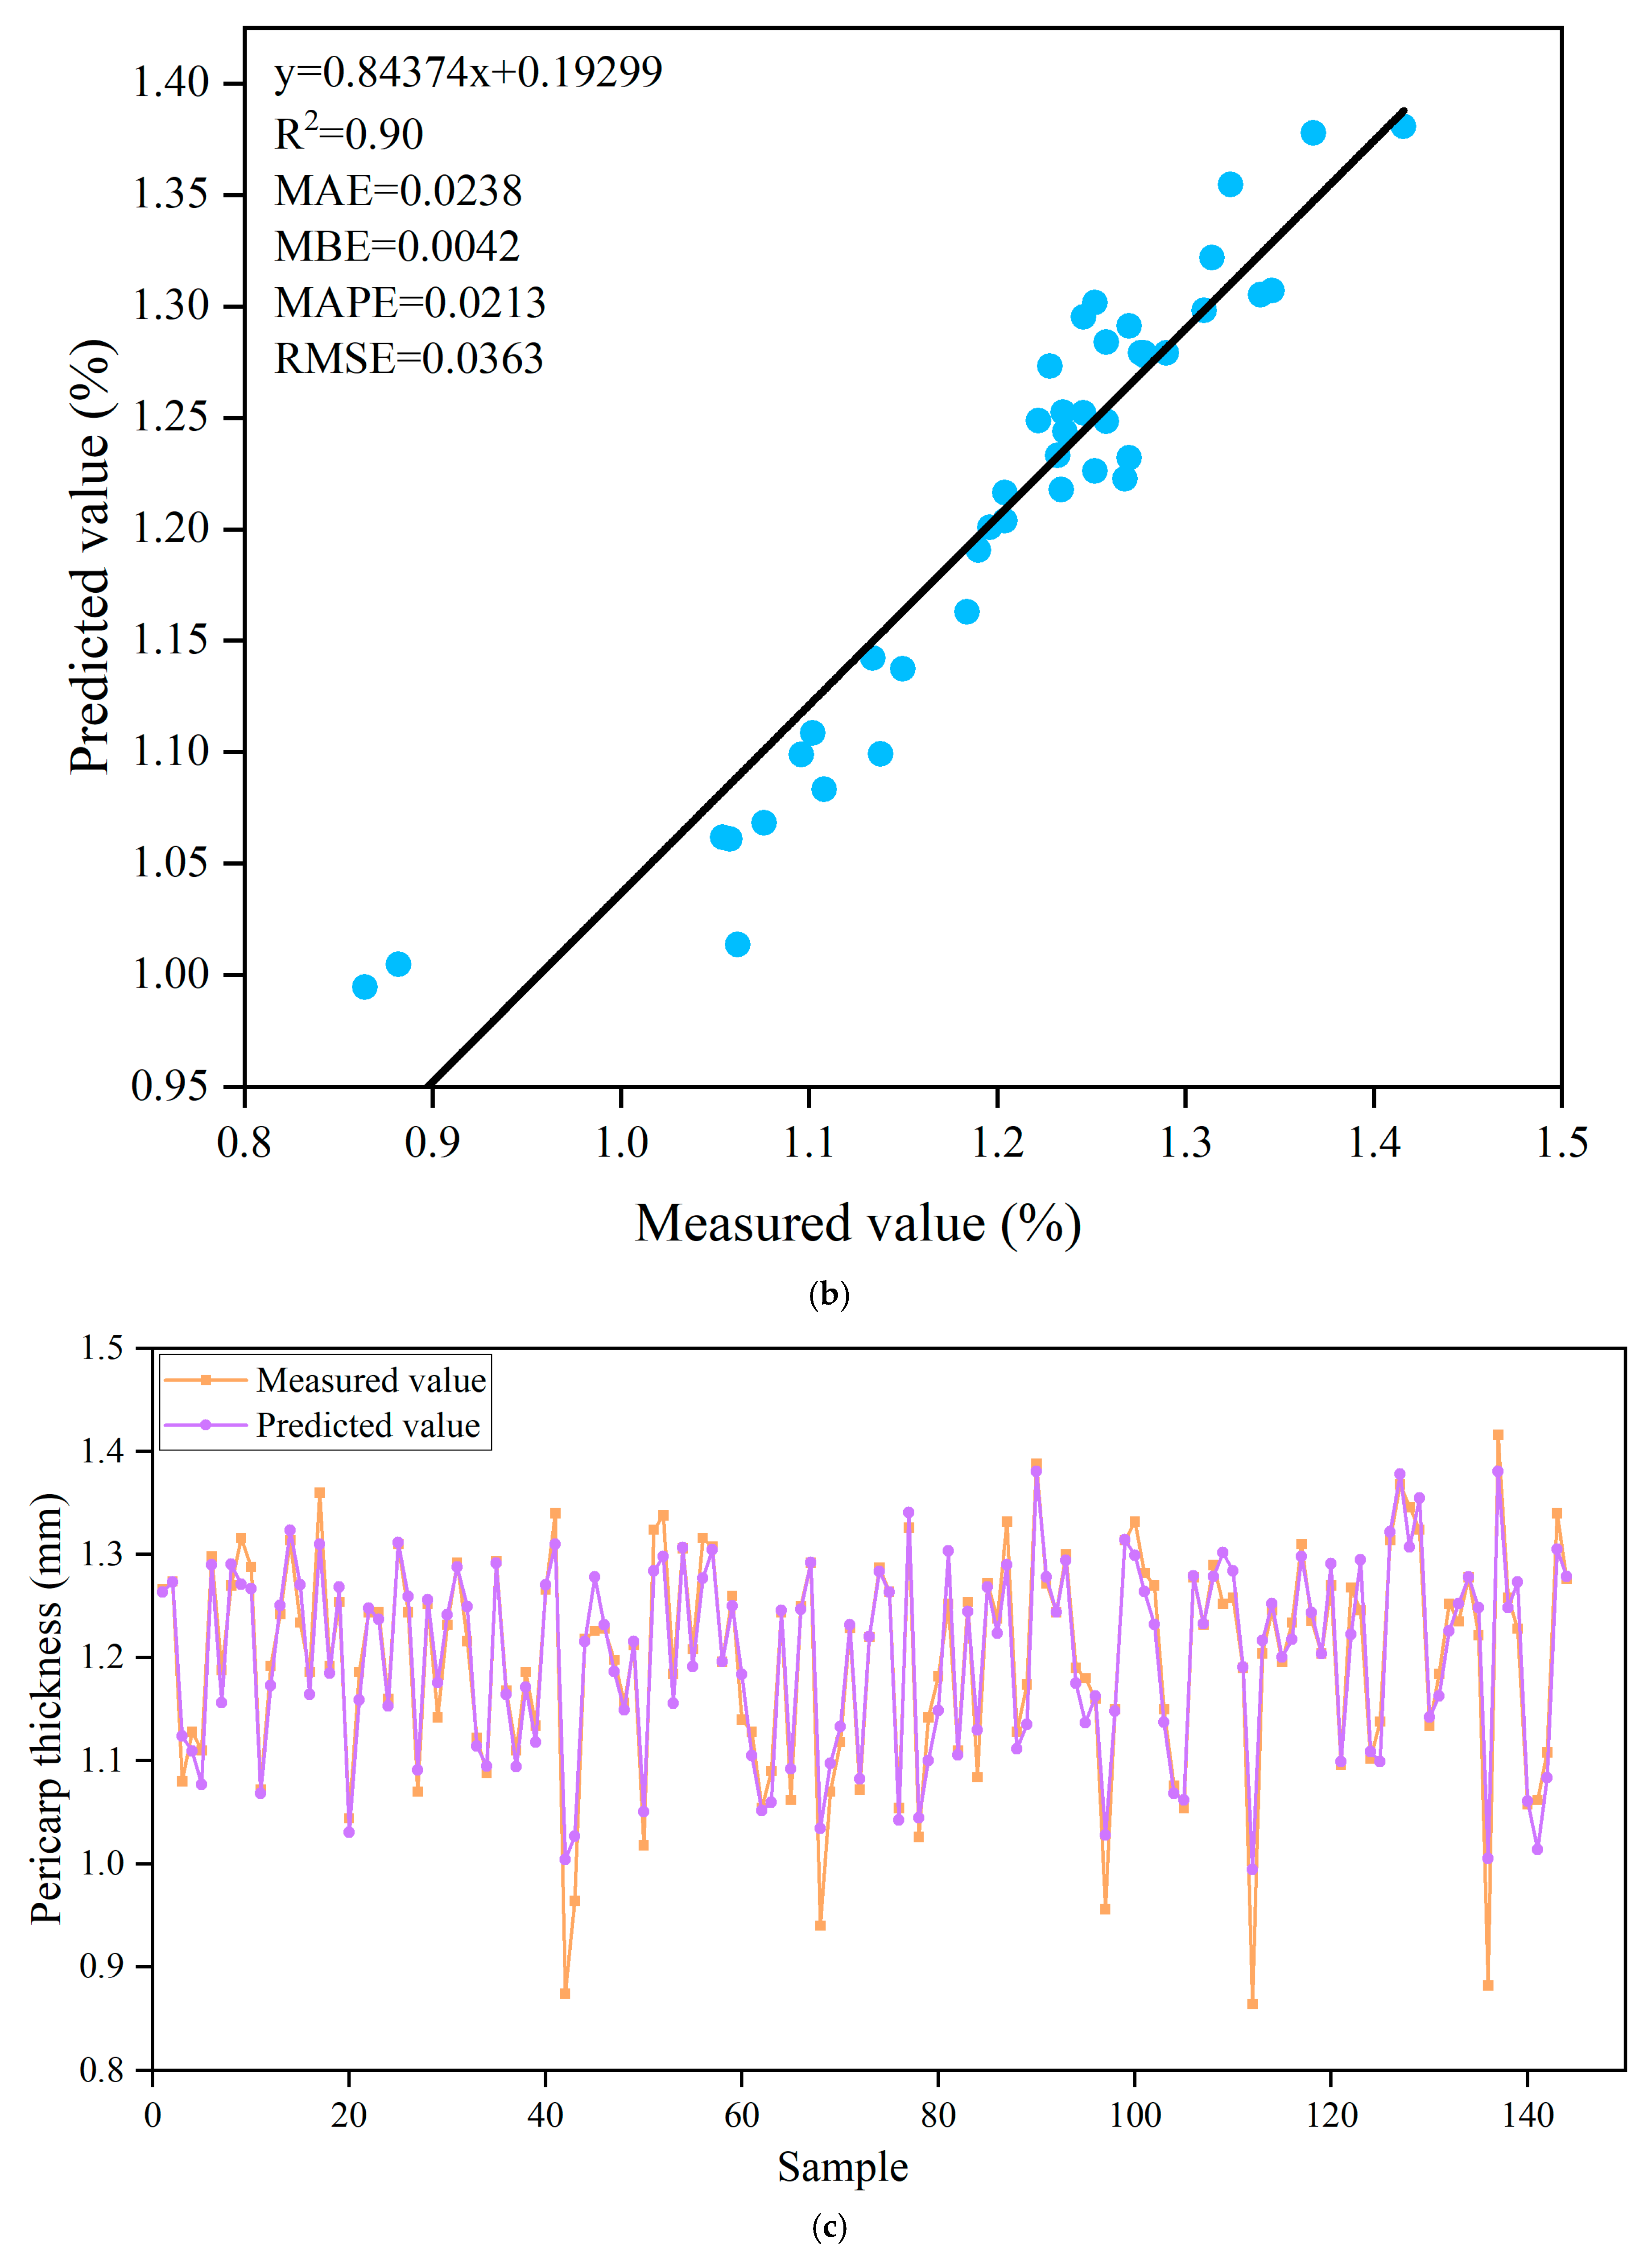
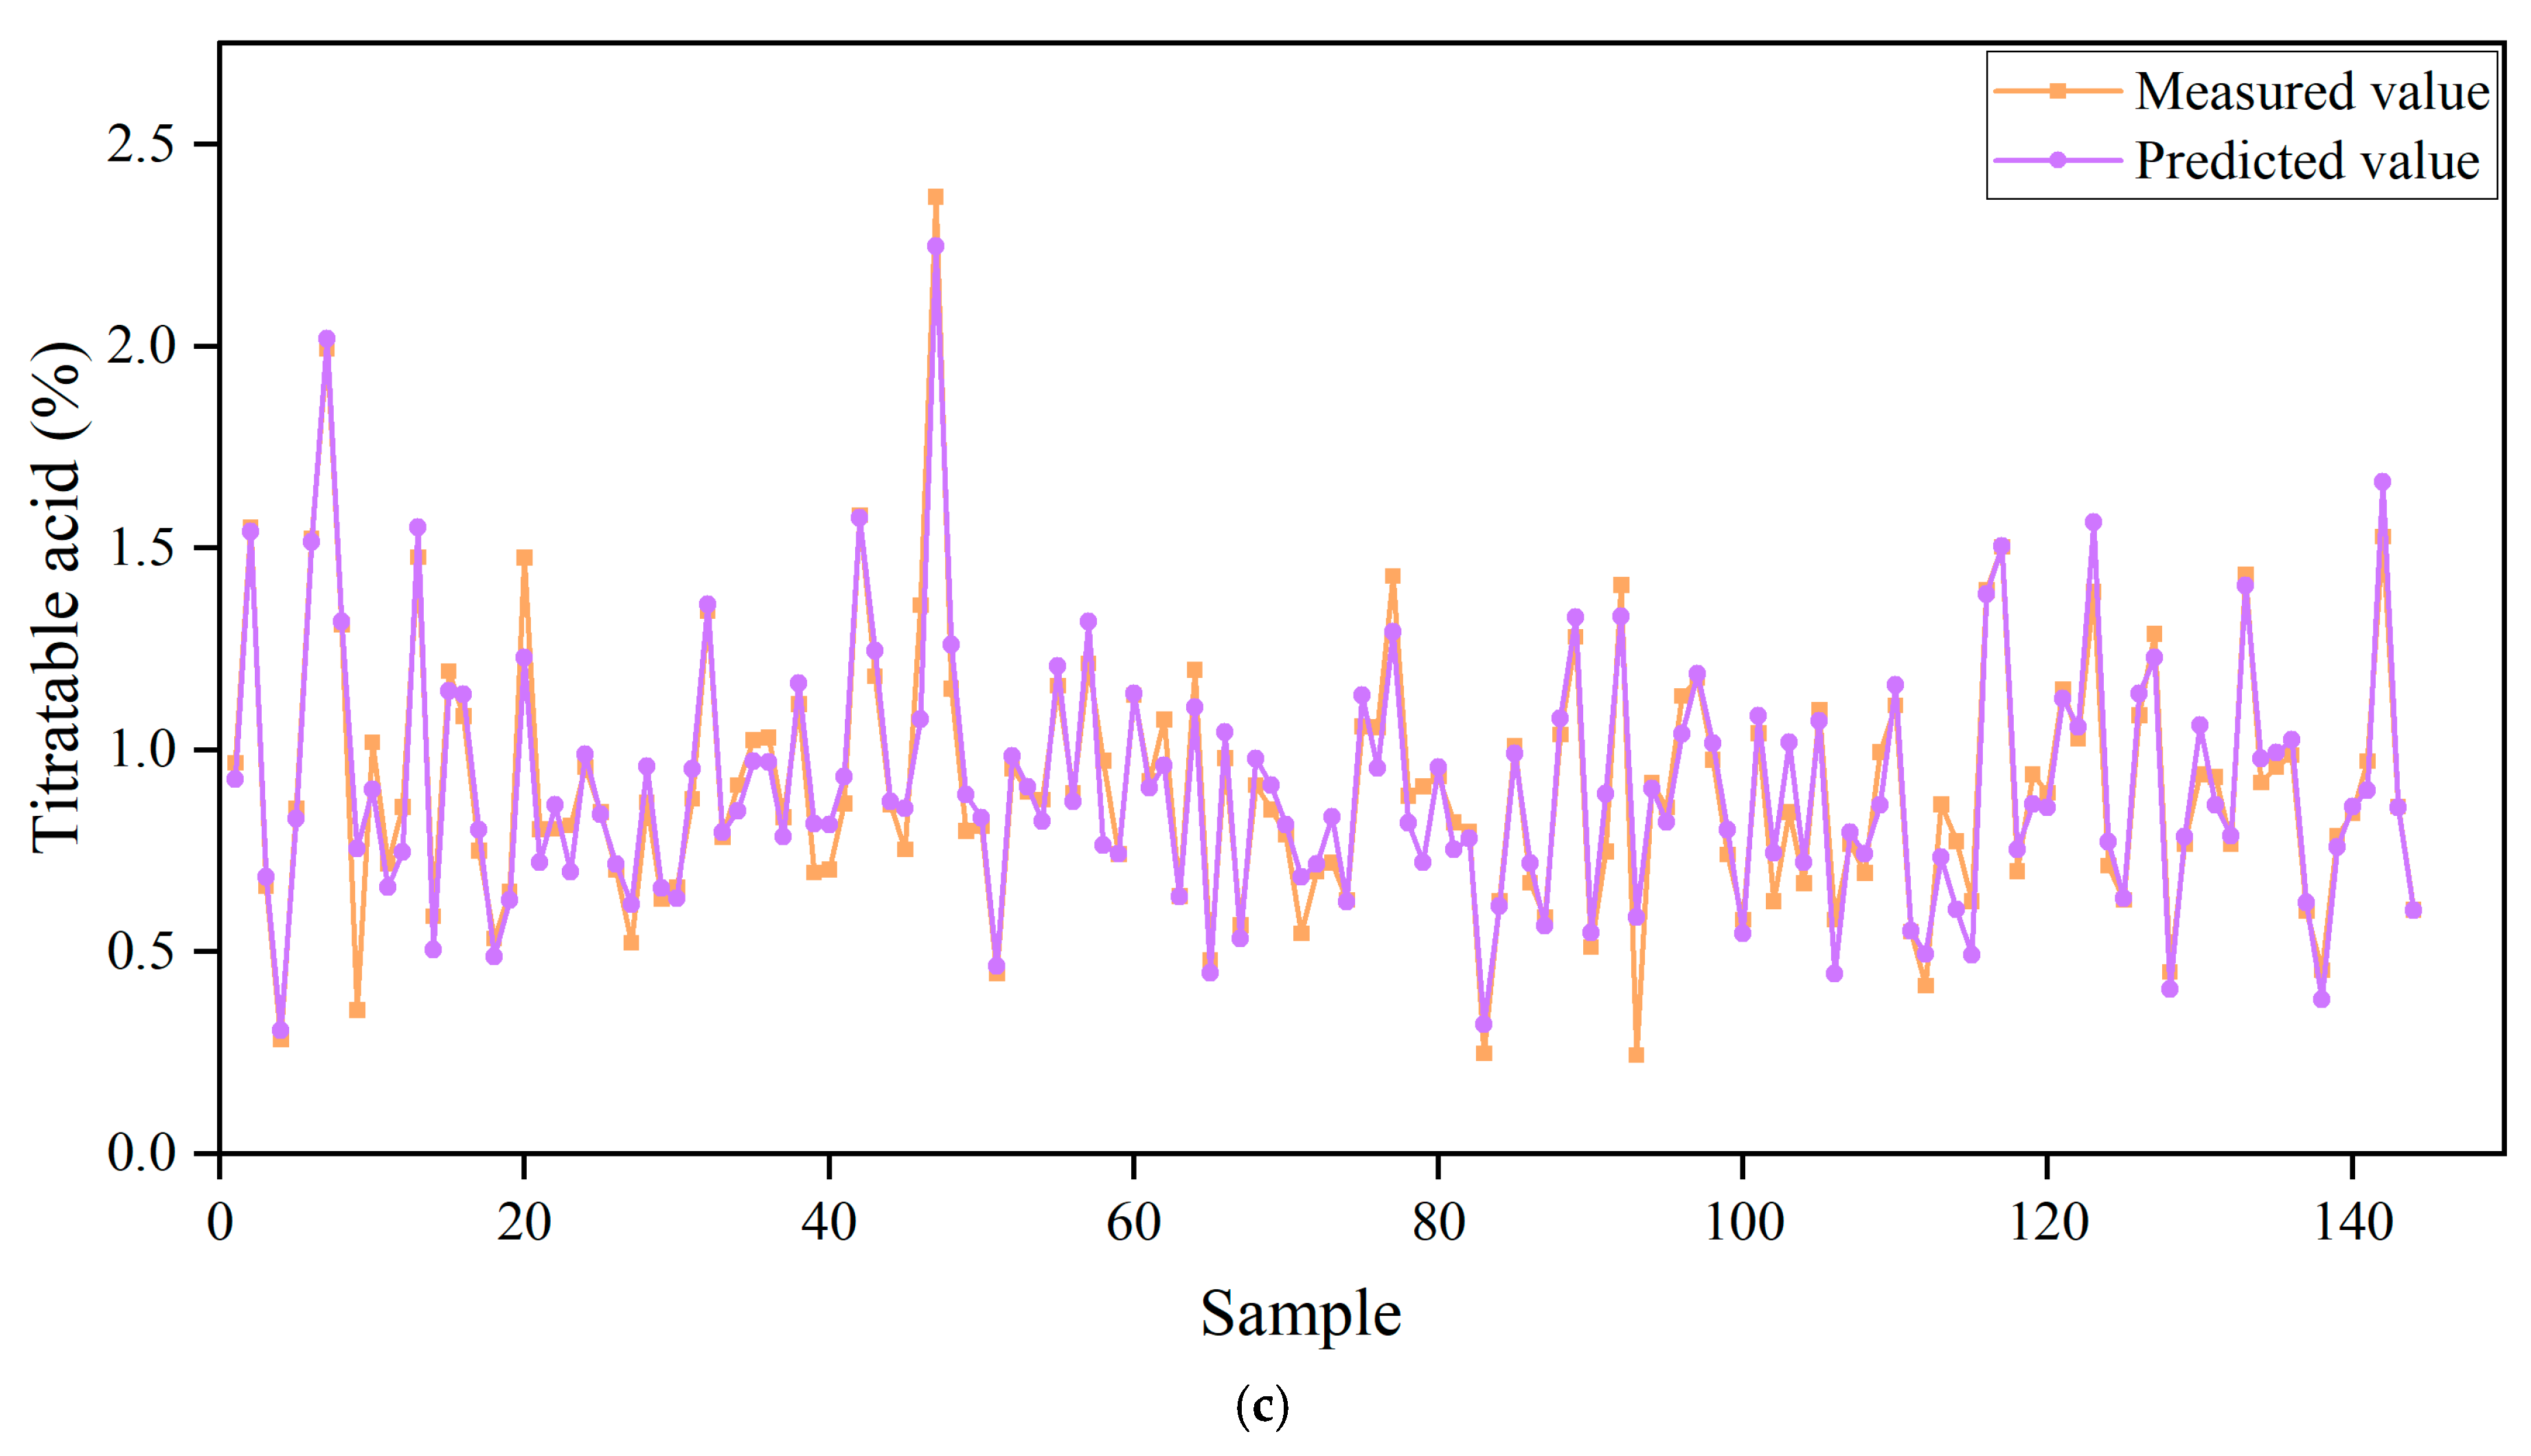
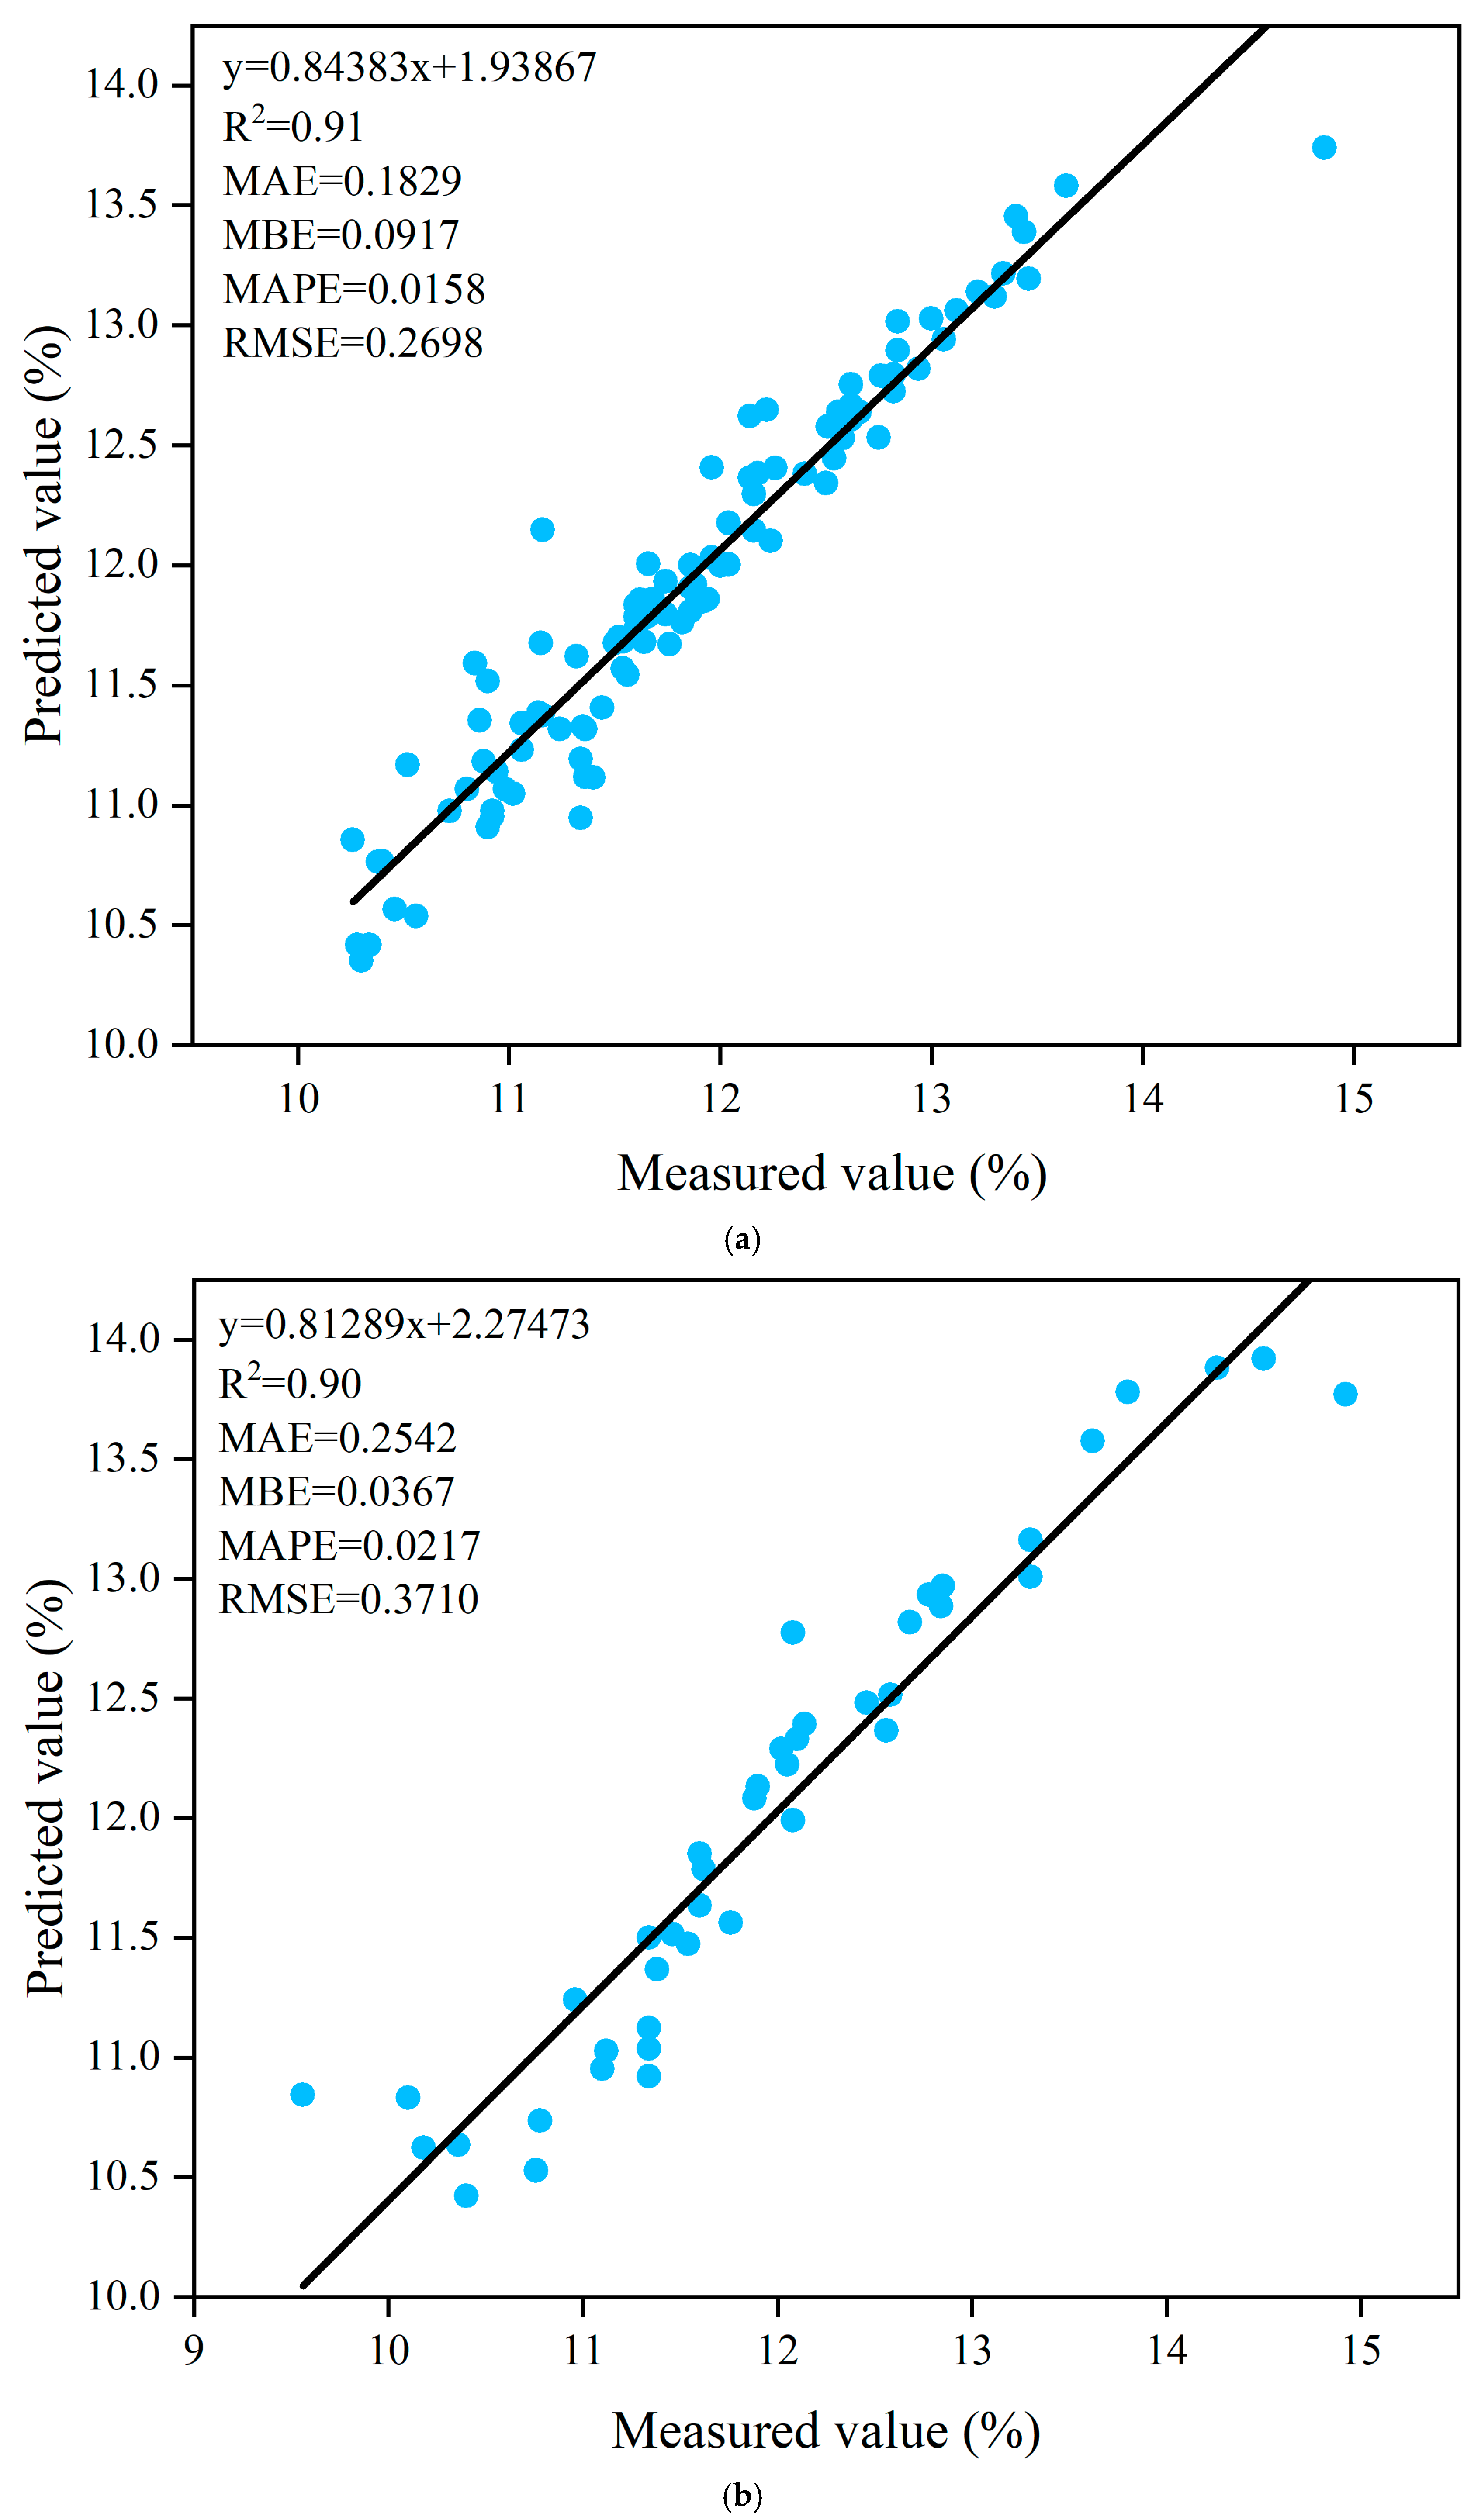
3.7. Prediction of Titratable Acids Based on ANN Algorithm

Similarly, in the prediction study for the titratable acid content of the Korla fragrant pears, we selected specific indicators (A3, A8, A9, A10, A11, A12, A27, A36) as input variables to construct an artificial neural network (ANN) model for the relevant prediction work.
After rigorous model training and analysis, the results are presented in Table 4. The analysis results show that the artificial neural network model equipped with the Trainlm training function and the Tansig-purelin transfer function demonstrates higher accuracy in predicting the titratable acid content of Korla fragrant pears. Specifically, the corresponding determination coefficient (R2) of this model in the training set and validation set stages both reached 0.92. Compared with other constructed artificial neural network (ANN) models, this value has a significant advantage and fully demonstrates its outstanding ability in fitting data and accurately predicting unknown data. (All model results can be found in Table S3 of the Supplementary Materials).
To more comprehensively and deeply evaluate the stability of this ANN model, we further carried out detailed comparative analysis work, specifically comparing the predicted values and measured values of individual titratable acids during the training stage and testing stage (see Figure 9a,b).
Through comparative analysis, it was found that the predicted titratable acid content values obtained from the model exhibited a high degree of consistency in the distribution pattern with the measured titratable acid content values in the scatter plot. The similarity between the two was extremely high, and it could well reflect the consistency of the model’s prediction results and the actual measurement results in terms of data distribution characteristics. Moreover, from the overall trend, all the predicted titratable acid content values and the actual measured titratable acid content values showed a similar changing trend (as shown in Figure 9c), which means that this model can stably and accurately capture the changing patterns of titratable acid content under different sample data and different stages, effectively avoiding prediction deviation problems caused by data fluctuations or the model’s own limitations. The results indicate that this ANN model is reliable and effective in predicting the titratable acid content of Korla fragrant pears.

3.8. Prediction of Soluble Solid Content Based on ANN Algorithm

Similarly, in the research on predicting the soluble solids content of Korla fragrant pears, we selected mineral nutrition elements (A8, A17, A18, A21, A33, A35, A38, A39) as input variables and used the artificial neural network (ANN) model to conduct the corresponding predictive analysis. (All model results can be found in Table S4 of the Supplementary Materials).
After systematic model training and analysis, the results are presented in Table 5. The results clearly show that the artificial neural network model equipped with the Trainlm training function demonstrates a more outstanding accuracy rate in predicting the soluble solids content of Korla fragrant pears. Specifically, the model can reach a determination coefficient (R2) of 0.91 in the training set and 0.90 in the validation set, which is significantly superior to other ANN models using the Traingd and Traingdm training functions. This advantage fully demonstrates the excellent ability of the Trainlm training function in exploring the intrinsic relationship between the input variables and the soluble solids content of Korla fragrant pears, fitting the data, and making precise predictions for unknown data.
Further examination of all the ANN models constructed reveals that the ANN model equipped with the Trainlm training function and the Tansig-purelin transfer function exhibits the best performance. In the validation set stage, this model has several outstanding performance R2 indicators, including an average absolute error (MAE) as low as 0.2542, an average deviation error (MBE) of 0.0367, an average absolute percentage error (MAPE) reaching 0.217, a root mean square error (RMSE) of only 0.3710, and the highest coefficient of determination (R2) of 0.90. Moreover, in the training set stage, the coefficient of determination of this model also reaches 0.91. These series of indicators strongly prove that this model can maintain high accuracy and stability both in the learning fitting of training samples and in the prediction application of new samples (validation set). In addition, the neural network structure of this model is 8–9–1, which shows good adaptability between the input variables and the prediction target, laying a solid foundation for the excellent performance of the model.
To comprehensively and deeply evaluate the stability of this ANN model, we conducted a detailed comparative analysis of the predicted values and actual measured values of the soluble solids content for individual fruits during the training stage and the testing stage (see Figure 10a,b).
Through comparative analysis, it is found that the predicted values of soluble solids content obtained from the model are highly consistent with the measured values of the soluble solids content in the scatter plot in terms of distribution patterns. There is a strong similarity between the two, which can precisely reflect the consistency of the data distribution characteristics between the model’s predicted results and the actual measured results. Moreover, from the overall trend, all the predicted soluble solids content values and the actual measured soluble solids content values show a similar changing trend (as shown in Figure 10c). This means that the model can stably and effectively capture the changing patterns of the soluble solids content under different sample data and different stages, thereby avoiding the prediction deviation problems caused by differences in data characteristics or the limitations of the model itself. The results indicate that this ANN model is reliable and effective in predicting the soluble solids content of Korla fragrant pears.

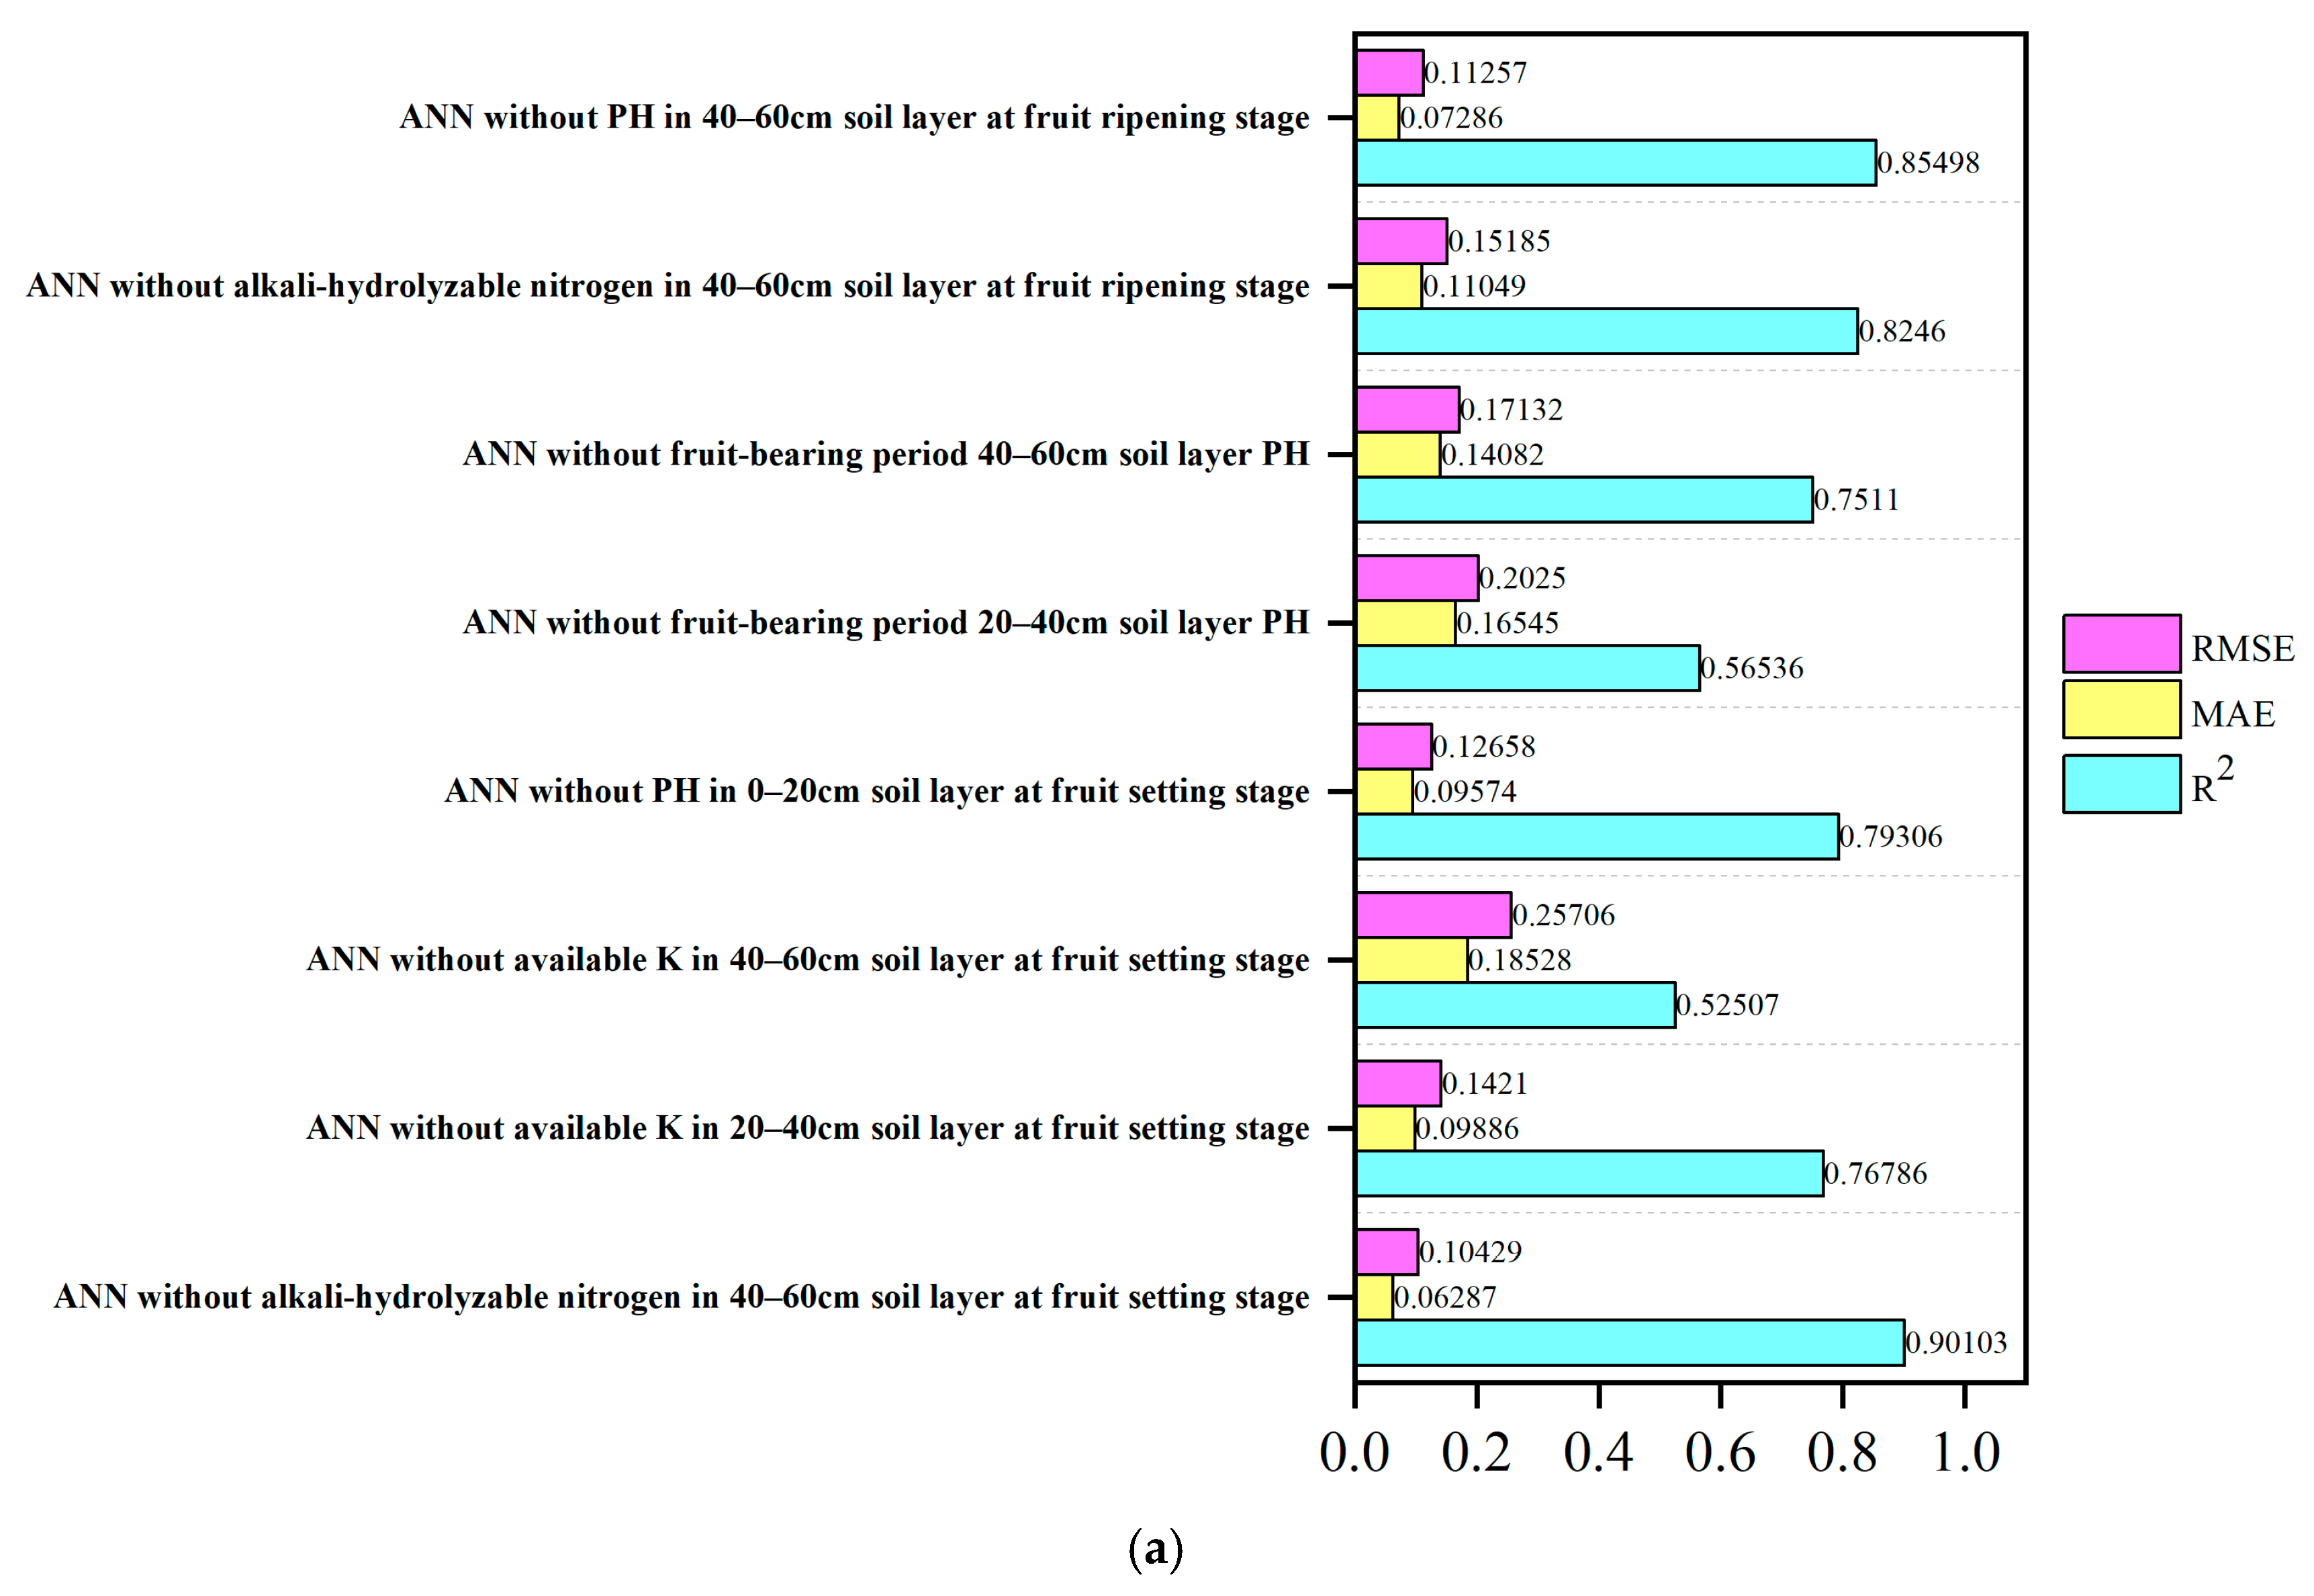
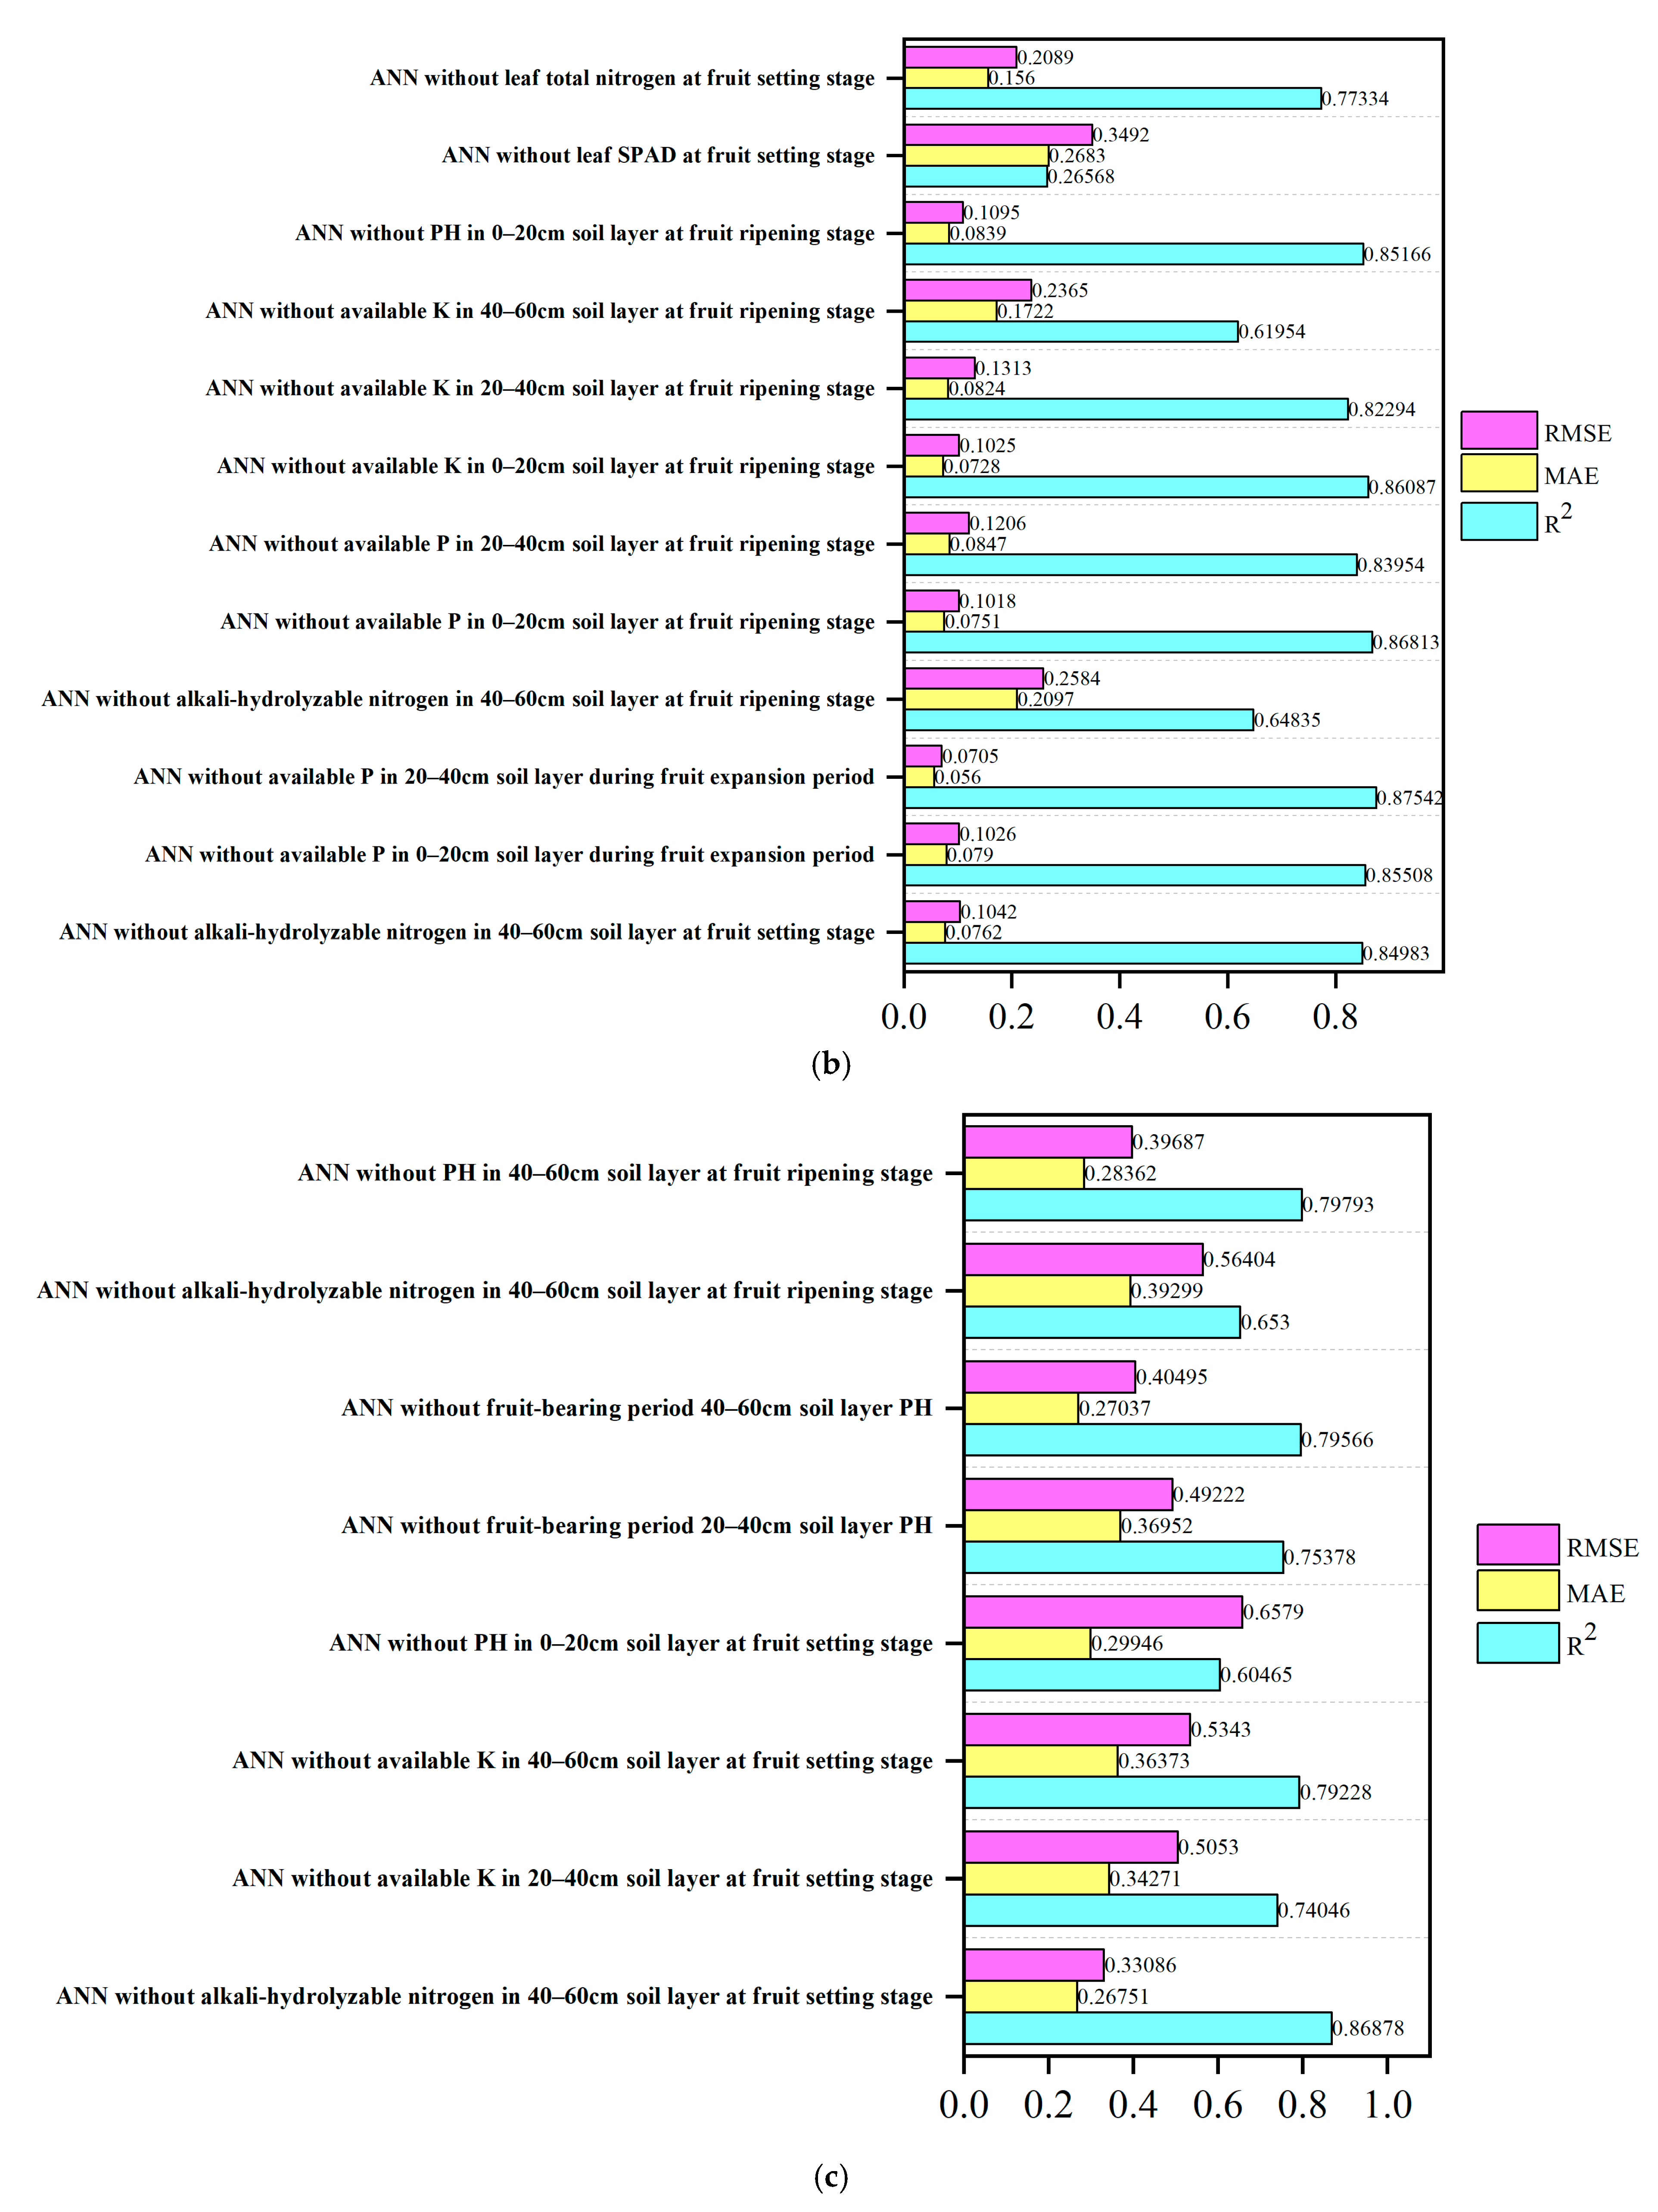
3.9. Desensitization Analysis

Based on the research results presented in the previous text, this study successfully constructed and obtained four artificial neural network (ANN) models with relatively high reliability. By using relevant indicators in the soil and leaves, the study conducted predictive analyses on the fruit shape index, fruit peel thickness, titratable acid content, and soluble solid content of Korla fragrant pear.
To deeply analyze the relative contribution degrees of various soil and leaf indicators to the above key quality indicators of the Korla fragrant pear, this paper further carried out sensitivity analysis. The specific operation method was to eliminate the input variables one by one in the ANN model to deeply explore the changes in model stability. The corresponding analysis results are shown in Figure 10.
In the ANN model for predicting the titratable acid content of Korla fragrant pear (Figure 10a), after comparison, it was found that the model without the input variable of alkali-hydrolyzable nitrogen in the 40–60 cm soil layer during the fruit setting period achieved the lowest values for root mean square error (RMSE) and mean absolute error (MAE), with the specific values being RMSE (0.1043) and MAE (0.0629); while the model without the input variable of available K in the 40–60 cm soil layer during the fruit setting period had the highest RMSE (0.2571) and MAE (0.1853). Under this circumstance, the value of RMSE can be used as an important basis for measuring the contribution degree of nutrient contents in the leaves and soil to the key quality indicators of Korla fragrant pear, that is, the higher the RMSE value, the more crucial the role is that is played by the corresponding specific mineral content in leaves and soil in influencing the titratable acid content of Korla fragrant pear. Comprehensive analysis shows that, in this ANN model, the influence degree of each input variable on the titratable acid content of Korla fragrant pear from high to low is as follows: available K in the 40–60 cm soil layer during the fruit setting period, pH in the 20–40 cm soil layer during the fruit setting period, pH in the 40–60 cm soil layer during the fruit setting period, alkali-hydrolyzable nitrogen in the 40–60 cm soil layer during the fruit ripening period, available K in the 20–40 cm soil layer during the fruit setting period, pH in the 0–20 cm soil layer during the fruit setting period, pH in the 40–60 cm soil layer during the fruit ripening period, and alkali-hydrolyzable nitrogen in the 40–60 cm soil layer during the fruit setting period.
In the prediction model of the fruit shape index of Kuerler Shuangli pear (Figure 10b), the ANN model without the input variable of 20–40 cm soil layer available P during the fruit expansion period shows the lowest RMSE value; conversely, the ANN model without the SPAD of leaves during the fruit setting period has the highest RMSE value. Based on the results of sensitivity analysis, the influence degree of each input variable on the fruit shape index of Kuerler Shuangli pear, from high to low, is as follows: SPAD of leaves during the fruit setting period, available nitrogen in the 40–60 cm soil layer during the fruit ripening period, available K in the 40–60 cm soil layer during the fruit ripening period, total nitrogen of leaves during the fruit setting period, available K in the 20–40 cm soil layer during the fruit ripening period, available P in the 20–40 cm soil layer during the fruit ripening period, pH in the 0–20 cm soil layer during the fruit ripening period, available nitrogen in the 40–60 cm soil layer during the fruit setting period, available P in the 0–20 cm soil layer during the fruit expansion period, available K in the 0–20 cm soil layer during the fruit expansion period, available P in the 0–20 cm soil layer during the fruit expansion period, and available P in the 20–40 cm soil layer during the fruit expansion period.
For the prediction model of the soluble solids content of Korla fragrant pears (Figure 10c), the model that removes the available K in the 40–60 cm soil layer during the fruit expansion period shows the highest RMSE value, while the model that removes the available K in the 20–40 cm soil layer during the fruit setting period has the lowest RMSE value. Through systematic analysis, it can be concluded that, in this ANN model, the influence degree of each input variable on the soluble solids content of Korla fragrant pears from high to low is as follows: available K in the 40–60 cm soil layer during the fruit expansion period, SPAD of leaves during the fruit expansion period, available P in the 40–60 cm soil layer during the fruit expansion period, available P in the 20–40 cm soil layer during the fruit expansion period, available K in the 40–60 cm soil layer during the fruit ripening period, pH of the 20–40 cm soil layer during the fruit ripening period, SPAD of leaves during the fruit ripening period, and available K in the 20–40 cm soil layer during the fruit setting period.
In the prediction model for the thickness of the peel of Korla fragrant pears, the model that removed the soil layer of 0–20 cm during the fruit expansion period for the available P content achieved the highest RMSE value, while the model that removed the available K content in the soil layer of 40–60 cm during the fruit ripening period had the lowest RMSE value. Further analysis revealed that, in this ANN model, the influence degree of each input variable on the peel thickness of Korla fragrant pears, from high to low, was as follows: available P in the soil layer of 0–20 cm during the fruit expansion period, available P in the soil layer of 20–40 cm during the fruit expansion period, SPAD of leaves during the fruit expansion period, available P in the soil layer of 40–60 cm during the fruit expansion period, total potassium in leaves during the fruit ripening period, pH of the soil layer of 20–40 cm during the fruit ripening period, available K in the soil layer of 40–60 cm during the fruit expansion period, and available K in the soil layer of 0–20 cm during the fruit expansion period.
In conclusion, through the above sensitivity analysis, the relative importance of different soil and leaf indicators in influencing the various quality indicators of the Korla fragrant pear in each ANN model was clearly revealed. This provides a solid theoretical basis and data support for further in-depth exploration of the key influencing factors during the growth and development process of Korla fragrant pear and the precise regulation of its quality.
Based on the research results presented in the previous text, this study successfully constructed and obtained four artificial neural network (ANN) models with relatively high reliability. By using relevant indicators in soil and leaves, the study conducted predictive analyses on the fruit shape index, fruit peel thickness, titratable acid content, and soluble solid content of the Korla fragrant pear.
To deeply analyze the relative contribution degree of various indicators in the soil and leaves to the above key quality indicators of Korla fragrant pear, this paper further carried out sensitivity analysis. The specific operation method was to remove the input variables one by one in the ANN model to deeply explore the changes in model stability. The corresponding analysis results are shown in Figure 11.
In the ANN model for predicting the titratable acid of the Korla fragrant pear (Figure 11a), it was found through comparison that the model without the input variable of alkali-hydrolyzable nitrogen in the 40–60 cm soil layer during the fruit setting period had the lowest root mean square error (RMSE) and mean absolute error (MAE), with specific values of 0.1043 (RMSE) and 0.0629 (MAE), while the model without the input variable of available K in the 40–60 cm soil layer during the fruit setting period had the highest RMSE (0.2571) and MAE (0.1853). In this context, the size of the RMSE can be used as an important basis to measure the contribution degree of nutrient contents in leaves and soil to the key quality indicators of Korla fragrant pear, that is, the higher the RMSE value, the more crucial the role played by the corresponding specific mineral content in leaves and soil is in influencing the titratable acid content of Korla fragrant pear. Comprehensive analysis shows that, in this ANN model, the influence degree of each input variable on the titratable acid content of the Korla fragrant pear from high to low is given as follows: available K in the 40–60 cm soil layer during the fruit setting period, pH in the 20–40 cm soil layer during the fruit setting period, pH in the 40–60 cm soil layer during the fruit setting period, alkali-hydrolyzable nitrogen in the 40–60 cm soil layer during fruit ripening, available K in the 20–40 cm soil layer during the fruit setting period, pH in the 0–20 cm soil layer during the fruit setting period, pH in the 40–60 cm soil layer during fruit ripening, and alkali-hydrolyzable nitrogen in the 40–60 cm soil layer during the fruit setting period.
In the prediction model of the fruit shape index of the Korla fragrant pear (Figure 11b), the ANN model without the input variable of 20–40 cm soil layer available P during the fruit expansion period shows the lowest RMSE value; conversely, the ANN model without the SPAD of leaves during the fruit setting period corresponds to the highest RMSE value. Based on the sensitivity analysis results, the influence degree of each input variable on the fruit shape index of Korla fragrant pear from high to low is given as follows: SPAD of leaves during the fruit setting period, available nitrogen of 40–60 cm soil layer during the fruit ripening period, available K of 40–60 cm soil layer during the fruit ripening period, total nitrogen of leaves during the fruit setting period, available K of 20–40 cm soil layer during the fruit ripening period, available P of 20–40 cm soil layer during the fruit ripening period, pH of 0–20 cm soil layer during the fruit ripening period, available nitrogen of 40–60 cm soil layer during the fruit expansion period, available P of 0–20 cm soil layer during the fruit expansion period, available K of 20–40 cm soil layer during the fruit ripening period, and available P of 20–40 cm soil layer during the fruit expansion period.
For the prediction model of soluble solids of Korla fragrant pear (Figure 11c), the model without the available K of 40–60 cm soil layer during the fruit expansion period shows the highest RMSE value, while the model without the available K of 20–40 cm soil layer during the fruit setting period has the lowest RMSE value. Through systematic analysis, in this ANN model, the influence degree of each input variable on the soluble solids content of Korla fragrant pear from high to low is given as follows: available K of 40–60 cm soil layer during the fruit expansion period, SPAD of leaves during the fruit expansion period, the available P of 40–60 cm soil layer during the fruit expansion period, available P of 20–40 cm soil layer during the fruit expansion period, available K of 40–60 cm soil layer during the fruit ripening period, pH of 20–40 cm soil layer during the fruit ripening period, SPAD of leaves during the fruit ripening period, and available K of 20–40 cm soil layer during the fruit setting period.
In the prediction model for the thickness of the peel of Korla fragrant pear, the model that removed the soil layer of 0–20 cm from the fruit expansion period for the quick-release P content had the highest RMSE value, while the model that removed the soil layer of 40–60 cm from the fruit ripening period for the quick-release K content had the lowest RMSE value. Further analysis revealed that, in this ANN model, the influence degree of each input variable on the peel thickness of Korla fragrant pear from high to low was as follows: quick-release P content in the soil layer of 0–20 cm during the fruit expansion period, quick-release P content in the soil layer of 20–40 cm during the fruit expansion period, SPAD value of the leaves during the fruit expansion period, quick-release P content in the soil layer of 40–60 cm during the fruit expansion period, total potassium content in the leaves during the fruit ripening period, pH value of the soil layer of 20–40 cm during the fruit ripening period, alkali-hydrolyzable nitrogen content in the soil layer of 40–60 cm during the fruit setting period, quick-release K content in the soil layer of 0–20 cm during the fruit expansion period, and quick-release K content in the soil layer of 40–60 cm during the fruit ripening period.
In conclusion, through the above sensitivity analysis, the relative importances of different soil and leaf indicators in each ANN model on the different quality indicators of Korla fragrant pear are clearly revealed, providing a solid theoretical basis and data support for further in-depth exploration of the key influencing factors in the growth and development process of the Korla fragrant pear and the precise regulation of its quality.

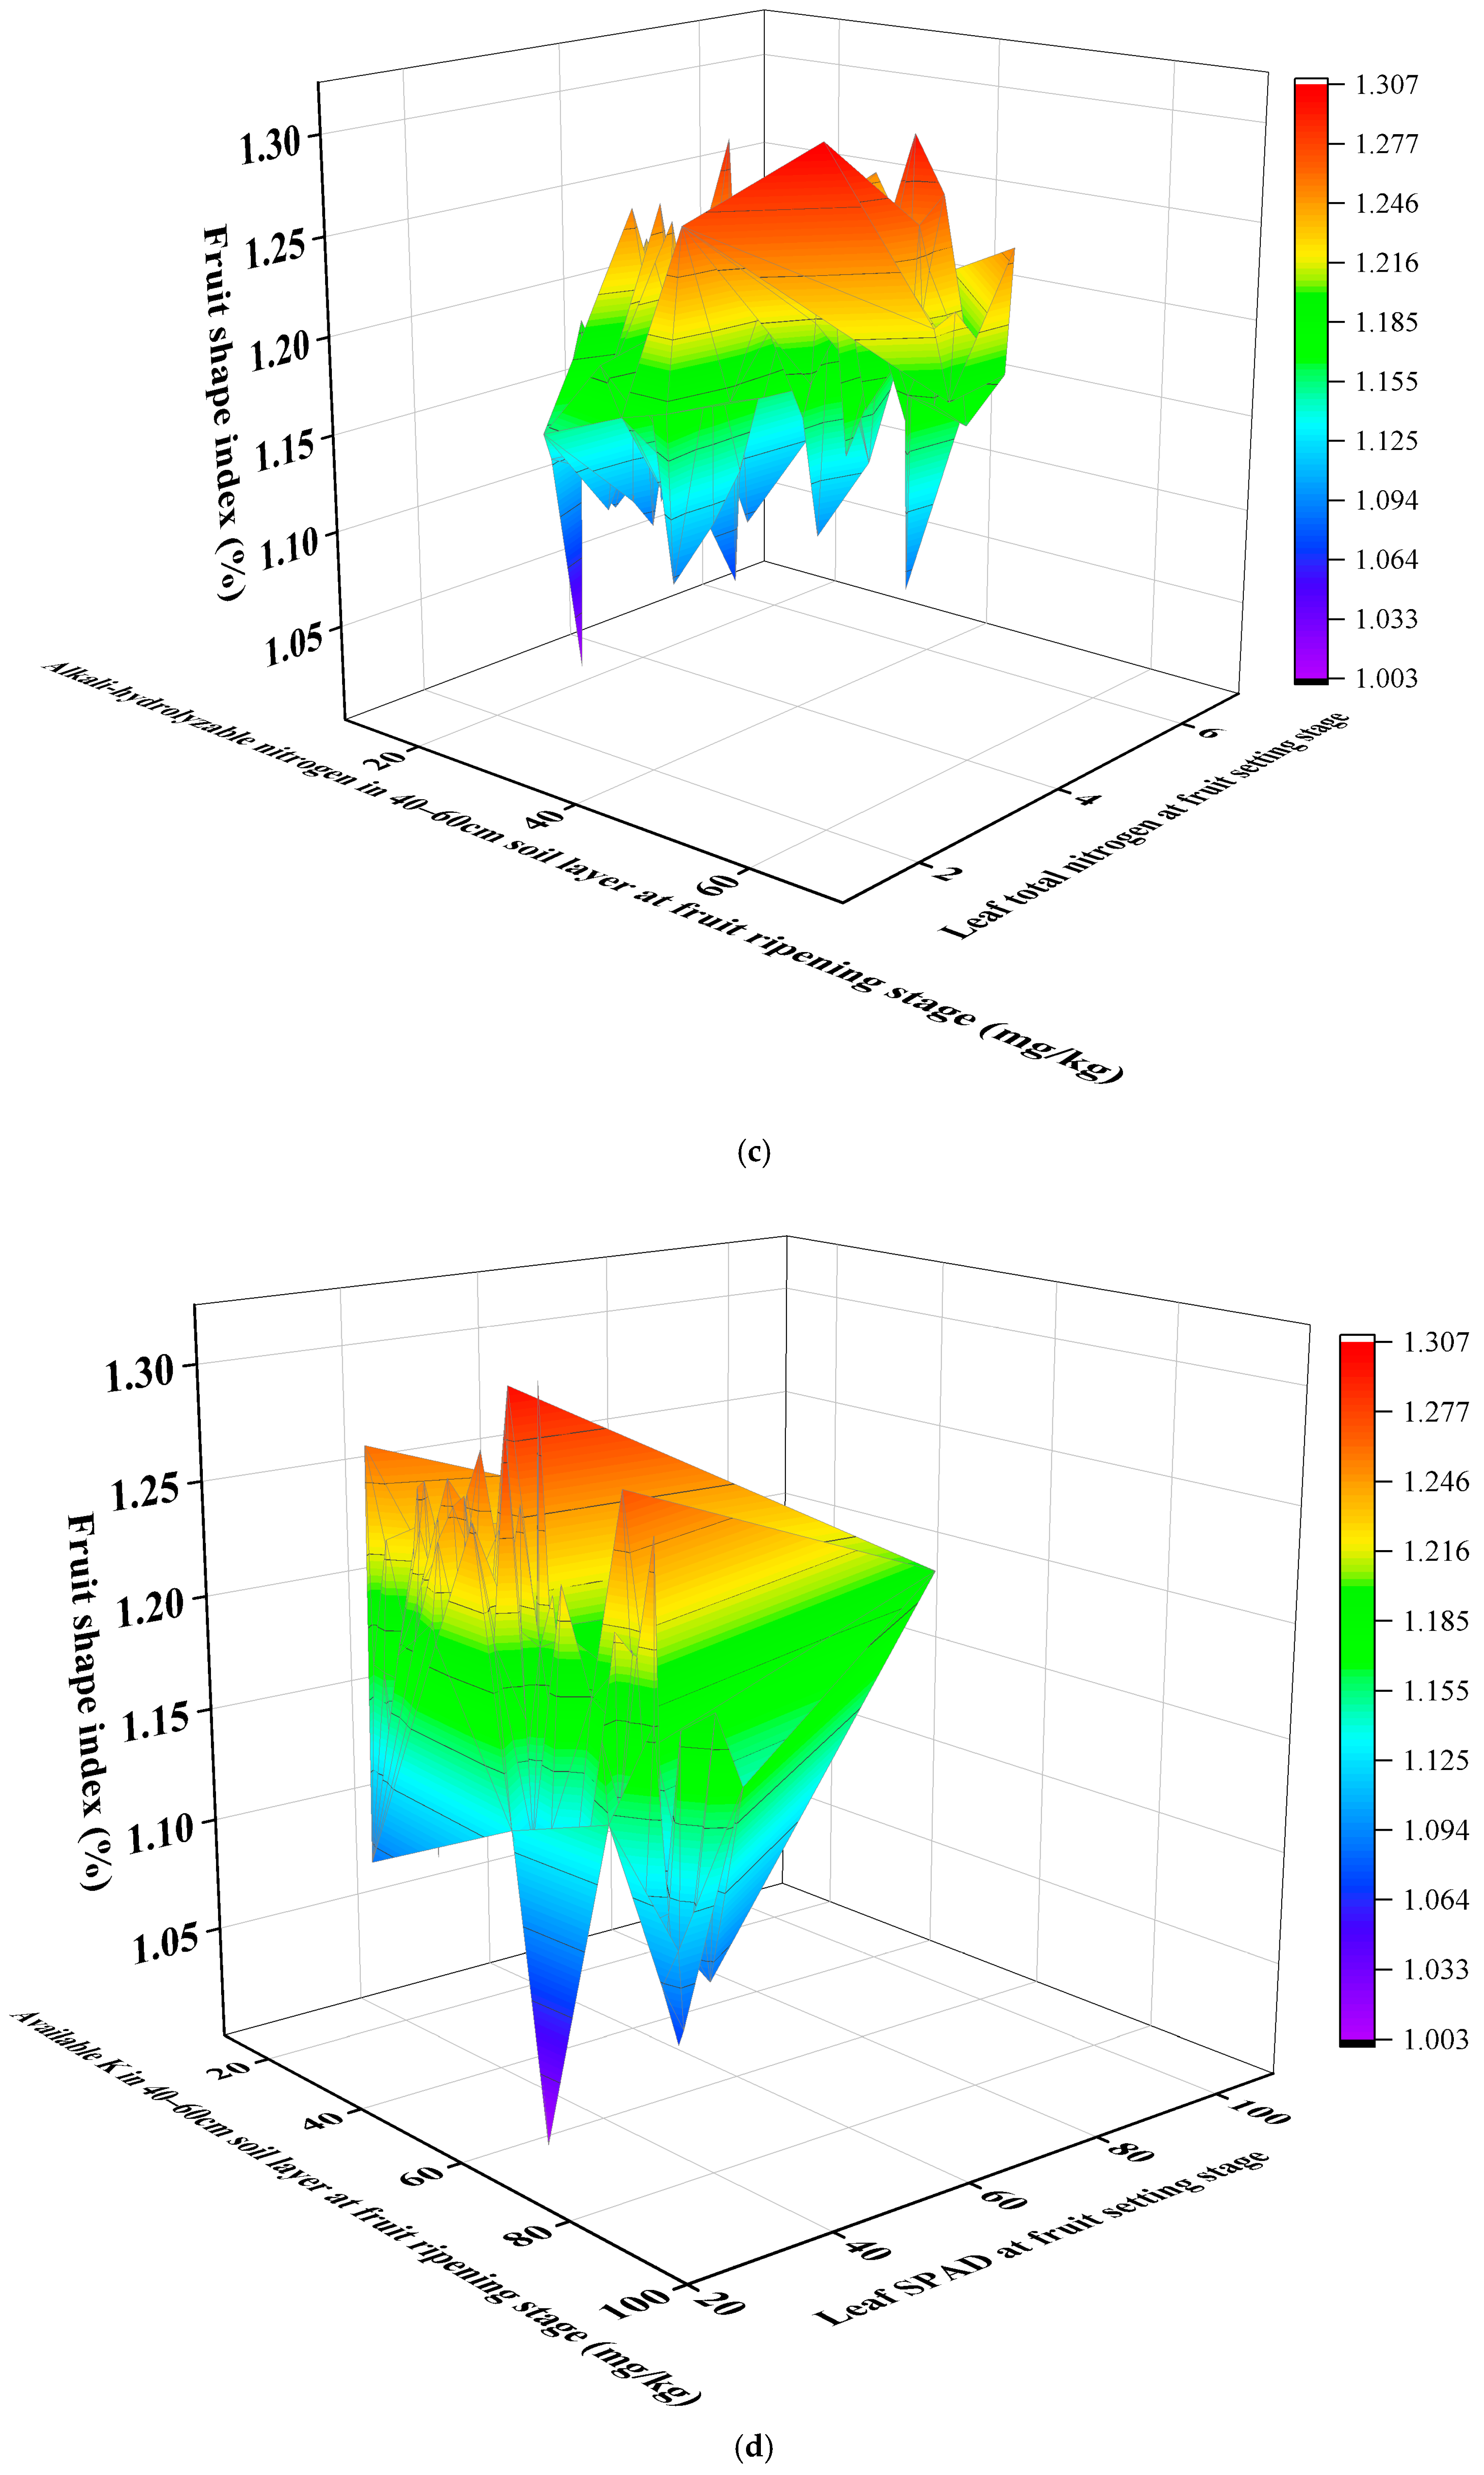
3.10. Response Surface Methodology Analysis

Based on the sensitivity analysis results of the above artificial neural network (ANN) model, it is known that the contents of some mineral elements in the soil have significant impacts on the fruit quality of Korla fragrant pear. In order to explore these influencing factors more deeply and precisely, this study further carried out response surface analysis, aiming to reveal the specific influence patterns of the interaction effects among various factors on different fruit quality indicators.
Regarding the response surface analysis of available potassium in the 40–60 cm soil layer during the fruit setting period and pH and titratable acid in the 20–40 cm soil layer during the fruit setting period (as shown in Figure 12a), it was found that, when the available potassium content in the 40–60 cm soil layer during the fruit setting period was within the range of 30–47 mg/kg, and the pH value in the 20–40 cm soil layer during the fruit setting period was within the range of 7.4–7.8, the fruit could obtain a relatively high titratable acid content. Conversely, when the pH value in the 20–40 cm soil layer during the fruit setting period was less than 7.4, and the available potassium content in the 40–60 cm soil layer during the fruit setting period was less than 30 mg/kg or greater than 47 mg/kg, it was difficult for the fruit to obtain a high titratable acid content if the expectation was to obtain a high titratable acid content. Similarly, for the response surface relationship between pH in the 40–60 cm soil layer during the fruit setting period and alkali-hydrolyzable nitrogen and titratable acid content in the 40–60 cm soil layer during fruit ripening (as shown in Figure 12b), the analysis indicated that, when the pH value in the 40–60 cm soil layer during the fruit setting period was within the range of 7.3–7.7, and the alkali-hydrolyzable nitrogen content in the 40–60 cm soil layer during fruit ripening was within the range of 33.0–53.2 mg/kg, the fruit could present a relatively high titratable acid content.
Regarding the influence of available K in the 40–60 cm soil layer during the fruit ripening period and total nitrogen in the leaves during the fruit setting period on the fruit shape index, the response surface analysis (as shown in Figure 12c) indicates that, when the available K content in the 40–60 cm soil layer during the fruit ripening period is within the range of 40–60 mg/kg and the total nitrogen content in leaves during the fruit setting period is around 2.0–6.5 mg/kg, the fruit can achieve a higher fruit shape index. Furthermore, from the response relationship diagram of alkali-hydrolyzable nitrogen in the 40–60 cm soil layer during the fruit ripening period and SPAD value of leaves during the fruit setting period with the fruit shape index (as shown in Figure 12d), it can be observed that, when the alkali-hydrolyzable nitrogen content in the 40–60 cm soil layer during the fruit ripening period is within the range of 24–38 mg/kg and 51–61 mg/kg, and the SPAD value of leaves during the fruit setting period is within the range of 30–41, the fruit can achieve a higher fruit shape index.
During the fruit expansion period, the response relationship between the available P in the 40–60 cm soil layer and the SPAD value of the fruit leaves and the soluble solids content (as shown in Figure 12e) was analyzed. The results indicated that, when the available P content in the 40–60 cm soil layer during the fruit expansion period was within the range of 35–50 mg/kg, and the SPAD value of the fruit leaves was within the range of 43–49, the fruit could obtain a relatively high soluble solids content. Regarding the response diagrams between the available P in the 20–40 cm soil layer during the fruit expansion period and the soluble solids content, and the available K in the 40–60 cm soil layer during the fruit ripening period and the soluble solids content (as shown in Figure 12f), the study found that, when the available P content in the 20–40 cm soil layer during the fruit expansion period was within the range of 40–59 mg/kg or 70–90 mg/kg, and the available K content in the 40–60 cm soil layer during the fruit ripening period was within the range of 50–90 mg/kg, the fruit could obtain a relatively high soluble solids content.
Among them, regarding the analysis of the responses of soil available P in the 40–60 cm layer during the fruit expansion period and the SPAD value of leaves and the thickness of the fruit peel (as shown in Figure 12g), the analysis indicates that, when the soil available P content in the 40–60 cm layer during the fruit expansion period is within the range of 1–20 mg/kg, and the SPAD value of leaves during the fruit expansion period is within the range of 50–70, the fruit can obtain a relatively thin fruit peel. From the response diagrams of soil available P in the 0–20 cm layer during the fruit expansion period and the 20–40 cm layer during the fruit expansion period and the thickness of the fruit peel (as shown in Figure 12h), when the soil available P content in the 0–20 cm layer during the fruit expansion period is within the range of 40–80 mg/kg, and the soil available P content in the 20–40 cm layer during the fruit expansion period is within the range of 10–40 mg/kg, the fruit can obtain a thinner fruit peel.
In conclusion, through the above response surface analysis, systematically and in detail, it reveals the specific influence range and regularity of the interaction between various mineral elements in different soil layers and the relevant leaf indicators on the key indicators of the fruit quality of Korla fragrant pear. This provides a valuable theoretical basis and practical reference for subsequent scientific and reasonable regulation of the growth environment of Korla fragrant pear, the optimization of cultivation management measures, and further improvement in fruit quality.

4. Discussion

This research conducted a series of in-depth and systematic investigations centered on Korla fragrant pear. Through the analysis of soil and leaf-related indicators, as well as the application of artificial neural network (ANN) models for prediction, sensitivity analysis, and response surface analysis, numerous important pieces of information closely related to fruit quality were revealed. The following is an in-depth discussion of these results.

4.1. The Relationship Between Soil Indicators and Fruit Quality

The analysis of the soil nutrients revealed diverse distribution patterns of alkali-hydrolyzable nitrogen, available phosphorus, available potassium, and soil pH across different soil depths (0–20 cm, 20–40 cm, 40–60 cm) and phenological stages (fruit setting, expansion, and maturation). These patterns reflect the dynamic changes in soil nutrients and their adaptation to fruit tree growth requirements. For instance, significant variations in alkali-hydrolyzable nitrogen content under different conditions, along with outliers in box plots, suggest local environmental interference. This phenomenon aligns with observations in apple orchards, where sand mulching combined with moderate nitrogen application (for example, 218 g/tree) significantly improved the fruit sugar–acid ratio and individual fruit weight [46]. However, in Korla fragrant pear orchards, nitrogen application exceeding 300 kg·ha−2 led to decreased yield and soluble solids content [47]. These findings highlight the importance of considering the soil texture variations and local environmental factors in orchard management to ensure uniform and appropriate nitrogen supply, meeting the nitrogen demands of the Korla fragrant pear at different growth stages and thereby stabilizing fruit quality [48].
The distribution patterns of available phosphorus across soil depths and phenological stages demonstrate the close relationship between fruit tree uptake/utilization and phosphorus transformation processes in soil. The skewed distribution of the data and interannual fluctuations underscore the influence of external environmental factors and orchard management practices (for example, fertilizer types and application timing) on phosphorus availability. Cross-crop studies indicate that dwarf rootstock apple orchards employing drip irrigation with phosphorus–potassium fertilizers (including the P2K2 treatment) significantly increased the available phosphorus content in surface soil while optimizing photosynthetic parameters to enhance fruit firmness and yield [49]. In kiwi–corn intercropping systems, the intercropping pattern promoted available phosphorus enrichment in the 0–20 cm soil layer through root interactions [50]. This implies that, in practical production, the precise regulation of the phosphorus fertilizer application based on soil characteristics and fruit tree growth patterns is essential to improve phosphorus use efficiency, thereby optimizing fruit quality, particularly facilitating the accumulation of phosphorus-related components (such as nucleic acids and phospholipids) in fruits [51,52].
Regarding available potassium, its depth-dependent distribution patterns and fluctuations during critical growth stages (for example, fruit expansion) reflect both the influence of soil depth on potassium distribution and fruit tree growth demands. Long-term field experiments demonstrate a significant accumulation of available potassium in the 0–40 cm soil layer, while insufficient content in deeper layers (40–60 cm) [53] may limit potassium supply during fruit expansion. In tobacco–rice rotation systems, the available potassium content shows a significant negative correlation with tillage layer depth, exhibiting pronounced surface accumulation characteristics [54]. These findings suggest that, in the Korla fragrant pear cultivation, potassium supplementation should be rationally adjusted according to the potassium content in different soil layers and tree growth stages to ensure adequate potassium supply during critical phases like fruit expansion, thereby enhancing fruit sweetness and storability. This is because potassium ions play crucial roles in sugar accumulation and physiological metabolism regulation in fruits [55,56].
Although soil pH values are relatively consistent, observed variations relate to factors including soil parent material, long-term fertilization practices, and root exudates. Maintaining an appropriate soil pH range is crucial for ensuring nutrient availability and normal root function [57]. Cross-regional cases demonstrate that, in Shaanxi apple orchards, organic fertilizer and acidic amendments can reduce the pH from 8.9 to below 7.5, thereby improving the calcium and iron uptake [58]. Conversely, in Panzhihua mango orchards, long-term compound fertilizer use caused 63.5% of orchard soils to exhibit a pH below 5.5, requiring lime and organic fertilizer applications to mitigate acidification [59]. Orchard managers should monitor dynamic changes in soil acid-base balance and implement appropriate soil amendment measures to prevent pH abnormalities from compromising fruit quality.

4.2. The Correlation Between Leaf Indicators and Fruit Quality

The dynamic changes in total phosphorus, total nitrogen, total potassium content, and SPAD values in leaves across different years and phenological stages clearly demonstrate the nutrient absorption and utilization patterns in pear trees. Similarly to apple trees, the leaf phosphorus content in pear trees shows significant positive correlations with individual fruit weight and soluble sugar content [60], consistent with findings in Fuji apple training angle optimization trials where phosphorus promoted fruit weight gain (R2 = 0.89) [61]. Notably, critical phosphorus requirements vary among fruit species: the optimal range for pear leaves is 0.12–0.25%, while peach trees require 0.15–0.4% [62], suggesting the need for species-specific fertilization strategies.
The temporal variations in total nitrogen content reflect nitrogen translocation and allocation patterns within trees. Recent studies show that increasing the nitrogen application to 218 g/tree in apple orchards simultaneously improves the fruit shape index and total sugar content [46], while applying 200 kg/ha nitrogen during the expansion stage of nectarine significantly enhances the leaf SPAD values and shoot growth rate [63]. These cross-species findings indicate that nitrogen regulation requires phenological stage-specific approaches, as excessive nitrogen, while promoting shoot growth, may reduce the sugar–acid ratio in fruits (β = −0.825, citrus study) [64].
The fluctuation patterns of leaf potassium content align with potassium demand characteristics during fruit development. Under drought conditions, potato cultivar ‘Experimental No. 2’ improves the water use efficiency by enhancing the potassium utilization efficiency (contribution rate: 28.44%) [65]. These findings provide cross-species evidence for drought-season potassium management in pear orchards: pre-expansion stage potassium application can simultaneously increase fruit potassium accumulation (60–79%) and the sugar–acid ratio [66].
As an indicator of leaf chlorophyll content, SPAD value variations reflect the influence of environmental factors and tree nutritional status on photosynthesis. Blue light supplementation increases nectarine leaf SPAD values by 15% and enhances the fruit sugar–acid ratio by 30.5% through promoted sorbitol transport [67], while red light treatment induces the HY5 gene expression in tomato leaves, increasing the photosynthetic rate by 26% [68]. These findings suggest that growers could indirectly improve fruit sugar accumulation through light quality regulation (for example, a 4:1 red–blue light ratio in protected cultivation), which can be particularly beneficial for high-density orchards.

4.3. The Application and Significance of ANN Model in Fruit Quality Prediction

By constructing ANN models using carefully selected input variables (derived from soil and leaf indicators), we achieved the effective prediction of fruit shape index, peel thickness, titratable acidity, and soluble solids content in Korla fragrant pears (R2 > 0.96). These results align closely with recent studies on other fruit crops: for instance, Al-Saif et al. (2022) reported R2 values of 0.89–0.94 for ANN models predicting berry weight and the total sugar content in flame seedless grapes [69], while in strawberry quality prediction, the ANN demonstrated superior accuracy (R2 = 0.906–0.943) for total phenolics and anthocyanins compared to traditional linear regression (R2 = 0.141–0.480) [70]. This confirms that ANN models can effectively capture complex nonlinear relationships among variables, overcoming the limitations of conventional statistical methods [71], with this advantage demonstrating cross-species applicability.
The optimal parameters and performance varied across different quality indicators. For example, our study found that predicting the fruit shape index required the Trainlm function with Tansig-Purelin transfer functions, whereas the soluble solids content prediction relied on alternative configurations. Similarly, Huang et al. [72] observed in loquat studies that different ANN architectures were needed for individual fruit weight versus titratable acidity, corroborating our conclusions [73]. These differences indicate that the regulatory mechanisms underlying various fruit quality parameters are distinct, necessitating feature engineering and model optimization for precise prediction.
Notably, input variable selection critically influences model performance. Unlike our soil/leaf indicators for Korla fragrant pears, studies on strawberries in Amoriello et al. [70] and citrus in Al-Saif et al. [74] identified color coordinates (L, a, b*) as key predictors for TSS and acidity. This suggests that input parameters should be selected based on species-specific biological characteristics; color-based metrics may be more effective for berries, whereas soil/leaf nutritional indicators show greater explanatory power for tree crops like pears and citrus.
Model stability assessments (through a comparison of predicted versus measured value distributions and trends) confirmed reliability. This conclusion aligns with the citrus yield prediction research in Almady et al. [75] where ANN models achieved a significantly lower prediction error (MAPE = 5.41%) across Egypt’s diverse climatic zones compared to traditional regression methods highlighting ANN’s robustness in complex environments. Therefore, our model provides orchard managers with a soil/leaf data-based quality prediction tool to optimize harvest scheduling and market pricing decisions.
From an agricultural implementation perspective, the ANN models demonstrated their practical value: for example, Kazakh agricultural economic research in Kulisz et al. [76] employed ANN for crop yield prediction (R2 = 0.98) to guide resource allocation and policymaking, while a flaxseed yield optimization model in Mirik et al. [69] used ANN to precisely calibrate sowing density and fertilization. Our model could be integrated into smart orchard management systems, combining real-time sensor data to provide growers with dynamic quality alerts, thereby reducing postharvest losses and improving the economic returns.

4.4. Implications of Sensitivity Analysis and Response Surface Analysis

The sensitivity analysis, by systematically eliminating input variables from the ANN model, clearly revealed the relative importance of various soil and leaf indicators on different quality parameters of Korla fragrant pears. This approach enables the precise identification of key influencing factors in orchard management, thereby optimizing resource allocation. For instance, in regulating titratable acidity, the ranking of importance for indicators such as available K in the 40–60 cm soil layer during fruit setting provides a scientific basis for fertilization and soil amendment strategies, making management practices more targeted. Notably, these findings align closely with recent rootstock salt-alkali tolerance research. Salt-tolerant rootstocks maintain ionic balance primarily by regulating their K+ absorption capacity, as studied in Wang et al. [77] and by the Jilin Academy of Agricultural Sciences [78], while apple rootstocks enhance nutrient uptake efficiency under hypoxia stress through root architecture optimization (for example, increased lateral root density), as studied in Chen [79], demonstrating conserved responses to key mineral elements across fruit tree species.
The response surface analysis further elucidated the interaction effects among factors, establishing optimal ranges for various indicators. The specific combinations of the soil mineral content and leaf indicator values were found to correspond to superior fruit quality [80]. This methodology shows consistency with citrus cold-tolerant rootstock studies that optimized sugar accumulation thresholds under low-temperature stress, as shown in the study by Dahro et al. [81], validating the universal applicability of multifactorial synergistic regulation in fruit quality management. These results provide quantitative references for developing precision cultivation protocols, guiding the integrated regulation of multiple factors to optimize fruit quality in practice.
In summary, this study comprehensively reveals the complex relationships and interaction mechanisms between soil/leaf indicators and fruit quality in Korla fragrant pears through multifaceted analyses, establishing a solid theoretical foundation and practical guidance for scientific cultivation and precision quality control. From an applied perspective, the dynamic thresholds of mineral elements proposed here can be directly integrated into precision agriculture systems (for example, soil sensor networks and variable-rate fertilization technology), helping farmers reduce fertilizer redundancy by 15–20%. Simultaneously, the interaction models can support decision making in regional rootstock–scion combination design,-for instance, prioritizing salt-tolerant rootstocks in saline-alkali areas to enhance K+ absorption stability, as evidenced in Zhang et al. [82,83]. Furthermore, the methodologies developed herein serve as valuable reference for related research on other fruit species (for example, apple and citrus), advancing the fruit cultivation field towards more refined and scientific development.

5. Conclusions

This study focuses on the Korla fragrant pear as the research subject, employing multi-stage data collection and diverse analytical methods to specifically investigate the relationship between soil–leaf mineral nutrition and fruit quality parameters. The results indicate significant differences in the demand for soil mineral nutrients during various fruit development stages: during the fruit-setting period, available potassium (30–47 mg/kg) in the 40–60 cm soil layer, combined with a neutral pH environment (7.36–7.8) in the 20–40 cm layer, significantly enhances the titratable acid content. In contrast, during the maturation period, the synergistic effect of appropriate available ammonium nitrogen (33–53.2 mg/kg) in the 40–60 cm soil layer and leaf nitrogen nutrition (total nitrogen 2–6.5 mg/kg or SPAD value 30–41) during the fruit-setting period plays a critical role in optimizing the fruit shape index and soluble solid content.
Soil nutrient analysis revealed variations in various nutrient indicators across different depths and phenological stages, suggesting that orchard management should adopt rational fertilization practices based on soil characteristics and tree requirements to maintain nutrient stability. The analysis of leaf physiological indicators demonstrated their changes across the years and phenological stages, highlighting the feasibility of influencing fruit quality through regulatory factors. The artificial neural network (ANN) model exhibited strong predictive performance for various quality indicators (R2 > 0.85), with different indicators corresponding to optimal model parameters, confirming its reliability and practicality. Sensitivity analysis elucidated the relative importance of each indicator on fruit quality, aiding precision management, while response surface analysis identified the optimal ranges for factor interactions, providing quantitative references for cultivation management.
However, this study has limitations. The samples were concentrated in a specific orchard within a particular region and did not encompass more complex environments, which may affect the generalizability of the conclusions. Future research could expand the sample collection scope to include samples from diverse ecological environments, refine model input variables, and explore potential influencing factors in greater depth to further optimize cultivation management strategies for Korla fragrant pear and other fruit trees, thereby enhancing fruit quality.

Supplementary Materials

The following supporting information can be downloaded at: https://www.mdpi.com/article/10.3390/agronomy15051236/s1, Table S1: The model results of fruit shape index predicted by ANN algorithm. Table S2: ANN algorithm to predict the peel thickness of the model results. Table S3: ANN algorithm to predict the model results of titratable acid. Table S4: ANN algorithm to predict the model results of soluble solids.

Author Contributions

M.Y.: conceptualization, methodology, data curation, writing—original draft, writing—review and editing; Y.L.: conceptualization, methodology, data curation, writing—original draft, writing—review and editing; L.W. and W.F.: visualization, software; Z.W.: validation, investigation; H.W.: visualization, formal analysis; K.G. and L.F.: supervision, formal analysis; J.B.: resources, writing—review and editing, project administration, funding acquisition. All authors have read and agreed to the published version of the manuscript.

Funding

The Bingtuan Science and Technology Program (Grant Nos. 2021CB055, 2022CB001-11). The National Natural Science Foundation of China (Grant Nos. 31860528, U2003121). The First Division Science and Technology Project (Grant No. 2022NY03).

Data Availability Statement

Data access is temporarily restricted by intellectual property protection at the end of the project, but can be obtained through the application of the corresponding author.

Conflicts of Interest

The authors declare no conflicts of interest.

Abbreviations

The following abbreviations are used in this manuscript:
SPADSoil and Plant Analysis Development
ANNArtificial Neural Network
R2Coefficient of Determination
MAEMean Absolute Error
MBEMean Bias Error
MAPEMean Absolute Percentage Error
RMSERoot Mean Square Error

References

  1. Lan, H.; Wang, Z.; Niu, H.; Zhang, H.; Zhang, Y.; Tang, Y.; Liu, Y. A nondestructive testing method for soluble solid content in Korla fragrant pears based on electrical properties and artificial neural network. Food Sci. Nutr. 2020, 8, 5172–5181. [Google Scholar] [CrossRef] [PubMed]
  2. He, W.; Shi, L.; Li, Y.; Liang, Y.; Zhang, Z. Research progress on pear fruit quality and its influencing factors. J. Zhejiang Agric. Sci. 2022, 63, 330–333. [Google Scholar] [CrossRef]
  3. Penzel, M.; Lakso, A.; Tsoulias, N.; Zude-Sasse, M. Carbon consumption of developing fruit and the fruit bearing capacity of individual RoHo 3615 and Pinova apple trees. Int. Agrophys. 2020, 34, 409–423. [Google Scholar] [CrossRef]
  4. Lu, Y.; Xiao, Q.; Wu, S.; Yuan, H.; Gao, T.; Cai, T.; Wu, X.; Ma, Y.; Liao, X. Partial Substitution of Nitrogen Fertilizer with Biogas Slurry Increases Rice Yield and Fertilizer Utilization Efficiency, Enhancing Soil Fertility in the Chaohu Lake Basin. Plants 2024, 13, 2024. [Google Scholar] [CrossRef]
  5. Bai, Z.; Ma, L.; Jin, S.; Ma, W.; Velthof, G.L.; Oenema, O.; Liu, L.; Chadwick, D.; Zhang, F. Nitrogen, Phosphorus, and Potassium Flows Through the Manure Management Chain in China. Environ. Sci. Technol. 2016, 50, 13409–13418. [Google Scholar] [CrossRef] [PubMed]
  6. Tziolas, N.; Tsakiridis, N.; Chabrillat, S.; Demattê, J.A.M.; Ben-Dor, E.; Gholizadeh, A.; Zalidis, G.; van Wesemael, B. Earth Observation Data-Driven Cropland Soil Monitoring: A Review. Remote Sens. 2021, 13, 4439. [Google Scholar] [CrossRef]
  7. Sahbeni, G.; Ngabire, M.; Musyimi, P.K.; Székely, B. Challenges and Opportunities in Remote Sensing for Soil Salinization Mapping and Monitoring: A Review. Remote Sens. 2023, 15, 2540. [Google Scholar] [CrossRef]
  8. Liu, X.; Kang, F.; Hu, C.; Wang, L.; Xu, Z.; Zheng, D.; Gong, W.; Lu, Y.; Ma, Y.; Wang, J. A genetically encoded photosensitizer protein facilitates the rational design of a miniature photocatalytic CO2-reducing enzyme. Nat. Chem. 2018, 10, 1201–1206. [Google Scholar] [CrossRef]
  9. Wu, Y.; Zhao, Z.; Zhao, F.; Cheng, X.; Zhao, P.; Liu, S. Response of Pear Trees’ (Pyrus bretschneideri ‘Sinkiangensis’) Fine Roots to a Soil Water Regime of Regulated Deficit Irrigation. Agronomy 2021, 11, 2316. [Google Scholar] [CrossRef]
  10. Wang, Y.; Gao, M.; Chen, H.; Fu, X.; Wang, L.; Wang, R. Soil moisture and salinity dynamics of drip irrigation in saline-alkali soil of Yellow River basin. Front. Environ. Sci. 2023, 11, 1130455. [Google Scholar] [CrossRef]
  11. Siatwiinda, S.M.; Ros, G.H.; Yerokun, O.A.; de Vries, W. Options to reduce ranges in critical soil nutrient levels used in fertilizer recommendations by accounting for site conditions and methodology: A review. Agron. Sustain. Dev. 2024, 44, 9. [Google Scholar] [CrossRef]
  12. Matsuoka, K. Methods for Nutrient Diagnosis of Fruit Trees Early in the Growing Season by Using Simultaneous Multi-Element Analysis. Hortic. J. 2020, 89, 197–207. [Google Scholar] [CrossRef]
  13. Batista, P.V.G.; Evans, D.L.; Cândido, B.M.; Fiener, P. Does soil thinning change soil erodibility? An exploration of long-term erosion feedback systems. Soil 2023, 9, 71–88. [Google Scholar] [CrossRef]
  14. Lykhovyd, P. Prediction of sweet corn yield depending on cultivation technology parameters by using linear regression and artificial neural network methods. Biosyst. Divers. 2018, 26, 11–15. [Google Scholar] [CrossRef]
  15. Vawda, M.I.; Lottering, R.; Mutanga, O.; Peerbhay, K.; Sibanda, M. Comparing the Utility of Artificial Neural Networks (ANN) and Convolutional Neural Networks (CNN) on Sentinel-2 MSI to Estimate Dry Season Aboveground Grass Biomass. Sustainability 2024, 16, 1051. [Google Scholar] [CrossRef]
  16. Jiang, H.B.; Zhao, J.W.; Zhang, N.W.; Wang, H.; Dong, C.X.; Xu, Y.C. Effects of different soil surface management ondistribution characteristics of pear roots. J. Plant Nutr. Fertil. 2014, 20, 164–171. [Google Scholar] [CrossRef]
  17. Xu, G.; Li, C.; Qin, S.; Xiao, W.; Fu, X.; Chen, X.; Li, L.; Li, D. Changes in Sucrose and Sorbitol Metabolism Cause Differences in the Intrinsic Quality of Peach Fruits Cultivated in Field and Greenhouse Environments. Agronomy 2022, 12, 2877. [Google Scholar] [CrossRef]
  18. Xu, X.; Zhang, X.; Ni, W.; Liu, C.; Qin, H.; Guan, Y.; Liu, J.; Feng, Z.; Xing, Y.; Tian, G.; et al. Nitrogen–potassium balance improves leaf photosynthetic capacity by regulating leaf nitrogen allocation in apple. Hortic. Res. 2024, 11, uhad253. [Google Scholar] [CrossRef]
  19. Vishwakarma, M.; Tagore, G.; Kulhare, P. Estimation of Chlorophyll Using SPAD. Int. J. Environ. Clim. Change 2023, 13, 1901–1912. [Google Scholar] [CrossRef]
  20. Han, S.; Zhao, J.; Liu, Y.; Xi, L.; Liao, J.; Liu, X.; Su, G. Effects of green manure planting mode on the quality of Korla fragrant pears (Pyrus sinkiangensis Yu). Front. Plant Sci. 2022, 13, 1027595. [Google Scholar] [CrossRef]
  21. Yang, J.; Lin, N.; Zhang, K.; Jia, L.; Zhang, D.; Li, G.; Zhang, J. A Parametric Study of MPSO-ANN Techniques in Gas-Bearing Distribution Prediction Using Multicomponent Seismic Data. Remote Sens. 2023, 15, 3987. [Google Scholar] [CrossRef]
  22. Chavlis, S.; Poirazi, P. Dendrites endow artificial neural networks with accurate, robust and parameter-efficient learning. Nat. Commun. 2025, 16, 943. [Google Scholar] [CrossRef] [PubMed]
  23. Castillo-Girones, S.; Munera, S.; Martínez-Sober, M.; Blasco, J.; Cubero, S.; Gómez-Sanchis, J. Artificial Neural Networks in Agriculture, the Core of Artificial Intelligence: What, When, and Why. Comput. Electron. Agric. 2025, 230, 109938. [Google Scholar] [CrossRef]
  24. Pandey, A.; Jain, K. An intelligent system for crop identification and classification from UAV images using conjugated dense convolutional neural network. Comput. Electron. Agric. 2022, 192, 106543. [Google Scholar] [CrossRef]
  25. Kulisz, M.; Duisenbekova, A.; Kujawska, J.; Kaldybayeva, D.; Issayeva, B.; Lichograj, P.; Cel, W. Implications of Neural Network as a Decision-Making Tool in Managing Kazakhstan’s Agricultural Economy. Appl. Comput. Sci. 2024, 19, 121–135. [Google Scholar] [CrossRef]
  26. Sun, H.; Huang, X.; Chen, T.; Zhou, P.; Huang, X.; Jin, W.; Liu, D.; Zhang, H.; Zhou, J.; Wang, Z.; et al. Fruit quality prediction based on soil mineral element content in peach orchard. Food Sci. Nutr. 2022, 10, 1756–1767. [Google Scholar] [CrossRef]
  27. Huang, X.; Wang, H.; Qu, S.; Luo, W.; Gao, Z. Using artificial neural network in predicting the key fruit quality of loquat. Food Sci. Nutr. 2021, 9, 1780–1791. [Google Scholar] [CrossRef]
  28. Liu, X.; Arif, M.; Zheng, J.; Wu, Y.; Chen, Y.; Gao, J.; Liu, J.; Changxiao, L. Assessing leaf physiological traits in response to flooding among dominant riparian herbs along the Three Gorges Dam in China. Ecol. Evol. 2024, 14, e11533. [Google Scholar] [CrossRef]
  29. Guo, Z.; Li, X.; Ren, Y.; Qian, S.; Shao, Y. Research on regional soil moisture dynamics based on hyperspectral remote sensing technology. Int. J. Low-Carbon Technol. 2023, 18, 737–749. [Google Scholar] [CrossRef]
  30. Qiang, R.; Wang, M.; Li, Q.; Li, Y.; Sun, H.; Liang, W.; Li, C.; Zhang, J.; Liu, H. Response of Soil Nitrogen Components and nirK- and nirS-Type Denitrifying Bacterial Community Structures to Drip Irrigation Systems in the Semi-Arid Area of Northeast China. Agronomy 2024, 14, 577. [Google Scholar] [CrossRef]
  31. Yang, K.; Li, S.; Sun, Y.; Cartmill, A.D.; López, I.F.; Ma, C.; Zhang, Q. Effects of combined nitrogen and phosphorus application on soil phosphorus fractions in alfalfa (Medicago sativa L.) production in China. Front. Plant Sci. 2024, 15, 1380738. [Google Scholar] [CrossRef] [PubMed]
  32. Zhang, W.; Zhang, Y.; Zhang, X.; Wu, W.; Liu, H. The Spatiotemporal Variability of Soil Available Phosphorus and Potassium in Karst Region: The Crucial Role of Socio-Geographical Factors. Land 2024, 13, 882. [Google Scholar] [CrossRef]
  33. Abdulraheem, M.I.; Zhang, W.; Li, S.; Moshayedi, A.J.; Farooque, A.A.; Hu, J. Advancement of Remote Sensing for Soil Measurements and Applications: A Comprehensive Review. Sustainability 2023, 15, 15444. [Google Scholar] [CrossRef]
  34. Lu, Q.; Liu, Z.; Zeng, S.; Song, A.; Li, Z.; Zhang, S.; Zhang, S.; Lan, M. Determination of Hydrolysable Nitrogen in Soil Samples by Alkaline Hydrolysis Diffusion Separation Acid-Base Titration Based on a Polypropylene Diffusion Dish. ROCK Miner. Anal. 2023, 42, 156–166. [Google Scholar] [CrossRef]
  35. Fei, T.; Liqiong, F.; Xiaofeng, J. Improvement of determination method of hydrolyzable nitrogen in soil. Geol. Yunnan 2022, 41, 131–135. [Google Scholar] [CrossRef]
  36. Jiaxin, R.; Wenna, Y.; Zhongyi, L.; Yanyan, H. Influence of matrix effect on determination accuracy of potassium content in soil and plantsamples by flame photometer. Acta Agric. Zhejiangensis 2019, 31, 955–962. [Google Scholar] [CrossRef]
  37. Yan, X.; Wang, D.-J.; Zhang, G.; Bo, L.-J.; Peng, X.-L. Soil phosphorous accumulation in long-term P fertilization paddy field and its environmental effects. Chin. J. Eco-Agric. 2013, 21, 393–400. [Google Scholar] [CrossRef]
  38. Yu, M.; Bai, X.; Bao, J.; Wang, Z.; Tang, Z.; Zheng, Q.; Zhi, J. The Prediction Model of Total Nitrogen Content in Leaves of Korla Fragrant Pear Was Established Based on Near Infrared Spectroscopy. Agronomy 2024, 14, 1284. [Google Scholar] [CrossRef]
  39. Liu, J.; Zhong, J.; Liu, J.; Luo, S.; Wang, M.; Fan, J.; Jia, L. Stoichiometric characteristics of soil and leaves in Sapindus mukorossi plantation at an early fruiting stage. J. Nanjing For. Univ. Nat. Sci. Ed. 2021, 45, 67–75. [Google Scholar] [CrossRef]
  40. Villegas-VeláZquez, I.; Zavaleta-Mancera, H.A.; Arévalo-Galarza, M.L.; Suarez-Espinosa, J.; Garcia-Osorio, C.; Padilla-Chacon, D.; Galvan-Escobedo, I.G.; Jimenez-Bremont, J.F. Chlorophyll measurements in Alstroemeria sp. using SPAD-502 meter and the color space CIE L*a*b*, and its validation in foliar senescence. Photosynthetica 2022, 60, 230–239. [Google Scholar] [CrossRef]
  41. Wu, F.; Zhang, R.; Yin, Z.; Wang, H. Comprehensive quality evaluation of highbush blueberry cultivars based on principal component analysis. Trans. Chin. Soc. Agric. Eng. 2022, 38, 262–269. [Google Scholar] [CrossRef]
  42. Adou, M.; Adjouman, Y.D.; Kouadio, K.O.; Tetchi, A.F.; Amani, N.G.G. Improvement of Cashew Apple Juice (Anacardium occidentale L.) by Association with Passion Fruit Juice (Passiflora edulis). Food Nutr. Sci. 2021, 12, 787–804. [Google Scholar] [CrossRef]
  43. Wang, G.; Meng, J.; Xu, W.; Chen, C.; Liu, S.; Lv, Y. Analysis of Nutritional Components and Flavor Substances of Different Varieties of Mangoes. Sci. Technol. Food Ind. 2022, 43, 71–79. [Google Scholar] [CrossRef]
  44. Xin, Z.; Yongxiang, J.; Xibin, L.; Shefeng, L.; Xiaolei, N. Research on the Trajectory Consistency based on Mahalanobis distance method. J. Phys. Conf. Ser. 2023, 2478, 112039. [Google Scholar] [CrossRef]
  45. Shabani, A.; Ghaffary, K.A.; Sepaskhah, A.R.; Kamgar-Haghighi, A.A. Using the artificial neural network to estimate leaf area. Sci. Hortic. 2017, 216, 103–110. [Google Scholar] [CrossRef]
  46. Xiaoyong, L.; Jing, R.; Fen, K.; Fujun, H.; Hai, P.; Jianming, L.; Qiang, L.; Junping, J.; Youfu, W. Effects of nitrogen regulation on fruit quality of long-termsand-covered apple orchard in Jingning, Gansu Province. Agric. Res. Arid. Areas 2022, 40, 124–134. [Google Scholar] [CrossRef]
  47. Wei, L.; Wenge, X.; Xiyu, Z.; Leia, F.; Qiaoa, X.; Zhongping, C. Effect of nitrogen fertilization on soil nutrients, root biomass, yield andquality in Korla Fragrant Pear orchard. Non-Wood For. Res. 2023, 41, 235–243. [Google Scholar] [CrossRef]
  48. Chen, G.; Wang, L.; Fabrice, M.R.; Tian, Y.; Qi, K.; Chen, Q.; Cao, P.; Wang, P.; Zhang, S.; Wu, J.; et al. Physiological and Nutritional Responses of Pear Seedlings to Nitrate Concentrations. Front. Plant Sci. 2018, 9, 1679. [Google Scholar] [CrossRef]
  49. Liu, Y.-W.; Guo, X.-H.; Yang, K.; Xu, H.-H.; Sun, X.-H.; Ma, J.-J.; Lei, T.; He, Q.-Q. Effects of Different Ratios of Phosphorus and Potassium Fertilizers on Apple Quality under Drip Irrigation and Comprehensive Evaluation. Water Sav. Irrig. 2020, 6, 33–37. [Google Scholar] [CrossRef]
  50. Wu, H.; Wang, L.; Kang, L.; Liu, C.; Li, M. Study on the effect of planting pattern adjustment on the growth of kiwifruit inter-root microorganisms and fruit quality. Turk. J. Agric. For. 2023, 47, 263–272. [Google Scholar] [CrossRef]
  51. Corrêa, V.; Gonçalves, J.; Costa, K.; Oliveira, I.; Santos, J.; Oliveira, S.; Ferreira, M.; Lima, R.; Araújo, W.; Nunes-Nesi, A. The Role of Phosphate Fertilization on Physiological Responses of the Young Bertholletia excelsa Plants Grown in a P-Deficient Amazon Ferralsol. Plants 2022, 11, 2955. [Google Scholar] [CrossRef]
  52. Zhao, Z.-P.; Tong, Y.-A.; Liu, F.; Wang, X.-Y.; Zeng, Y.-J. Assessment of current conditions of household fertilization of apples in Weibei Plateau. Chin. J. Eco-Agric. 2012, 20, 1003–1009. [Google Scholar] [CrossRef]
  53. Gao, Y.-M.; Tong, Y.-A.; Lu, Y.-L.; Ma, H.-Y. Effect of long -term application of nitrogen, phosphorus and potassiumon apple yield and soil nutrient accumulation and distribution in orchardsoil of Loess Plateau. J. Fruit Sci. 2012, 29, 322–327. [Google Scholar] [CrossRef]
  54. Liu, Z.X.; Liu, Y.J.; Peng, S.G.; Shan, X.H.; Xie, P.F.; Li, H.G. Vertical Distribution Characteristics of Soil Available Nutrients in Tobacco-Rice Rotation Area Based on Long-Term Shallow Tillage. Chin. Tob. Sci. 2020, 41, 28–35. [Google Scholar] [CrossRef]
  55. Wu, K.; Hu, C.; Liao, P.; Hu, Y.; Sun, X.; Tan, Q.; Pan, Z.; Xu, S.; Dong, Z.; Wu, S. Potassium stimulates fruit sugar accumulation by increasing carbon flow in Citrus sinensis. Hortic. Res. 2024, 11, uhae240. [Google Scholar] [CrossRef] [PubMed]
  56. Wang, R.C.; Xia, L.H.; Xiong, X.Y.; Li, D.Z. Effects of applying potassium on kiwifruit eating quality and storage life. J. Fruit Sci. 2006, 23, 200–204. [Google Scholar] [CrossRef]
  57. Liu, G.; Hanlon, E. Soil pH Range for Optimum Commercial Vegetable Production: HS1207/HS1207, 10/2012. EDIS 2012, 2012. [Google Scholar] [CrossRef]
  58. Yanni, L.; Yanan, T.; Chen, M.; Bomei, W.; Xinyue, Z. Present situation and adjustment measures of orchard soil pH in Shaanxi area. Shaanxi J. Agric. Sci. 2019, 65, 58–61. [Google Scholar]
  59. Zhang, H.-Y.; Hu, B.; Bao, W.-K.; Li, G.-L.; Pan, H.-B.; Du, B. Current status and change tendency of soil pH in mango orchards in Panzhihua City. Chin. J. Appl. Environ. Biol. 2020, 26, 63–73. [Google Scholar] [CrossRef]
  60. Shuai, Y.; Liang, S.; Zhenjie, L.; Fuchun, Z.; Kai, X.; Jicun, Y.; Shaoyu, Z.; Deying, Z. Correlation analysis of leaf and fruit mineral nutrition and fruit quality of Nanguo pear. China Fruits 2022, 33–36. [Google Scholar] [CrossRef]
  61. Szűcs, E.; Kállay, T. Interaction of nutrient supply and crop load of apple trees (Malus domestica Borkh.). Int. J. Hortic. Sci. 2008, 14, 33–35. [Google Scholar] [CrossRef]
  62. Maity, A.; Marathe, R.A.; Sarkar, A.; Basak, B.B. Phosphorus and potassium supplementing bio-mineral fertilizer augments soil fertility and improves fruit yield and quality of pomegranate. Sci. Hortic. 2022, 303, 111234. [Google Scholar] [CrossRef]
  63. Zhang, Y.; Zhao, J.-B.; Ren, F.; Wang, S.-D.; Wang, Z.; Li, X.-Y.; Zheng, Z.-Q.; Zheng, S.-Q.; Jiang, Q.; Guo, J.-Y. Yield and quality response of nectarine to different nitrogen topdressing amounts at fruit expanding stage. J. Plant Nutr. Fertil. 2020, 26, 581–586. [Google Scholar] [CrossRef]
  64. Liu, Z.; Yang, Q.; Ling, Q.; Wei, Y.; Ning, Q.; Kong, F.; Zhang, Y.; Shi, X.; Wang, J. Adjusted nitrogen application using non-destructive monitoring model of citrus leaf functional nitrogen content. Trans. Chin. Soc. Agric. Eng. 2023, 39, 167–175. [Google Scholar] [CrossRef]
  65. Mengqing, S.; Jiali, Y.; Yijian, L.; Shiwen, W.; Lina, Y.; Xiping, D. Relationship between drought adaptability and potassium nutrient characteristics in different potato varieties. Agric. Res. Arid. Areas 2024, 42, 51. [Google Scholar] [CrossRef]
  66. Wu, X.; Shen, C.-W.; Ding, Y.-F.; Wu, C.-C.; Dong, C.-X.; Xu, Y.-C. Potassium accumulation in ‘Huangguan’ pear fruits and leaves and theirresponse to different potassium application. J. Plant Nutr. Fertil. 2016, 22, 1425–1432. [Google Scholar] [CrossRef]
  67. Zhao, X.; Xiao, W.; Guo, J.; Gao, D.; Fu, X.; Li, D. Effects of supplementary blue light on photosynthetic performance and sugar and acid accumulation of nectarine in protected cultivation. Chin. Bull. Bot. 2018, 53, 227–237. [Google Scholar] [CrossRef]
  68. Yan, J.; Liu, J.; Yang, S.; Jiang, C.; Liu, Y.; Zhang, N.; Sun, X.; Zhang, Y.; Zhu, K.; Peng, Y.; et al. Light quality regulates plant biomass and fruit quality through a photoreceptor-dependent HY5-LHC/CYCB module in tomato. Hortic. Res. 2023, 10, uhad219. [Google Scholar] [CrossRef]
  69. Al-Saif, A.M.; Abdel-Sattar, M.; Aboukarima, A.M.; Eshra, D.H.; Górnik, K. Physico-Chemical Properties Prediction of Flame Seedless Grape Berries Using an Artificial Neural Network Model. Foods 2022, 11, 2766. [Google Scholar] [CrossRef]
  70. Amoriello, T.; Ciccoritti, R.; Ferrante, P. Prediction of Strawberries’ Quality Parameters Using Artificial Neural Networks. Agronomy 2022, 12, 963. [Google Scholar] [CrossRef]
  71. AlKandari, M.; Ahmad, I. Solar power generation forecasting using ensemble approach based on deep learning and statistical methods. Appl. Comput. Inform. 2020, 20, 231–250. [Google Scholar] [CrossRef]
  72. Al-Saif, A.M.; Abdel-Sattar, M.; Eshra, D.H.; Sas-Paszt, L.; Mattar, M.A. Predicting the Chemical Attributes of Fresh Citrus Fruits Using Artificial Neural Network and Linear Regression Models. Horticulturae 2022, 8, 1016. [Google Scholar] [CrossRef]
  73. Hassan-Esfahani, L.; Torres-Rua, A.; Jensen, A.; McKee, M. Assessment of Surface Soil Moisture Using High-Resolution Multi-Spectral Imagery and Artificial Neural Networks. Remote Sens. 2015, 7, 2627–2646. [Google Scholar] [CrossRef]
  74. Göçmen Polat, E.; Kuvvetli, Y. Prediction of Citrus Fruits Production using Artificial Neural Networks and Linear Regression Analysis. Erzincan Üniversitesi Fen. Bilim. Enstitüsü Derg. 2020, 13, 972–983. [Google Scholar] [CrossRef]
  75. Ahmed, A.R.; Aleid, S.M.; Mohammed, M. Impact of Modified Atmosphere Packaging Conditions on Quality of Dates: Experimental Study and Predictive Analysis Using Artificial Neural Networks. Foods 2023, 12, 3811. [Google Scholar] [CrossRef]
  76. Qian, J.; Xing, B.; Wu, X.; Chen, M.; Wang, Y.A. A smartphone-based apple yield estimation application using imaging features and the ANN method in mature period. Sci. Agric. 2018, 75, 273–280. [Google Scholar] [CrossRef]
  77. Fang, S.; Hou, X.; Liang, X. Response Mechanisms of Plants Under Saline-Alkali Stress. Front. Plant Sci. 2021, 12, 667458. [Google Scholar] [CrossRef]
  78. Jing, S.; Zhenlong, B.; Yuebo, L.; Xueming, Z.; Xiaoguang, Q.; Bingbing, Z. Research Progress on Salt-alkali Tolerance Mechanism of Apple Plants. Mol. Plant Breedin 2024, 22, 3961–3969. [Google Scholar] [CrossRef]
  79. Xie, B.; An, X.-H.; Chen, Y.-H.; Cheng, C.-G.; Zhao, D.-Y.; Kang, G.-D.; Zhou, J.-T.; Li, Z.; Zhang, Y.-Z.; Yang, A.; et al. Response and Adaptability Evaluation of Apple Rootstocks to Low Nitrogen Stress. J. Plant Nutr. Fertil. 2022, 28, 1092–1103. [Google Scholar] [CrossRef]
  80. Hamza, D.; Sefan, R.; El-Boray, M. Effect of Potassium Nano Fertilizer on Yield and Berry Qualities of ‘Flame Seedless’ Grapevines. J. Plant Prod. 2019, 10, 929–934. [Google Scholar] [CrossRef]
  81. Dahro, B.; Li, C.; Liu, J.-H. Overlapping responses to multiple abiotic stresses in citrus: From mechanism understanding to genetic improvement. Hortic. Adv. 2023, 1, 4. [Google Scholar] [CrossRef]
  82. Wei, L. Practice and Application of Precision Agriculture Technology in Fruit Tree Planting. China Fruit Ind. Inf. 2024, 41, 37–39. [Google Scholar] [CrossRef]
  83. Xin, Y.; Yue, W.; Yuxin, Y.; Yuanpeng, D. Evaluation of composite saline-alkali tolerance of grape rootstocks ‘SA15’ and ‘SA17’. Chin. Foreign Grapes Wine 2019, 34–38. [Google Scholar] [CrossRef]
Figure 1. Flowchart of the experimental design.
Agronomy 15 01236 g001
Figure 2. The three-layer structure of the artificial neural network (ANN) model.
Agronomy 15 01236 g002
Figure 3. Soil nutrients: (a) Alkaline hydrolysis nitrogen; (b) Rapidly available phosphorus; (c) Rapidly available potassium; and (d) pH. (The lowercase letters a to e represent significant differences).
Agronomy 15 01236 g003aAgronomy 15 01236 g003b
Figure 4. Leaf physiological indexes: (a) Total phosphorus in leaves; (b) Leaf total nitrogen; (c) Total potassium in leaves; and (d) Leaf SPAD. (The lowercase letters a to b represent significant differences).
Agronomy 15 01236 g004aAgronomy 15 01236 g004b
Figure 5. Visualization of fruit quality: (a) Fruit shape index; (b) Pericarp thickness; (c) Titratable acid; (d) Dissolved solid. (“Note: X axis values represent relative scaling units; actual sample size = 75”).
Agronomy 15 01236 g005aAgronomy 15 01236 g005bAgronomy 15 01236 g005c
Figure 6. Visualization of fruit quality: (In the figure: *: <0.05; **: <0.01; ***: <0.001).
Agronomy 15 01236 g006
Figure 7. Measurement and prediction of the fruit shape index of Korla fragrant pear in ANN model: (a) Scatter plot of measured and predicted fruit index in the training stage of artificial neural network; (b) Scatter plot of measured and predicted fruit index in the testing stage of artificial neural network; and (c) The line diagram of measured and predicted fruit index in the testing stage of artificial neural network. (Note: X axis shows a proportional scale (0–140); actual sample size = 144”).
Agronomy 15 01236 g007aAgronomy 15 01236 g007b
Figure 8. Measurement and the prediction of peel thickness of Korla fragrant pear in ANN model: (a) Scatter plot of the measurement and prediction of the artificial neural network; (b) Scatter plot of the measurement and prediction of the artificial neural network; and (c) Line diagram of the measurement and prediction of the peel thickness of the artificial neural network. (Note: X axis shows proportional scale (0–140); actual sample size = 144”).
Agronomy 15 01236 g008aAgronomy 15 01236 g008b
Figure 9. Measurement and prediction of titratable acids in Korla fragrant pear by ANN model: (a) Scatter plot of measured and predicted titrated acids in the artificial neural network training stage; (b) Scatter plot of measured and predicted titratable acid in artificial neural network test stage; (c) Line plot of measured and predicted titratable acid in the artificial neural network test stage. (Note: X axis shows proportional scale (0–140); actual sample size = 144”).
Agronomy 15 01236 g009aAgronomy 15 01236 g009b
Figure 10. Measurement and prediction of the soluble solid content of Korla fragrant pear in the ANN model: (a) Scatter plot of the measured and predicted soluble solids during the training phase of the artificial neural network; (b) Scatter plot of measured and predicted soluble solids during the testing phase of the artificial neural network; (c) Line graph of measured and predicted soluble solids during the testing phase of the artificial neural network (Note: X axis shows the proportional scale (0–140); actual sample size = 144”).
Agronomy 15 01236 g010aAgronomy 15 01236 g010b
Figure 11. Sensitivity analysis of control variables on key quality characteristics of Korla fragrant pear: (a) Titratable acid; (b) Fruit shape index; (c) Soluble solids; and (d) Peel thickness.
Agronomy 15 01236 g011aAgronomy 15 01236 g011bAgronomy 15 01236 g011c
Figure 12. Response surface analysis: (a) 40–60 cm soil layer quick-acting potassium, pH of 20–40 cm soil layer and titratable acid in the fruit setting period; (b) 40–60 cm soil pH in the fruit setting stage and 40–60 cm soil alkali lysis nitrogen and titrated acid in fruit ripening stage; (c) 40–60 cm in fruit ripening stage, quick effect K in soil layer and total nitrogen and fruit shape index in fruit setting stage; (d) SPAD and fruit shape index of 40–60 cm of soil alkali nitrogen lysis and fruit setting stage; (e) 40–60 cm in fruit expansion stage, soil layer quick effect P, and leaf SPAD and soluble solid substance; (f) 20–40 cm fruit expansion, P soil velocity and 40–60 cm fruit ripening, K soil velocity and soluble solid; (g) 40–60 cm in fruit expansion stage, soil layer velocity P, and leaf SPAD and peel thickness in the fruit expansion stage; and (h) 0–20 cm fruit expansion, soil P and 20–40 cm fruit expansion, and soil P and peel thickness.
Agronomy 15 01236 g012aAgronomy 15 01236 g012bAgronomy 15 01236 g012cAgronomy 15 01236 g012d
Table 1. Variable selection in input and output layers of artificial neural network model.
Output LayerInput Layer
Titratable acidA3, A8, A9, A10, A11, A12, A27, A36
Fruit shape indexA3, A16, A17, A27, A28, A29, A31, A32, A33, A34, A37, A40
Soluble solidsA8, A17, A18, A21, A33, A35, A38, A39
Peel thicknessA3, A16, A17, A18, A19, A33, A35, A38, A48
Note: A1 represents the available nitrogen content in the 0–20 cm soil layer during the fruit setting period; A2 represents the available nitrogen content in the 20–40 cm soil layer during the fruit setting period; A3 represents the available nitrogen content in the 40–60 cm soil layer during the fruit setting period; A4 represents the available phosphorus content in the 0–20 cm soil layer during the fruit setting period; A5 represents the available phosphorus content in the 20–40 cm soil layer during the fruit setting period; A6 represents the available phosphorus content in the 40–60 cm soil layer during the fruit setting period; A7 represents the available potassium content in the 0–20 cm soil layer during the fruit setting period; A8 represents the available potassium content in the 20–40 cm soil layer during the fruit setting period; A9 represents the available potassium content in the 40–60 cm soil layer during the fruit setting period; A10 represents the pH value in the 0–20 cm soil layer during the fruit setting period; A11 represents the pH value in the 20–40 cm soil layer during the fruit setting period; A12 represents the pH value in the 40–60 cm soil layer during the fruit setting period; A13 represents the available nitrogen content in the 0–20 cm soil layer during the fruit enlargement period; A14 represents the available nitrogen content in the 20–40 cm soil layer during the fruit enlargement period; A15 represents the available nitrogen content in the 40–60 cm soil layer during the fruit enlargement period; A16 represents the available phosphorus content in the 0–20 cm soil layer during the fruit enlargement period; A17 represents the available phosphorus content in the 20–40 cm soil layer during the fruit enlargement period; A18 represents the available phosphorus content in the 40–60 cm soil layer during the fruit enlargement period; A19 represents the available potassium content in the 0–20 cm soil layer during the fruit enlargement period; A20 represents the available potassium content in the 20–40 cm soil layer during the fruit enlargement period; A21 represents the available potassium content in the 40–60 cm soil layer during the fruit enlargement period; A22 represents the pH value in the 0–20 cm soil layer during the fruit enlargement period; A23 represents the pH value in the 20–40 cm soil layer during the fruit enlargement period; A24 represents the pH value in the 40–60 cm soil layer during the fruit enlargement period; A25 represents the available nitrogen content in the 0–20 cm soil layer during the fruit ripening period; A26 represents the available nitrogen content in the 20–40 cm soil layer during the fruit ripening period; A27 represents the available nitrogen content in the 40–60 cm soil layer during the fruit ripening period; A28 represents the available phosphorus content in the 0–20 cm soil layer during the fruit ripening period; A29 represents the available phosphorus content in the 20–40 cm soil layer during the fruit ripening period; A30 represents the available phosphorus content in the 40–60 cm soil layer during the fruit ripening period; A31 represents the available potassium content in the 0–20 cm soil layer during the fruit ripening period; A32 represents the available potassium content in the 20–40 cm soil layer during the fruit ripening period; A33 represents the available potassium content in the 40–60 cm soil layer during the fruit ripening period; A34 represents the pH value in the 0–20 cm soil layer during the fruit ripening period; A35 represents the pH value in the 20–40 cm soil layer during the fruit ripening period; A36 represents the pH value in the 40–60 cm soil layer during the fruit ripening period; A37 represents the SPAD value of the leaves during the fruit setting period; A38 represents the SPAD value of the leaves during the fruit enlargement period; A39 represents the SPAD value of the leaves during the fruit ripening period; A40 represents the total nitrogen content in the leaves during the fruit setting period; A41 represents the total nitrogen content in the leaves during the fruit enlargement period; A42 represents the total nitrogen content in the leaves during the fruit ripening period; A43 represents the total phosphorus content in the leaves during the fruit setting period; A44 represents the total phosphorus content in the leaves during the fruit enlargement period; A45 represents the total phosphorus content in the leaves during the fruit ripening period; A46 represents the total potassium content in the leaves during the fruit setting period; A47 represents the total potassium content in the leaves during the fruit enlargement period; A48 represents the total potassium content in the leaves during the fruit ripening period.
Table 2. Some statistical characteristics of artificial neural networks (ANNs) with different training algorithms and transfer functions for predicting the fruit shape index of Korla fragrant pear.
Training FunctionTransfer FunctionBest ModelTraining SetValidation Set
R2MAEMBEMAPERMSER2MAEMBEMAPERMSE
TrainlmTansig-Purelin12-10-10.980.0034 0.0010 0.0029 0.0073 0.96 0.0091 0.0015 0.0077 0.0125
logsig-
Purelin
12-8-10.97 0.0032 0.0014 0.0028 0.0083 0.96 0.0080 0.0003 0.0068 0.0104
TraingdTansig-Purelin12-9-10.66 0.0216 0.0029 0.1818 0.0277 0.68 0.0280 0.0029 0.0240 0.0350
logsig-
Purelin
12-10-10.46 0.0301 0.0030 0.0256 0.0389 0.32 0.0317 0.0033 0.0268 0.0401
TraingdmTansig-Purelin12-12-10.64 0.02290.0292 0.0194 0.0283 0.69 0.0268 0.0079 0.0225 0.0336
logsig-
Purelin
12-11-10.57 0.0294 0.0041 0.0249 0.0356 0.52 0.0253 0.0044 0.0213 0.0308
Table 3. Some statistical characteristics of the artificial neural network (ANN) with different training and transfer functions for predicting the thickness of Korla fragrant pear.
Training FunctionTransfer FunctionBest ModelTraining SetValidation Set
R2MAEMBEMAPERMSER2MAEMBEMAPERMSE
TrainlmTansig-
Purelin
9-9-10.920.01980.00020.01750.02890.900.02380.00420.02130.0363
logsig-
Purelin
9-9-10.900.01930.00380.01740.03240.840.02470.00730.23350.0434
TraingdTansig-
Purelin
9-9-10.540.05870.00750.05100.07170.530.04840.00400.04150.0673
logsig-
Purelin
9-12-10.450.05600.00050.04760.60700.370.06650.02500.06290.0961
TraingdmTansig-
Purelin
9-11-10.640.05010.00370.04290.06260.590.05320.01820.04410.0671
logsig-
Purelin
9-12-10.480.05290.00860.04520.06850.520.06170.01180.05600.0859
Table 4. Some statistical characteristics of artificial neural networks (ANNs) with different training algorithms and transfer functions in predicting the titratable acid of Korla fragrant pears.
Training FunctionTransfer FunctionBest ModelTraining SetValidation Set
R2MAEMBEMAPERMSER2MAEMBEMAPERMSE
TrainlmTansig-Purelin8-12-10.92 0.0659 0.0033 0.0926 0.0939 0.92 0.0611 0.0031 0.0759 0.0789
logsig-
Purelin
8-11-10.86 0.0152 0.0078 0.0131 0.0192 0.83 0.0164 0.0109 0.0142 0.0196
TraingdTansig-Purelin8-8-10.41 0.1835 0.0159 0.2355 0.2339 0.57 0.1761 0.0491 0.2080 0.2339
logsig-
Purelin
8-10-10.27 0.2111 0.0408 0.2669 0.2730 0.20 0.2308 0.0604 0.2669 0.2865
TraingdmTansig-Purelin8-8-10.34 0.1962 0.0029 0.7228 0.2648 0.56 0.1605 0.0029 0.1815 0.2012
logsig-
Purelin
8-10-10.44 0.1879 0.0025 0.2350 0.2313 0.51 0.1735 0.0297 0.1987 0.2404
Table 5. Artificial neural network (ANN) with different training and transfer functions for predicting some statistical properties of soluble solids in Korla fragrant pears.
Training FunctionTransfer FunctionBest ModelTRAINING SETValidation Set
R2MAEMBEMAPERMSER2MAEMBEMAPERMSE
TrainlmTansig-Purelin8-9-10.91 0.1829 0.0917 0.0158 0.2698 0.90 0.2542 0.0367 0.0217 0.3710
logsig-
Purelin
8-9-10.93 0.1760 0.0220 0.0151 0.2699 0.78 0.2969 0.0851 0.0260 0.4222
TraingdTansig-Purelin8-10-10.77 0.3821 0.0183 0.0320 0.4888 0.59 0.4241 0.0165 0.0371 0.5608
logsig-
Purelin
8-11-10.47 0.5724 0.0300 0.0481 0.6919 0.29 0.6626 0.1079 0.0549 0.8767
TraingdmTansig-Purelin8-9-10.52 0.5005 0.0354 0.0422 0.6557 0.46 0.6199 0.0102 0.0526 0.7835
logsig-
Purelin
8-11-10.20 0.7061 0.0215 0.0603 0.8979 0.12 0.7021 0.1672 0.0584 0.8906
Disclaimer/Publisher’s Note: The statements, opinions and data contained in all publications are solely those of the individual author(s) and contributor(s) and not of MDPI and/or the editor(s). MDPI and/or the editor(s) disclaim responsibility for any injury to people or property resulting from any ideas, methods, instructions or products referred to in the content.

