Abstract
Against the backdrop of growing climatic variability, the identification of genotypes combining high yield with stability and resilience to stress factors has become a central objective of contemporary wheat breeding. Therefore, the objective of this work was to assess the stability and adaptability of a collection of 13 wheat–wheatgrass hybrids (WWHs, lines) (Triticum aestivum L. (2n = 42)) in comparison with 10 commercial spring bread wheat (Tr. aestivum L.) cultivars under various meteorological conditions. This study was conducted in one location (Moscow region, Russia) over three growing seasons (2020, 2021, and 2022), which included a highly stressful year (2021) characterized by a severe combination of drought and heat during critical growth stages. Statistical analysis employed analysis of variance (ANOVA), clustering, and modern models for assessing the genotype-by-environment interaction (GEI)—AMMI (Additive Main Effects and Multiplicative Interaction). The results showed a significant effect of year conditions on all yield components. Under the stressful conditions of 2021, most genotypes exhibited a 30–70% decrease in productivity. Cluster analysis revealed a dynamic regrouping of genotypes depending on the conditions of the growing season. The AMMI model identified genotypes with high stability, such as Sudarinya (ASV = 9.3) and WWH 200 (ASV = 11.2), as well as genotypes specifically adapted to certain conditions: KWS Akvilon (ASV = 52.1) to stressful conditions and WWH 127 (ASV = 55.9) to favorable conditions. Under stress, lines WWH 107, WWH 127, and WWH 2430 exhibited the most adaptive strategies, including compensatory mechanisms, making these hybrids promising for further breeding. In conclusion, although wheat–wheatgrass hybrids demonstrate high productive potential under favorable conditions, their successful use in breeding requires the selection of genotypes that combine productivity and stress resistance. The identified stable and adaptive genotypes are valuable for developing new competitive cultivars under changing climatic conditions.
1. Introduction
Modern wheat breeding has significantly altered the structure of genetic diversity due to intensive selection during domestication and targeted improvement programs [1,2]. Although breeding efforts have successfully increased grain yield and related phenotypic traits through systematic selection of key genomic regions [3], recent studies have revealed alarming trends of yield stagnation in major wheat-producing regions, posing serious challenges to global food security [4,5,6,7]. This stagnation creates significant obstacles for agricultural development, especially when combined with population growth and emerging environmental constraints such as climate change, soil degradation, and pathogen evolution [4,5,8]. Addressing these challenges requires integrated approaches combining advanced agronomic practices with strategic genetic improvement [9]. In particular, the introduction of a new genetic variation from wild relatives and related species offers promising opportunities for wheat enhancement [3,10,11]. Current research demonstrates that targeted introgression of beneficial alleles can expand the genetic potential of modern cultivars, underscoring the enduring importance of broadening the crop’s genetic base for future breeding progress [3,12,13].
The genus Thinopyrum (wheatgrass) represents a valuable genetic resource for wheat breeding, serving as a donor of resistance to both abiotic (drought and salinity) and biotic (yellow rust, powdery mildew, and root rots) stresses [14,15,16]. Introgression of Thinopyrum genes into the wheat genome through recombination or chromosomal translocations enables the enrichment of its gene pool [17,18,19].
Early attempts to incorporate wild cereals into cultivated cereal breeding were driven by the desire to develop perennial varieties that could match the productivity of high-yielding commercial cultivars of rice, wheat, and sorghum while possessing the ability to grow in the same location for several years [18,20,21]. Consequently, it was demonstrated that perenniality has a polygenic nature and is controlled by multiple genes [22]. However, along with this trait, undesirable characteristics (late maturity, threshing difficulties, and others) are transferred into the cultivated cereal genome. Subsequently, some breeding programs were redirected toward other applications of wild cereal genetic diversity [23].
One of the key achievements in this direction was the creation of the synthetic species × Trititrigia cziczinii (2n = 56) by Academician N.V. Tsitsin, which combines high stress resistance, grain quality, and the ability for continuous shoot formation throughout the growing season [22,24]. This was achieved through crosses of Thinopyrum spp. with Triticum aestivum subsp. aestivum (AABBDD, 2n = 6x = 42) and Tr. turgidum subsp. durum (AABB, 2n = 4x = 28) [22]. This species possesses several morpho-biological features atypical for annual wheats: top-down maturation, high grain quality, ability to regenerate after cutting, and high resistance to abiotic and biotic stresses [22]. Trititrigia also serves as an effective “genetic bridge” for accelerated the transfer of valuable genes into wheat [25]. Successful outcomes of such breeding include the Russian winter wheat cultivars WWH 599 and WWH 189, along with a number of promising donor lines [26,27,28].
The growing unpredictability of climatic conditions, characterized by an increased frequency of droughts and heatwaves, presents substantial economic risks for farming operations. Without well-adapted varieties, inter-annual yield variability can escalate to critical extents, directly jeopardizing production profitability. Therefore, a pressing practical demand exists for crop varieties that integrate high yield potential in optimal seasons with reliable performance under abiotic stress. The goal is to use morpho-biological and yield traits analyzed with AMMI and GGE methodologies to identify genotypes characterized by either broad stability or specific adaptation.
2. Materials and Methods
2.1. Plant Material
This study utilized a set of 23 wheat genotypes, comprising 13 advanced-generation wheat–wheatgrass hybrids (hereinafter WWHs) and 10 commercial spring wheat cultivars of diverse eco-geographical origins (Table 1).

Table 1.
Characteristics and origin of the studied wheat genotypes.
2.2. Plant Growing Conditions
Studies were carried out at the Field Experimental Station of the Department of Remote Hybridization of the Tsitsin Main Botanical Garden RAS (55°85′ N, 37°03′ E) in the Moscow region from 2020 to 2022. The regional climate is moderately continental, with distinct seasons featuring warm summers and moderately cold winters, stable snow cover, and substantial year-to-year weather variability. The mean annual precipitation ranges from 550 to 650 mm, with strong interannual fluctuations (from 270 to 900 mm). Historical observations indicate that 25–30 years out of every 100 in the region are classified as drought years. The mean annual temperature is +3.7…+3.8 °C. The duration of the active plant growing season (with temperatures above +10 °C) is 138–140 days, and the accumulated temperature during this period is 2050 degree-days (°C). Detailed precipitation and temperature conditions for the years 2020, 2021, and 2022 are presented in Figure 1.
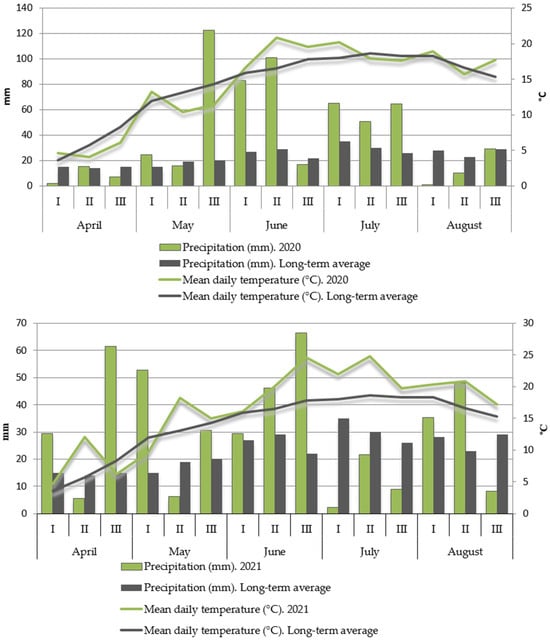
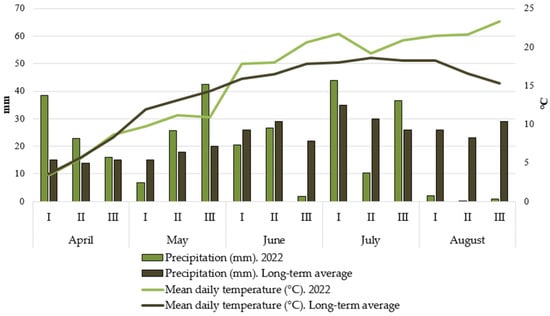
Figure 1.
Climatic conditions during the study period (2020–2022): precipitation (mm), mean daily temperature (°C), and their long-term averages (LTAs) for April–August.
The 2021 conditions are classified as stressful due to a combination of drought and heat stress during a critical developmental phase (Figure 1). Specifically, the second week of May (the seedling and tillering stage) experienced a severe precipitation deficit (less than 30% of average) coupled with air temperatures 5 °C above the long-term average.
The soil at the experimental site is soddy-podzolic medium loam. An annual agrochemical soil survey was conducted to monitor the dynamics of fertilizer elements. The results indicated that the soil is well-supplied, with mobile phosphorus (P2O5) at 150–166 mg kg−1 of soil and exchangeable potassium (K2O) at 116–119 mg kg−1 of soil. The average humus content was 1.3–1.7%, and the pH(KCl) was 4.8. The content of mineral substances and organic matter was determined by extracting mobile phosphorus (P2O5) and potassium (K2O) compounds from the soil using a 0.2 mol/dm3 hydrochloric acid solution (extractant), followed by quantitative analysis of the mobile phosphorus compounds using a photoelectrocolorimeter and potassium using a flame photometer.
The recorded area per plot in the collection nursery was 1 m2. The experiment was arranged using a randomized complete block design with three replications.
The preceding crop in all study years was bare fallow (without a sown crop). Sowing dates ranged from 28 April to 12 May, and harvesting was conducted at the grain wax-ripe stage from 27 July to 10 August (grain moisture content 14–18%). Sowing was performed using an SKS 6-10 breeding drill, which is designed for sowing individual progeny into plots with 6 rows. The seeding rate was 480 seeds m−2. These conditions correspond to a seeding density of 80 seeds per linear meter and an inter-row distance of 16.6 cm. The experiment was conducted with three replications. Nitrogen fertilizer (NH4NO3) was applied at the tillering stage at a rate of 70 kg N ha−1. Manual weeding to control annual broadleaf weeds was performed throughout the growing season.
2.3. Data Collection
Phenological observations of plant growth and development, as well as recording of yield and yield structure, were conducted in accordance with the established Methodology of State Variety Testing of Agricultural Crops [29]. Prior to the main harvest, one complete non-border row of plants with roots was manually removed from each plot and bundled into a sheaf. In the laboratory, after additional drying, the number of plants remaining at harvest in the row was counted, and 20 typical plants were selected from these rows for further analysis. The following parameters were measured for each plant: height from the soil level to the top spikelet of the ear in awnless forms or to the tip of the awns in awned forms (cm); the number of productive (bearing an ear with a grain) stems per plant; the length of each ear (cm); the number of spikelets per ear; the number of grains per ear; grain mass per ear (g); and straw mass from the entire plant (g).
Productive tillering capacity was calculated by dividing the total number of all productive stems by the total number of plants measured. Biological yield was calculated by converting the grain mass obtained from 20 plants to the number of plants remaining at harvest (in g/m2). The 1000-grain weight was calculated from the proportion of the number of grains from 20 plants to their mass (g).
2.4. Statistical Data Analysis
Data analysis was performed using the SPSS Statistics 25 (IBM, Chicago, IL, USA) software package. The Kolmogorov–Smirnov test was used to check the normality of the data distribution. Descriptive statistics included the arithmetic mean (p = 0.05), standard deviation, and coefficients of variation. For comparing inter-group means, ANOVA was used for parametric data, and the Kruskal–Wallis one-way analysis of variance was used for non-parametric data. Analysis of variance (ANOVA) was used for between-group mean comparisons. A linear mixed-effects model with the fixed factors ‘Genotype’ and ‘Year’ and the random factor ‘Block’ (Replicate) was applied to evaluate the effects of genotype and year conditions on yield-related traits. Duncan’s multiple range test was used for post hoc pairwise comparisons following significant ANOVA results. Hierarchical cluster analyses were performed for each year using the between-groups linkage method, with the squared Euclidean distance as the distance measure. For this purpose, the original data for each year were separately converted to ranks for data standardization. The relationships between closely associated traits were examined using Spearman’s correlation analysis. For all analyses, the significance level (p) was set to 0.05.
The plasticity and adaptability of genotypes were assessed using the Additive Main Effects and Multiplicative Interaction (AMMI) model and the Genotype and Genotype × Environment (GGE) interaction model in R (version 4.3.1.) using the metan (v1.18.0) and ggplot2 (v 4.0.1) packages [30,31]. The analysis was conducted with the performs_ammi() function from the metan package while applying data standardization and a two-way decomposition that excluded the replicate interaction term. Results were visualized with the plot_scores() function. The first two IPCs, cumulatively accounting for 100% of the interaction sum of squares, were retained (as per get_model_data()). Stability indices were computed with the ammi_indexes() function. The AMMI model focuses on the stability and adaptability of genotypes [32,33,34]. The formula of the AMMI model [35] is
where yge is the trait mean of genotype g in environment e, μ is the grand mean, αg is the mean genotype deviation, βe is the mean environment deviation, N is the number of PCA axes retained in the adjusted model, λn is the eigenvalue of the PCA axis (n), γgn is the genotype score for the PCA axis (n), δen is the score eigenvector for the PCA axis (n), and Qge is the residual, including the AMMI noise and pooled experimental error.
In this study, each year (2020, 2021, and 2022) was treated as an independent “environment”. This approach is justified by the fact that the meteorological conditions in these years differed radically, ranging from favorable to drought-stressed. Consequently, the AMMI model was used to analyze the “genotype × year” (G × Y) interaction, which is interpreted as a specific case of the “genotype × environment” interaction (GEI).
Stability was assessed using the AMMI stability value (ASV) [36]. A lower ASV indicates higher genotype stability under the studied conditions. Additionally, the following stability parameters were calculated: the AMMI-based stability parameter (ASTAB) [37], the AMMI stability index (ASI) [38], the sum across environments of the absolute value of the GEI modeled by AMMI (AVAMGE) [39], the sum of the averages of the squared eigenvector values (EVs) [40], stability measure based on the fitted AMMI model (FA) [41], the sum of the absolute value of the IPC scores (SIPC) [42], the absolute value of the relative contribution of IPCs to the interaction (Za) [43], and the weighted average of absolute scores (WAAS) [44]. Given the absence of a universally accepted stability index, several widely used metrics (e.g., ASTAB, ASI, and ASV) [37,38,39,40,41,42,43,44] were employed for a more robust and multifaceted evaluation. This approach enables assessing genotype stability from multiple angles and reduces bias inherent in using any single method.
3. Results
3.1. Weather Conditions
The meteorological conditions during the growing season varied significantly between the study years. In 2020, the temperature regime was close to the long-term average with minor deviations. The precipitation deficit observed throughout April and the first half of May was compensated by rainfall in May–June, which totaled three times the long-term average. This allowed the plants to develop vigorous tillering, which is uncharacteristic for the short growing season of spring wheat. Grain filling occurred under comfortable conditions of moisture availability and the temperature regime. August was dry and warm, making it favorable for timely harvesting.
The year 2021 was the most critical in terms of precipitation distribution during the growing season. Starting from mid-May, when the plants entered the tillering phase, unusually high air temperatures for the region were observed (on average 4–7 °C above long-term values). From July onwards, this was compounded by a prolonged (over 40 days) precipitation deficit. The amount of precipitation in the first ten-day period of July was 14 times lower than the long-term average (2.4 mm vs. 35 mm). An insignificant amount fell in the second ten-day period (21.7 mm), and in the third, it was three times lower than the average annual norm (9.0 mm). These conditions led to a reduction in tillering to just one productive stem on almost all plants, decreased spikelet fertility within the ear, and the formation of shriveled grains. In early August, just before the start of harvest, twice the usual amount of precipitation for that time fell. This significantly complicated harvesting and prolonged the period itself.
The year 2022 was moderate in terms of the temperature regime, without sharp fluctuations from the long-term averages. A slight moisture deficit observed in the first and third ten-day periods of June was compensated by precipitation in the subsequent periods.
3.2. Variability of Agronomically Valuable Traits
The results of the variability analysis of morpho-biological parameters of the genotypes are presented in Table 1 (Supplementary Table S1). It was established that year conditions significantly affect the main yield components (Table 2).
Table 2.
Variance components in the ANOVA model.
These differences in inter-group means are due to 2021 being highly contrasting to the conditions of 2020 and 2022. As shown in Figure 2, plant height in 2020 and 2022 was approximately equal with no significant differences (Supplementary Table S1); however, in 2021, almost all genotypes showed a 30–40% reduction in height. A similar genotypic response was observed for the number of simple spikelets in the main spike, with a 20–30% decrease in this parameter in 2021.
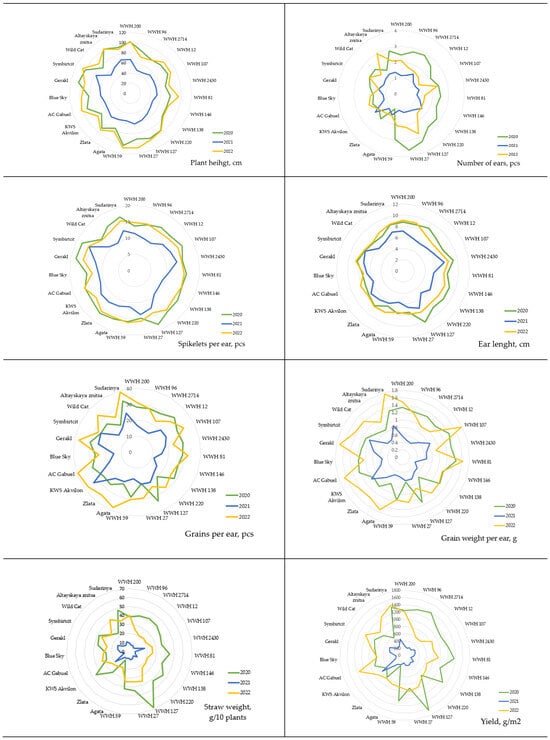
Figure 2.
Mean values of agronomically valuable traits for 10 soft spring wheat cultivars and 13 wheat–wheatgrass hybrids (WWHs) from 2020 to 2022.
All tested genotypes exhibited a medium-early maturity type. Spike formation occurred 37–45 days after sowing. The duration of the vegetative period varied between 74 days (for the cultivar Zlata in 2021) and 92 days (for BlueSky in 2020).
In 2020, wheat–wheatgrass hybrids were distinguished by high values for the number of spikes, the length of main spikes, yield, and the average straw mass compared to 2021 and 2022 and overall compared to wheat. Also in 2020, the spike length of wheat–wheatgrass hybrids exceeded that of wheat; however, in 2022 the situation was reversed. The conditions in 2022 demonstrated that the number of grains and the grain mass per spike were higher in wheat than in wheat–wheatgrass hybrids.
The yield of both wheat–wheatgrass hybrids and wheat cultivars in 2021 decreased by approximately 60–70% compared to other observation years (Figure 2 and Supplementary Table S1).
The differences range between 30 and 40% when comparing the yield of wheat–wheatgrass hybrids between 2020 and 2022. However, the yield of WWH 200 differed by only 4% between 2020 and 2022 (1244.4 g/m2 vs. 1191.4 g/m2), while WWH 220 differed by 6% (707.4 vs. 752.7 g/m2), and WWH 27 differed by 9% (913.3 vs. 997.1 g/m2). Among the wheat cultivars, KWS Akvilon was notable as it showed a 25% higher yield in the critical year compared to 2020 (762.1 vs. 608.9 g/m2), while in 2022 it reached 919.7 g/m2. The year 2022 was particularly favorable for the cultivars Agata, AC Gabuel, and Altayskaya znitsa.
The variability of traits within genotypes was low for plant height (a coefficient of variation averaging 5–15%), the number of spikelets per main spike, and the length of the main spike (5–10% in 2020 and 2022 and 11–17% in 2021). Variability at the level of 30–40% was observed for the number of main spikes, the number of grains per main spike, and the grain mass per main spike (Supplementary Table S1).
3.3. Variability of the Collection’s Cluster Structure Depending on Growing Season Conditions
Hierarchical cluster analysis, performed based on 34 quantitative traits characterizing productivity elements and plant architecture, revealed a dynamic pattern of genotype grouping that substantially depended on the conditions of the growing season (Figure 3).
Figure 3.
Dendrograms of the distribution of wheat cultivars and wheat–wheatgrass hybrids (WWHs) for 2020–2022 (hierarchical cluster analysis using the squared Euclidean distance as the distance measure and Ward’s method).
In the favorable conditions of 2020, three distinct clusters formed. Cluster 1 primarily united wheat–wheatgrass hybrids (2714, 138, 96, 107, 81, 12, 146, 200, 2430, and 127) and the wheat cultivar Sudarynya. These were characterized by high values for key productivity traits: the total number of grains on main spikes, the grain mass from all spikes, and the average grain mass from main spikes. Cluster 2 consisted exclusively of wheat cultivars (AC Gabuel, Blue Sky, Agata, KWS Akvilon, and Altajskaya zhnica). These accessions typically had low values for traits related to productive tillering, spike length, and the yield of lateral shoots. Cluster 3 was mixed and included both hybrids (27, 59, and 220) and cultivars (Zlata, Wild Cat, Simbircit, and Gerakl). This group demonstrated average values for most traits but was distinguished by a low 1000-seed weight.
During the stressful year of 2021, a significant regrouping of genotypes occurred. Cluster 1 became the largest and united accessions from different groups (hybrids 2714, 138, 220, 59, 96, 146, 107, 81, and 12 and wheat cultivars Wild Cat, Altajskaya zhnica, Agata, and AC Gabuel), which demonstrated low productivity values under stress, particularly from lateral spikes, as well as a low straw mass. The second cluster (KWS Akvilon, Gerakl, and Sudarynya) united cultivars with high values for structural elements of yield: the length of the main and lateral spikes and the grain mass from lateral spikes. The third cluster included hybrids 200, 27, 127, and 2430 and cultivars Blue Sky, Zlata, and Simbircit, with low values for traits related to the development of lateral shoots (number, length, and yield) and possessing lateral spikes of great length.
In 2022, whose conditions were similar to the favorable year 2020, the clusters again formed based on the principle of productivity, but their composition differed from that in 2020. The first cluster comprised genotypes (hybrids 2714, 138, 146, 96, 12, 220, and 2430 and the cultivar Blue Sky) with low yield across all components (main and lateral spikes). The second cluster united accessions (Agata, KWS Akvilon, Zlata, Gerakl, Wild Cat, and hybrids 107 and 81) with low values for traits related to the productivity of lateral shoots and overall tillering capacity. The third cluster (AC Gabuel, Sudarynya, Altajskaya zhnica, Simbircit, and hybrids 200, 27, 59, and 127) was the most heterogeneous and included accessions with high values for plant height.
3.4. Yield Stability of Genotypes According to the AMMI Model
ANOVA for the 13 wheat–wheatgrass hybrids and 10 wheat cultivars revealed a significant (p = 0.05) genotype-by-environment (GE) interaction for the studied accessions. The AMMI analysis decomposed the genotype-by-environment interaction (GEI) into two principal components (PCs), which together explain 100% of the trait variability. The first component (PC1) explains 80% of the variation, and the second (PC2) explains the remaining 20% (Figure 4).
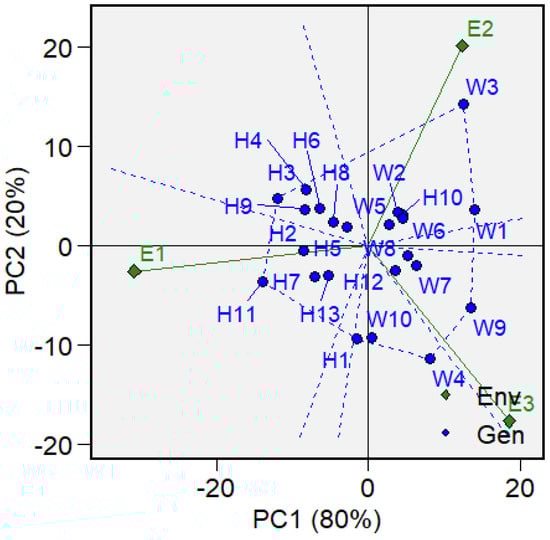
Figure 4.
Biplot of the distribution of spring wheat and wheat–wheatgrass hybrid genotypes based on the genotype-by-environment interaction using the first and second principal components (PC1 and PC2). Green diamonds represent environmental conditions, where E1: conditions of 2020, E2: conditions of 2021, and E3: conditions of 2022. Blue dots represent genotypes, where H1: WWH 200, H2: WWH 96, H3: WWH 2714, H4: WWH 12, H5: WWH 107, H6: WWH 2430, H7: WWH 81, H8: WWH 146, H9: WWH 138, H10: WWH 220, H11: WWH 127, H12: WWH 27, H13: WWH 59, W1: Agata, W2: Zlata, W3: KWS Akvilon, W4: AC Gabuel, W5: Blue Sky, W6: Gerakl, W7: Symbircit, W8: Wild Cat, W9: Altayskaya znitsa, and W10: Sudarinya.
The biplot (Figure 4) allows for the identification of the most stable genotypes as those located closer to the origin (i.e., PC1 is close to zero), while genotypes positioned closer to the environmental vectors are more specific to certain conditions (have high absolute values for PC1 and PC2) and react strongly to environmental changes. A genotype with a large positive PC1 value shows high yield under favorable conditions but performs poorly (“outsider”) under unfavorable ones, while a genotype with a large negative PC1 value shows the opposite pattern. Accordingly, the stable genotypes are Sudarinya (W10, ASV = 9.3 (Supplementary Table S2), Blue Sky (W5, ASV = 11.12), WWH 200 (H1, ASV = 11.28), and WWH 107 (H5, ASV = 11.57). The genotype KWS Akvilon (W3, ASV = 52.12) is the most specific to environments with conditions similar to 2021 (E2), while AC Gabuel (W4, ASV = 34.41) is specific to environments resembling 2022, and WWH 127 (H11, ASV = 55.96) is specific to environments similar to 2020. The smaller the angle between the environmental vector and the genotype point, the stronger the positive interaction with that environment. Genotypes and environments located close to each other in the same quadrant of the graph form a mega-environment, meaning that the genotypes respond similarly to that environment. All wheat–wheatgrass hybrids were positioned to the left of the PC1 axis, indicating that their adaptation strategy differs significantly from that of wheat.
The analysis of the biplot (Figure 5) showing the genotype distribution based on yield performance and the first principal component indicated that the highest-yielding genotypes can be considered WWH 127 (H11) and Sudarinya (W10); however, in terms of stability, WWH 127 ranks 22nd with an ASV = 55.96 (Table S2).
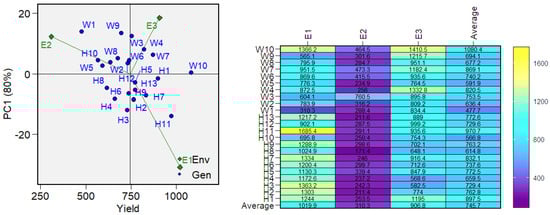
Figure 5.
Biplot of the first principal component (PC1) versus mean grain yield (g/m2). Heat map of genotype yields across each environment. Green diamonds represent environmental conditions, where E1: conditions of 2020, E2: conditions of 2021, and E3: conditions of 2022. Blue dots represent genotypes, where H1: WWH 200, H2: WWH 96, H3: WWH 2714, H4: WWH 12, H5: WWH 107, H6: WWH 2430, H7: WWH 81, H8: WWH 146, H9: WWH 138, H10: WWH 220, H11: WWH 127, H12: WWH 27, H13: WWH 59, W1: Agata, W2: Zlata, W3: KWS Akvilon, W4: AC Gabuel, W5: Blue Sky, W6: Gerakl, W7: Symbircit, W8: Wild Cat, W9: Altayskaya znitsa, and W10: Sudarinya. The Y-axis shows the mean yield, and the X-axis shows the first principal component (PC1).
4. Discussion
In 2021, the morphological parameters of the studied wheat accessions decreased by 30–40% compared to 2020 and 2022. This was facilitated by meteorological conditions during the growing season that were unfavorable for growth and development, as observed in 2021. In early May, low air temperatures (7–8 °C) persisted against a backdrop of abundant precipitation (four times higher than the long-term average), which prevented the selection of a favorable period for sowing spring cereals. During the stem elongation phase, cereals under favorable conditions form the maximum possible number of florets in the spikelets of each ear, whereas under unfavorable conditions (high temperatures and nutrient or water deficiency), pollen sterilization and the “shedding” of excess florets occur [45,46]. A temperature increase of even 1 °C during the phenophases “stem elongation,” “booting,” and “beginning of flowering” can lead to a decrease in the number of grains per ear, which is associated with limited carbohydrate supply [47]. Against the backdrop of high air temperatures and a moisture deficit during these developmental phases in 2021, spring wheat significantly reduced productive tillering and the number of fertile spikelets, affecting yield across the cultivation region [48].
The meteorological conditions of 2020 and 2022 (moderate air temperatures against stable precipitation) allowed spring wheat plants to fully realize their biological potential. Flowering, from the earliest stages of organogenesis, occurred under conditions comfortable for growth and development. Almost all accessions of wheat–wheatgrass hybrids and wheat cultivars formed a high number of productive stems and sufficient grain mass per ear. These are the two most important elements of yield structure on which the biological productivity of cereals depends [48,49].
According to the authors’ long-term observations, wheat–wheatgrass hybrids developed at the MBG typically have a longer growing season and possess an ability for high productive and total tillering, which is not characteristic of modern spring wheat cultivars whose breeding is aimed at shortening the maturation period [50]. Therefore, under contrasting meteorological conditions, their growth and development are not synchronized with the parameters of commercial spring wheat cultivars. The cultivar Akvilon is the earliest maturing crop among all studied genotypes, taking 76–84 days from emergence to maturity. This is likely why the 2021 meteorological conditions affected its productivity differently. It formed two ears on almost all plants and had a grain mass from the main ear of 1.2 g. In contrast, in all wheat–wheatgrass hybrid accessions, the number of productive stems did not exceed 1.6, and the highest mass from the main ear was 0.8 g (WWH107).
In 2020, wheat–wheatgrass hybrids were distinguished by a high number of ears, the length of main ears, yield, and the average straw mass compared to 2021 and 2022 and overall compared to commercial wheat cultivars. Also, in 2020, the ear length of wheat–wheatgrass hybrids exceeded that of wheat cultivars; however, in 2022 the situation was reversed. The conditions in 2022 showed that the number of grains and the grain mass per ear were higher in wheat cultivars than in wheat–wheatgrass hybrids. This aligns with the fact that timely moisture availability during critical phenophases promotes efficient plant nutrition, assimilates the distribution, and supports vigorous growth of the root system and shoots [51,52,53,54].
The performed cluster analysis with independent yearly data ranking revealed the dynamic nature of the studied genotypes’ grouping, highlighting the substantial influence of environmental conditions on the expression of their breeding-valuable traits. This was most evident when comparing the favorable (2020) and stressful (2021) years. In 2020, clusters were formed more homogeneously: high-yielding hybrids (Cluster 1) were clearly separated from low-yielding cultivars (Cluster 2). Under the stressful conditions of 2021, this clear boundary disappeared. High-yielding hybrids under favorable conditions (e.g., 2714, 138) moved to the cluster with low productivity (Cluster 1 in 2021), while some cultivars (Sudarynya and Gerakl), conversely, formed a cluster with high structural yield indicators (Cluster 2 in 2021). This indicates that the stress factor negated the advantages of some hybrids and simultaneously revealed a hidden resilience potential in some cultivars.
Consistent grouping was detected for some wheat–wheatgrass hybrids. Despite significant variations between years, a group of hybrids (specifically 2714, 138, 96, 146, and 12) that consistently fell into the same cluster can be identified, demonstrating a similar type of response. This suggests the presence of common genetic determinants controlling productivity under optimal conditions. Given that their cluster in 2020 and 2022 was characterized by high productivity for the main ear and total grain mass, it indicates that these hybrids managed to combine the high productive potential of wheat with a form of resilience that allowed them to realize this potential under different yearly conditions. This is consistent with research showing that Thinopyrum species are important genetic donors for wheat improvement, as they contain genes for resistance to biotic and abiotic stresses [14,18,51,55,56]. However, in 2021, only hybrids 107, 127, and 2430 managed to show average yield for the main ears, despite low yield calculated across all ears.
The AMMI analysis revealed a specificity in the adaptation of wheat–wheatgrass hybrids to environmental conditions that differs from the strategy of wheat. The key advantage of wheat–wheatgrass hybrids lies in their high growth vigor and powerful vegetative mass. In favorable years, this potential translated into high yield. In 2021, this did not happen, likely because their growth strategy was incompatible with the type of stress present that year. Bocianowski also notes that for wheat hybrids with Aegilops kotschyi Boiss. and A. variabilis Eig, AMMI models showed lower stability of the hybrids compared to the parent cultivars and old wheat cultivars [57]. In 2021, no compensatory effect was observed for hybrids 2714, 138, 96, and 81. They experienced a decrease in all parameters while maintaining inefficient vegetative mass, and a sharp drop in productivity was observed. Partial compensation occurred in hybrids 59, 107, and 2430. Despite a low plant height and a small number of grains in the main ear, hybrid 59 retained an average grain mass from lateral ears. With an average number of spikelets on the main ears and a low grain mass from lateral ears, hybrid 107 maintained average yield due to its large grain size (a high 1000-seed weight). Hybrid 2430 maintained average yield by preserving the ear structure (great length and an average number of grains in lateral ears) despite an overall low grain mass. Hybrids with effective compensation were 200 and 127, as they retained good structural indicators (ear length and the number of spikelets).
In the favorable year, some wheat cultivars were concentrated in a separate cluster (Cluster 2 in 2020) with low tillering and lateral shoot productivity. However, in the stressful year, they were distributed across different clusters. Cultivars such as KWS Akvilon and Gerakl proved to be carriers of traits related to ear size and grain filling even under unfavorable conditions, making them a valuable source of adaptive traits. The cultivar KWS Akvilon demonstrated the highest yield (762.1 g/m2) in the sample in 2021, as it possesses genetic stress resistance. It showed no compensatory effects, possessing high values for structural elements, grain size, and productivity. Gerakl showed average yield due to the performance of lateral ears (the number of spikelets per ear and the number and mass of grains), along with a very low straw mass. Sudarynya and Simbircit exhibited a compensatory effect: yield maintained at an average level was supported by suppression of vegetative mass, a reduction in the number and mass of grains from lateral ears, and relocation of assimilates to the main ear. Such effects are consistent with the work of a number of researchers indicating that under stress conditions, plants remobilize assimilates to maintain yield [18,58,59,60,61,62].
In all study years, the key traits determining cluster separation were parameters related to lateral shoots (the number of grains, grain mass, and yield from lateral ears). In favorable years, high values for these traits were characteristic of the cluster containing hybrids, whereas in the stressful year, low values for these traits were typical for the largest cluster. This confirms that the productivity of lateral shoots is a highly labile but critically important component of total yield that is strongly dependent on external environmental conditions. This aligns with data indicating that the number of lateral shoots increases in cereal crops under stress conditions [18,58].
Future research prospects involve an in-depth investigation of the promising hybrids identified (WWHs 107, 127, and 2430) using a comprehensive, multi-faceted approach. Molecular genetic profiling via whole-genome sequencing can be used to pinpoint quantitative trait loci (QTL) for yield stability and to validate introgressed Thinopyrum chromosomal segments conferring stress resilience and enhanced assimilate remobilization. Detailed physiological phenotyping can be performed under both controlled and field environments, with a focus on carbon remobilization dynamics, root system architecture, and water use efficiency (WUE). Extensive multi-location and multi-year field trials across major agro-ecological regions can be conducted to definitively assess phenotypic stability and map the specific adaptation niches of these hybrids.
Thus, this study confirms the promise of using wheat–wheatgrass hybrids (specifically hybrids 107, 127, and 2430) for further breeding towards creating stable genotypes. It should be noted, however, that while introgression increases yield potential, it frequently leads to the emergence of environmentally sensitive phenotypes; consequently, breeding programs need to address this associated stability deficit. Key criteria for future selection include a combination of adaptive strategies involving resource remobilization, compensation for yield losses through grain quality, and preservation of the structural integrity of the ear. Although the yield of some WWHs still varies greatly in unfavorable years, WWHs represent a promising developing crop, whose potential is particularly relevant in the context of a changing climate [51,63]. In this regard, enhancing the genetic diversity of wheat created by remote hybridization will help agriculturists form a set of cultivars that will ensure production profitability under the hard-to-predict conditions of the growing season.
5. Conclusions
Differences in strategies between wheat and wheat–wheatgrass hybrids: WWHs typically accumulate abundant vegetative mass. Under favorable conditions, wheat–wheatgrass hybrids realize their high productive potential across a range of morpho-productive traits. However, under stress conditions, this strategy proves ineffective, leading to a significant yield reduction in most genotypes. A key result is the identification of hybrids 107, 127, and 2430, which exhibited compensatory effects and the ability to redistribute resources under stress. This indicates the successful introgression of the wheatgrass genetic contribution, providing not only productivity but also adaptability. Meanwhile, traditional commercial wheat cultivars, such as Sudarynya and KWS Akvilon, confirmed their value as sources of specific resilience elements—effective assimilate remobilization and stability of productivity components. Breeding prospects are associated with combining the productive potential of hybrids with introgressed wheatgrass genes and the stability of wheat cultivars in a single genotype, which is particularly relevant under conditions of increasing climatic variability.
Supplementary Materials
The following supporting information can be downloaded at https://www.mdpi.com/article/10.3390/agronomy15122897/s1, Table S1: Mean trait values of wheat cultivars and wheat–wheatgrass hybrids (WWHs) in 2020–2022. Letters indicate differences in inter-group means across years for each cultivar/hybrid, identified using ANOVA with Duncan’s post hoc test. Table S2: Table with the results of AMMI analysis and various yield stability parameters for wheat cultivars and wheat–wheatgrass hybrids (WWHs). Gen: genotype, Gen_c: genotype code, Y: yield, and R: genotype rank (number when ranking the parameter); ASTAB: AMMI-based stability parameter [37]; ASI: AMMI stability index [38]; ASV: AMMI stability value [36]; AVAMGE: sum across environments of the absolute value of GEI modeled by AMMI [43]; EVs: sums of the averages of the squared eigenvector values [40]; FA: stability measure based on the fitted AMMI model [41]; SIPCs: sums of the absolute value of the IPC scores [42]; ZA: absolute value of the relative contribution of IPCs to the interaction [43]; WAAS: weighted average of absolute scores [44].
Author Contributions
Conceptualization, O.S. and T.A.; methodology, O.S. and T.A.; validation, O.S. and E.B.; formal analysis, T.A. and A.S.; investigation, T.A.; resources, O.S. and D.S.; data curation, D.S.; writing—original draft preparation, T.A.; writing—review and editing, O.S.; visualization, E.B. and A.S.; supervision, E.B.; project administration, O.S.; funding acquisition, O.S. and A.S. All authors have read and agreed to the published version of the manuscript.
Funding
This study was partially supported by the Ministry of Science and Higher Education of the Russian Federation: State Assignment No. 123120600005-2 (S.O.A., T.S.A., S.D.A., and E.N.B.), FNRN-2019-061 (FRS A.S.) and FGUM-2025-0003 (ARRIAB E.N.B.). The APC was funded by the authors.
Data Availability Statement
Data are contained within the article and Supplementary Materials.
Acknowledgments
The authors have reviewed and edited the output and take full responsibility for the content of this publication.
Conflicts of Interest
The authors declare no conflicts of interest.
References
- Voss-Fels, K.; Frisch, M.; Qian, L.; Kontowski, S.; Friedt, W.; Gottwald, S.; Snowdon, R.J. Subgenomic diversity patterns caused by directional selection in bread wheat gene pools. Plant Genome 2015, 8, 2. [Google Scholar] [CrossRef]
- Balfourier, F.; Bouchet, S.; Robert, S.; De Oliveira, R.; Rimbert, H.; Kitt, J.; Choulet, F.; Paux, E. Worldwide phylogeography and history of wheat genetic diversity. Sci. Adv. 2019, 5, eaav0536. [Google Scholar] [CrossRef]
- Hao, M.; Zhang, L.; Ning, S.; Huang, L.; Yuan, Z.; Wu, B.; Yan, Z.; Dai, S.; Jiang, B.; Zheng, Y.; et al. The Resurgence of Introgression Breeding, as Exemplefied in Wheat Improvement. Front. Plant Sci. 2020, 11, 252. [Google Scholar] [CrossRef]
- Lin, M.; Huybers, P. Reckoning wheat yield trends. Environ. Res. Lett. 2012, 7, 024016. [Google Scholar] [CrossRef]
- Hochman, Z.; Gobbett, D.L.; Horan, H. Climate trends account for stalled wheat yields in Australia since 1990. Glob. Change Biol. 2017, 23, 2071–2081. [Google Scholar] [CrossRef]
- Tadesse, W.; Sanchez-Garcia, M.; Assefa, S.G.; Amri, A.; Bishaw, Z.; Ogbonnaya, F.C.; Baum, M. Genetic gains in wheat breeding and its role in feeding the world. Crop Breed. Genet. Genom. 2019, 1, e190005. [Google Scholar] [CrossRef]
- Senapati, N.; Semenov, M.A. Large genetic yield potential and genetic yield gap estimated for wheat in Europe. Glob. Food Secur. 2020, 24, 100340. [Google Scholar] [CrossRef]
- FAO. The future of food and agriculture–Trends and challenges. In Annual Report; Food and Agriculture Organization (FAO): Rome, Italy, 2017; p. 296. Available online: https://openknowledge.fao.org/server/api/core/bitstreams/2e90c833-8e84-46f2-a675-ea2d7afa4e24/content (accessed on 16 September 2025).
- Baum, M.; Tadesse, W.; Nachit, M.; Abdalla, O.; Rajaram, S.; Singh, R.; Braun, H. Global crop improvement networks to bridge technology gaps. In Advances in Wheat Genetics: From Genome to Field: Proceedings of the 12th International Wheat Genetics Symposium; Springer: Tokyo, Japan, 2015; pp. 387–399. [Google Scholar]
- Boehm, J., Jr.; Cai, X. Enrichment and diversification of the wheat genome via alien introgression. Plants 2024, 13, 339. [Google Scholar] [CrossRef]
- Johansson, E.; Lan, Y.; Olalekan, O.; Kuktaite, R.; Chawade, A.; Rahmatov, M. Alien introgression to wheat for food security: Functional and nutritional quality for novel products under climate change. Front. Nutr. 2024, 11, 1393357. [Google Scholar] [CrossRef]
- Pshenichnikova, T.A.; Simonov, A.V.; Ermakova, M.F.; Chistyakova, A.K.; Shchukina, L.V.; Morozova, E.V. The effects on grain endosperm structure of an introgression from Aegilops speltoides Tausch. into chromosome 5A of bread wheat. Euphytica 2010, 175, 315–322. [Google Scholar] [CrossRef]
- Borrill, P.; Harrington, S.A.; Uauy, C. Applying the latest advances in genomics and phenomics for trait discovery in polyploid wheat. Plant J. 2019, 97, 56–72. [Google Scholar] [CrossRef]
- Li, H.; Conner, R.L.; Murray, T.D. Resistance to soil-borne diseases of wheat: Contributions from the wheatgrasses Thinopyrum intermedium and Th. ponticum. Can. J. Plant Sci. 2008, 88, 195–205. [Google Scholar] [CrossRef]
- He, R.; Chang, Z.; Yang, Z.; Yuan, Z.; Zhan, H.; Zhang, X.; Li, J. Inheritance and mapping of powdery mildew resistance gene Pm43 introgressed from Thinopyrum intermedium into wheat. Theor. Appl. Genet. 2009, 118, 1173–1180. [Google Scholar] [CrossRef] [PubMed]
- Guo, X.; Huang, Y.; Wang, J.; Fu, S.; Wang, C.; Wang, M.; Zhou, C.; Hu, X.; Wang, T.; Yang, W.; et al. Development and cytological characterization of wheat—Thinopyrum intermedium translacotion lines with novel stripe rust resistance gene. Front. Plant Sci. 2023, 14, 1135321. [Google Scholar] [CrossRef]
- Luo, Z.; Chen, F.; Feng, D.; Xia, G. LMW-GS genes in Agropyron elongatum and their potential value in wheat breeding. Theor. Appl. Genet. 2005, 111, 272–280. [Google Scholar] [CrossRef] [PubMed]
- Cui, L.; Ren, Y.; Murray, T.; Yan, W.; Qing, G.; Niu, Y.; Sun, Y.; Li, H. Development of Perennial Wheat Through Hybridization Between Wheat and Wheatgrasses: A Review. Engineering 2018, 4, 507–513. [Google Scholar] [CrossRef]
- Kroupyn, P.Y.; Divashuk, M.G.; Karlov, G.I. Gene resources of perennial wild cereals involved in breeding to improve wheat crop. Agric. Biol. 2019, 54, 409–425. [Google Scholar] [CrossRef]
- Cox, T.S.; Van Tassel, D.L.; Cox, C.M.; DeHaan, L.R. Progress in breeding perennial grains. Crop Pasture 2010, 61, 513–521. [Google Scholar] [CrossRef]
- Korostyleva, T.V.; Shiyan, A.N.; Odintsova, T.I. The genetic resource of Thinopyrum elongatum (Host) D.R. Dewer in breeding improvement of wheat. Genetics 2023, 59, 1112–1119. [Google Scholar] [CrossRef]
- Morgounov, A.; Shchuklina, O.; Pototskaya, I.; Aydarov, A.; Shamanin, V. Perennial Grains in Russia: History, Status, and Perspectives. Crops 2025, 5, 46. [Google Scholar] [CrossRef]
- Shamanin, V.P.; Morgounov, A.I.; Aydarov, A.N.; Shepelev, S.S.; Chursin, A.S.; Pototskaya, I.V.; Khamova, O.F.; Dehaan, L.R. Large-Grained Wheatgrass variety Sova (Thinopyrum intermedium) as an alternative to perennial wheat. Agric. Bilogi. 2021, 56, 450–464. [Google Scholar] [CrossRef]
- Ivanova, L.P.; Shchuklina, O.A.; Voronchikhina, I.N.; Voronchikhin, V.V.; Zavgorodniy, S.V.; Enzekrei, E.S.; Komkova, A.D.; Upelniek, V.P. Prospects for the use of a new agricultural crop of Trititrigia (Trititrigia Cziczinii Tsvelev) in fodder production. Feed Prod. 2020, 10, 13–16. [Google Scholar]
- Trifonova, A.A.; Boris, K.V.; Dedova, L.V.; Melnik, V.A.; Ivanova, L.P.; Kuzmina, N.P.; Zavgorodniy, S.V.; Upelniek, V.P. Genome polymorphism of the synthetic species Trititrigia cziczinii Tsvel. inferred from AFLP analysis. Vavilov J. Gen. Breed. 2018, 22, 648–653. [Google Scholar] [CrossRef]
- Salina, E.A.; Adonina, I.G.; Badaeva, E.D.; Kroupin, P.Y.; Stasyuk, A.I.; Leonova, I.N.; Shishkina, A.A.; Divashuk, M.G.; Starikova, E.V.; Khuat, T.M.; et al. A Thinopyrum intermedim chromocome in bread wheat cultivars as a source of genes conferring resistance to fungal diseases. Euphytica 2014, 204, 91–101. [Google Scholar] [CrossRef]
- Sibikeev, S.N.; Badaeva, E.D.; Gultyaeva, E.L.; Druzhin, A.E.; Shishina, A.A.; Dragovich, A.Y.; Kroupin, P.Y.; Karlov, G.I.; Khuat, T.M.; Divashuk, M.G. Comparative Analysis of Agropyron intermedium (Host) Beauv 6Agi and 6Agi2 Chromosomes in Bread Wheat Cultivars and Lines with Wheat-Wheatgrass Substitutions. Genetics 2017, 53, 298–309. [Google Scholar] [CrossRef]
- Protasova, I.M.; Aniskina, T.S.; Gulevich, A.A.; Shchuklina, O.A.; Baranova, E.N. Can Kernel Uniformity Indices Be Used as Criteria for Variability Assessment of Wheat Breeding Lines? Appl. Sci. 2024, 14, 11885. [Google Scholar] [CrossRef]
- Methods of State Variety Testing of Agricultural Crops, 1st ed.; LLC “More Group of Companies”: Moscow, Russia, 2019; p. 384. Available online: https://gossortrf.ru/upload/2019/08/metodica_1.pdf (accessed on 10 September 2025).
- Zobel, R.W.; Wright, M.J.; Gauch, H.G. Statistical analysis of a yield trial. Agron. J. 1988, 80, 388–393. [Google Scholar] [CrossRef]
- Gauch, H.G. Statistical analysis of yield trials by AMMI and GGE. Crop Sci. 2006, 46, 1448–1500. [Google Scholar] [CrossRef]
- Crossa, J. Statistical analysis of multilocation trials. Adv. Agron. 1990, 44, 55–85. [Google Scholar] [CrossRef]
- Zulqarnain, H.; Muhammad, A.; Abid, M.; Rana, A.R.K. Comparison of GGE biplot and AMMI analysis of multi-environment trial (MET) data to assess adaptability and stability of rice genotypes. Afr. J. Agric. Res. 2017, 12, 3542–3548. [Google Scholar] [CrossRef]
- Kebede, D.; Dagnachewd, L.; Megersa, B.; Chemeda, M.; Geleta Gudeta, G. Genotype by environment interaction and grain yield. Afr. Crop Sci. J. 2019, 27, 281–294. [Google Scholar] [CrossRef]
- Nowosad, K.; Liersch, A.; Popławska, W.; Bocianowski, J. Genotype by environment interaction for seed yield in rapeseed (Brassica napus L.) using additive main effects and multiplicative interaction model. Euphytica 2016, 208, 187–194. [Google Scholar] [CrossRef]
- Purchase, J.L.; Hatting, H.; van Deventer, C.S. Genotype × environment interaction of winter wheat (Triticum aestivum L.) in South Africa: II. Stability analysis of yield performance. S. Afr. J. Plant Soil 2000, 17, 101–107. [Google Scholar] [CrossRef]
- Rao, A.R.; Prabhakaran, V.T. Use of AMMI in simultaneous selection of genotypes for yield and stability. J. Indian Soc. Agric. Stat. 2005, 59, 76–82. [Google Scholar]
- Jambhulkar, N.N.; Rath, N.C.; Bose, L.K.; Subudhi, H.N.; Biswajit, M.; Lipi, D.; Meher, J. Stability analysis for grain yield in rice in demonstrations conducted during rabi season in India. Oryza 2017, 54, 236–240. [Google Scholar] [CrossRef]
- Zhang, Z.; Lu, C.; Xiang, Z. Analysis of variety stability based on AMMI model. Acta Agron. Sin. 1998, 24, 304–309. [Google Scholar]
- Zobel, R.W. Stress resistance and root systems. In Proceedings of the Workshop on Adaptation of Plants to Soil Stress, Lincoln, NE, USA, 1–4 August 1993; Institute of Agriculture and Natural Resources, University of Nebraska-Lincoln: Lincoln, NE, USA, 1993; pp. 80–99, INTSORMIL Publication 94-2. [Google Scholar]
- Raju, B.M.K. A study on AMMI model and its biplots. J. Indian Soc. Agric. Stat. 2002, 55, 297–322. [Google Scholar]
- Sneller, C.H.; Kilgore-Norquest, L.; Dombek, D. Repeatability of yield stability statistics in soybean. Crop Sci. 1997, 37, 383–390. [Google Scholar] [CrossRef]
- Zali, H.; Farshadfar, E.; Sabaghpour, S.H.; Karimizadeh, R. Evaluation of genotype × environment interaction in chickpea using measures of stability from AMMI model. Ann. Biol. Res. 2012, 3, 3126–3136. [Google Scholar]
- Olivoto, T.L.; Ucio, A.D.C.; Silva, J.A.G. Mean Performance and Stability in Multi-Environment Trials I: Combining Features of AMMI and BLUP Techniques. Agron. J. 2019, 111, 2949–2960. [Google Scholar] [CrossRef]
- Barnabás, B.; Jäger, K.; Fehér, A. The effect of drought and heat stress on reproductive processes in cereals. Plant Cell Environ. 2008, 31, 11–38. [Google Scholar] [CrossRef] [PubMed]
- Rumyantseva, N.I.; Valieva, A.I.; Akulov, A.N.; Askhadullin, F.; Askhadullin, F.; Vasilova, N.Z. Drought and high temperatures effect on yield and grain quality of purple-grain lines of spring soft wheat. Biomics 2021, 13, 254–273. [Google Scholar] [CrossRef]
- Ahmed, K.; Shabbir, G.; Ahmed, M.; Shah, K.N. Phenotyping for drought resistance in bread wheat using physiological and biochemical traits. Sci. Total Environ. 2020, 729, 139082. [Google Scholar] [CrossRef]
- Nadzhodov, B.B.; Rubets, V.S.; Pylnev, V.V.; Voronchikhina, I.N. Meteorological effect on the formation of economic traits of spring wheat in the Central Non-chernozem region. Proc. Timiryazev Agric. Acad. 2023, 6, 47–64. [Google Scholar] [CrossRef]
- Voronchikchina, I.N.; Rubets, V.S.; Voronchichin, V.V.; Pylnev, V.V. Comprehensive assessment of spring soft wheat in terms of CRNZ by index method. Agric. Ecol. Inf. 2022, 6, 14. [Google Scholar] [CrossRef]
- Schuklina, O.; Enzekrei, E.; Zavgorodniy, S.; Ermolenko, O.; Voronchihina, I.; Klimenkov, F.; Klimenkova, I.; Polkhovskiy, A. Retrospective of Spring Wheat-couch Hybrids Breeding in the Department of Remote Hybridization MBG RAS. Adv. Biol. Sci. Res. 2019, 7, 372–375. [Google Scholar] [CrossRef]
- Culman, S.W.; Snapp, S.S.; Ollenburger, M.; Basso, B.; DeHaan, L.R. Soil and water quality rapidly responds to the perennial grain Kernza wheatgrass. Agron. J. 2013, 105, 735–744. [Google Scholar] [CrossRef]
- Yang, J.P.; Lv, Z.Y.; Diao, M.; Li, W.H.; Jiang, D. Accumulation and distribution of dry matter in plants and their contribution to grain yield in drip-irrigated spring wheat. Acta Agric. Boreali-Occident. Sin. 2020, 30, 50–59. [Google Scholar]
- Golan, G.; Weiner, J.; Zhao, Y.; Schnurbusch, T. Agroecological genetics of biomass allocation in wheat uncovers genotype interactions with canopy shade and plant size. New Phytol. 2024, 242, 107–120. [Google Scholar] [CrossRef] [PubMed]
- Jing, J.; Li, Z.; Qian, F.; Chang, X.; Li, W. Effects of different drip irrigation patterns on grain yield and population structure of different water-and fertilizer-demanding wheat (Triticum aestivum L.) Varieties. Agronomy 2023, 13, 3018. [Google Scholar] [CrossRef]
- Chen, Q. Detection of alien chromatin introgression from Thinopyrum into wheat using S genomic DNA as a probe–A landmark approach for Thinopyrum genome research. Cytogenet. Genome Res. 2005, 109, 350–359. [Google Scholar] [CrossRef]
- Gazza, L.; Galassi, E.; Ciccoritti, R.; Cacciatori, P.; Pogna, N.E. Qualitative traits of perennial wheat lines derived from different Thinopyrum species. Genet. Resour. Crop Evol. 2016, 63, 209–219. [Google Scholar] [CrossRef]
- Bocianowski, J.; Prażak, R. Genotype by year interaction for selected quantitative traits in hybrid lines of Triticum aestivum L. with Aegilops kotschyi Boiss. and Ae. variabilis Eig. using the additive main effects and multiplicative interaction model. Euphytica 2022, 218, 11. [Google Scholar] [CrossRef]
- Fisenko, A.; Kuz’mina, N.; Upelniek, V. Struktura urozhaya ozimykh pshenichno-pyrejnykh gibridov v srednej polose Rossii. Agrar. Russ. 2017, 9–13. [Google Scholar] [CrossRef]
- Siddhi, S.; Patel, J.; Patel, N. Stability analysis in bread wheat (Triticum aestivum L.). J. Pharmacogn. Phytochem. 2018, 7, 290–297. [Google Scholar]
- Xu, Z.; Lai, X.; Ren, Y.; Yang, H.; Wang, H.; Wang, C.; Zhang, Y. Impact of drought stress on yield-related agronomic traits of different genotypes in spring wheat. Agronomy 2023, 13, 2968. [Google Scholar] [CrossRef]
- Blum, A.; Sinmena, B.; Mayer, J.; Golan, G.; Shpiler, L. Stem reserve mobilisation supports wheat-grain filling under heat stress. Funct. Plant Biol. 1994, 21, 771–781. [Google Scholar] [CrossRef]
- Rehman, H.U.; Tariq, A.; Ashraf, I.; Ahmed, M.; Muscolo, A.; Basra, S.M.; Reynolds, M. Evaluation of physiological and morphological traits for improving spring wheat adaptation to terminal heat stress. Plants 2021, 10, 455. [Google Scholar] [CrossRef]
- Poggi, G.M.; Aloisi, I.; Corneti, S.; Esposito, E.; Naldi, M.; Fiori, J.; Piana, S.; Ventura, F. Climate change effects on bread wheat phenology and grain quality: A case study in the north of Italy. Front. Plant Sci. 2022, 13, 936991. [Google Scholar] [CrossRef]
Disclaimer/Publisher’s Note: The statements, opinions and data contained in all publications are solely those of the individual author(s) and contributor(s) and not of MDPI and/or the editor(s). MDPI and/or the editor(s) disclaim responsibility for any injury to people or property resulting from any ideas, methods, instructions or products referred to in the content. |
© 2025 by the authors. Licensee MDPI, Basel, Switzerland. This article is an open access article distributed under the terms and conditions of the Creative Commons Attribution (CC BY) license (https://creativecommons.org/licenses/by/4.0/).