Article

Combined Application of Acidic Phosphate Fertilizers Improves Drip-Irrigated Soybean Yield and Phosphorus Utilization Efficiency in Liming Soil

1
Agricultural College, Shihezi University, Shihezi 832003, China
2
State Key Laboratory of Green and Efficient Development of Phosphorus Resources, Guiyang 550081, China
3
Guizhou Phosphate Chemical Group Co., Ltd. Guiyang 550081, China
*
Authors to whom correspondence should be addressed.
These authors contributed equally to this work.
Agronomy 2025, 15(12), 2852; https://doi.org/10.3390/agronomy15122852
Submission received: 9 November 2025 / Revised: 7 December 2025 / Accepted: 9 December 2025 / Published: 11 December 2025

Abstract

Phosphorus (P) characteristics significantly affect crop yield and P use efficiency (PUE). It is unclear whether different types of acidic phosphate fertilizers can enhance the availability of phosphorus in liming soil and soybean yields. In this field experiment in 2022 and 2023 in Xinjiang, China, four phosphate fertilization treatments, including no phosphate fertilization (CK), application of monoammonium phosphate (MAP), application of urea phosphate (UP), and application of a mixture of monoammonium phosphate and urea phosphate (8:2, M8U2), were designed. Then, the impacts of the four phosphate treatments on the PUE, growth, and yield of the high-oil soybean variety Kennong 23 under drip irrigation were explored. The results showed that the application of phosphate fertilizers significantly increased the soil inorganic P, available P, and total P content compared with CK, promoting the growth and yield formation of soybeans. The soil Ca2-P content of the UP treatment was higher than that of the MAP treatment. The soil Ca8-P content of the M8U2 treatment was higher than that of the MAP treatment, but the soil phosphorus fixation was lower. The soil available P content, soybean plant P accumulation, leaf photosynthetic capacity, and dry matter accumulation all reached the maximum in the M8U2 treatment. The soybean yield, net revenue, and PUE of the M8U2 treatment were 6.04%, 9.37%, and 14.16% higher than those of the MAP treatment, and 7.64%, 16.59%, and 23.50% higher than those of the UP treatment, respectively. Therefore, the combined application of acidic phosphate fertilizers (MAP and UP) can increase soil available P content and plant P absorption in liming soil and stimulate photosynthesis, enhancing soybean yield and PUE. This study will provide a technical reference for the P reduction and soybean yield enhancement in arid areas.

1. Introduction

Phosphorus (P) is an essential element for crop growth [1,2,3]. Currently, the phosphorus use efficiency (PUE) of most crops is low, ranging from 10% to 15% [4]. Phosphate fertilizer mainly comes from phosphate ore. However, global phosphorus reserves may be depleted within the next 70–300 years [5]. Therefore, improving the PUE is of great significance for food safety and sustainable agricultural development.
The efficiency of phosphorus utilization is influenced by a range of factors. Key among these are soil physicochemical properties. In calcareous soils, phosphorus is readily fixed by Ca2+, whereas in acidic soils, fixation predominantly occurs with Fe3+ and Al3+ [6,7,8]. Furthermore, clayey soils exhibit a strong phosphorus adsorption capacity, while sandy soils carry a high risk of phosphorus loss via leaching [9].
In addition to soil properties, the chemical form and solubility of the phosphorus source significantly affect its availability. Research indicates that for maize, the highest phosphorus uptake efficiency in neutral soil is achieved with diammonium phosphate (DAP), whereas in acidic soil, calcium magnesium phosphate (CMP) is most effective [10]. Compared to monoammonium phosphate (MAP, NH4H2PO4), the application of ammonium polyphosphate (APP, (NH4)n+2PnO3n+1) in calcareous soil results in greater phosphorus mobility. Urea phosphate (UP, H3PO4·CO(NH2)2), on the other hand, tends to lower soil pH. Both APP and UP have been shown to enhance PUE in maize [11].
Soybeans are a typical crop with high P demand. Sufficient P supply is crucial for the yield and quality formation of soybeans [12,13]. In recent years, the soybean yields in Xinjiang, China, have continuously set a national record (7126.2 kg hm−2). However, the average yield of soybeans in Xinjiang is only 2382 kg hm−2. At present, 70% of the arable land in Xinjiang is liming soil. Most farmers use traditional P fertilizers such as MAP and DAP, which limit soybean growth and P absorption under liming soil conditions and finally affect yield [14]. Can the strong acidity of UP be utilized to reduce the pH of soybean root-zone soil to alleviate the alkaline stress while supplementing P for rapid soybean growth? This study hypothesized that the combined application of different phosphorus sources might enhance the P availability in liming soil, soybean PUE, growth, and yield formation. Therefore, this study investigated the effects of the combined application of MAP and UP on soil P availability, soybean photosynthetic capacity, yield, and PUE of soybeans under drip irrigation conditions. This study will provide a technical reference for the P reduction, P sustainable utilization, and soybean yield enhancement in arid areas.

2. Materials and Methods

2.1. Test Site

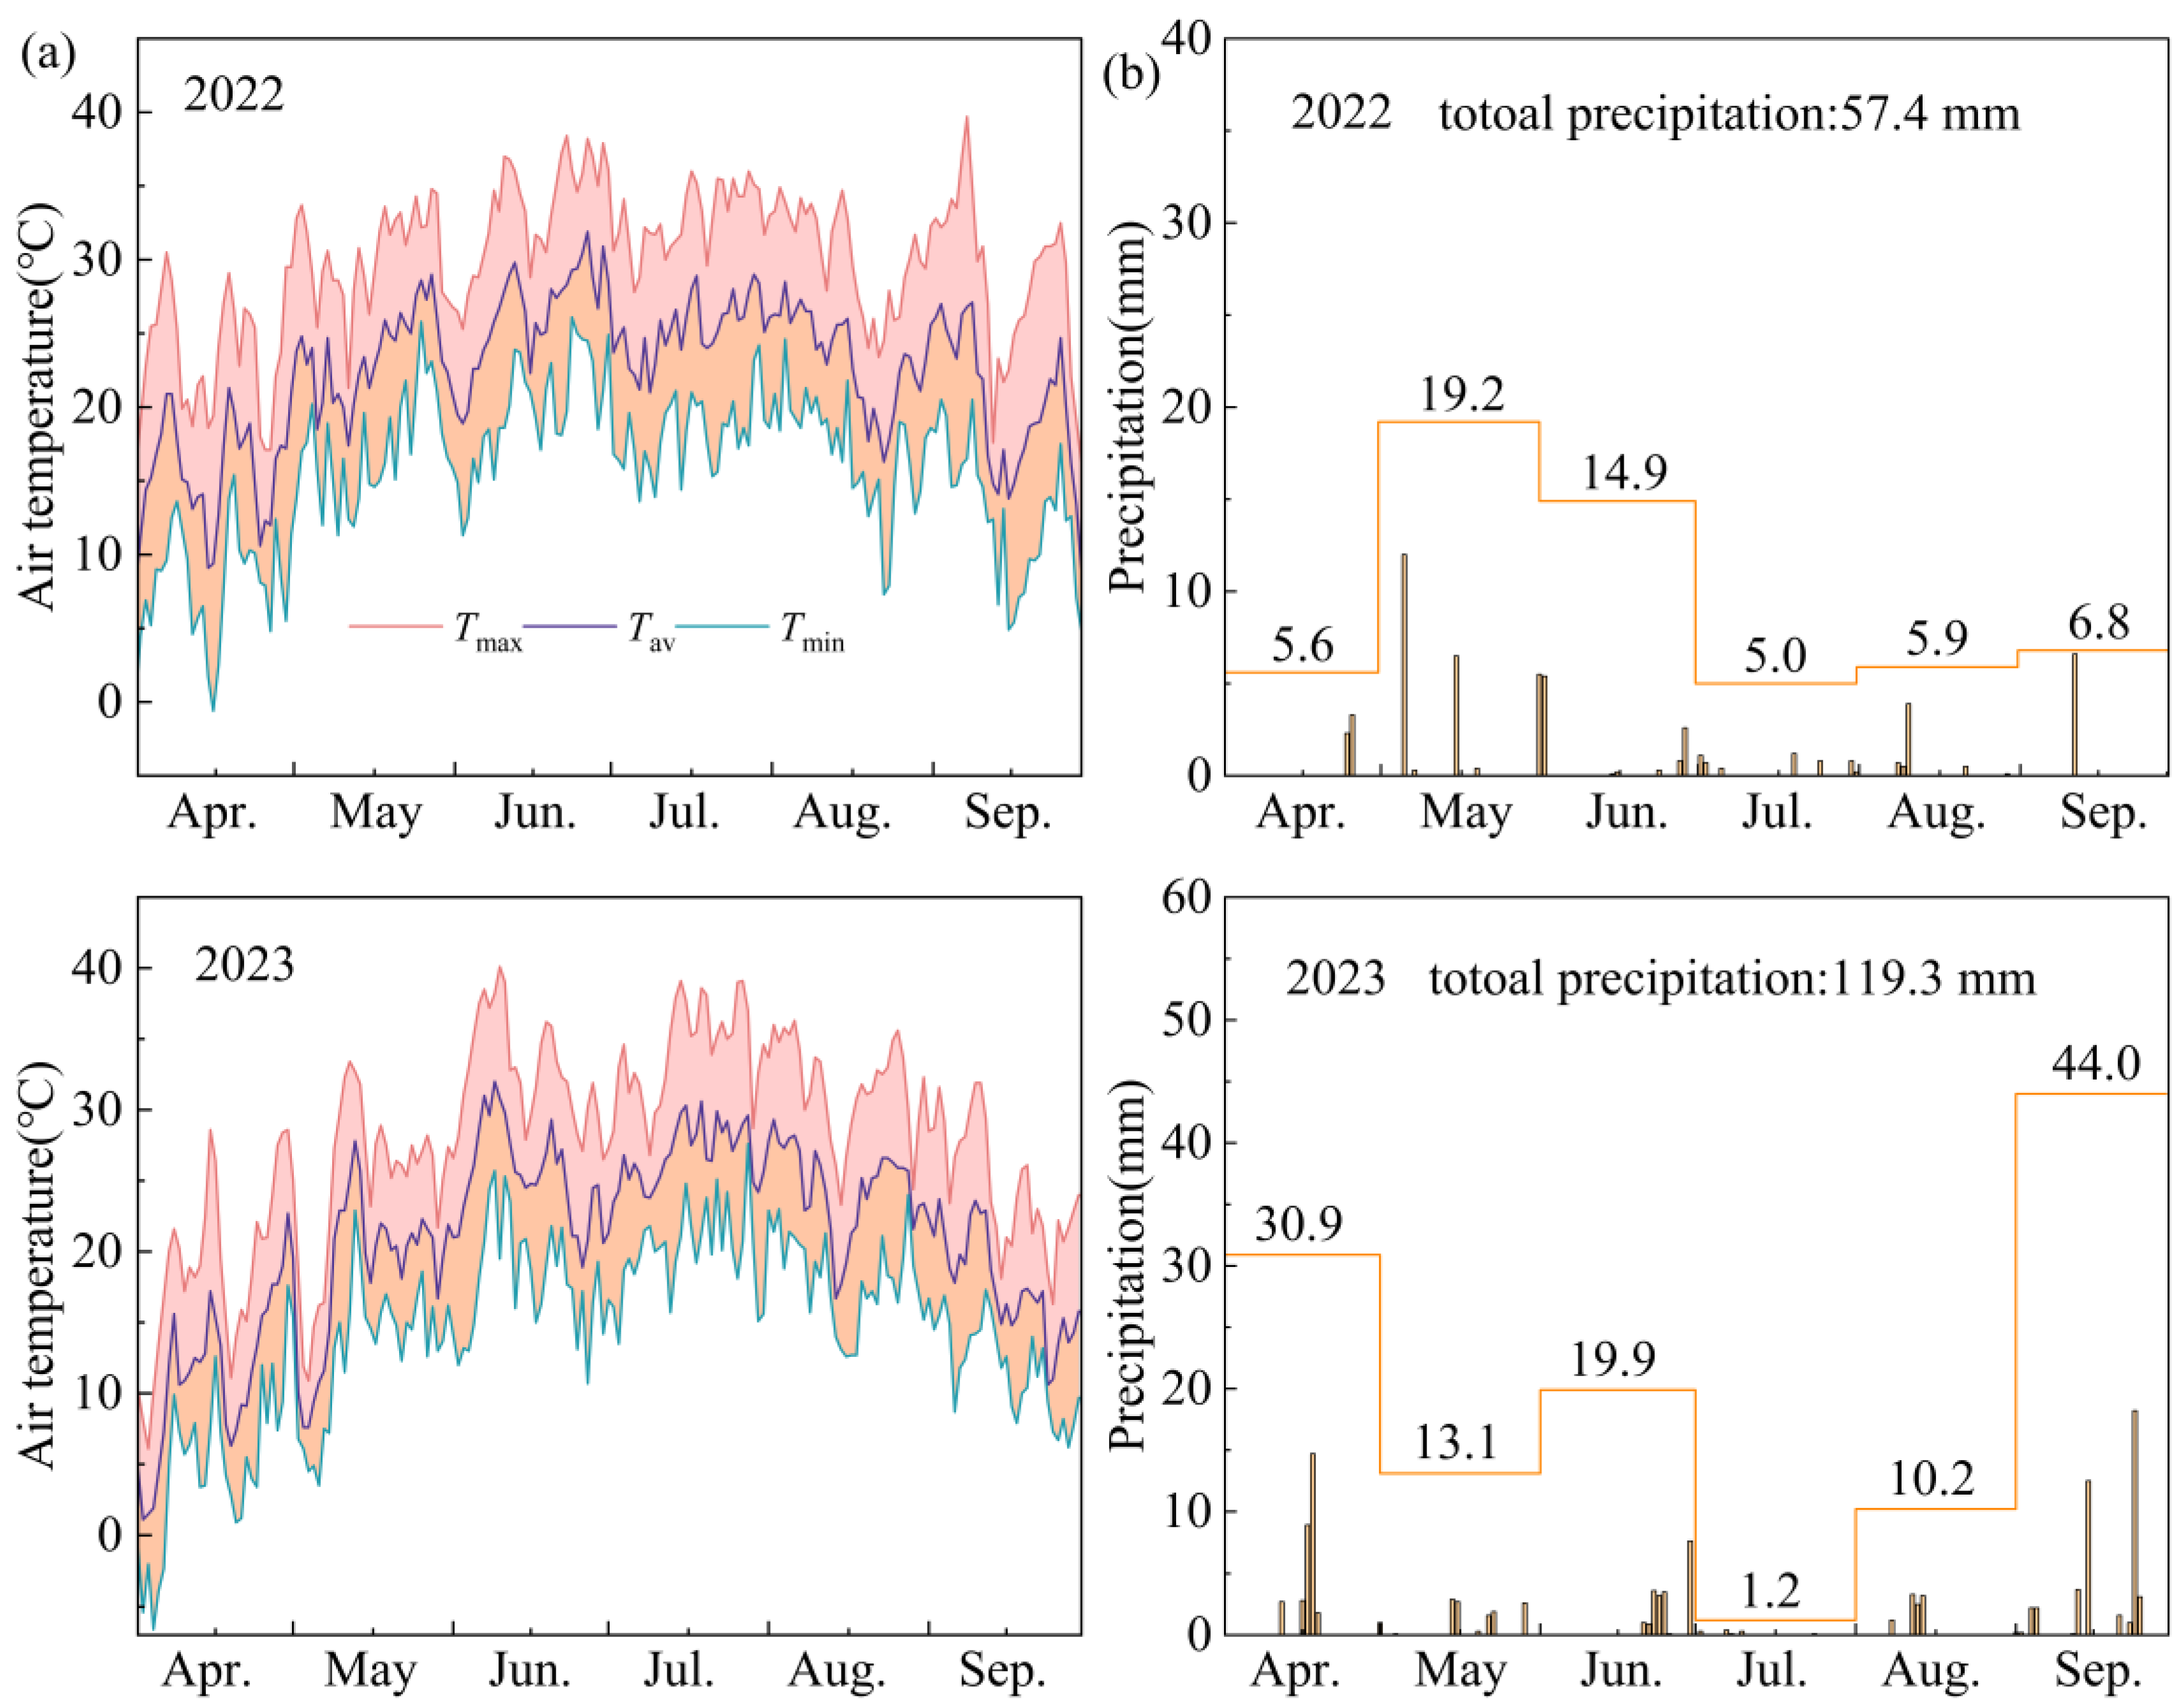
The experiment was conducted in 2022 and 2023 at the Wulanwusu Agricultural Meteorological Experiment Station (44°17′52.6″ N, 85°51′45.8″ E) of the Shihezi Meteorological Bureau in Xinjiang Uygur Autonomous Region, China. This area has a temperate continental climate, with the precipitation mainly concentrated in May–August. The temperature and precipitation during the soybean growing season were recorded by the automatic weather station near the experimental site. The precipitation, daily maximum temperature, minimum temperature, and average temperature during the soybean growing season are shown in Figure 1. According to the World Reference Base for Soil Resources, the soil type was Calcisols, and the soil texture was clay loam. Before sowing, the 0–20 cm soil layer of the experimental site was collected for the analysis of physicochemical properties (soil pH was determined using a water to soil ratio of 1:2.5) (Table 1).

2.2. Experimental Design

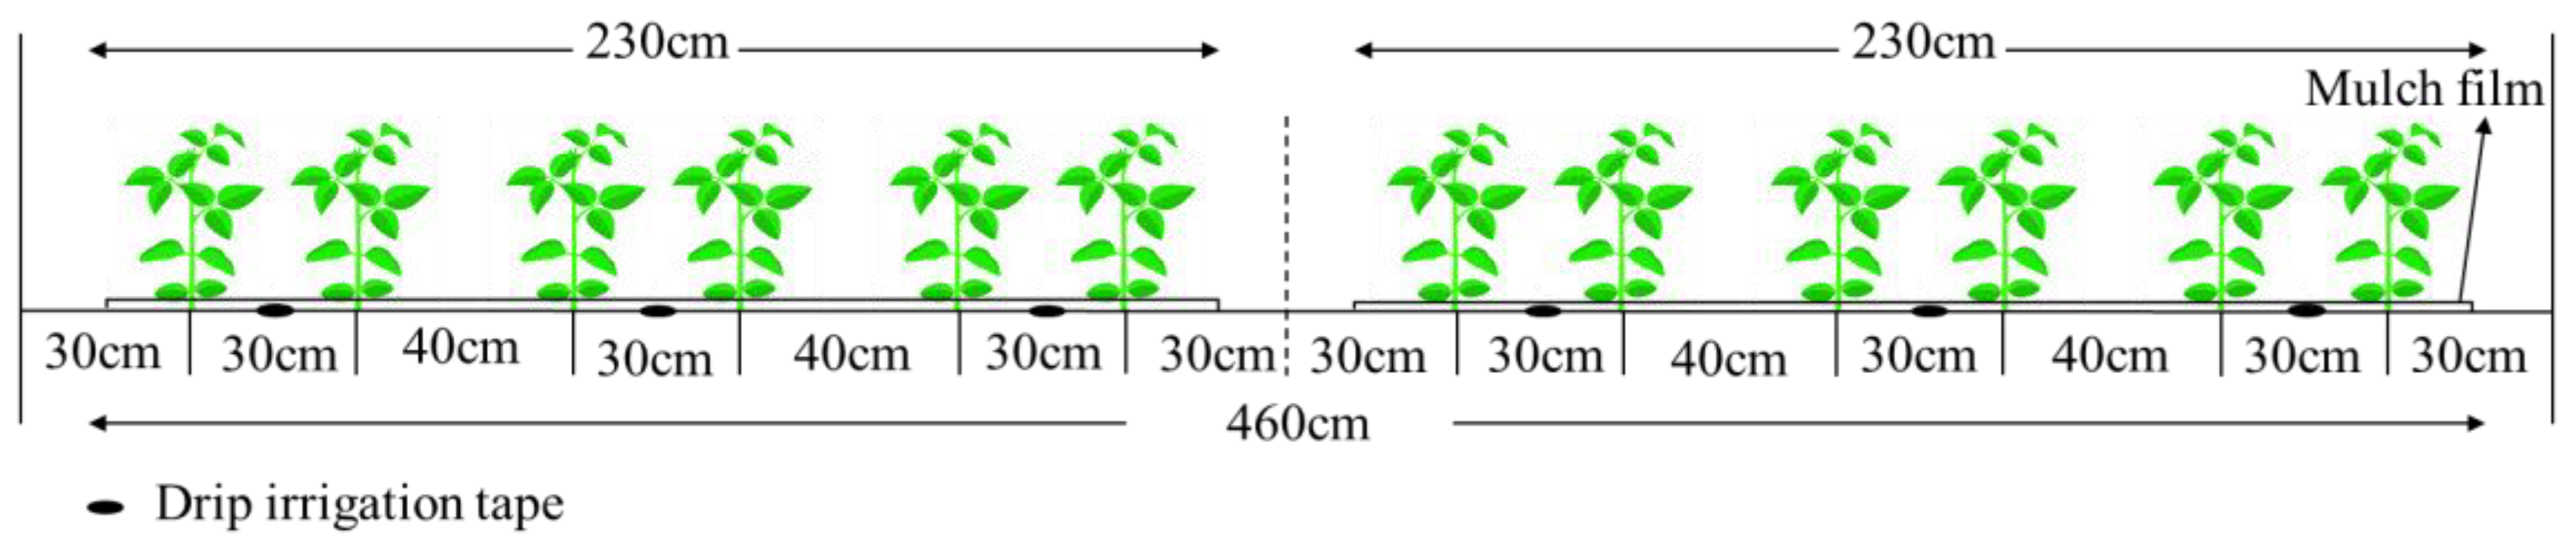
The experiment adopted a completely randomized block design with four treatments, including no phosphate fertilization (CK), application of monoammonium phosphate (12–60-0, MAP), application of urea phosphate (17–44-0, UP), and application of a mixture of MAP and UP (8:2, M8U2, calculated as P2O5) (The concentration of MAP and UP was higher than 99%). Each treatment had three replicates. The plot area was 8 m × 9.2 m. Soybean seeds (variety Kennong 23) were sown on 26 April 2022 (seedlings emerged on May 1) and 28 April 2023 (seedlings emerged on 3 May), with a sowing depth of approximately 5 cm (Figure 2). The seeding rate was 260,000 seeds ha−2. Drip irrigation and plastic film mulching were used. One film covered three drip tapes. The drip tapes were 15 cm away from the soybean seed rows, and the plant spacing was 20 cm. When the soybean cotyledons were fully expanded, the seedling density was adjusted to about 130,000 plants ha−2.
The drip irrigation system consisted of drip tapes, valves, and fertilizer tanks. Each plot was equipped with a fertilizer tank and a valve for fertilization. On the day after sowing, each plot was irrigated with 45 mm of water to promote seed germination. The application rates of N (300 kg ha−2) and K2O (135 kg ha−2) were the same in all treatments. The application rate of P2O5 (150 kg ha−2) was the same in all treatments except for CK. The fertilizers designed for each treatment were put into fertilization tanks and topdressed with water (Table 2). The fertilizers for each treatment were dissolved in irrigation water and transferred to the fertilizer tank to be applied through the drip irrigation system. Phosphate fertilizer was applied first, followed by nitrogen fertilizer and potassium fertilizer. The CK, MAP, UP, and M8U2 treatments had pH values of 8.0, 4.5, 2.0, and 3.4 for the phosphate fertilizer solution, respectively. The irrigation amount during the entire growing season was 675 mm. The flow rate of the drippers was 3.0 L/h, and the dripper spacing was 30 cm. Irrigation was carried out every 7–10 days. The conductivity of the irrigation water was 1.2 dS m−1, and the pH was 8.0.

2.3. Determination of Soil Available P, Total P, and Inorganic P Components

Soil (0–20 cm) was sampled at three sampling points in each plot using a soil drill (diameter: 5 cm) in the V4 (25 days after emergence), initial-flowering, peak-flowering, peak-podding, grain-filling, and fully-ripe (R8) stages. Then, the three soil samples were evenly mixed and transferred to a self-sealing bag. Each treatment had three replications. The soil samples were air-dried and sieved (1 mm) to remove roots and debris for the determination of soil available P (APC) and total P content.
The available P in the soil was determined using Olsen’s method. Specifically, 2.5 g of air-dried soil was placed in a 150 mL conical flask. Then, 50 mL of 0.5 mol/L NaHCO3 leaching agent and 0.5 g of P-free activated carbon were added and shaken at 25 °C for 30 min before filtering through P-free filter paper. The filtrate (10 mL) was shaken well with 35 mL of distilled water and 5 mL of Mo-Sb-Vc reagent. After thirty minutes, the sample was subjected to colorimetry at 880 nm [15]. Total P content was determined using the HClO4-H2SO4 method [15]. Specifically, the sieved soil (0.5 g) was put into a tube, followed by addition of 5 mL of concentrated H2SO4 and shaking. Then, 2 mL of HClO4 was added. The solution was heated to 120 °C until the reaction was stable. Finally, the solution was heated to 250 °C until it was colorless and transparent. After cooling, the solution was made to 100 mL in volume and left to stand overnight. The next day, 5 mL of the solution was diluted to about 30 mL in a 50 mL volumetric flask. After adding two drops of dinitrophenol, a 4 mol L−1 NaOH solution was added dropwise until the solution turned yellow. Then, 2 mol L−1 H2SO4 was added to make the solution yellow, and 5 mL of Mo-Sb-Vc was added. Water was added to bring the volume to 50 mL, followed by shaking. After 30 min, the solution was subjected to colorimetry at 880 nm. After completing the determination of available P and total P, the content of available P and total P in each treatment was calculated based on the absorbance of the P standard solution at 880 nm. Each treatment was repeated three times [15]. The soil samples collected during the R8 stage were used to determine the inorganic P components using a continuous grading method [16], with the extraction order of Ca2-P, Ca8-P, Al-P, Fe-P, O-P, and Ca10-P. The content of inorganic P components was determined using the method of Zhang et al. [16].

2.4. Determination of P Uptake and Use Efficiency

The plant samples collected at the R8 stage were divided into roots, stems, leaves, petioles, pod shells, and seeds. Plant organs were dried in an oven at 85 °C for 48 h, weighed, ground, and sieved through a 1 mm sieve for chemical analysis. After digestion with H2SO4-H2O2, the P content of various organs was determined by the molybdo-vanadophosphate method [17].
P uptake, P uptake efficiency (PUPE), P use efficiency (PUE), P productive efficiency (PPE), and P harvest index (PHI) were calculated using the following formulas [18,19]:
P   u p t a k e = p l a n t   d r y   m a t t e r   a c c u m u l a t i o n × p l a n t   t o t a l   P   c o n t e n t
PUPE = ( P uptake in P application area P uptake in non P application area ) / ( P application rate ) × 100 %
P U E = y i e l d   i n   P   a p p l i c a t i o n   a r e a s y i e l d   i n   n o n P   a p p l i c a t i o n   a r e a s P   u p t a k e
P P E = y i e l d   i n   P   a p p l i c a t i o n   a r e a s y i e l d   i n   n o n P   a p p l i c a t i o n   a r e a s P   a p p l i c a t i o n   r a t e
P H I = g r a i n   P   c o n t e n t p l a n t   t o t a l   P   c o n t e n t × 100 %

2.5. Determination of SPAD Value and Net Photosynthetic Rate (Pn)

In the R2 stage, five plants were randomly selected from each treatment. The SPAD value of the middle part of the third leaf on the top was determined using SPAD-502 (Konica Minolta, Tokyo, Japan). Then, the LI-6400 portable photosynthesis system (LI-COR, Biosciences, Lincoln, NE, USA) was used to determine Pn, stomatal conductance (GS), intercellular CO2 concentration (Ci), and transpiration rate (Tr) from 10:00 to 13:00.
Before measurement, the photosynthetic photon flux density (PPFD) in the leaf chamber of the LI-6400 portable photosynthesis system was set to 1800 μmol m−2 s−1. The temperature was set to 25 °C. The CO2 concentration was set to 400 μmol mol−1. The relative humidity was set to 80%. Then, the net photosynthetic rate (Pn), transpiration rate (Tr), and stomatal conductance (Gs) were automatically recorded.

2.6. Determination of Dry Matter Accumulation (DMA)

Five plants were pulled out for each treatment on the 25th (V4), 35th (R1), 50th (R2), 65th (R4), 85th (R6), and 120th (R8) days after emergence, and dried in an oven at 105 °C for 30 min. Then, the temperature was reduced to 85 °C for drying until a constant weight was reached to determine the DMA.
The beta growth model can better fit the decreasing trend caused by respiration consumption in the later stage of crop growth. Thus, the beta growth model was used to fit soybean growth [20,21]. The relationship between the dynamic DMA in soybeans and the number of days after emergence was as follows:
w   =   w m a x ( 1 + t e t t e t m ) ( t t e ) t e t e t m
where wmax represents the maximum DMA (g m−2), te represents the number of days after emergence (d) to reach the maximum DMA, tm represents the number of days after emergence (d) to reach the maximum DMA rate (cm, g m−2 d−1), and t represents days after emergence (d).
The growth rate during the entire growth season was calculated by the following equation:
d w d t = c m ( t e t t e t m ) ( t t m ) t m t e t m
The calculation formula of cm was as follows:
c m = w m a x 2 t e t m t e ( t e t m ) ( t m t e ) t m t e t m
The goodness of fit was evaluated by the coefficient of determination (R2 ≥ 0.9) and root mean square error of approximation (RMSEA ≤ 0.1).

2.7. Determination of Yield

In the R8 stage (1 September 2022, 3 September 2023), the soybean plants in a central area (4.6 m × 4 m) in each plot were counted to obtain the plant number per unit area (PNPA). Then, the plants were pulled out, and the grains were collected and weighed. The moisture content of the grains was determined using a near-infrared grain analyzer (Infratec TM 1241, 3.5.2, Soybean-2022, FOSS). Finally, the yield was calculated based on a moisture content of 13%.
Ten plants were randomly selected from each plot to calculate the average pod number per plant (PN). Then, the grains were collected to count the total number of grains. After that, the grain number per pod (GNPP) was calculated by dividing the total number of grains by the total number of pods. After the grains were dried to a moisture content of 13%, 100 grains were randomly selected and weighed as the hundred-grain weight (HGW).
Net revenue (USD ha−1) was calculated using formula (9) based on total revenue (TR), agronomic costs (AC), and other costs (OC). The total revenue was calculated by multiplying the output by the soybean price. AC and OC were the costs of drip irrigation equipment, fertilizers, machines, labor, irrigation water, seeds, and pesticides. The prices of soybeans, AC, and OC were determined according to the local market prices during the soybean growing seasons.
U S D = T R A C O C

2.8. Statistical Analysis

The Shapiro-Wilk test (p > 0.05) in SPSS 25.0 (SPSS Inc., Chicago, IL, USA) was combined with a P-P plot to test the normality of the data. Levene’s test (p > 0.05) was used in combination with a residual plot to test the homogeneity of variance. Analysis of variance (ANOVA) and Duncan’s multiple range test (p < 0.05) were performed on data that conformed to normality and homogeneity of variance. The nonlinear regression of the growth dynamics of soybeans was accomplished by SPSS 25.0 software. The statistical data were visualized by Origin 2022b (OriginLab, Northampton, MA, USA). Path analysis of the Ca2-P, Ca8-P, Al-P, Fe-P, O-P, Ca10-P and available phosphorus content (APC) was conducted using the SPSSAU platform (https://spssau.com, accessed on 7 September 2024). The model fit was evaluated by chi-square to degrees of freedom ratio (χ2/df ≤ 2.0), goodness-of-fit index (GFI > 0.90), root mean square error of approximation (RMSEA ≤ 0.1), and comparative fit index (CFI > 0.90). Partial least squares discriminant analysis was performed on variables that affect yield (Pn, SPAD, DMA, PN, GNP, HGW, and APC) to obtain the variable importance in projection (VIP) scores using Simca 14.1 (Sartorius, Göttingen, Germany) software. When the VIP value was greater than 1 and the FDR (False Discovery Rate) was smaller than 0.05, the importance of the variable was considered significant [22].

3. Results

3.1. Soil Total Phosphorus and Available Phosphorus Content

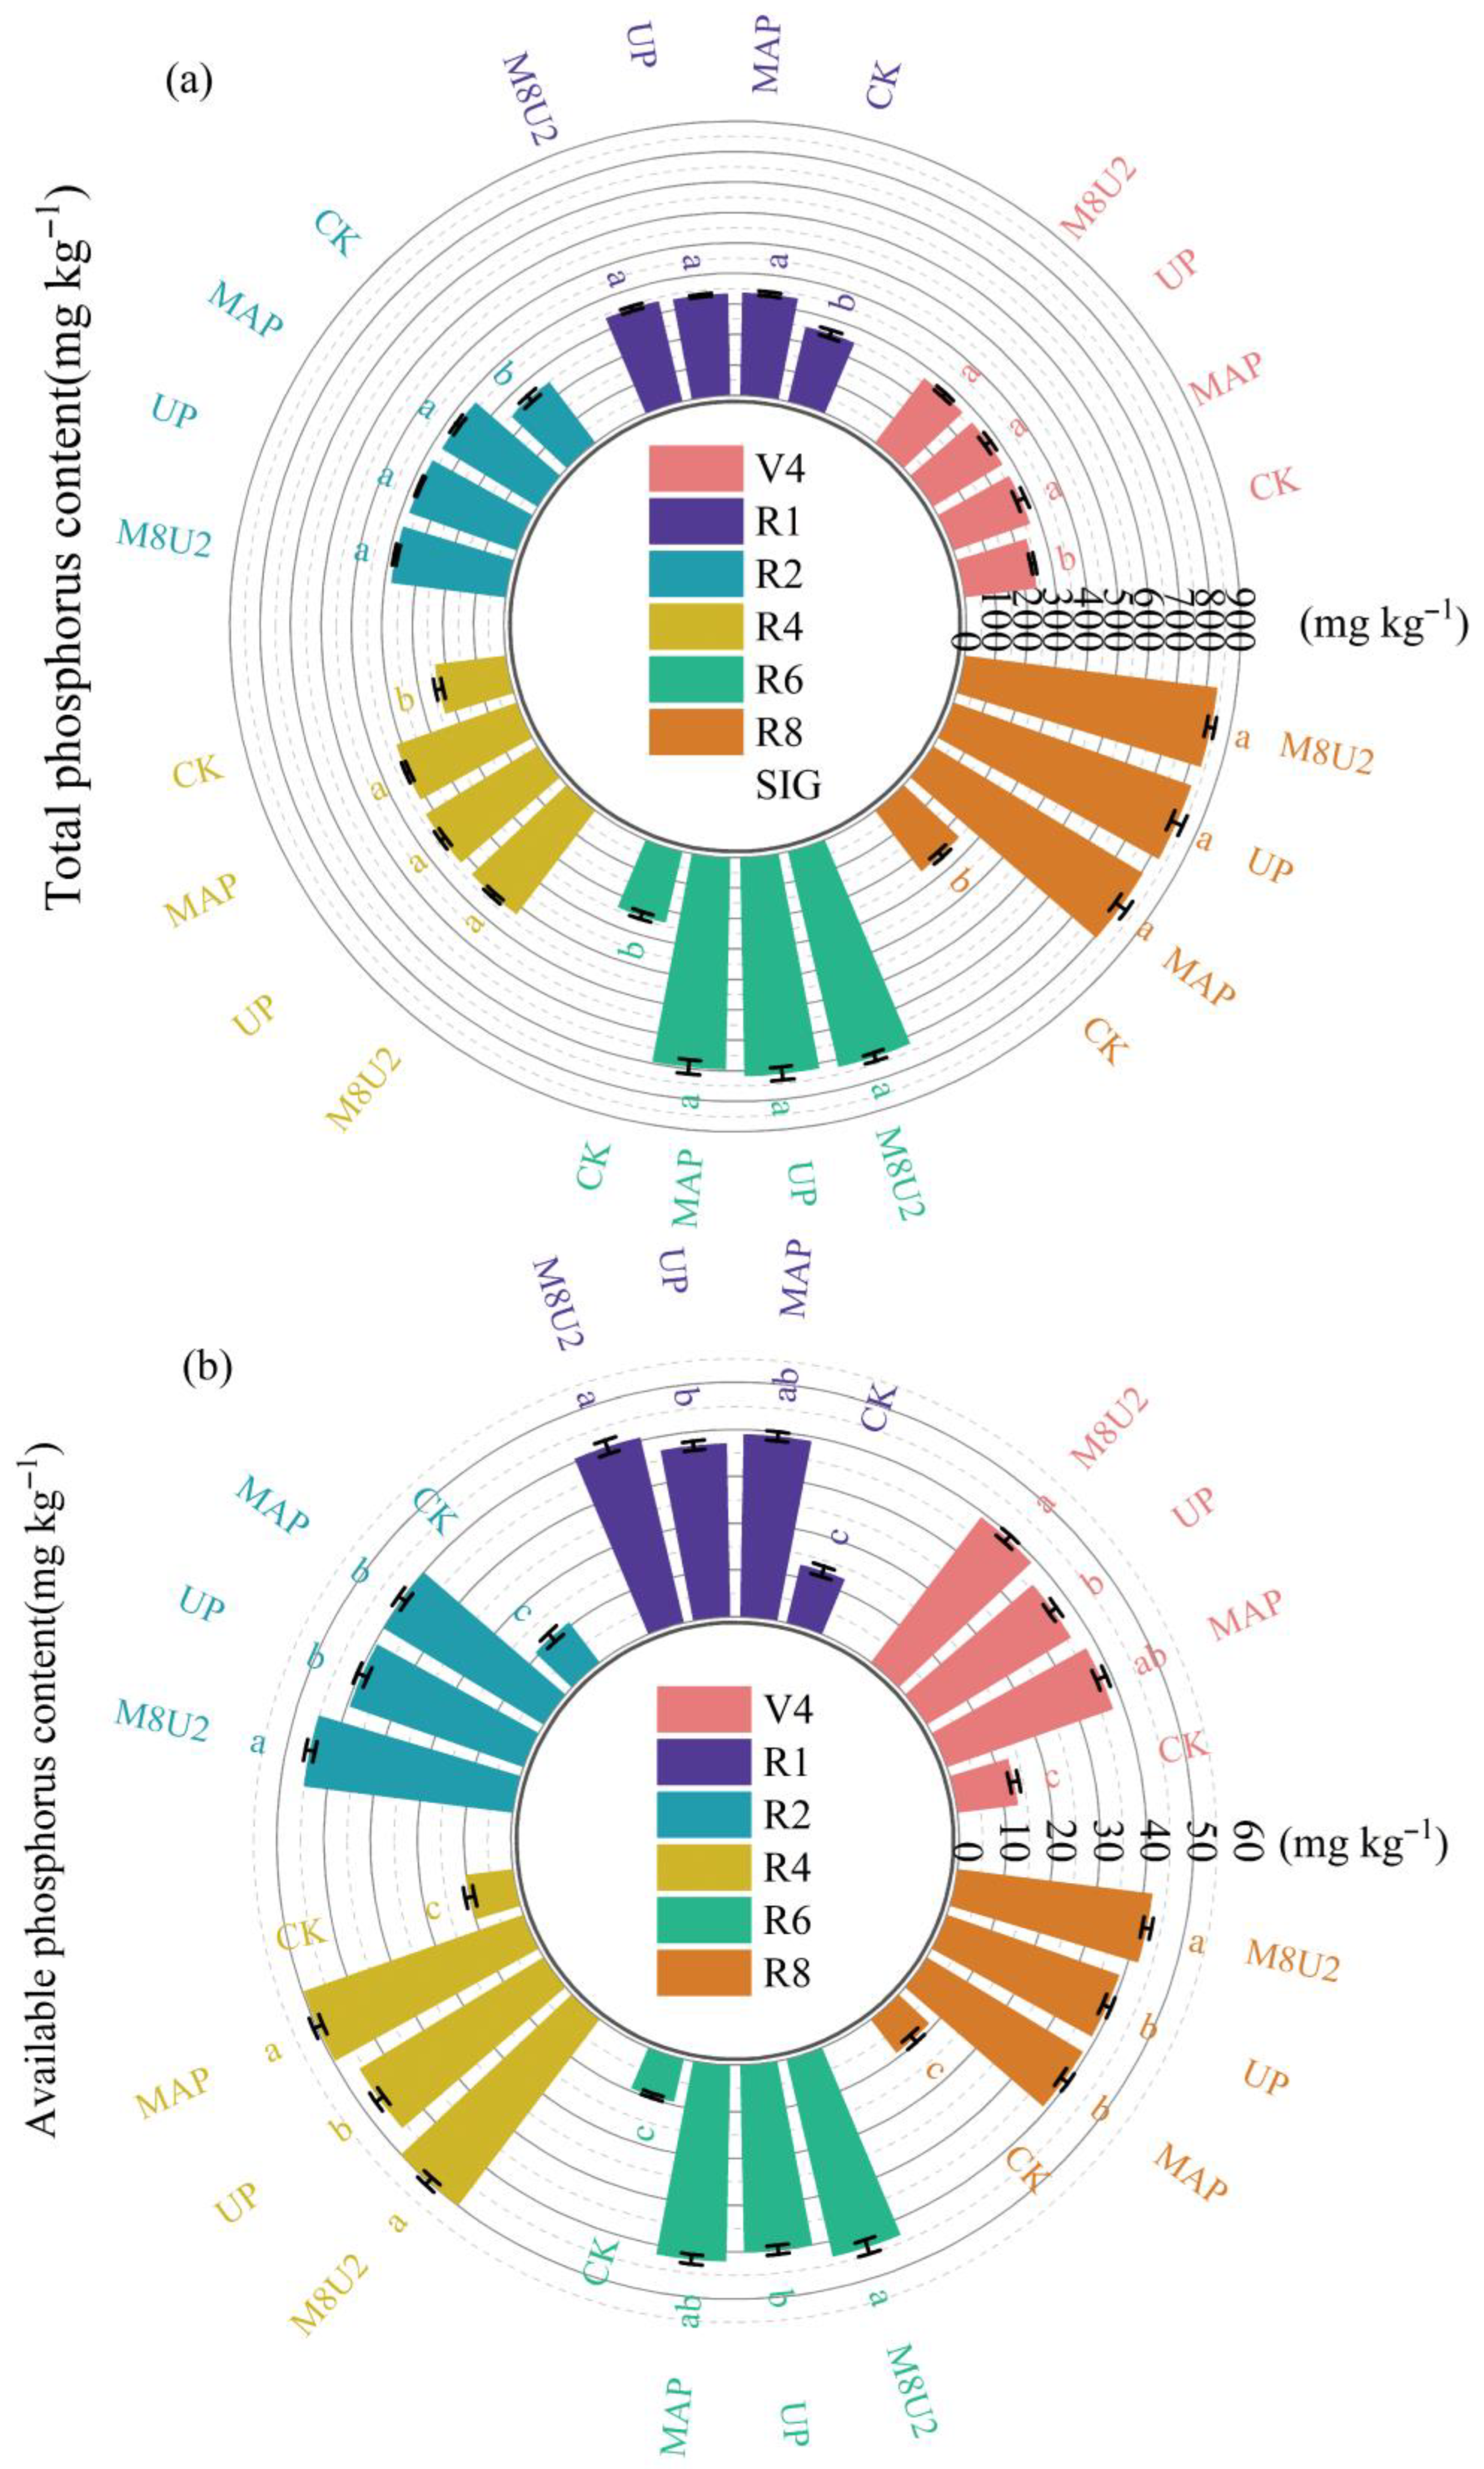
The application of P fertilizers significantly increased the total P and available P content in the soil during the soybean growing season compared with CK. The total P content in the soil gradually increased with the growth of soybean, but there was no difference among the P application treatments (p > 0.05) except for R2 and R6. The soil APC of the M8U2 treatment was the highest (p < 0.01), which was 5.12% and 9.55% higher than that of the MAP and UP treatments, respectively (p < 0.05) (Figure 3).

3.2. Content of Inorganic Phosphorus Components in Soil

The soil Ca2-P, Ca8-P, Fe-P, O-P, Ca10-P, and Al-P contents of the P fertilization treatments were 723.18%, 320.57%, 185.69%, 157.17%, 156.04%, and 147.06% higher than those of CK, respectively (p < 0.05). The content of inorganic P components among P fertilization treatments showed that the MAP treatment had the highest content of Ca10-P and O-P, the UP treatment had the highest content of Ca2-P and Ca8-P (p < 0.05), and the M8U2 treatment had the highest content of Ca10-P (p < 0.05). Meanwhile, there was no difference in Ca10-P content between the MAP treatment and M8U2 treatment and O-P content between the UP and M8U2 treatment (p > 0.05) (Table 3).
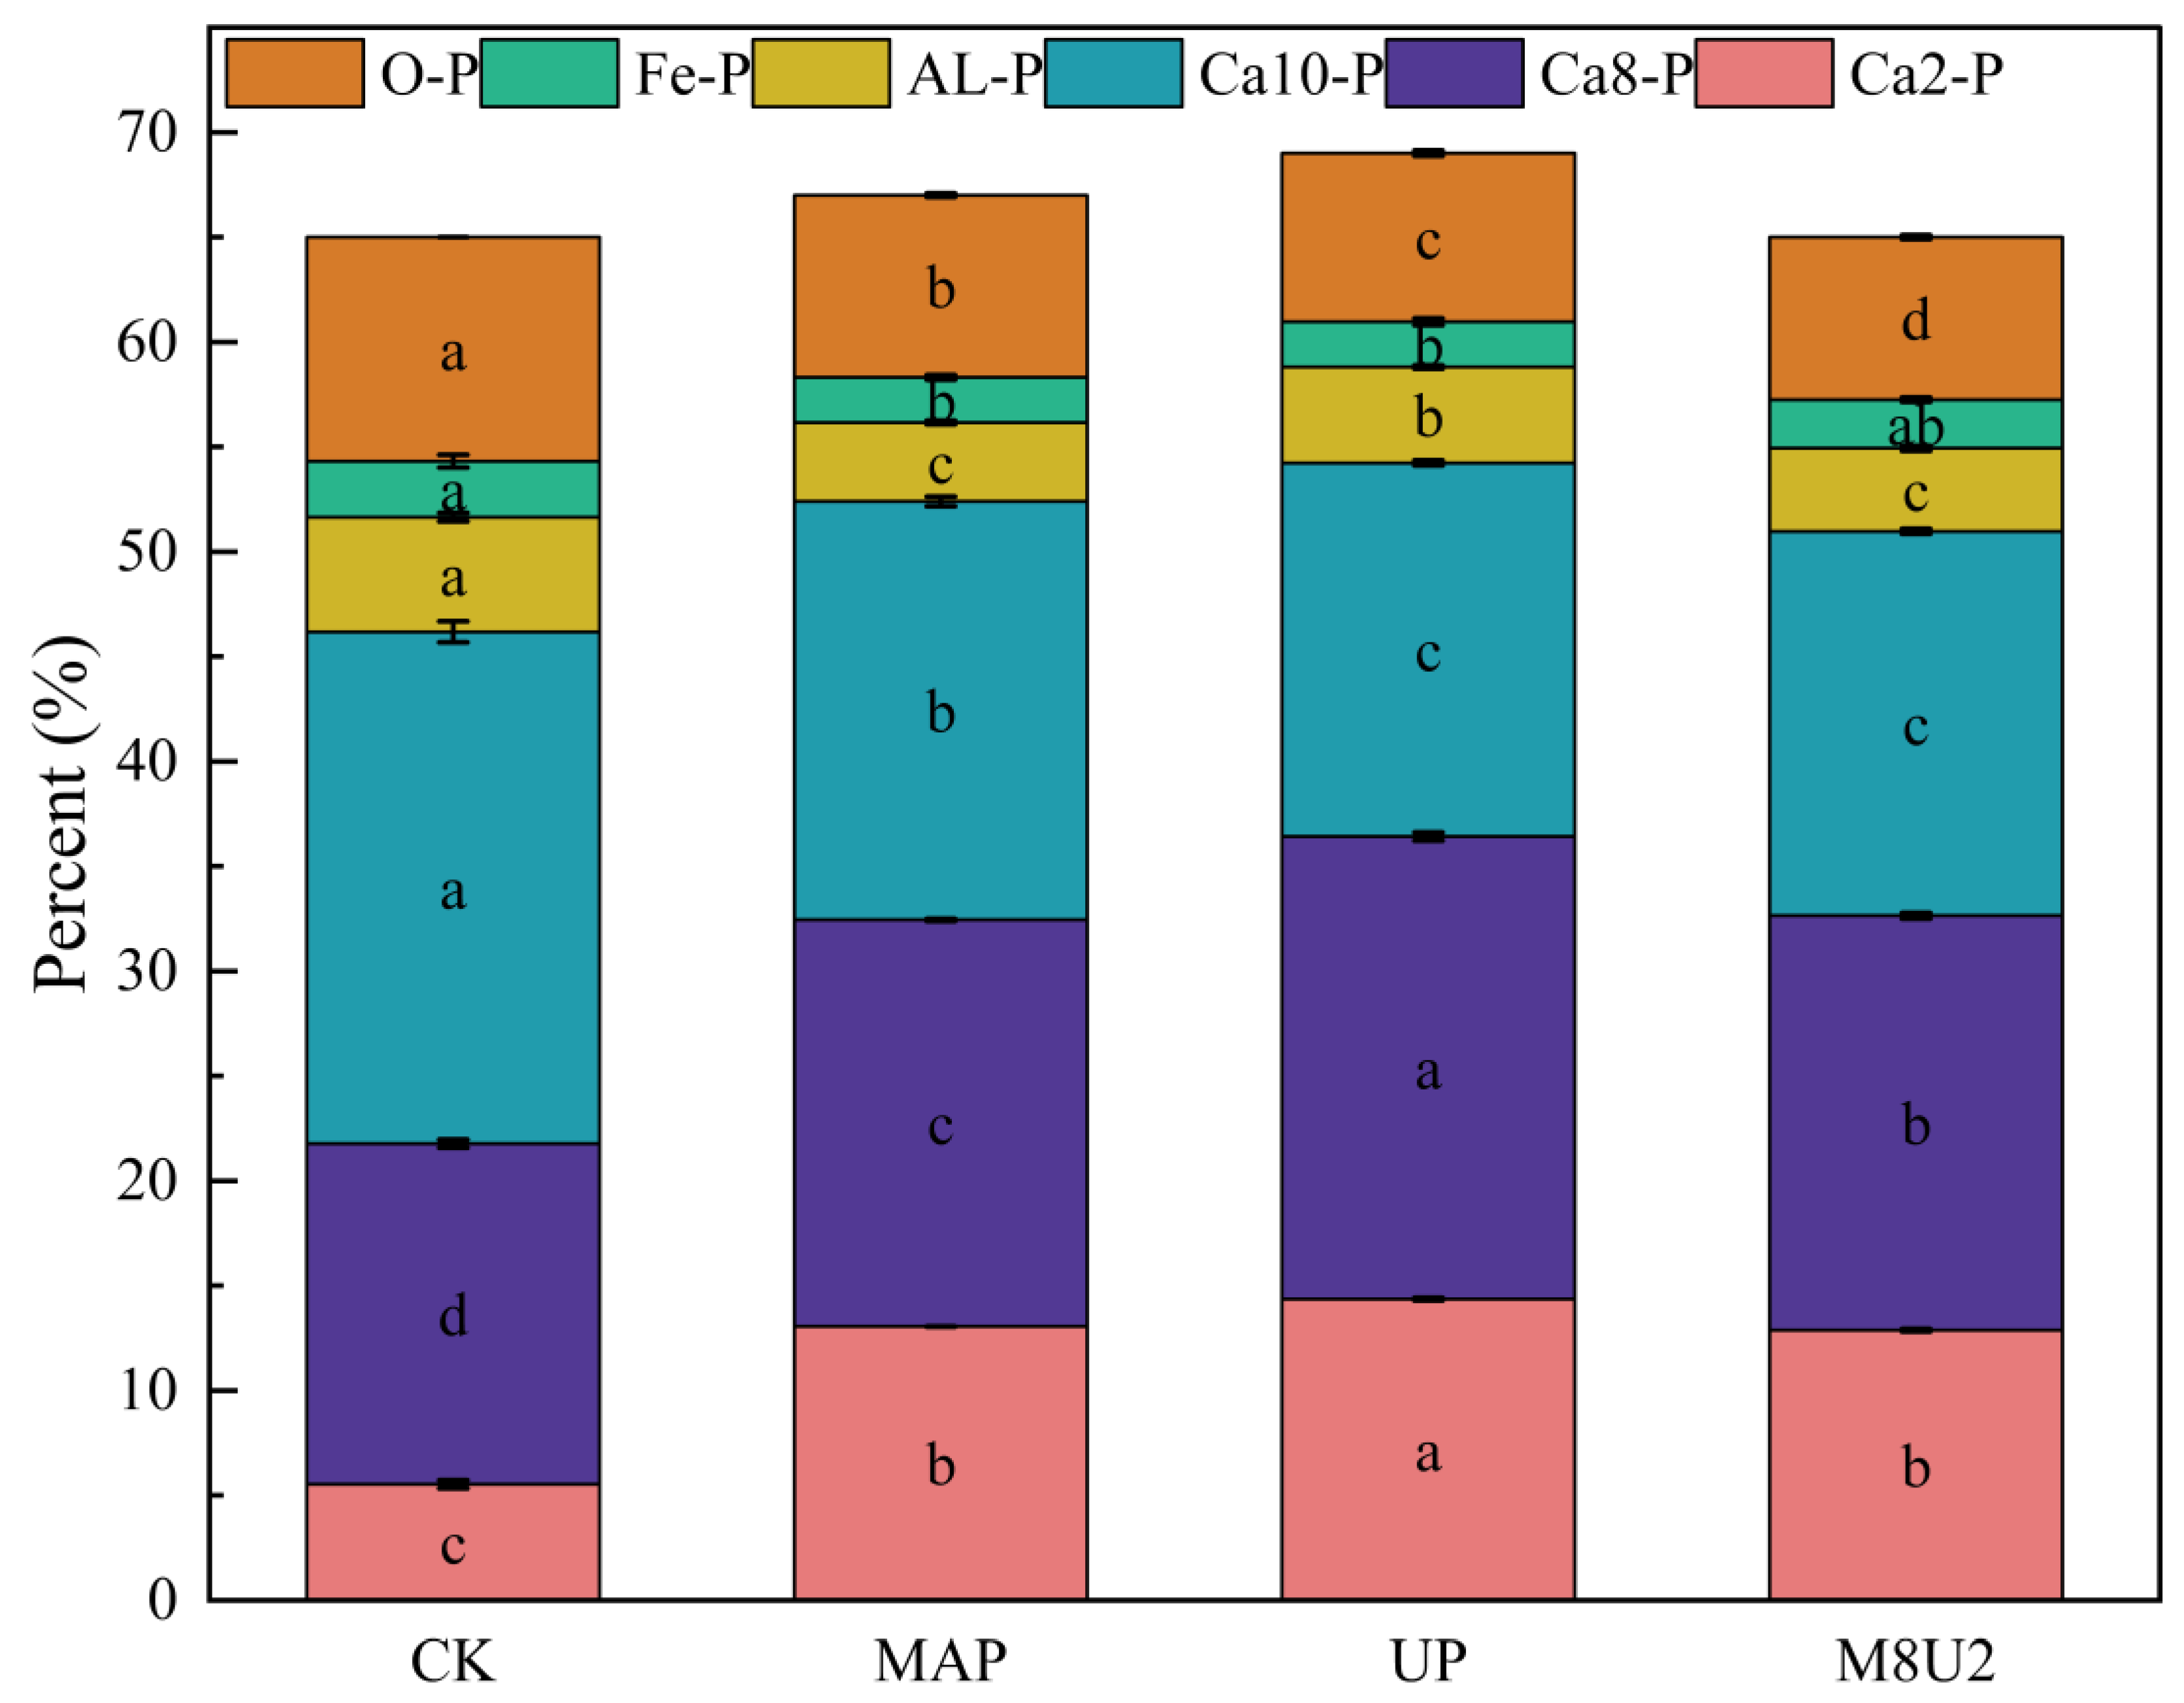
The application of P fertilizers increased the proportion of Ca2-P and Ca8-P in total P in the soil, while reducing the proportion of Ca10-P, AL-P, Fe-P, and O-P, compared with CK (Figure 4). The proportions of Ca2-P, Ca8-P, AL-P, and O-P of the M8U2 treatment were 11.43%, 11.64%, 15.63%, and 3.59% lower than those of the UP treatment, respectively (p < 0.05). In addition, the proportions of Ca10-P and O-P of the M8U2 treatment were 8.85% and 12.07% lower than those of the MAP treatment, respectively, and the proportion of Ca8-P was 1.93% higher than that of the MAP treatment (p < 0.05).

3.3. Total Phosphorus Content of Plants

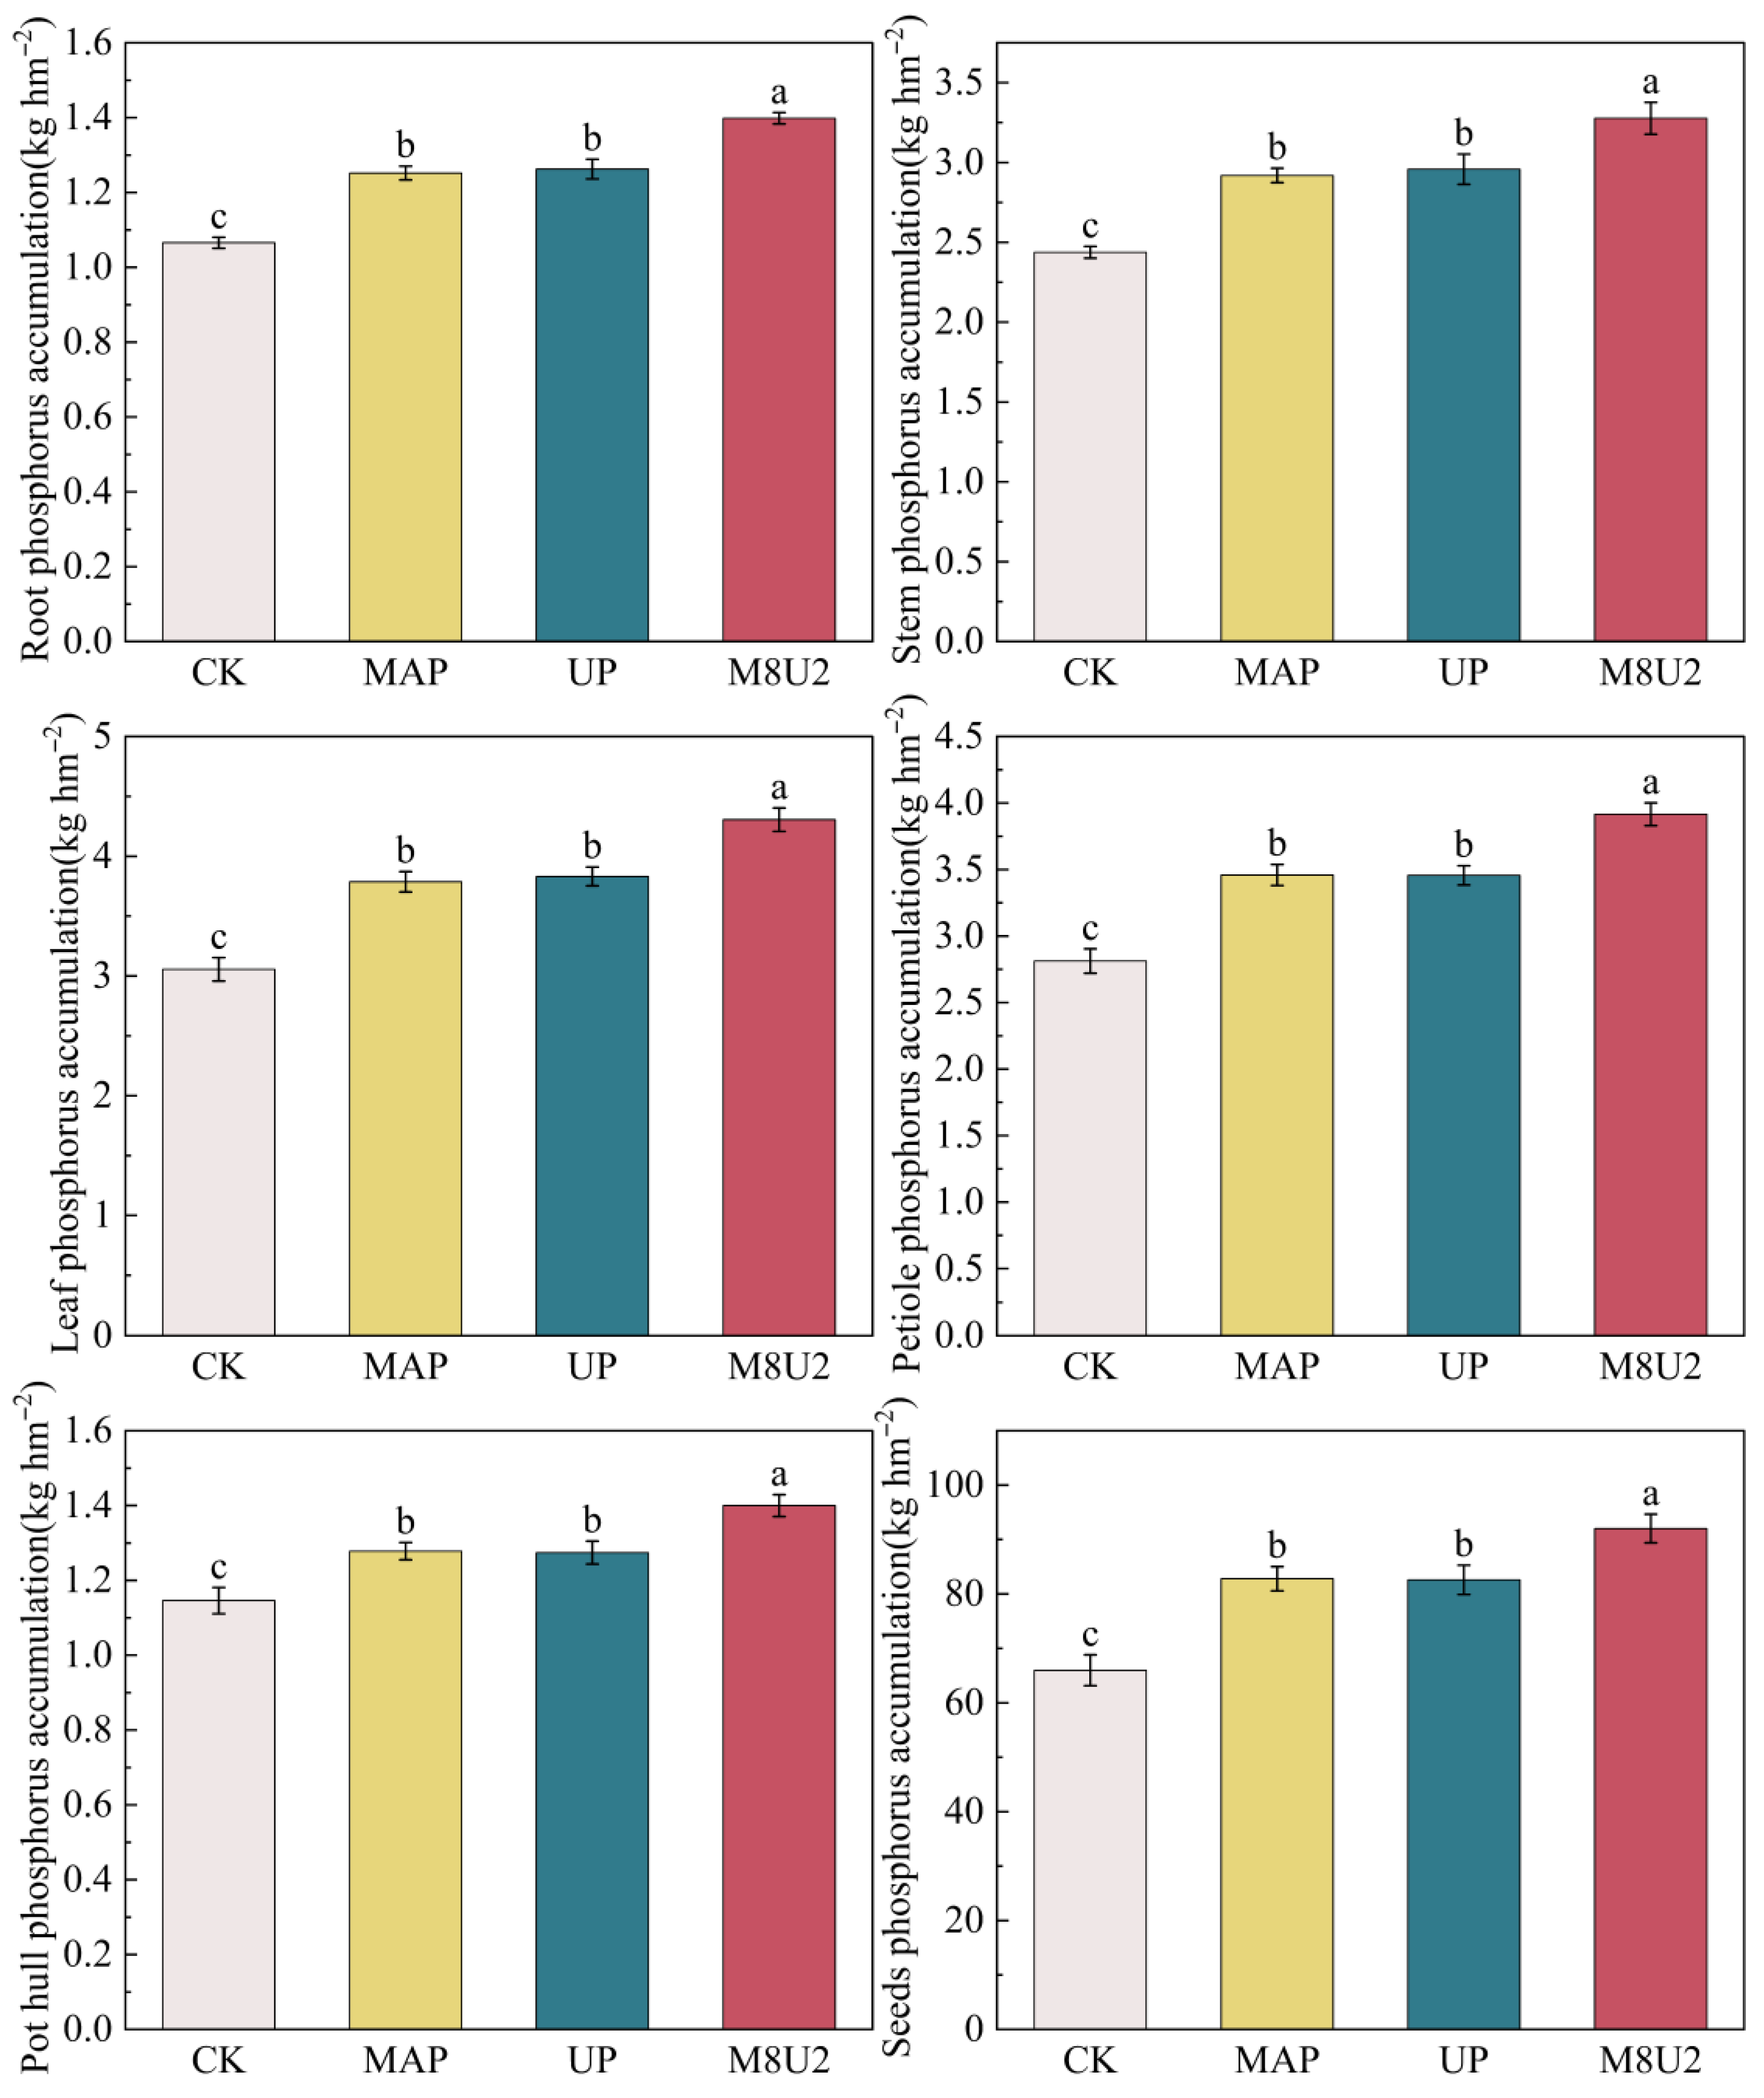
The total P content of soybean roots, stems, leaves, petioles, pod walls, and grains of the P fertilization treatments was 24.35%, 27.11%, 32.43%, 31.06%, 16.67%, and 32.33% higher than that of CK, respectively (p < 0.05). The total P content of each plant organ was the highest in the M8U2 treatment (Figure 5).
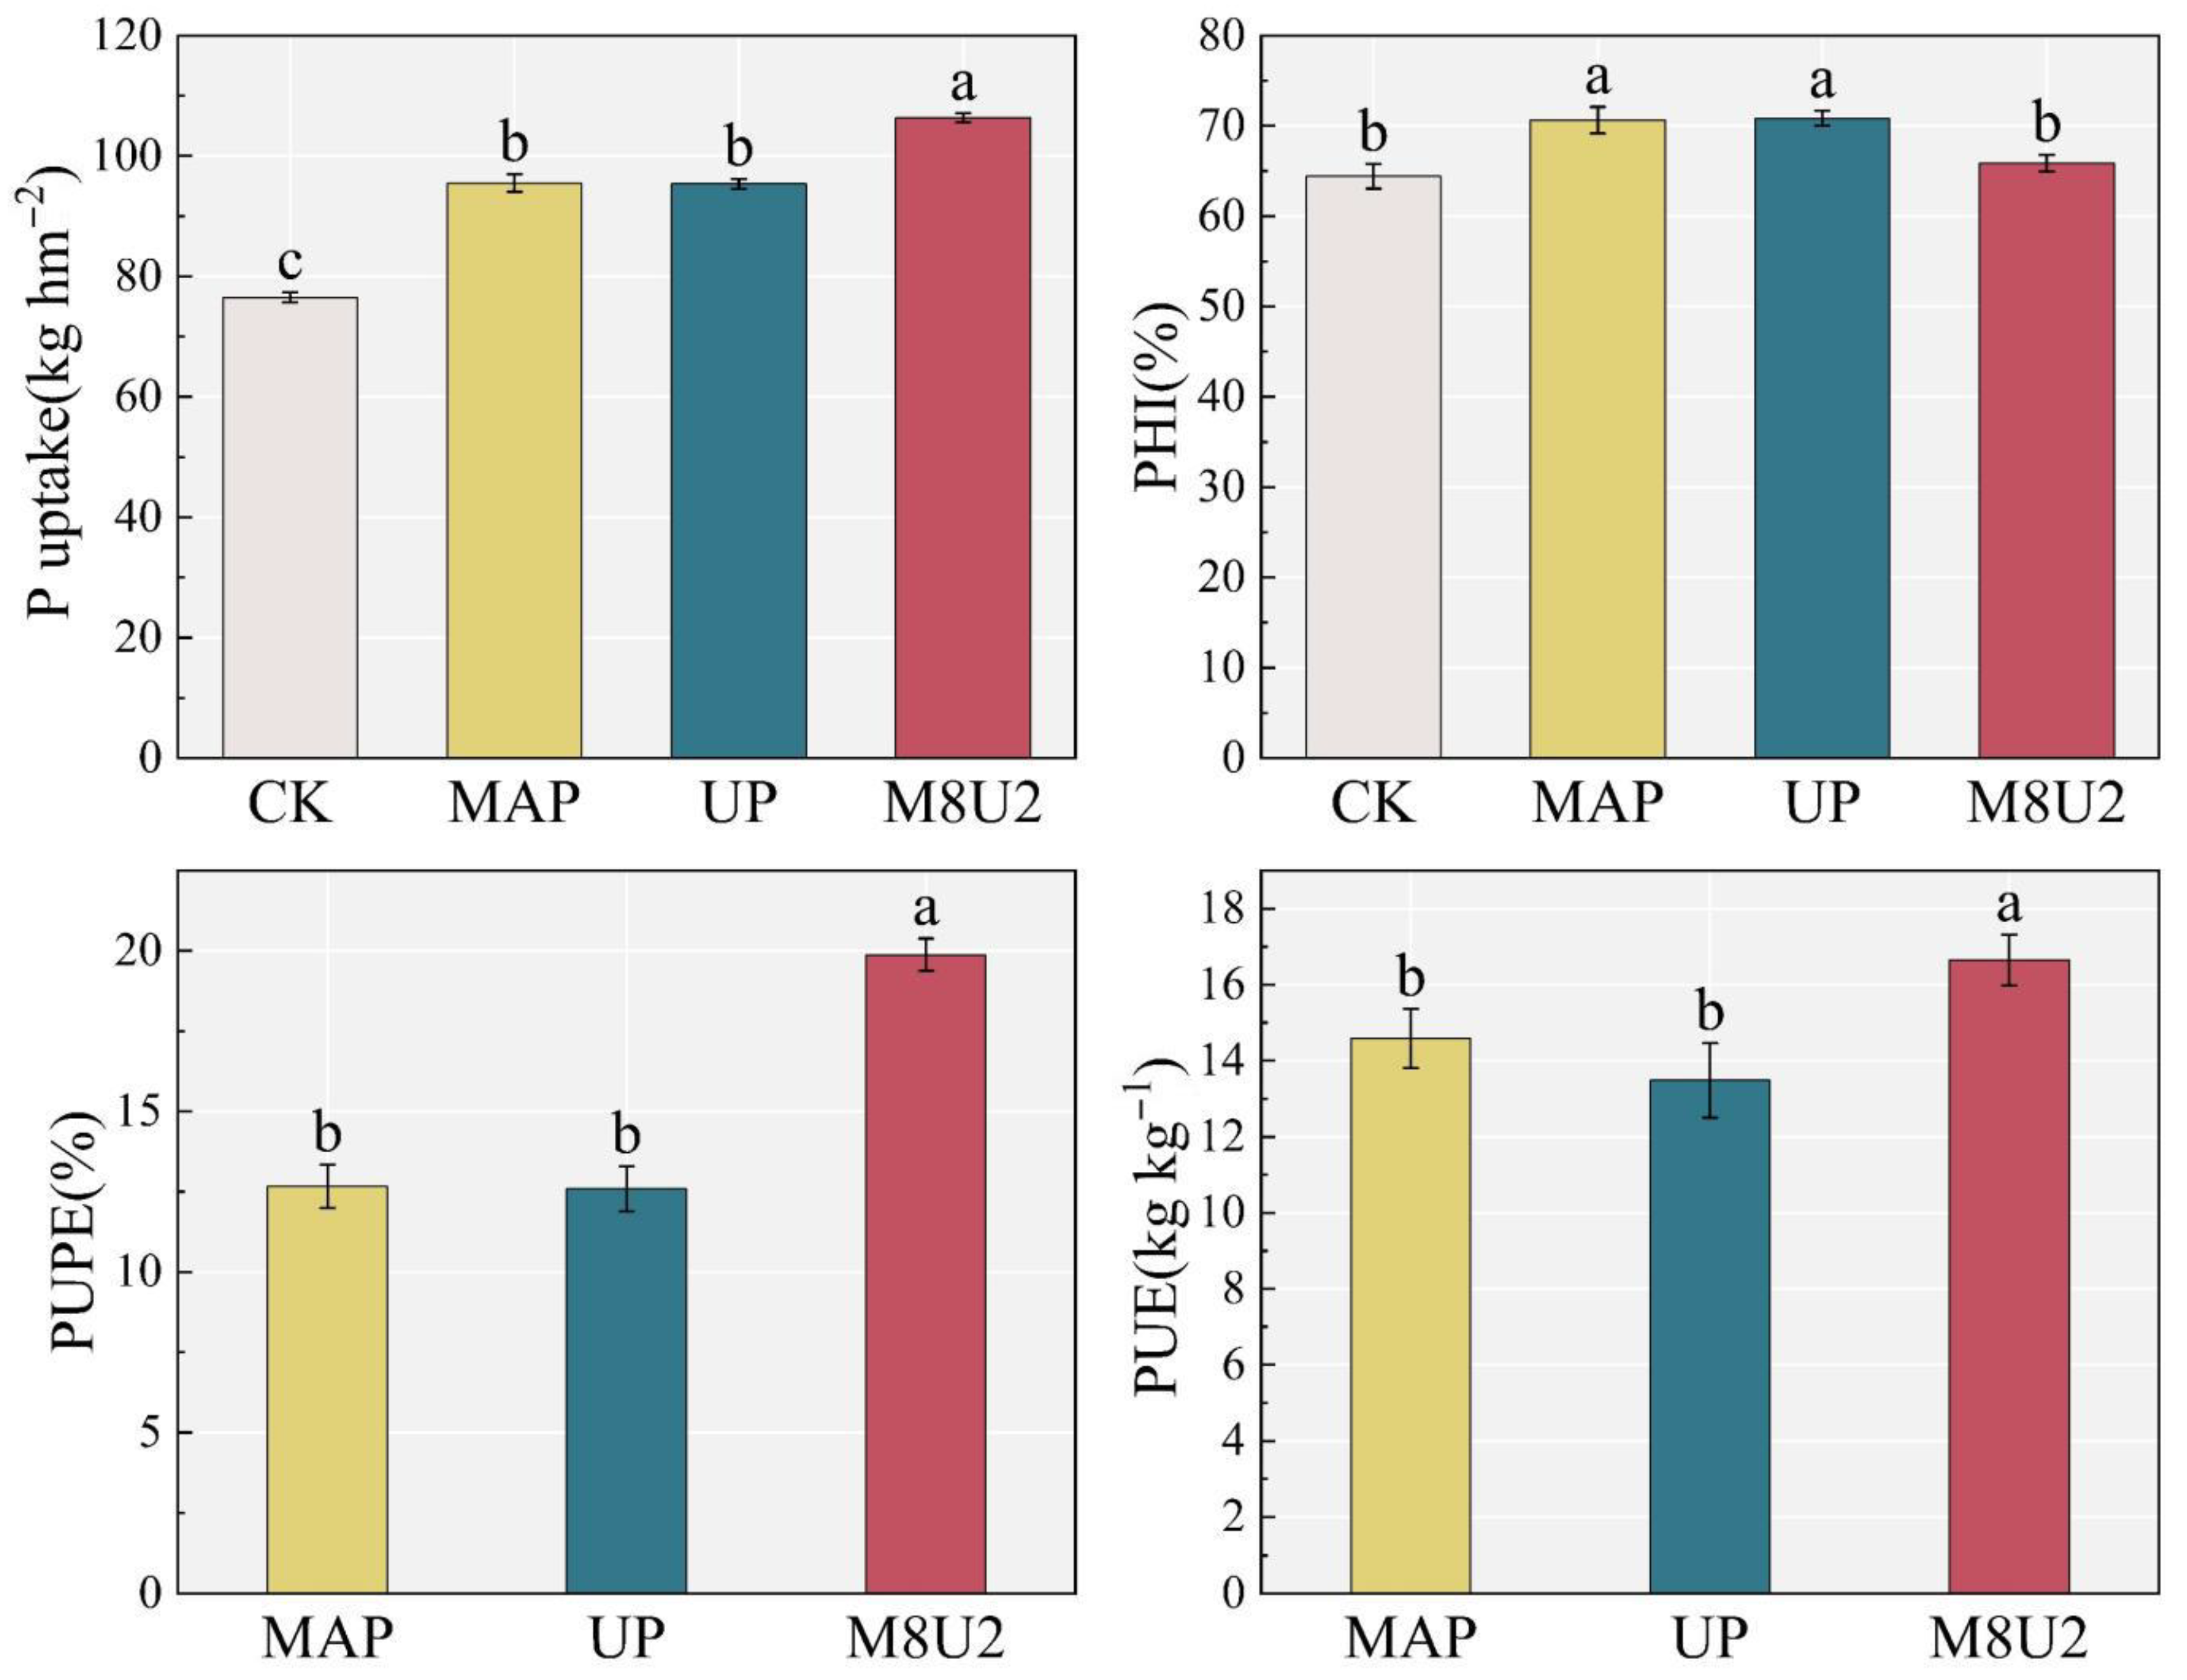
The soybean P uptake of the P fertilization treatments was 31.83% higher than that of CK (p < 0.05). Among the P fertilization treatments, P uptake, PUPE, and PUE reached the maximum in the MU82 treatment. However, the PHI of the M8U2 treatment was 7.22% and 7.54% lower than that of the MAP and UP, respectively (p < 0.05) (Figure 6).

3.4. Leaf Photosynthetic Parameters

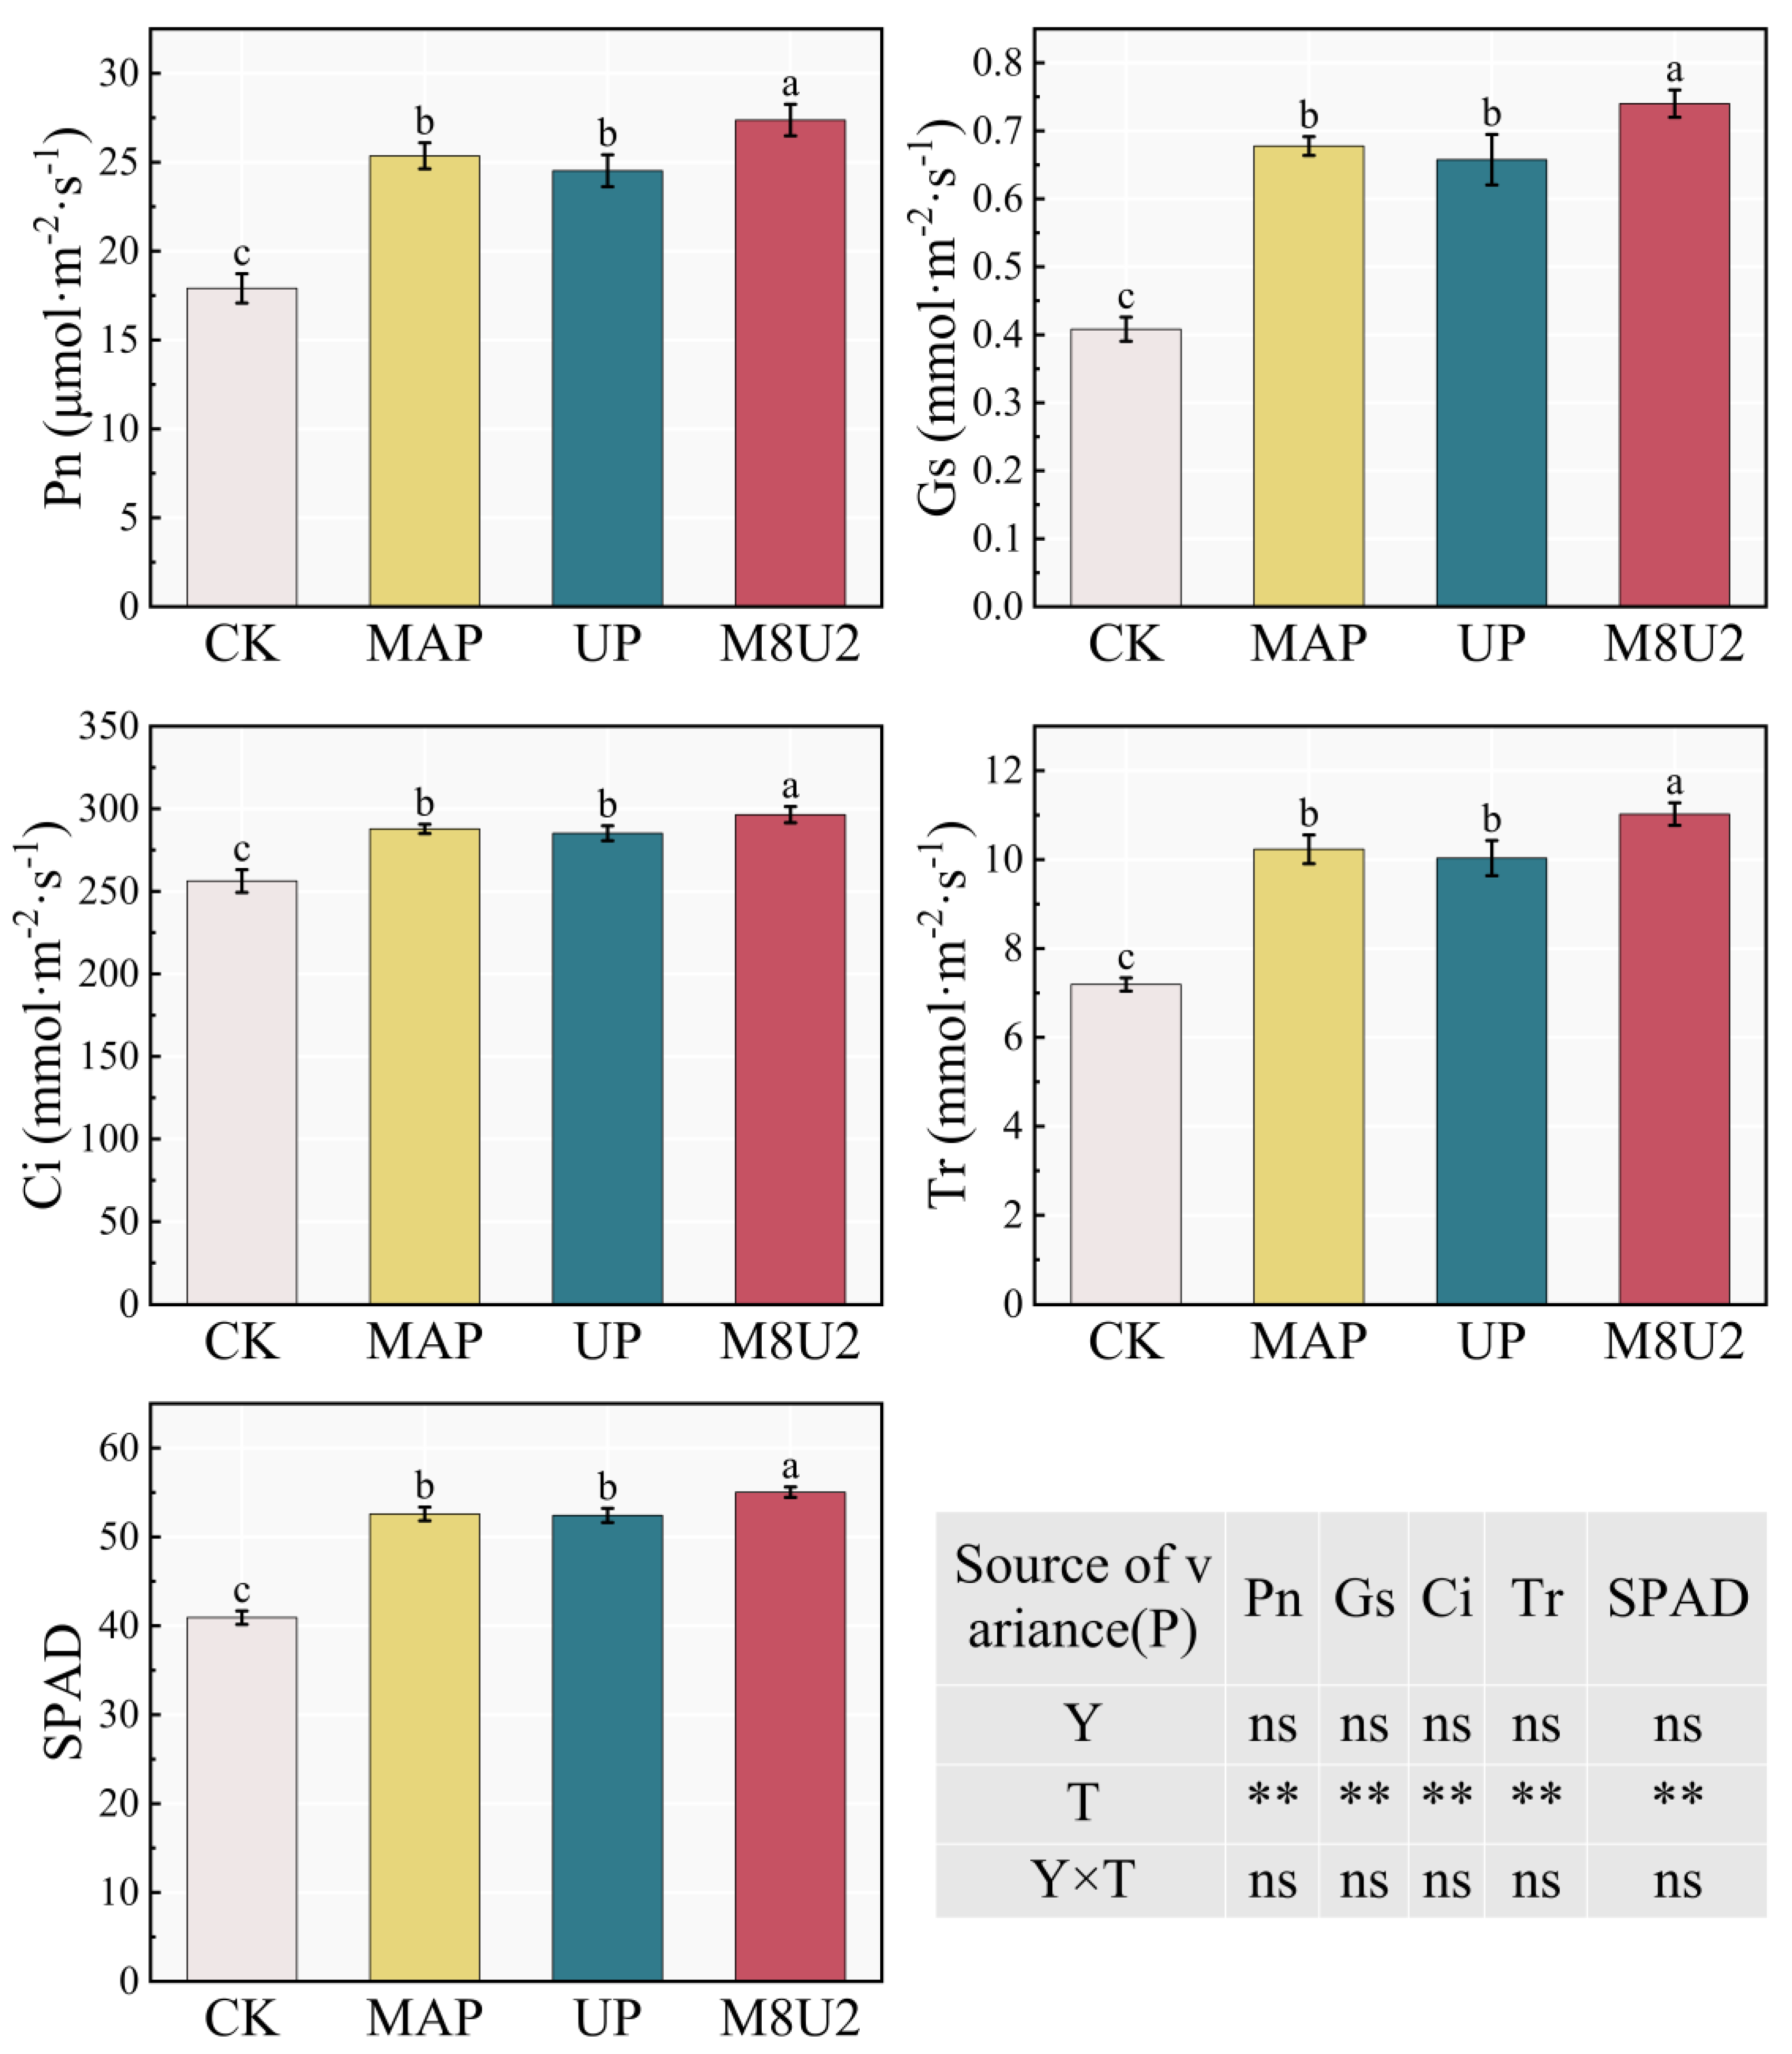
The Pn, Gs, Ci, Tr, and SPAD values of soybean leaves of the P fertilization treatments were 44.91%, 71.19%, 13.50%, 46.4%, and 31.31% higher than those of CK, respectively (p < 0.05). The Pn, Gs, Ci, Tr, and SPAD value of the M8U2 treatment were 7.93%, 9.21%, 2.99%, 7.73%, and 4.66% higher than those of the MAP treatment, respectively (p < 0.05), and 11.61%, 12.53%, 3.96%, 9.86%, and 4.99% higher than those of the UP treatment, respectively (p < 0.05) (Figure 7).

3.5. Dry Matter Accumulation in Plants

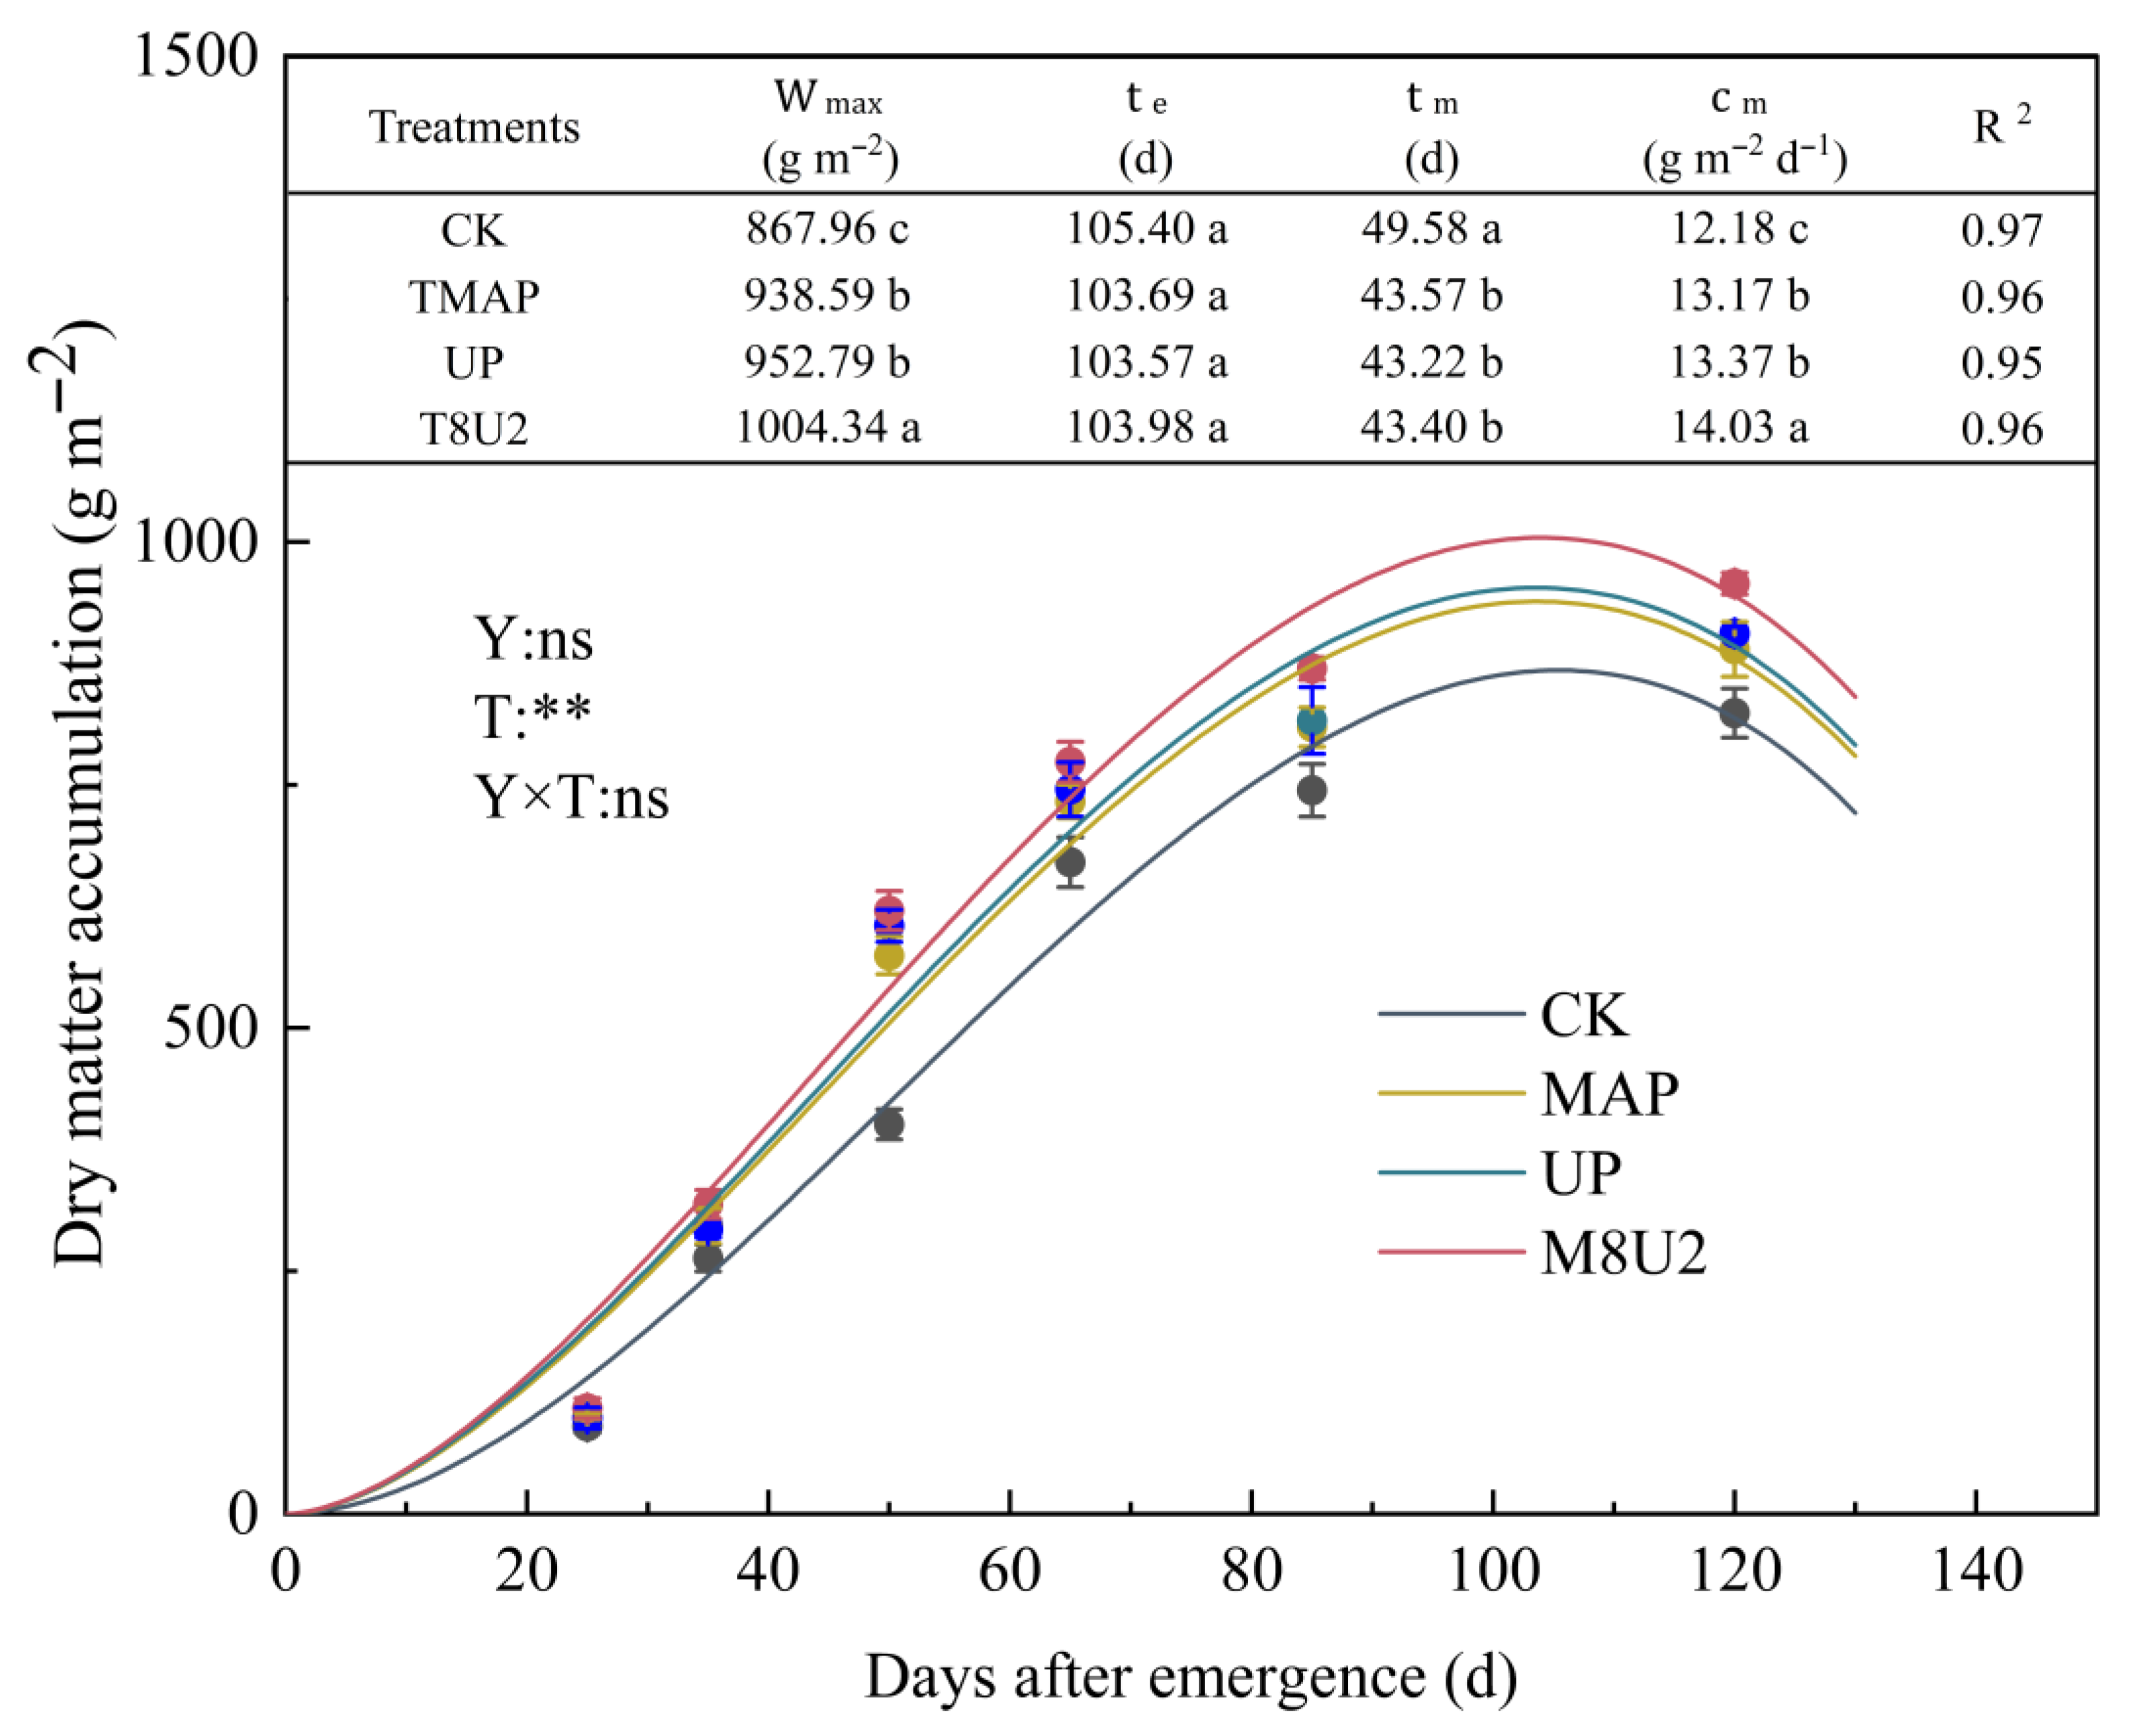
The wmax and cm of soybeans of the P fertilization treatments were 8.13–15.71% and 8.12–15.19% higher than those of CK, respectively, while the tm was 13.79–14.72% lower (p < 0.05). The wmax and cm of the M8U2 treatment were 5.41% and 7.01% higher than those of the MAP treatment, respectively (p < 0.05), and 4.94% and 6.53% higher than those of the UP treatment, respectively (p < 0.05). The wmax and cm were the highest in the M8U2 treatment (Figure 8).

3.6. Yield

The PN, GNPP, HGW, Yield, and NR of the P fertilization treatments were 8.06%, 9.14%, 20.73%, 38.36%, and 71.44% higher than those of CK, respectively (p < 0.05). The GNPP, HGW, Yield, NR, and PPE of the M8U2 treatment were 3.91%, 4.88%, 6.04%, 9.37%, and 23.12% higher than those of the MAP treatment, respectively (p < 0.05), and 4.29%, 7.99%, 7.64%, 16.59%, and 30.55% higher than those of the UP treatment, respectively (p < 0.05). The GNPP, HGW, Yield, NR, and PPE were highest in the M8U2 treatment (Table 4).

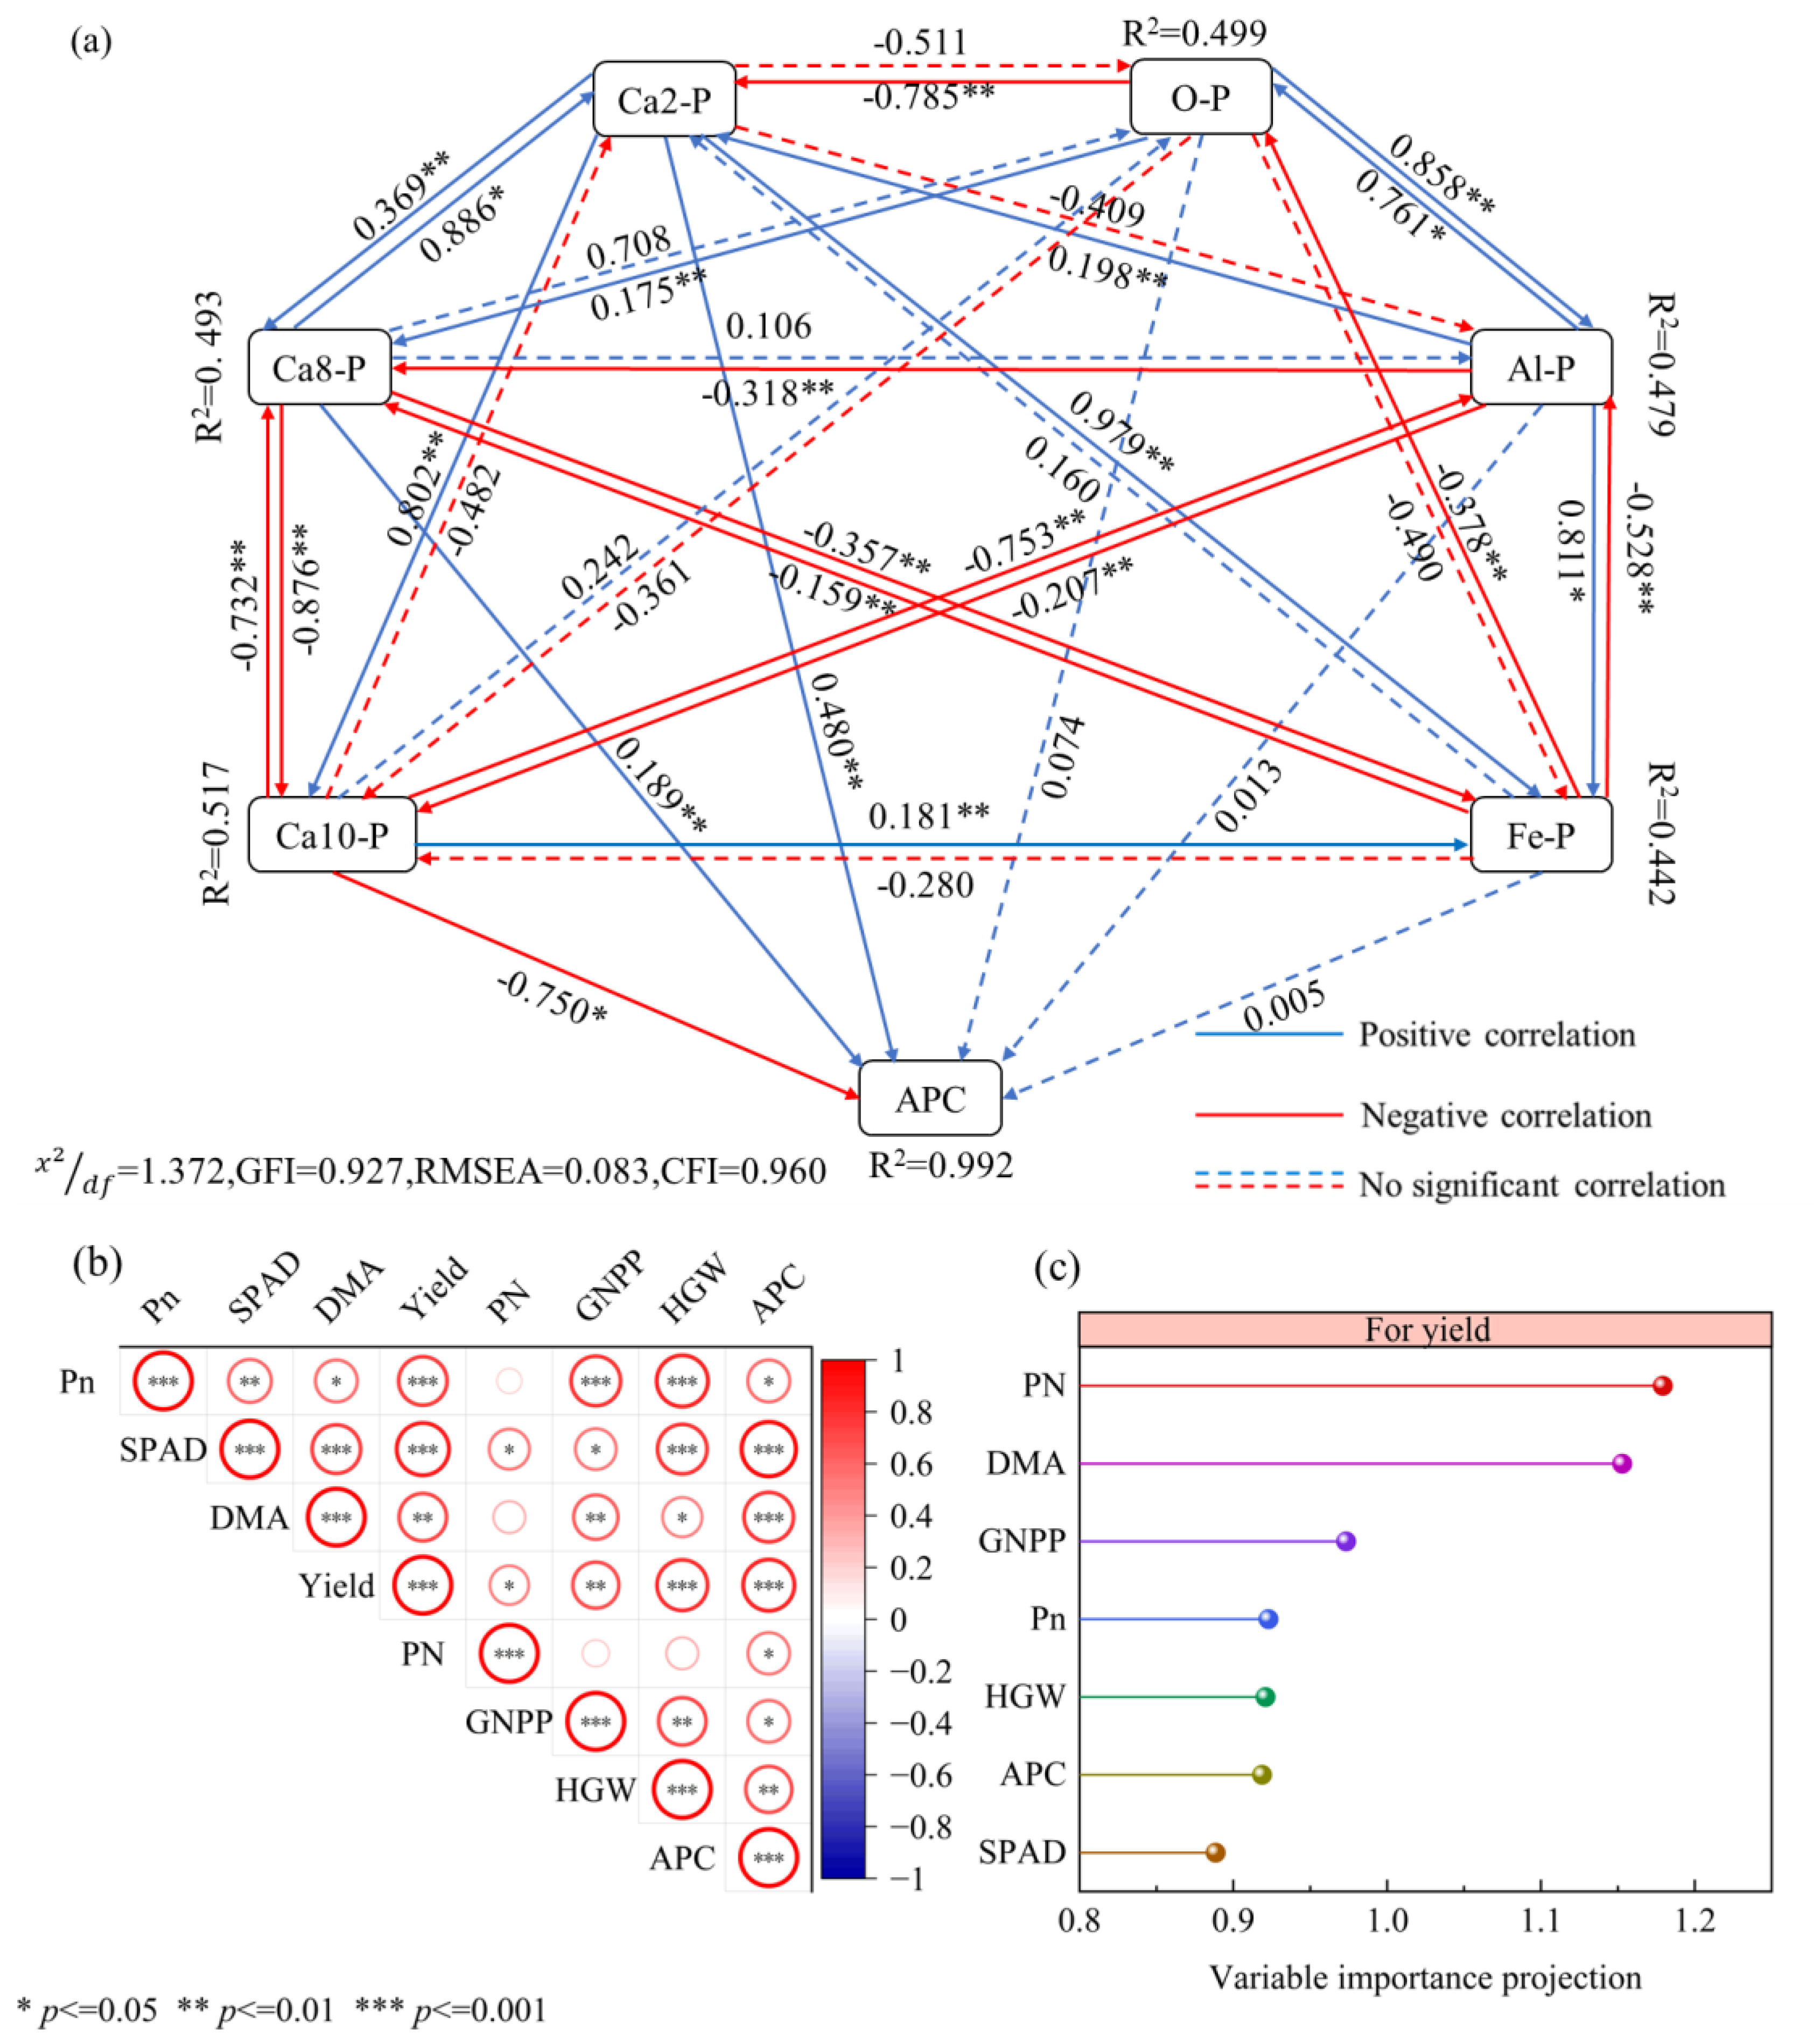
3.7. Path Analysis, Correlation Analysis, and Ranking of Importance to Yield

Path analysis showed that APC was positively affected by Ca2-P (P = 0.480, p < 0.05) and Ca8-P (P = 1.189, p < 0.05) (Figure 9a). Correlation analysis showed that Pn, SPAD, DMA, Yield, PN, GNPP, and HWS were all positively correlated with APC (p < 0.05) (Figure 9b). The VIP analysis found that the most important variables (VIP > 1) for Yield were PN and DMA (Figure 9c).

4. Discussion

4.1. Combined Application of Phosphorus Fertilizers Showed the Most Prominent Performance in Enhancing the Available Phosphorus Content in the Soil

In this study, there was no difference in the total phosphorus content of the soil among the phosphate fertilization treatments, but there was a difference in the APC. The M8U2 treatment had the highest APC, followed by MAP and UP treatment (Figure 3). This may be due to the fact that the orthophosphate ion of UP is released faster in the soil than that of MAP [23], and the combined application of MAP and UP reduces P fixation in the soil. In natural ecosystems, the transformation of steady-state P is more difficult than labile and moderately labile P [24]. In this study, the contents of labile P Ca2-P and moderately labile P Ca8-P in the soil of the M8U2 and UP treatments were higher than those of the MAP treatment, while the content of steady-state P Ca10-P was lower. The contents of Ca2-P and Ca8-P were the highest in the soil of the UP treatment, and the Ca10-P content was the lowest (Table 3). In addition, the proportion of O-P in the soil total phosphorus of the M8U2 treatment was significantly smaller than that of the MAP and UP treatments (Figure 4). The positive effect of Ca2-P and Ca8-P contents on the APC was also verified in the path analysis (Figure 9a). This may be related to the fact that after applying acidic P fertilizer to liming soil, as the pH value decreases, the adsorbed P undergoes desorption reactions, causing P to transfer from the solid phase to the liquid phase. On the other hand, the solubility of calcium is increased to reduce the binding of calcium ions with P [25,26].

4.2. Combined Application of Phosphorus Fertilizers Showed the Most Prominent Performance in Enhancing Phosphorus Utilization Efficiency

In this study, the application of P fertilizers enhanced the P accumulation in various organs of the soybean plant. The P uptake (11.34% and 11.47%), PUPE (57.24% and 57.95%), PUE (14.16% and 23.50%), and PPE (23.12% and 30.56%) of the M8U2 treatment were higher than those of the MAP and UP treatments (Figure 6, Table 4). This may be due to that the soil of the M8U2 treatment has a higher APC, which promotes the growth and development of the root system and enhances the ability of the root system to absorb and transport P, thus improving the overall growth and productivity of the plant [27,28]. However, the PHI of the M8U2 treatment was 7.22% and 7.54% lower than that of the MAP and UP treatments, respectively. This may be related to the high P accumulation in the plant [29]. The P accumulation in plants in the M8U2 treatment was 11.34% and 11.47% higher than that of the MAP and UP treatments, respectively, and the P accumulation in grains was 11.14% and 11.41% higher than that of the MAP and UP treatments, respectively, thus leading to a lower PHI in the M8U2 treatment.

4.3. Combined Application of Phosphorus Fertilizers Showed the Most Prominent Performance in Enhancing Soybean Yield

The application of P fertilizers significantly increased the soybean yield in the two growing seasons (33.26–43.45%) compared with CK, among which the soybean yield of the M8U2 treatment was the highest. Studies have shown that increasing plant P accumulation can increase Pn by increasing leaf stomatal conductance [30]. In this study, the M8U2 treatment had a higher leaf SPAD value and Pn and an earlier occurrence of the maximum DMA and maximum DMA rate. Therefore, the M8U2 fertilization method promotes the synthesis of assimilates in soybean. On the other hand, it may be related to the transfer of carbohydrates [31,32]. Under the M8U2 treatment, the grain number per pod and the hundred-grain weight reached the maximum, indicating an increase in the supply of assimilates to flowers and pods. This is also demonstrated in the projection of importance to yield (Figure 9c). Notably, previous studies have shown that PNPA has a significant impact on yield [33,34]. However, in this experiment, PNPA had no significant impact on yield. This may be due to the fact that in this experiment, 2 seeds were sown in each hole to ensure seedling emergence. When the cotyledons were fully unfolded, one soybean seedling was retained in each hole. In the growing season, there were no cases of soybean seedlings dying due to diseases or pests. Meanwhile, all fertilizers were applied during the V4-R6 stage without affecting the seedling emergence. Therefore, there was no significant difference in the number of harvested plants per unit area between treatments, and PNPA had no significant impact on yield.
Although this study has clarified the feasibility of the combined application of P fertilizers in enhancing PUE and soybean yield in liming soils, further research is needed on its effects on the utilization of other nutrients in the soil-plant system and its performance under other soil types and crops.

5. Conclusions

In liming soil, the application of acidic phosphorus fertilizer significantly increases the content of available phosphorus, total phosphorus, and inorganic phosphorus in the soil compared with the control, promoting the enhancement of soybean productivity. Compared with the application of single phosphorus fertilizers, the combined application of acidic phosphorus fertilizers reduced soil fixation of phosphorus and increased soil available phosphorus content, plant phosphorus accumulation, plant photosynthetic capacity, and dry matter accumulation, thereby increasing soybean yield, net revenue, and phosphorus use efficiency. Therefore, applying ammonium phosphate and urea phosphate in a ratio of 80%:20% is an effective practice to enhance soil phosphorus availability and crop yield in liming soils.

Author Contributions

D.L.: Conceptualization, Investigation, Software, Methodology, Data Curation, Visualization, Writing—Original Draft. H.D.: Methodology, Formal Analysis, Data Curation, Software, Visualization, Writing—Review and Editing. S.L.: Methodology, Data Curation, Software, Visualization, Writing—Review and Editing. Y.H., W.C. and K.W.: Formal Analysis, Data Curation, Software. H.H. and H.F.: Conceptualization, Supervision, Writing—Review and Editing, Funding Acquisition, Validation. All authors have read and agreed to the published version of the manuscript.

Funding

This study was financially supported by the Special Fund for Key Science & Technology Program in Xinjiang, China (No. 2022B02053), the Guizhou Phosphate Chemical Group-Shihezi University Enterprise Joint Project (No. WF-001-2022-JS-00117, LH00012024JS20058), the Guiding Science and Technology Plan Project of Xinjiang Production and Construction Corps (No. 2023ZD063), and the Science and Technology Plan Project of Huyanghe (No. 2025D07).

Data Availability Statement

The original contributions presented in this study are included in the article. Further inquiries can be directed to the corresponding authors.

Conflicts of Interest

The authors declare no conflicts of interest. Author S.L. and H.H. was employed by the company Guizhou Phosphate Chemical Group Co., Ltd. The remaining authors declare that the research was conducted in the absence of any commercial or financial relationships that could be construed as a potential conflict of interest.

References

  1. Grant, C.A.; Flaten, D.N.; Tomasiewicz, D.J.; Sheppard, S.C. The importance of early season phosphorus nutrition. Can. J. Plant Sci. 2001, 81, 211–224. [Google Scholar] [CrossRef]
  2. Moreira, A.; Moraes, L.A.C.; Moretti, L.G.; Aquino, G.S. Phosphorus, Potassium and Sulfur Interactions in Soybean Plants on a Typic Hapludox. Commun. Soil Sci. Plant Anal. 2018, 49, 405. [Google Scholar] [CrossRef]
  3. Taiz, L.; Zeiger, E.; Møller, I.M.; Murphy, A. Fisiologia e Desenvolvimento Vegetal, 6th ed.; Artmed Editora: Porto Alegre, Brazil, 2017. [Google Scholar]
  4. Chen, Q.; Qu, Z.; Li, Z.; Zhang, Z.; Ma, G.; Liu, Z.; Wang, Y.; Wu, L.; Fang, F.; Wei, Z.; et al. Coated Diammonium Phosphate Combined with Humic Acid Improves Soil Phosphorus Availability and Photosynthesis and the Yield of Maize. Front. Plant Sci. 2021, 12, 759929. [Google Scholar] [CrossRef]
  5. Cordell, D.; Drangert, J.O.; White, S. The story of phosphorus: Global food security and food for thought. Glob. Environ. Change 2009, 19, 292–305. [Google Scholar] [CrossRef]
  6. Castro, B.; Torrent, J. Phosphate sorption by calcareous Vertisols and Inceptisols as evaluated from extended P-sorption curves. Eur. J. Soil Sci. 1998, 49, 661–667. [Google Scholar] [CrossRef]
  7. Roberts, T.L.; Johnston, A.E. Phosphorus use efficiency and management in agriculture. Resour. Conserv. Recycl. 2015, 105, 275–281. [Google Scholar] [CrossRef]
  8. Zhu, J.; Li, M.; Whelan, M. Phosphorus activators contribute to legacy phosphorus availability in agricultural soils: A review. Sci. Total Environ. 2018, 612, 522. [Google Scholar] [CrossRef]
  9. Sharma, S.; Sekhon, B.S.; Singh, P.; Siddiqui, M.H.; Kesawat, M.S. Response of biochar derives from farm waste on phosphorus sorption and desorption in texturally different soils. Heliyon 2023, 9, e19356. [Google Scholar] [CrossRef] [PubMed]
  10. Zhao, Y.; Li, R.; Huang, Y.; Sun, X.; Qin, W.; Wei, F.; Ye, Y. Effects of various phosphorus fertilizers on maize yield and phosphorus uptake in soils with different pH values. Arch. Agron. Soil Sci. 2022, 68, 1746–1754. [Google Scholar] [CrossRef]
  11. Zhang, Y.H.; Zhang, J.; Zhang, F.L.; Liu, D.; Wei, C.Z. Effects of different phosphorus fertilizerson soil phosphorus availability and maize yield under drip irrigation. J. Soil Water Conserv. 2019, 33, 189–195. [Google Scholar]
  12. Li, H.; Wang, X.; Liang, Q.; Lyu, X.; Li, S.; Gong, Z.; Dong, S.; Yan, C.; Ma, C. Regulation of Phosphorus Supply on Nodulation and Nitrogen Fixation in Soybean Plants with Dual-Root Systems. Agronomy 2021, 11, 2354. [Google Scholar] [CrossRef]
  13. Taliman, N.A.; Dong, Q.; Echigo, K.; Raboy, V.; Saneoka, H. Effect of Phosphorus Fertilization on the Growth, Photosynthesis, Nitrogen Fixation, Mineral Accumulation, Seed Yield, and Seed Quality of a Soybean Low-Phytate Line. Plants 2019, 8, 119. [Google Scholar] [CrossRef] [PubMed]
  14. Kılınçoğlu, N.; Karaman, A.; Ramazanoğlu, E.; Beyyavas, V.; Cevheri, C.İ.; Sakin, E. The impact of different fertilizers on physiological and biochemical attributes of soybean plants grown in saline and non-saline soils. Gesunde Pflanz. 2023, 75, 1933–1944. [Google Scholar] [CrossRef]
  15. Lu, R. Soil Chemical Analysis Method for Agriculture; China Agriculture Science and Technique Press: Beijing, China, 2000. [Google Scholar]
  16. Zhang, N.Y.; Qiong, W.; Huang, S.M.; Ping, Z.H.U.; Zhang, S.X. Characteristics of inorganic phosphorus fractions and their correlations with soil properties in three non-acidic soils. J. Integr. Agric. 2022, 21, 3626–3636. [Google Scholar] [CrossRef]
  17. Xu, Y.; Wang, C.; Bi, Y.; Zhang, Y.; Cheng, W.; Sun, Z.; Zhang, J.; Lv, Z.; Guo, X. Influence of cow manure vermicompost soil mixtures on two flowers seedling cultivation. Acta Hort. 2014, 1018, 583–588. [Google Scholar]
  18. Dong, S.; Bismark, A.-B.; Li, S.; Gao, Q.; Zhou, X.; Li, C. Ammonium Polyphosphate Promotes Maize Growth and Phosphorus Uptake by Altering Root Properties. Plants 2024, 13, 3407. [Google Scholar] [CrossRef] [PubMed]
  19. Wan, C.; Gao, S.; Wang, J.; Lei, X.; Ge, J.; Tao, J.; Gao, J. Optimal planting density combined with phosphorus input promotes common buckwheat resource use efficiency and productivity to increase grain yield. Agric. Water Manag. 2023, 287, 108468. [Google Scholar] [CrossRef]
  20. Chen, Y.; Zhang, Z.; Wang, X.; Sun, S.; Zhang, Y.; Wang, S.; Zhang, L. Sap velocity, transpiration and water use efficiency of drip-irrigated cotton in response to chemical topping and row spacing. Agric. Water Manag. 2022, 267, 107611. [Google Scholar] [CrossRef]
  21. Mao, L.; Zhang, L.; Sun, X.; van der Werf, W.; Evers, J.B.; Zhao, X.; Zhang, S.; Song, X.; Li, Z. Use of the beta growth function to quantitatively characterize the effects of plant density and a growth regulator on growth and biomass partitioning in cotton. Field Crops Res. 2018, 224, 28–36. [Google Scholar] [CrossRef]
  22. Ru, C.; Wang, K.; Hu, X.; Chen, D.; Wang, W.; Yang, H. Nitrogen modulates the effects of heat, drought, and combined stresses on photosynthesis, antioxidant capacity, cell osmoregulation, and grain yield in winter wheat. J. Plant Growth Regul. 2023, 42, 1681–1703. [Google Scholar] [CrossRef]
  23. Hussein, H.A.Z.; Awad, A.A.M.; Beheiry, H.R. Improving Nutrients Uptake and Productivity of Stressed Olive Trees with Mono-Ammonium Phosphate and Urea Phosphate Application. Agronomy 2022, 12, 2390. [Google Scholar] [CrossRef]
  24. Helfenstein, J.; Tamburini, F.; von Sperber, C.; Massey, M.S.; Pistocchi, C.; Chadwick, O.A.; Frossard, E. Combining spectroscopic and isotopic techniques gives a dynamic view of phosphorus cycling in soil. Nat. Commun. 2018, 9, 3226. [Google Scholar] [CrossRef] [PubMed]
  25. Navizaga, C.; Boecker, J.; Sviklas, A.M.; Galeckiene, J.; Baltrusaitis, J. Adjustable N: P2O5 ratio urea phosphate fertilizers for sustainable phosphorus and nitrogen use: Liquid phase equilibria via solubility measurements and Raman Spectroscopy. ACS Sustain. Chem. Eng. 2017, 5, 1747–1754. [Google Scholar] [CrossRef]
  26. Tang, J.W.; Mu, R.Z.; Zhang, B.L.; Fan, X.S. Solubility of urea phosphate in water+ phosphoric acid from (277.00 to 354.50) K. J. Chem. Eng. Data 2007, 52, 1179–1181. [Google Scholar] [CrossRef]
  27. Bovill, W.D.; Huang, C.Y.; McDonald, G.K. Genetic approaches to enhancing phosphorus-use efficiency (PUE) in crops: Challenges and directions. Crop Pasture Sci. 2013, 64, 179–198. [Google Scholar] [CrossRef]
  28. de Vries, J.; Evers, J.B.; Kuyper, T.W.; van Ruijven, J.; Mommer, L. Mycorrhizal associations change root functionality: A 3D modelling study on competitive interactions between plants for light and nutrients. New Phytol. 2021, 231, 1171–1182. [Google Scholar] [CrossRef]
  29. Han, Y.; White, P.J.; Cheng, L. Mechanisms for improving phosphorus utilization efficiency in plants. Ann. Bot. 2022, 129, 247–258. [Google Scholar] [CrossRef]
  30. Liu, H.; Hu, C.; Sun, X.; Tan, Q.; Nie, Z.; Hu, X. Interactive effects of molybdenum and phosphorus fertilizers on photosynthetic characteristics of seedlings and grain yield of Brassica napus. Plant Soil 2010, 326, 345–353. [Google Scholar] [CrossRef]
  31. Cho, Y.; Suh, S.K.; Park, H.K.; Wood, A. Impact of 2, 4-DP and BAP upon pod set and seed yield in soybean treated at reproductive stages. Plant Growth Regul. 2002, 36, 215–221. [Google Scholar] [CrossRef]
  32. Rotundo, J.L.; Borrás, L.; Westgate, M.E. Linking assimilate supply and seed developmental processes that determine soybean seed composition. Eur. J. Agron. 2011, 35, 184–191. [Google Scholar] [CrossRef]
  33. Egli, D.B. Yield improvement and yield components: A comparison of corn and soybean. Crop Sci. 2023, 63, 1019–1029. [Google Scholar] [CrossRef]
  34. Kannberg, S.; Lindsey, A.J.; Chiavegato, M.B.; Lindsey, L.E. Effect of ultra-early, early, and normal soybean planting dates and rye cover crop on soybean grain yield. Agron. J. 2024, 116, 1321–1330. [Google Scholar] [CrossRef]
Figure 1. Temperature (a) and precipitation (b) of the soybean growing season in the experimental site in 2022 and 2023.
Agronomy 15 02852 g001
Figure 2. Row spacing, mulch film, and drip tape locations in the plots.
Agronomy 15 02852 g002
Figure 3. Soil total phosphorus (a) and available phosphorus (b) content during the growing season of soybean in 2023. The error bars represent the standard deviation of the mean (n = 3), and the letters on the bars indicate significant differences between different treatments (p < 0.05).
Agronomy 15 02852 g003
Figure 4. The proportion of different inorganic phosphorus components in the total phosphorus in the 0–20 cm soil layer at the R8 stage of soybean. The error bars represent the standard deviation of the mean (n = 3). The letters on the bars indicate significant differences between different treatments (p < 0.05).
Agronomy 15 02852 g004
Figure 5. Total phosphorus content of soybean roots, stems, leaves, petioles, pod walls, and grains under phosphorus fertilization treatments in the growing season of 2023. Error bars indicate the standard deviation of the mean (n = 3), and different lowercase letters indicate significant differences between different treatments (p < 0.05).
Agronomy 15 02852 g005
Figure 6. Phosphorus uptake, phosphorus uptake efficiency (PUPE), phosphorus use efficiency (PUE), phosphorus productive efficiency (PPE), and phosphorus harvest index (PHI) of soybeans under phosphorus fertilization treatments in the growing season of 2023. The error bars represent the standard deviation of the mean (n = 3). Different lowercase letters on the bars represent significant differences between different treatments (p < 0.05).
Agronomy 15 02852 g006
Figure 7. The net photosynthetic rate (Pn), stomatal conductance (Gs), intercellular CO2 concentration (Ci), transpiration rate (Tr), and SPAD values of soybean leaves at the peak-flowering (R2) stage under phosphorus fertilization treatments in the growing seasons of 2022 and 2023. The error line represents the standard deviation of the mean (n = 3). Different lowercase letters in the column indicate significant differences between different treatments (p < 0.05). Y represents the year, T represents the phosphorus fertilization treatments, and Y × T represents the interaction between the year and the treatment. **, p < 0.01; ns, p > 0.05.
Agronomy 15 02852 g007
Figure 8. Dynamics of dry matter accumulation in soybean under phosphorus fertilization treatments during the growing seasons of 2022 and 2023. wmax represents the maximum dry matter accumulation (g m−2); te represents the number of days after emergence (d) when the maximum dry matter accumulation is reached; tm represents the number of days (d) after emergence when the maximum dry matter accumulation rate is reached. Different lowercase letters indicate significant differences between different treatments (p < 0.05). Y represents the year, T represents the phosphate fertilization treatments, and Y × T represents the interaction between the year and the treatment. **, p < 0.01; ns, p > 0.05.
Agronomy 15 02852 g008
Figure 9. Path analysis of soil inorganic phosphorus and available phosphorus in the growing seasons of 2022 and 2023 (a), correlation analysis of net photosynthetic rate (Pn), SPAD, dry matter accumulation (DMA), Yield, pod number per plant (PN), grain number per pod (GNPP), HGW (100-grain weight), and APC (available phosphorus content) (b), and projection of the importance of Pn, SPAD, DMA, PN, GNPP, HGW, and APC to Yield (c).
Agronomy 15 02852 g009
Table 1. Physicochemical properties of the 0–20 cm soil layer before sowing in the experimental site.
YearBulk Density
(g cm−3)
Organic Matter Content (g kg−1)Total Nitrogen Content (g kg−1)Hydrolyzable Nitrogen Content (mg kg−1)Available Phosphorus Content (mg kg−1)Available Potassium Content (mg kg−1)pH
20221.3010.60.5357.222.7182.77.8
20231.2411.20.6361.624.3194.67.5
Table 2. Application proportions of N, P2O5, and K2O in soybean growth stages.
Days After Emergence (d)N (%)P2O5 (%)K2O (%)
V4434
R1131117
R2202638
R310335
R420123
R512146
R621127
Notes: V4 represents the seedling stage (25 days after emergence), and R1, R2, R3, R4, R5, and R6 represent the initial-flowering, peak-flowering, initial-podding, peak-podding, initial grain-formation, and grain-filling stage, respectively.
Table 3. Inorganic phosphorus content in soil during the fully-ripe (R8) growth stage in 2023.
TreatmentCa2-PCa8-PCa10-PAl-PFe-PO-P
CK13.74 d40.24 d60.44 c13.58 b6.29 b26.50 c
MAP105.88 c156.16 c162.32 a33.65 a17.02 a70.00 a
UP120.334 a182.31 a147.18 b33.49 a18.92 a66.40 b
M8U2110.39 b169.78 b157.46 a33.45 a17.57 a66.30 b
Note: Different lowercase letters indicate significant differences between treatments within the same year in Duncan’s test (p < 0.05).
Table 4. The plant number per unit area (PNPA), pod number per plant (PN), grain number per pod (GNPP), hundred seed weight (HGW), yield, net revenue (NR), and phosphorus productive efficiency (PPE, kg kg−1 P) of soybean under phosphorus fertilization treatments in the growing seasons of 2022 and 2023.
TreatmentPNPA
(Plant m−2)
PN
(Pods/Plant)
GNPP
(Seeds/Pod)
HGW
(g/100 Seeds)
Yield
(kg ha−1)
NR
(USD ha−1)
PPE
(kg kg−1)
CK12.15 a106.50 b2.62 c16.28 d3732.62 c2061.79 d
MAP12.12 a115.67 a2.80 b19.46 b5049.42 b3479.17 b8.78 b
UP12.01 a115.67 a2.81 b18.90 c4974.12 b3263.92 c8.28 b
M8U212.15 a114.50 a2.92 a20.41 a5354.39 a3805.29 a10.81 a
Source of variance (p)
Ynsnsnsnsnsnsns
Tns***********
Y × Tnsnsnsnsnsnsns
Notes: T represents treatments; Y represents year. Different lowercase letters indicate significant differences between treatments within the same year in Duncan’s test (p < 0.05). *, p < 0.05; **, p < 0.01; ns, p > 0.05.
Disclaimer/Publisher’s Note: The statements, opinions and data contained in all publications are solely those of the individual author(s) and contributor(s) and not of MDPI and/or the editor(s). MDPI and/or the editor(s) disclaim responsibility for any injury to people or property resulting from any ideas, methods, instructions or products referred to in the content.