Abstract
Ancestral Andean crop flours (ACF) from Ecuador such as camote (Ipomea Batatas), oca (Oxalis tuberosa), achira (Canna indica), mashua (Tropaeolum tuberosum), white arracacha (Arracacia xanthorrhiza), taro (Colocasia esculenta) and tarwi (Lupinus mutabilis sweet) were characterized in terms of physico-chemical and techno-functional properties in order to identify their potential as new alternative ingredients in food products. Flour from camote, oca, achira and arracacha showed a low protein content (<5%), mashua and taro had ~9% and tarwi flour registered higher values than 52%. Carbohydrate content ranged from 56–77%, with the exception of tarwi, just reaching 6.9%. Starch content was relatively low in ACF but in taro and tarwi, starch practically constituted almost all the carbohydrates. The highest amylose content in starch, in decreasing order, was found in mashua, oca, tarwi and achira flours, the rest being ≤15%. Fiber content exceeded 10% in most crops, except for oca flour with 5.33%. Fat content was generally lower than 1%, except in tarwi with ~17%. All flours showed a gel-like behavior G′ > G″, this being very similar in camote, achira and tarwi flours. The exception was taro with G′ < G″. Mashua flour registered the highest value for phenol content (60.8 µg gallic acid equivalents/g of sample); the content of phenols was not exclusively responsible for the antioxidant activity, since flours with the highest activity were arracacha and tarwi, which presented the lowest phenol content among all flours. Principal component analyses (PCA) showed a high correlation between moisture, fiber, solubility and water absorption capacity, with viscoelastic behavior and total phenolic content; while starch content was correlated with melting temperature, poorly and inversely related to protein and fat. For PC1, achira, camote and taro flours were very similar, and different from oca and mashua flours. Tarwi showed its own characteristics according to PC1 and 2. Because of their properties, Andean crop flours could have a great potential for use in food technology.
1. Introduction
The Andean region comprising Bolivia, Peru, Ecuador and Colombia has been catalogued as one of the areas of the world possessing the greatest plant richness and crop diversity with an important collection of germplasm related to three of the main tubers that are the most typically consumed: oca (Oxalis tuberosa), mashua (Tropaeolum tuberosum) and melloco (Ucullus tuberosus) [1,2]. Andean crops are developed in areas considered by modern agriculture (mainly focused on extensive crops) as marginal lands, even with a reduced probability of producing quality food; however, adapting to the environment makes the growth of these crops possible [2]. The richness of these crops in nutrients and pharmacological properties [3,4], as well as their use in traditional medicine have been previously described. The exploitation of extensive crops by large companies, it being economically more profitable to produce and market a few plant species such as potato, rice, soya or corn, make Andean crops underutilized or in disuse, limited to domestic consumption in certain restricted regions, so that the reduced consumption will be less each day.
Consumers are increasingly demanding both raw materials and intermediate or final products with better and varied nutritional characteristics perceived as natural [5] and, if possible, that contribute to their health and wellbeing [6]. In this sense, tubers, rhizomes and legumes from the Andean region, due to their high nutritional value, could play an important role in the development of food products, even functional products, as well as covering the demand of food for people with special requirements, as it is the case of those intolerant or allergic to gluten, since some Andean crops are gluten-free. In addition, the promotion of the exploitation of these resources would be of socio-economic interest, favoring biodiversity and the impact and sustainability of the Andean region.
There are several studies in the literature on these crops, not only from the Andean region, but also from other geographical areas. It is well known that their composition can vary due to factors inherent to the crop, and also greatly by the geographical distribution of the cultivars, as they are conditioned by climatic factors and the type of soil [7,8,9], sometimes giving rise to denominations of origin [10,11]. In the Andean region, differences of thousands of meters can be found within the higher areas (“altiplanos”), and even more so with those near sea level; therefore, the climatic conditions can be very different. In this sense, Sulistiani, et al. [12] recently studied the effect that different geographical areas could have on the biochemical parameters of camote in Indonesia, taking into account temperatures and fertilizers, and observing the greatest differences between highlands and lowlands, being the variations in altitude of 1400 m between them.
The knowledge of the nutritional composition and physico-chemical properties of crops according to regions and other factors, is of great importance to evaluate their functional properties and technological suitability. Obtaining flours is a trigger for the sustainable search and production of these non-conventional crops. These flours may or may not have similar properties to traditional flours, so Andean crop flours can be an alternative option to substitute traditional flours in the industry, considering as well their possible different applications. Most studies have referred to tubers or grains, or their starch, such as arracacha flour from Brazil [7], taro flour from Cuba [13], starch and flour of Brazilian camote [14], flour of the Philippines camote [15], flour and starch of taro from Thailand varieties [9] and Tarwi flour from Egypt [16]. However, there are few studies on the characterization of flours of some of these crops from the Andean region.
The objective of the present work is to obtain flours from Andean crops of different nature (5 tubers, 1 rhizome and 1 legume grain), selected for being the most consumed in the rural areas in the region of Ambato (Ecuador). Then, the physico-chemical characterization and techno-functional properties of these flours were analyzed to identify their potential as new ingredients in the development and production of healthier foods.
2. Materials and Methods
2.1. Andean Crop Flours
Andean crops ready for consumption were purchased in a market in Ambato, Tungurahua (Ecuador) grown at an altitude of 2500 m above sea level (masl). According to their botanical nature, Andean crops were classified into three categories: (A) rhizomes: achira (Canna indica); (B) tubers: camote (Ipomoea batatas), mashua (Tropaeolum tuberosum), oca (Oxalis tuberosa), taro (Colocasia esculenta), and white arracacha (Arracacia xanthorrhiza); C) legume grain: tarwi (Lupinus mutabilis sweet). To obtain the flours, the tubers, rhizomes and grains were washed with water and brushed until all the impurities found in the surface were eliminated. Then, tubers and rhizomes were cut into slices of ~3 mm and tarwi was used in its original form. All slices and grains were dried at 60 °C for ~6 h in a convective oven dryer (Gander MTN, Saint Paul, MN, USA) until the moisture values were constant. Finally, the dried slices of the Andean crops were milled in an industrial mill for grains (Inox equipment IE1, Riobamba, Ecuador), the grinding was carried out through the crushing process until obtaining a fine powder. All samples were hermetically packed and stored at room temperature until further analysis.
2.2. Proximate Composition of Flours and Energy Value
The moisture, ash, crude protein, crude fiber, and fat contents were evaluated following the official methods AOAC 925.09, AOAC 923.03, AOAC 920.87, AOAC 985.29, and AOAC 922.06, respectively (AOAC, 2005) [17]. Carbohydrate content was determined by difference. The analyses were performed in triplicate.
The total calorie content was estimated x100 g, as the overall sum of calories of the individual components, taking into account that the energy value for each component is as follows: fat (×9 kcal/g), protein (×4 kcal/g), carbohydrate (×4 kcal/g), and fiber (×2 kcal/g) (FAO, 1988) [18], and expressed as kcal/100 g. Values were estimated by the Atwater system.
2.3. Total Starch and Amylose Content
Total starch was quantified enzymatically (AOAC Method 996.1, AACC Method 76-13.01) using a Megazyme Total Starch Assay Kit (Megazyme). The amylose content were quantified with Amylose/Amylopectin Megazyme Assay Kit (Megazyme). The absorbance measurements for the determination of the starch and amylose contents were carried out using a UV-Vis spectrophotometer (Thermo Fisher, Waltham, MA, USA) at a wavelength of 510 nm. All determinations were carried out in triplicate.
2.4. Physico-Chemical Properties of Flours
2.4.1. pH and Titratable Acidity
The determination of pH and acidity were carried out following the method of Salazar, et al. [19]. All tests were carried out in triplicate.
2.4.2. Color
In order to measure the color of flours, a colorimeter (ColorFlex EZ, HunterLab, Reston, VA, USA) and the CIELAB color scale were employed, following the method described by Salazar, et al. [20]. The flour samples were placed in small Petri dishes at a depth of 0.5 cm to obtain a uniform distribution. Measurements were made in five sections of the box. A minimum of 25 measurements were made in different parts of the sample at least in triplicate.
2.4.3. Granulometry
The particle size was determined according to the Standard INEN NTE 0517 (1981), as described by Salazar, et al. [20]. Briefly, the method consisted of placing the flour (100 g) in a set of 5 sieves (Tyler series, Mentor, OH, USA); the diameter decreased downward, and the sieves were labeled starting from the top down 40 (420 μm), 60 (250 μm), 100 (149 μm), 140 (106 μm), 200 (75 μm) and the pan collector. The sieves vibrated mechanically in a shaker equipment (Tyler series, Mentor, OH, USA) for 5 min and the flour retained in each sieve, after being carefully collected, was weighed. To measure size, uniformity index (UI) and fineness modulus (FM) were used. The fineness modulus is defined as the sum of weight of the fractions retained in each sieve divided by 100; each weight of fraction retained is multiplied by a factor number of the respective sieve (sieve 40: factor 5, sieve 60: factor 4, sieve 100; factor 3, sieve 140: factor 2, sieve 200: factor 1, pan collecter: factor 0). Fineness modulus of flours is classified in three categories: Fine (0–2), Medium (2–4), and Coarse (above 4). The uniformity index classifies the particle size of flours into fine, medium and coarse, and is expressed as g/10 g of sample of different particle size, calculated by the average retention on the different sieves. The assays were undertaken in triplicate.
2.4.4. Bulk Density
The bulk density (bD) of flours was determined as described by Gujska, et al. [21]. Inside a graduate cylinder, flour was added until the 100 mL line and weighed. The bottom of the cylinder was gently tapped three times until there was no further diminution. The bulk density was calculated by dividing the mass of the flours (g) by the volume (cm3) occupied in the cylinder. The volume of the flours was used in mass/volume calculation [22]. The determinations were carried out in triplicate.
2.4.5. Scanning Electron Microscopic (SEM)
The morphology of the flour samples was obtained with a scanning electron microscope (SEM) (Tescan, Vega3, Warrendale, PA, USA). The organic samples were placed on an aluminum support provided with a double-sided carbon tape, and each sample was observed at 3 Kv in the microscope, with a field of view of 253 μm and a magnification of 546×. The individual particle size distribution was determined using the software of the equipment by measuring the minor and major axis of the particles, and calculating the mean value of all measurements by distribution ranges (0–10 µm, 10–20 µm, 20–30 µm, 30–40 µm, 40–50 µm and 50–60 µm). The distribution of the aggregates (considered as several particles joined together) was determined in the same way. The total average particle size was also determined. The results were expressed as the mean value.
2.4.6. Differential Scanning Calorimetry
Differential scanning calorimetry (DSC) measurements were taken with DSC 3 equipment (Mettler Toledo, Columbus, OH, USA) and the analyses were carried out as described by Salazar, et al. [20]. Approximately 10 mg each flour (dry weight basis), was weighed into aluminum pan and 55 μL of distilled water was then added. An empty pan was used for control purposes. The cups were hermetically sealed and held for 24 h at 4 °C [23]. Finally, the sample was placed inside the DSC equipment and heated from 30 to 120 °C at a heating rate of 10 K min−1 [24]. Nitrogen was used as a purge gas at a rate of 50 mL min−1. The tests were carried out in triplicate.
2.4.7. Swelling Power and Solubility
Solubility and swelling measurements were carried out according to the methodology described by Andrade-Mahecha, et al. [7] with slight modifications. A suspension of 1% of flour in water (w/v) was prepared and conditioned in a thermal bath at different temperatures: 50, 60, 70, and 80 °C for 30 min with constant agitation, and finally centrifuged at 4865× g for 15 min. The supernatant was separated, dried at 100 °C to constant weight (soluble solids weight), and the precipitate was the sediment or gel formed. Equations (1) and (2) were used for determination. The analyses were performed in triplicate.
2.4.8. Water Absorption Capacity (WAC)
The water absorption capacity (WAC) of the flours was determined according to Andrade-Mahecha, et al. [7]. A dispersion of flour (1% w/v) in water was prepared in a 500 mL centrifuge bottle, heated in a thermal bath at different temperatures: 50, 60, 70, and 80 °C for 15 min under constant stirring, and then centrifuged (D-78532, Hettich®, Tuttlingen, Germany) at 157× g for 10 min. After decanting the supernatant, each bottle was weighed, and WAC was expressed using Equation (3).
2.5. Rheological Properties
For rheological evaluation doughs were prepared with 35% of Andean crop flours and 65% of water. The rheological tests were performed in a Compact Modular Rheometer (Anton Paar MCR302, Graz, Austria) using a cone-plate PP 25 (gap = 1 mm) for oscillatory tests. All tests were developed at a controlled temperature (25 °C). The viscoelastic behavior of the suspensions was carried out using dynamic mode tests, by deformation sweeps at a frequency of 1 Hz, and frequency scans in a range of 1–10 Hz. The registered dynamic rheological parameters were: storage modulus (G′), and loss modulus (G″). The power law model was used to fit both G′ (G′ = Go’·ωn’) and G″ = (G″ = Go”·ωn”) with the angular frequency ω (1, 30, 60, and 90 rad/s). The tests were carried out at least in triplicate.
2.6. Total Phenolic Content and Antioxidant Activity
2.6.1. Total Phenolic Content
Total phenolic compounds were quantified using Folin-Ciocalteu reagent [25] with certain modifications. For that, an aliquot of 2.5 mL of a flour in water suspension (250 mg flour with 10 mL deionized water) was mixed with 1 mL of Folin-Ciocalteu reagent sample, and samples were filtered prior the spectrophotometric analysis. The absorbance was measured at 765 nm (Boeckel Co S-220). Gallic acid was used as a standard and the results were expressed as µg gallic acid equivalent/g sample. All the samples were analyzed at least in triplicate.
2.6.2. Antioxidant Activity
The antioxidant activity was determined using the ABTS free radical [2,20-azino-bis-(3-ethylbenzothiazoline-6-sulfonic acid)] method using standard Trolox equivalent, as described by Villacrés, et al. [26], with slight modifications. For that, 250 mg flour with 10 mL deionized water was prepared. Readings were made on a UV/V spectrophotometer (Boeckel Co S-220, Hamburg, Germany) at a wavelength of 740 nm. The antioxidant activity was expressed as Trolox eq./g sample (dry weight basis), and all samples were determined at least in triplicate.
2.7. Experimental Design
Results were analyzed by one-way and two-way ANOVAs. Means were tested with Tukey’s multiple comparison test, with a significance level α = 0.05 using GraphPad Prism v5.03 (GraphPad Software, San Diego, CA, USA).
The multivariate analysis was carried out with all data values obtained from the flour analyses. Correlations among properties and/or components were calculated. Factorial analysis by principal component analysis was performed with varimax rotation. The hierarchical cluster analysis method was used to explore the organization of samples in groups depicting a hierarchy. The result of hierarchical cluster analysis is presented in a dendrogram plot.
3. Results
3.1. Proximal Composition
The different proximal compositions of the Andean crops are shown in Table 1. One fundamental parameter in farinaceous products is moisture content, as Barbosa, et al. [27] mentioned, because it is implicated in the handling, storage and processing of farinaceous foods, suggesting that it must be below 14% to maintain stability and avoid alteration. The moisture values of flours ranged from 5.94% to 18.87%, mashua flour registering the highest value followed by oca, probably attributed to the nature of the material. It is possible these two flours had some other hygroscopic compounds. Thus, a substantial content of free sugars (such as sucrose in oca), and hydrophilic proteins in mashua, could interact with water through hydrophilic groups to establish hydrogen bonds, which would increase the water presence in the samples [7,28].

Table 1.
Chemical composition of andean crops flours: proximal composition, starch, amylose and amylopectin (%), calories (kcal/100 g), and acidity (expressed as lactic acid percent).
The flour protein contents comprised a wide range, from 1.63% (oca) to 52.82% (tarwi) (p < 0.05) (Table 1). Again, the flour from tarwi (legume grain) shows a very different composition, with a protein content similar to those reported by Villacrés, et al. [29] in samples of debittered tarwi from Ecuador (54.05%), and much higher than that found in tarwi flour from Egypt (43.17%) [16]. The higher protein content compared with the other crops analyzed is due to its leguminous nature, with a high nitrogen fixation capacity [30]. A high protein content represents an alternative for the development of enriched foods with a different source of protein or to balance protein-deficient flour blends, also conferring texture to the flour. The protein contents in tuber and rhizome whole flours are similar to those shown in mashua whole flour from Ecuador (9.21%) [31], or in achira extract from Mysore, India (4.72%) [32]. However, the values of Andean crops in the present work were lower to those found in camote pulp flour (6.3%) from Arequipa, Peru [33]; in Oca whole flour (6.84%) [34]; in arracacha (6.27%) from Cajamarca-Colombia (2750 masl) [35], and Taro (10.32%) from Cuba [13]. All of these variations could be attributable to the geographical zones and also to the variety.
The fat content was quite low (<1.06%) in tuber and rhizome flours (Table 1), while tarwi flour was the exception, with a fat content of 17.78%, as a consequence of the higher amount of polyunsaturated fatty acids present in this legume (Oleic 40.40%, linoleic 37.10%, linolenic 2.90%) [29]. The fat content in flours may differ depending on the crop variety and the geographical area. Much higher values in a tuber than the ones found in the present work were reported in achira extract grown on river banks in Mychuri, India (5.75%) [32]. However, the fat content was close to taro flours from Cuba (1.03%) despite their different geographical location [13].
The ash content in Andean crop flours ranged from 2.95% to 8.04% (p < 0.05) (Table 1). Achira flour obtained the highest values, almost similar to those reported by Andrade-Mahecha, et al. [7] who documented 7.48% in achira flour from Conchal, Brazil, (591 masl). The high ash value in achira is possibly due to the presence of minerals such as calcium, potassium, phosphorus, and iron (2.85% ash) [36], since flours from Andean crops are rich in mineral contents [37]. A high ash content was also found in taro flour from Cuba (5.65%) [13].
Nowadays, it is desirable that foods have a significant fiber content due to the nutritional properties that fiber may provide. Fiber content in these Andean flours ranged from 5.33% to 14.90%. In this sense, according to nutritional claims, the flours could be labeled as “high fiber” food (at least 6 g of fiber per 100 g), due to the presence of pulp and peel. Therefore, all of them would carry this nutritional claim, with the exception of oca flour, which would only carry the nutritional claim of “source of fiber” (foods with at least 3 g of fiber per 100 g) (Regulation 1924/2006) [38]. The peel is the part of the tubers, rhizomes and seeds where compounds such as cellulose, hemicellulose, lignin and pectins could be found [39]. Much higher values (25.1%) were found in achira extract from Mychuri, India [32]. As for tarwi grains, the fiber content is similar to that found in taro flour from Egypt [16]. Notably lower is the fiber content of taro flour from Cuba (4.38%) [13]; this fact could be important, because the aforementioned flour would not hold the “high fiber” claim as the one from Ecuador in the present work (14.90%).
Carbohydrate contents were significantly different in all flours (p < 0.05), and different ranges were observed: from high (74–78% for camote and arracacha, respectively) to low values (7%) in tarwi (Table 1). The results obtained in this work are similar to those reported by Matsuguma, et al. [40] in white arracacha tuber (82.2%) from Brazil. On the other hand, lower values (6.86%) in tarwi flour were observed in relation to those reported by Gross, et al. [41] in tarwi flour (28.2%) from Chile. These variations may be related to genotypic characteristics, metabolic status, environmental and maturity status [42]. Apart from tarwi, lower CH contents corresponded to mashua and taro, which coincide with higher protein contents in tubers. Legumes usually contain less carbohydrates than tubers, but in this work, in tarwi flour lower values (6.86%) were obtained as compared with tarwi flour from Egypt (21.73%) presenting 10% less protein content than that of the present work [16].
One of the most important characteristics expected in flours is a high starch content, but the Andean crop flours presented a large variability, with taro showing the highest values (p < 0.05), while most of the Andean crops mainly showed intermediate values (Table 1). The starch content of achira flour was slightly lower with respect to taro flour, with only 7.8% less starch, followed by arracacha and camote flour with 17–19% less starch content, while oca and mashua flours had a considerably lower starch content, which was around 31–37% less. Tarwi flour showed a marked lower starch content which was high compared with the value (1.3%) reported by Villacrés, et al. [26] in debittered lupino. The starch content of taro in the present work was similar to that of taro from the Kanchannaburi (region of Thailand) and lower (59.8–72.62%) than that of some other varieties from several regions (Chiang Mai, Phetchaburi and Saraburi) in Thailand, attributing the drop in starch content to the decrease in average rainfall in the area [9]. The starch values in the present work are rather higher to those reported by Moorthy, et al. [43] in fresh tubers of arracacha (20%) of taro (10–18%), camote (12–30%) and oca (12%) from Andean regions of Peru; these authors mentioned that the values could be associated with genotypic characteristics, climatic and environmental factors and the state of maturation. The starch content of achira in the present work was similar to that of medium particle size achira flours (42–80 mesh), from tubers of the Conchal region (altitude 591 masl and subtropical climate) in Brazil [7]. These authors observed that according to the particle size selected for these flours, the starch content could vary up to 20%; thus, in flours of sizes >32 mesh, 42–80 mesh and 125–400 mesh, the starch content was 50.6%, 60.2% and 68.4%, respectively, indicating that large agglomerates could accumulate in the first two fractions. A similar effect was observed in yam (Ipomoea batatas) flours from Hebei (China), and the starch percentages obtained (43.58%), similar to those of the present work, presented a particle size of 355 µm; however, with particle size 75 µm, these authors obtained a somewhat higher content of starch (61.90%) [44]. The increase in starch with smaller particle sizes is attributed to the breakage of the flour structure so more active sites are exposed for enzymatic degradation [45]. In parallel, it has also been observed that the sugar content may increase slightly for the finest particle sizes, while decreasing for medium and coarse particle sizes, attributing this fact to the hydrolysis of starch into oligosaccharides and monosaccharides in the flour [44].
In some Andean flours, the carbohydrates are closely associated with the presence of starch content. Thus, in tarwi, taro and even achira, a great proportion of carbohydrates were starch (~86%, 93%, 75%, respectively). However, this ratio decreased drastically in camote and arracacha flours (~55%), while the starch content in total carbohydrates of oca and achira was markedly lower (~39%), which is associated with the high sugar content characteristic in these crops [46,47].
The amylose content ranged 1.95–15.2% (p < 0.05). The highest values were found in achira flour and the lowest in tarwi flour (Table 1). Typically, amylose is found in a proportion of between 15–20% in starch molecules [48]. Nevertheless, in the present work the relation of amylose with respect to starch is much higher in some flours, such as mashua (43.58%), oca (34.50%) tarwi (33.39%) and achira (29.11%), while lower percentages were found in camote, taro and arracacha with the lowest amylose content in starch (15.5%, 14.9% and 10.49%, respectively). The amylose: amylopectin or amylose to starch ratio, in addition to being explained by the botanical origin of the crop, determines the morphology and crystalline organization of the starch [48]. The amylose content in starch in taro flour is much lower than that found in varieties of white and purple mallanga (Colassia esculenta) from Colombia, 20.5% and 18.32%, respectively [49], while the varieties harvested in Cameroon have much more variable ranges (16.5–30.8%) [49,50]. Higher amylose to starch ratio has been found in camote of different cultivars from Thiruvananthaputam, India (20–25%) [51]. However, the amylose to starch ratio in 10 varieties of taro from areas of Thiruvananthaputam (India), ranged from 14.0% to 19.4%.
In addition to resistant starch, the higher the amylose content, the lower the digestibility of the starch, considering that amylose content favors a more compact structure, therefore making it less susceptible to enzymatic hydrolysis [14,48]. In this sense, the latter authors observed that different camote genotypes might have different compositions and, therefore, present a different digestibility behavior.
The caloric contents of tuber flours are close among them, and quite similar to cereal flours, such as wheat flour (~354 kcal/100 g), with the exception of mashua flour which presented a markedly inferior caloric content (p < 0.05) (Table 1). From a nutritional point of view, most tubers and legumes have a higher proportion of resistant starch/total starch than cereals [52], so nutritionally they would be of great interest in the daily diet.
3.2. pH and Acidity
The pH in farinaceous products is of great importance due to the influence it may have on the stability and sensory characteristics of the products in which the flours are incorporated. The pH values showed that these types of flour could be considered as slightly acidic (Table 1). All values are in a narrow range, between 5.85 and 6.41, being the lowest in camote and mashua, and the highest in oca and tarwi (p > 0.05). In food, weak acids are mostly found because they only dissociate partially and do not have a severe effect on pH, compared with strong acids [53]. Regarding acidity, mashua flour had the highest value; this value could be associated with the presence of oxalic and ascorbic acids reported in the composition of this tuber [54]. The rest of the Andean crop flours presented percentages that ranged from 0.12 to 0.50%. In this connection a measure of stability of the flours is linked to the percentage of acidity that should not exceed 2% (CODEX STAN 151-1989 (Rev. 1-1995) [55].
3.3. Color and Visual Appearance
Figure 1 shows the different Ecuadorian Andean flours and their respective crops of origin. The coloration as well as the granulometry of the different flours can be seen at a first glance. The color of food is a characteristic that consumers associate with the quality of the products and it is generally the first impression that the consumer perceives when purchasing a food. In the case of flours, the color allows or limits their use as ingredients in the preparation of different classic foods, but in these alternative flours, color can also mean an opportunity to design new products.
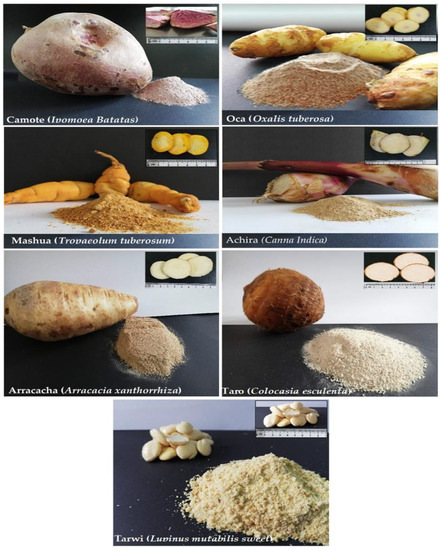
Figure 1.
Visual appearance of the Ecuadorian Andean crops and their corresponding flour produced.
The results of color measurement are shown in Table 2. Due to the different nature of the Andean crops, the parameters showed a significant difference (p < 0.05) with the exception of °H (tone). L* values were in a range of 59.2–78.66, which indicates that the ACF mostly presented light colors. Mashua, oca, achira and camote flours were slightly darker, and they did not exceed 70, probably attributable to the high content of sugars and proteins, as well as the effects of degradation of phenolic components, including chlorophyll and its derivatives, anthocyanins (cyanidins, pelargodins and peonidins), proanthocyanins, and carotenoids (α-β carotenes), which affect the Maillard reactions and caramelization [56]. Moreover, the low luminosity of achira could be due to the presence of certain enzymes such as polyphenol oxidase that contributes to enzymatic browning [57]. Regarding a*, Andean crop flours showed redness values in a range between 0.32 and 10.83, where oca and achira flour presented similar values (p < 0.05). The higher a* values were for camote and mashua (p > 0.05) due to the presence of flavonoids, antocyanins, phenolic acids and carotenoids [58,59,60]. The color of the Andean crops studied displayed an orange and yellow coloration in fresh, also attributable to the content of flavonoids and carotenoids. Mashua flour registered the highest values for parameter b*, followed by tarwi and oca, since the flours resembled the color of the original crops. The chromaticity (C*) results of mashua flour showed the highest values (40.81), approaching the area of the most saturated yellows. This effect can be attributed mainly to Maillard reactions and caramelization that occur in the dehydration process, due to the presence of reducing sugars (aldehyde or ketone group) and amino acids (free amino group) in this crop, which favor the development of brown color. The lowest value for chromaticity was for camote, and the rest of the samples had intermediate values. Regarding the tone (°H), camote flour presented the lowest values (44.40), with a slight shift towards the area of orange tones. This can be attributed to the fact that at temperatures above 66 °C and prolonged dehydration times, changes in the permeability of the cell membrane occur and, therefore, natural pigments in food such as carotenoids, niacin and riboflavin migrate [61,62]. On the other hand, arracacha, tarwi, taro, oca, achira, and mashua flours shifted in the CIELAB space towards intense yellows, probably due to water loss, and without alteration of pigments, the yellow coloration in these flours is enhanced. Finally, the whiteness index (WI) of taro presented the highest values, very close to those reported by Aboubakar, et al. [50] in a different variety of taro flour from Cameroon.
Table 2.
Color properties of andean crops flours.
3.4. Granulometry
In the production of farinaceous derivatives, the fineness modulus is a parameter that influences several quality attributes such as the dispersion of powdery material, rheological properties of the flours and doughs, texture attributes, solubility in water, and water and oil retention capacity [63,64]. The fineness index ranged from 2.87 to 3.84, which indicates that the particle size and size distribution corresponds to flours with medium-sized particles (Table 3). The whole flours obtained from Andean crops showed these fineness moduli because the presence of certain structures (such as cellulose, hemicellulose, lignin, and pectins, among others), corresponds to the fraction that provides the peel of tubers, rhizomes and seed, which contribute to the generation of coarser particles [65]. There were significant differences among ACF, with the highest fineness index in tarwi (p < 0.05), perhaps because the peel ratio is higher in this legume in relation to its size. Camote, mashua and taro showed a lower and similar fineness index, while the lowest corresponded to achira and oca (p < 0.05). A low fineness index is recommended for bulk flowing since it limits the surface contact and cohesion between flour particles [13]. These authors obtained values of 2.9 for polydispersity index in taro flours, showing a bimodal distribution. The uniformity index shows that flours have a higher amount of thick, rather than fine or medium-sized particles (p < 0.05) with the exception of achira flour, as consequence of the particular content of fine starch of this crop. However, it is important to note that the results of the grinding process were similar in all samples, and even though there are fractions of different sizes in the flours with differences in the fineness indexes, all of them are categorized as medium-sized.
Table 3.
Granulometry properties and Bulk density of Andean crops flours.
3.5. Bulk Density
Bulk density is a complex property in farinaceous products and it is of great importance for economical and functional reasons. While high bulk density is desirable for reducing shipping and packaging costs, low bulk density could influence the powder properties such as flowability and instant characteristics [66]. In the current study, values ranged from 0.47 to 0.71 (p < 0.05) (Table 3). The highest apparent density values were obtained in the oca samples (p < 0.05); this result is concordant with Subramanian, et al. [67] who reported that at higher moisture levels, bulk density increases. In addition, the medium size of the particles also favors the density of flour, because high densities are associated with fine particles, since they tend to agglomerate occupying a greater volume due to low resistance to compaction [68]. When particles are limited by a specific volume, they tend to organize randomly and empty spaces form between the particles, so this irregularity will increase the apparent density [69].
3.6. Scanning Electron Microscopy (SEM)
Camote flour showed globular, slightly ovoid, and irregular granules with a smooth and loose surface (Figure 2A). As Souza, et al. [14] described, non-starch compounds, probably proteins, were also observed. The particle size distribution was small (Table 4), mainly between 0–10 µm and 10–20 µm, with a reduced proportion of larger granules. Souza, et al. [14], observed different distribution profiles in four varieties of camote flour from Brazil; those of genotype G2 and G4 are similar in size distribution to that of the present work, while those of genotype G1 and G3 have a larger size distribution.
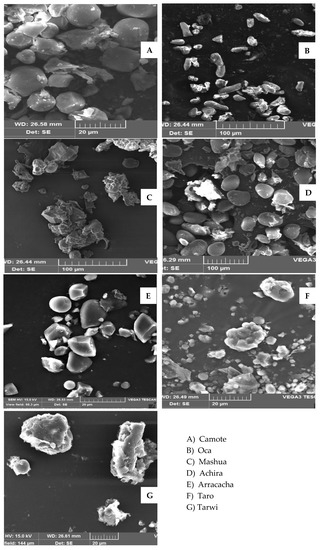
Figure 2.
Micrographs of andean crops flours with 546× magnification.
Table 4.
The particle size distribution of andean crops flours.
Oca flour showed an oval-shaped granule appearance, slightly elongated, with a smooth surface, and occasionally some deflated granules were observed (Figure 2B). The particle size distribution (Table 4) showed sizes much larger than those of the camote flour granules, with sizes widely distributed from 10–20 µm to 50–60 µm, although particles of 10–20 µm and 30–40 µm were predominant. A similar shape and size have been observed in the Mexican oca flour granules (Hernández-Uribe, et al. [70].
In mashua flour (Figure 2C), in addition to starch granules, non-starch components were observed around the granules in most cases; these structures could be mainly fiber and/or protein present in this type of Andean crops, similar to those reported by Pacheco, et al. [24]. The starch granules in the flour had an irregular spherical-like shape. The particle size distribution indicates the presence of two populations distributed uniformly in the two smaller sized fractions (40% in each one of them) and in the intermediate (30–40 µm) fraction (20%), that correspond mainly to isolated starch granules (Table 4). Additionally, some structures composed of granules and non-starch component are mixed forming a large piled-up organization (60–90 µm).
In addition to the granules, achira flour presented certain dense particles which could be proteins and fibers (Figure 2D), also described by Andrade-Mahecha, et al. [7]. The starch granules of this rhizome have a characteristic oval and flattened shape. The particle size distribution (Table 4) indicates a wide polydispersity in large granules, even greater than in oca flour, being the most abundant between 30–40 µm and 50–60 µm.
The starch granules in arracacha flour showed an irregular globular and/or irregular appearance, sometimes rounded and independent (Figure 2E). The distribution of their granules (Table 4) reveals that this flour has the smallest sizes most granules being within the range 10–20 µm. Both the appearance and the size are similar to those observed in arracacha starch from Colombia, with mean values of 4–12 µm [35], 9.81–13.74 µm (Pinzon et al., 2020), and 20–22 µm from Peru [71,72].
Starch granules in taro flour were small and asymmetrical (Figure 2F and Table 4). The size distribution was very irregular, being mostly between 0–10 µm, with some scarce oversized granules, which appeared in an aggregated or piled-up structure, with an average size of around 19.51 µm (Figure 2F and Table 4). These dimensions and appearance are similar to those reported by other authors in taro flours from Cuba (2.7 µm on average) [13] and Peru (0.3–10.0 μm) [51]. Wongsagonsup, et al. [9] found much larger granule sizes in taro flours from Thailand, ranging from 52.17 to 67.63 µm, and indicated that this might be consequence of aggregated starch, because by isolating the starch, granule sizes ranged from 2.14–3.59 µm. At the bottom of the micrograph, other non-granular structures were clearly observed, which are attributed to other flour compounds.
The micrograph of tarwi flour showed the presence of two types of particles and aggregates. Both particles were surrounded by other structures, that according to the composition, could be mainly proteins (Figure 2G), corresponding to the profile obtained in the particle size distribution (Table 4).
The aggregate could be composed of starch, proteins and fibers, which could favor the piled-up structure in some cases, as mashua, forming structures with a quite large average particle size, or in the case of tarwi, with medium-size aggregates with an average of 42.22 µm (Table 4).
Regarding aggregate sizes, the smallest corresponded to taro flour, followed by tarwi and mashua, while in the rest of the flours these aggregates were not appreciated; however, other compounds were observed in the micrograph. With respect to the average size of starch granules, achira and oca flours presented notably larger granules than tarwi, camote, mashua and arracacha flours, which had intermediate values, while the smallest granules corresponded to taro (Table 4). Starch granule size has been observed to influence the amount of resistant starch, since an increase in amylose favors granule compaction and density, which contributes to a slower digestion [14,48].
3.7. Differential Scanning Calorimetry (DSC)
The results of the DSC analysis are shown in Table 5. The lower gelatinization temperature range (∆ Tc–To) was observed in mashua flour (8.43 °C) as compared with the other flours (around ~8–12 °C). On the contrary, in tarwi flour the required temperature reached up to 32.68 °C. The lowest gelatinization peak (Tm) corresponded to arracacha and achira (p < 0.05) and the highest to camote flour. Differences in the thermal properties can vary according to the botanical species of the crop. Therefore, low gelatinization temperatures could be associated with a high amylose content in starch [73]. However, this relation was not shown in the present work since, for example, camote flour presented a high Tm and a low amylose content in starch. The Tm of camote ranged from 70.2 to 77 °C in 44 varieties from the Philippines, while it was 74 °C in 2 varieties from Peru [51]. In achira flour of different granulometries (>32 mesh and 42–80 mesh from Brazil) no significant differences in the Tm (72.0 and 71.8 °C), To (66.9 and 66.8) and Tc (77.4 and 77.9) were observed, and no differences were observed either in the thermal properties of achira from Colombia for the aforementioned parameters (71.6, 67.3 and 77.0, respectively) [7]. These authors observed that the high fiber content, as well as the protein and lipids present in the flour, favor the increase of Tm due to a protective action of these components, through the inhibition of hydration of the starch granules and therefore, of gelatinization, favoring low gelatinization enthalpy values.
Table 5.
Differential scanning calorimetry (DSC) results for andean crops flours.
The highest gelatinization enthalpy value was found in mashua and tarwi flours (p < 0.05). Similar results were reported by Pacheco, et al. [74], who indicated that mashua starch has a greater number of double helical areas in the amylose chains, and therefore requires more energy to break the number hydrogen bonds between the glucan chains [75]. The starch is not the main component of Andean crop flours, but the presence of other components such as cell wall materials, proteins, pectins, among others, can influence the measurement [76]. The ∆H indicates the energy required to break the molecular interactions within the starch granules during the gelatinization process. Low ΔH values found in all samples could be due to some degree of modification or denaturation of starch and protein that occurs during drying [23], so that a previous partial fusion of the amylopectin crystals may have occurred [7]. On the other hand, it should be noted that in flours from camote and tarwi, no phase transition is observed, while no evidence of thermal events was detected in taro. It is possible that starch may be fully gelatinized during the drying process, which was developed at 60 °C in the studied Andean crops. According to Torres, et al. [49], the gelation temperature of taro starch from Colombia is 55 °C. However, in tarwi flour, the absence of phase transition for starch can be attributed to the low starch content (0.6%) [77]. The Tm values of the rest of the flours could be associated with the presence of compounds such as proteins, lipids and fiber that degrade at higher temperatures but with a lower energy consumption [76]. Therefore, non-starch constituents of the flours play a marked role in starch gelatinization, where, in addition to the protecting effect on the surface of the granules, some water competition could also contribute to retard starch gelatinization [13].
3.8. Swelling Power and Solubility
The swelling factor is used to evaluate the integrity of the starch granules and is directly related to the increase of temperature. This property is associated to the amylopectin content, while amylose is considered a diluter and inhibitor of swelling [78]. Therefore, swelling capacity increases linearly with the heat of gelatinization and decreases linearly with amylose content [79]. Moreover, the interaction between the starch chains inside the amorphous and crystalline domains of the granules is affected by the ratio amylopectin/amylose, the bond distribution and molecular weight characteristics of amylose and amylopectin [80]. In flours, swelling could be related to starch and other compounds that also compete for water, as polar residues of amino acids forming part of proteins and the highly hydrophilicity of fibers [7]. In this study, low values for swelling were noted in the range of temperatures evaluated, increasing slightly at 70 °C in taro and mashua flours (Figure 3A). The exception was observed in achira, in which low values at temperatures below 60 °C were observed, while above this temperature swelling increased, the values doubling at 80 °C. This behavior in achira flour could be attributable to the breaking of hydrogen bonds; water molecules bind to the hydroxyl groups released, and the granules expand, exuding amylose [7]. Moorthy [51] attributed the low swelling in camote starch to the high degree of starch granule intermolecular associations. In tarwi, lipids and proteins could affect swelling because the gelatinization is delayed by the coating of starch, preventing it from absorbing water and resulting in reduced swelling capacity [81]. In this sense, Andrade-Mahecha, et al. [7] compared the swelling obtained by flour and starch of achira from Brazil, observing that swelling is greater in flour than in starch at temperatures < 65 °C, while at temperatures > 60 °C the behavior is reversed, and swelling is greater in starch. Therefore, at low temperatures, the swelling of flour is due to the presence of proteins and fibers with polar charge; while the swelling power at high temperatures is attributed to starch granules, both for their large size and for their amylose content.
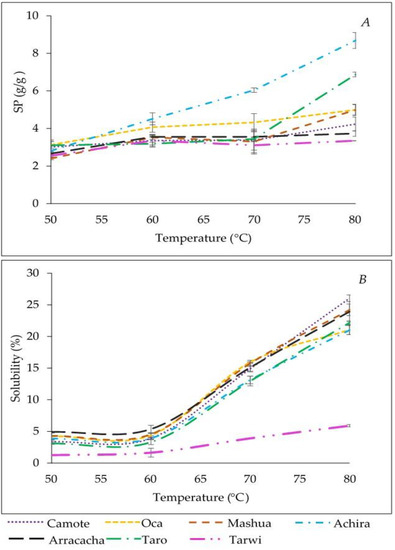
Figure 3.
(A) Swelling power; (B) solubility of flours as a function of the temperature (50–80 °C).
The solubility, which was related to the presence of diverse soluble molecules, showed reduced values in all flours at low temperatures and increased noticeably with the rise of temperature (Figure 3B). The lowest values found at all temperatures were for tarwi flour (p < 0.05), observing a light increase (p < 0.05) from 60 °C, but not reaching more than 5% solubility at 80 °C, as expected due to the low starch content of this legume. The rest of tuber or rhizome flours showed a very similar evolution; at low temperatures (≤60 °C) flours presented low solubility (3–5%), but with the increase of temperature, from 60 °C onwards, the solubility increased drastically, reaching similar values in achira, taro and oca flours (~22%) (p < 0.05), showing the highest values in camote flour (~26%) (p < 0.05) at 80 °C.
At low temperatures, molecules such as proteins, sugars, and soluble fiber can contribute to the solubility of the flours, whose composition could be very variable depending on the nature of the crops, mainly on whether they come from legumes or tubers [7,63]. Therefore, the temperature at which starch gelatinizes in each flour is an important factor in swelling. The increase in solubility in arracacha starch occurs with increasing temperature between 50 and 60 °C, due to starch gelatinization (55 °C) and leaching of solubilized amylose [7]; small-sized molecules will leach more easily, increasing solubility. Furthermore, the increase in small-sized molecules may be favored by a weak starch granule structure that favors starch depolymerization [71]. Another factor to take into account regarding solubility is the presence of a large number of weak interactions in the starch granules which immobilize them, irrespective of the swelling. Thus, starch extracted from camote from the Peruvian variety only showed an increase in solubility of around 10% with high temperatures [51].
3.9. Water Absorption Capacity (WAC)
The water absorption capacity of the different flours is shown in Figure 4. Oca and achira flours showed the highest values at 80 °C; in oca flour its values doubled at 60 °C and then continued to rise until reaching 80 °C while the increment was gradual in achira flour (p < 0.05). Torres, et al. [49] proposed that the ability of flour to absorb water is associated with the damage suffered by starch granules at temperatures above 60 °C, which causes the release and union of hydrophilic groups with water. All flours tended to increase their WAC as temperature was increased; however, camote flour barely showed a significant increase of 1.33% between 50 and 60 °C and mashua flour of 3.63% (p < 0.05) mainly from 50 to 60 °C, while the increase in taro flour was higher (5.2%), more sharply from 70 °C onwards. No relationship was found between the starch content, or the amount of protein and fiber, or the gelatinization temperature in each flour and the WAC. However, flours with a higher WAC were those in which starch grains presented a larger particle size, determined by SEM and a wider polydispersity of sizes, such as oca and achira flours (Figure 2 and Figure 4, Table 4). Some authors note that with smaller granule sizes, where the surface area of exposure and contact to water increases, and the ability to retain water increases as well [13]. The water absorption rate of arracacha starch granules from Peru was 7% < 55 °C and increased to 9% at 60 °C [71], being slightly higher than those of the arracacha flour of the present work.
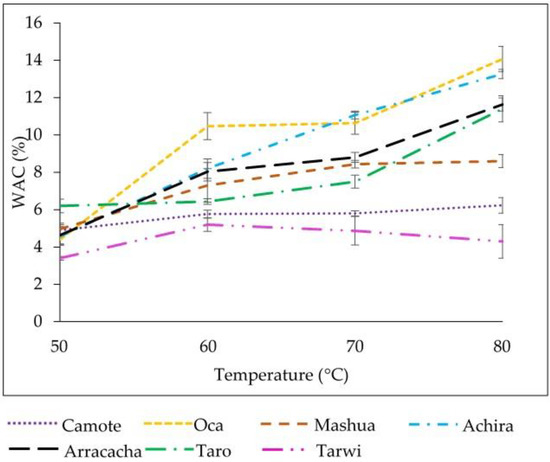
Figure 4.
Water absorption capacity (WAC) of flours as a function of the temperature (50–80 °C).
Tarwi flour showed a slight increase in its WAC at 60 °C (p < 0.05), mainly attributed to proteins (native or with conformational changes, produced either during flour processing or during this thermal treatment) but this property did not increase with an increment in temperature (p < 0.05). This fact can be due to the reduced amount of starch and the high content of proteins in this flour, which could suffer a denaturation at high temperatures and thus reduce the WAC. The high protein content present in tarwi could prevent the diffusion of water into starch granules because polar side chains establish strong hydrogen bonds by forming a network which limits the swelling of starch [82], and proteins do not have good swelling properties under the tested conditions. For tarwi, in the present work there was no relationship between WAC and the size distribution of the structure observed by SEM, perhaps because the two populations found (small and medium sizes), and because starch is very scarce, and it is surrounded by protein, as previously mentioned.
3.10. Rheological Characterization
The profiles obtained for the storage dynamic modulus (elastic) (G′), loss dynamic modulus (viscous) (G″) and phase angle (tan δ) as a function of the angular frequency (rad/s) are shown in Figure 5. The doughs developed with the Andean crop flours are classified as viscoelastic fluids because the lag between stress and strain are in the range from 0 to 90° with a predominance of elastic properties over viscous ones (Chang, et al. [83]. For most samples, G′ and G″ increased with the rise in frequency, displaying a dominant solid-like behavior, which indicates that the system develops a certain structural level, as a strong gel [84]. Taro flour was the exception, where G″ slightly increased more than G′, indicating an unstructured and viscous behavior. This behavior is not in line with that observed by Arıcı, et al. [85], where taro flour addition in increasing amounts (up to 25%) to wheat flour, increased both G′ and G″, being always G′ > G″ for all angular frequencies tested. This is associated with the small size of the taro granules, which interact better with the other components of the flour such as proteins, lipids and fibers due to a larger exposure surface [86]. These authors give great importance to the presence of mucilage; that is, mucilage contributes to the predominance of the solid gel-like structure in taro flour, so it could occur that in the present work, in this taro variety from Ecuador, mucilage content is lower compared with the taro flour from the Anamur region of Mersin (Turkey) mentioned by these authors. Initially, at low frequencies, taro flour showed quite low G′ and G″ values, duplicating at angular frequencies of 30 rad/s (Table 6), which can lead to a break from starch granules [87] and an entanglement of the components. In oca flour, a crossover between G′ and G″ at high frequencies took place, displaying a rather viscous character. This means that the oca flour solution showed a rigid solid-like behavior at lower frequencies (G′ > G″) and a liquid-like behavior at higher frequencies (G′ > G″), which could be related to the entanglement of networks with reduced strength starch [88].
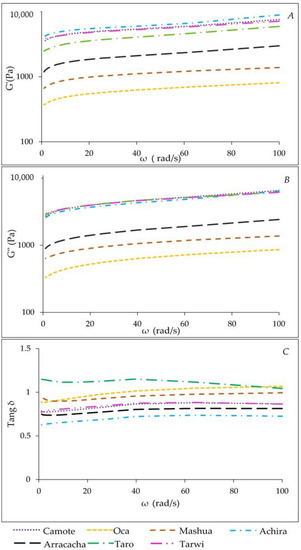
Figure 5.
Mechanical spectra of dynamic rheological properties of flours vs. frequency (rad/s). (A) Storage modulus (G′, Pa); (B) loss modulus (G″, Pa); (C) loss factor tang δ.
Table 6.
Mechanical spectra fit-parameters of dynamic rheological properties of flours at different angular frequencies (rad/s), G′, G″, (Pa), and flow behavior index (n).
Mashua and oca flours showed lower G′ and G″, resulting in a weak gel compared with achira, camote, tarwi and white arracacha. This behavior could be attributed to the restricted granular swelling, lower water solubility [89,90] and lower amylose content in both flours, and also to a higher content of lipids in oca flour (~1.06%). The presence of lipids altered the viscoelastic properties of doughs, since G′ values were lower in flours in which lipids were present [91,92]. Besides, the small size of starch granules observed in mashua (~9.6 μ average size) contributes to low G′ and G″ values as was perceived in small granules of potato starch fractions [93]. Achira and camote were the tubers with the highest G′ values, which could be explained by their greater amylose and fiber contents (8.08%, 11.51% and 6.20%, 11.19%, respectively), which strongly interact in the polymeric matrix. Similar results were observed when Arabic gum was added to improve the functionality of tapioca starch [94]. Tarwi also had high G′ values and showed a typical solid-like behavior with strong viscoelastic properties (G′ > G″). G′ ranged from 3528 Pa to 6056 Pa, and G″ from 2692 Pa to 5307 Pa. This behavior could be explained by the higher protein content (52.82%), in which originates intermolecular interactions. Similar results were obtained by Xu, et al. [95] in lupin and defatted lupin suspensions with 50% protein where G′ values were much greater than those for G″.
The tan δ behavior (Figure 5C) showed an increase of tan δ to values close to the unit in oca (0.85–1.04) and mashua (0.91–0.96), which indicates the breakdown of the starch structure and a greater viscous component, probably due to the presence of damaged starch, as was observed in wheat flour [87]. Achira, white arracacha, camote and tarwi presented tan δ values that ranged from 0.61 to 0.88 which increased with frequency (Table 6), indicating a more elastic and a slightly stronger gel network that could be affected by the chemical composition, especially by fiber and amylose contents. Similar results were observed for orange-fleshed camote, where tan δ < 1 indicates a predominant elasticity over viscous properties, sago starch [96] and camote starch, where the tan δ values were lower after the addition of gums [97]. On the contrary, tan δ slightly decreased in taro (1.15–1.10) probably as a result of a strong interaction between the fiber and starch present in the flour (14.90% and 59.98% respectively). Chaisawang, et al. [98] incorporated xanthan gum to starch paste and observed a decrease in tan δ, attributing this behavior to the opposite charges of starch and gum which contribute to form a compact structure. Tarwi showed an increase of tan δ from 0.76 to 0.88, which indicates more solid-like viscoelastic properties. Similar behavior was observed on partially substituted lupin on wheat bread [99].
The values of flow behavior index (n) for all samples are shown in Table 6. In addition, n values were less than 1, and exhibited the shear-thinning behavior characteristic of starch materials. Other researchers obtained n values of 0.55 for purple camote flour [100]. The flow behavior indexes (n) of arracacha were slightly higher than those of oca, mashua and camote, tarwi and taro. Zhu, et al. [89], compared the flow properties of oca starch; according to their results, the n value was ~0.25, a higher value than that obtained in the present work with flour (0.16). Achira starch showed an n value of ~0.35 [101], white arracacha starch showed an n of 0.61 and n’ 0.22 [90,102], taro starch n = 0.7 [103] and lupin flour with wheat starch and egg used as pasta dough n = 0.34. [104]. The results of the flow behavior of flours can be explained by structural differences in the composition, amylose content, and amylopectin amounts and granule size.
3.11. Antioxidant and Total Phenol Content
The results obtained from the phenolic compounds and antioxidant activity in flours from Ecuadorian Andean crops are shown in Figure 6. These results are not easily comparable with the literature, since there are hardly any references on these flours because, the data are expressed in different ways, and the treatments of the raw materials are different. Regarding phenol contents (Figure 6A), the values present a large variation, between 6.5–60.8 µg gallic acid equivalent (AGE)/g of a sample. Mashua flour had the highest value (60.8 µg AGE/g of sample) (p < 0.05), which differs from that reported by Catunta [105] in fresh samples of mashua (128–146 mg GA/100 g). These authors also reported 163 µmol trolox equivalent/g in osmotically dehydrated mashua and 175 µmol trolox equivalent/g in black mashua from Yunguyo (Puno, Peru), cultivated at an altitude of 3847 m. The lower phenol content in mashua flour in the present work could be due to the difference in composition because of the geographical location (despite Puno and Ambato being Andean regions, there is an altitude difference of 3547 m between them); and, in addition, to other characteristics such as the crop, or to a loss caused by the thermal drying treatment. The total phenol content could be attributed to the presence of flavonoids, phenolic acids and tannins; in turn, these components could be influenced by the optimal state of tuber maturity and the effects of heat in the drying process [106]. The Folin-Ciocalteu assay is a widely used method to determine the total phenol content, but there are other substances, such as sugars and proteins, which react with the Folin-Ciocalteu reagent [107]. It is important to consider this, since proteins and sugars are part of the composition of these flours. Values around 20 mg GA/100 g are found in most of the flours, and the lowest phenol content corresponded to arracacha and tarwi flours (p < 0.05). The phenol content in oca flour is similar to that found in oca tuber [108]. However, tarwi flour values are much lower than those observed by the aforementioned authors. A total phenol content higher than that found in the present work was reported (110 µg GAE/mg extract) in water extract of achira (Canna indica) dried (45 °C) rhizomes from the banks of Cauvery River (Mysore, India), [32], and in camote flour (values ranged from 28 to 1228 mg GAE/100 g) from 19 Philippine varieties, grown in the same area and under similar conditions as to avoid possible differences due to these factors [15]. In lupinus grains from Ecuador (varieties INIAP-450, INIAP-451 and Criollo), Villacrés, et al. [26] observed a significant decrease in some compounds (96.83% for phenols and 49.42% for carotenoids) during debittering and fermentation. In this sense, Córdova-Ramos, et al. [109], observed a 50% loss of phenol content in Andean lupine (genotipes Altagracia, Andenes and Yunguyo) with debittering and spray drying.
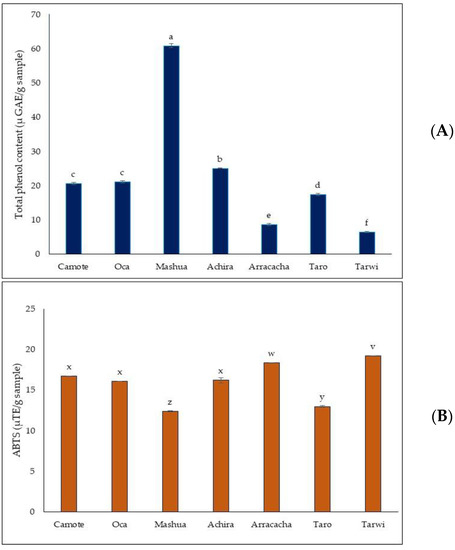
Figure 6.
(A) Total phenolic content, and (B) antioxidant activity by ABTS of flours. Different letters (a, b, c, d) or (x, y, z,…) indicate significant differences between samples.
The antioxidant activity (Figure 6B) seemed not to be related to the phenol content; on the contrary, sometimes an inverse relationship was observed since flours with the lowest phenol content (arracacha and tarwi) showed the highest antioxidant activity (p < 0.05). The lowest antioxidant activity corresponded to mashua flour (p < 0.05), despite the latter showing the highest content of phenols. This may be due to the fact that not only flavonoids and other phenolic compounds contribute to the antioxidant activity of these crops, but also carotenes and vitamin C, which are present in different amounts in these tubers, rhizomes and grains [58,59,108]. ABTS assays showed an antioxidant activity of 114 µg/mL in the water extract of achira (Canna indica) rhizomes from Mysore (India), [32]. On the other hand, it was observed that debittering three varieties of tarwi (from Peru) produces a decrease in ABTS of 52.9%, and the subsequent spray drying produces a further 8% decrease in ABTS activity [109]. Villacrés, et al. [26] observed a decrease in the antioxidant activity of 96.13% in three varieties of Ecuadorian lupinus from different areas (INIAP-450, INIAP-451 and criollo), with an antioxidant capacity of 18.88, 37.07 and 29.27 µg Trolox/g debittered sample, respectively, which are in the range of that obtained in tarwi flour (Figure 6B).
3.12. Cluster Analysis and Principal Component Analysis
The cluster analysis is represented in the dendrogram in Figure 7A. Taro and achira flours are in the same cluster, very close to camote flour, and are organized with tarwi in an upper cluster. Oca and arracacha flours form another cluster, joining mashua flour in an upper one. These results are interesting because they allow us to speculate about the degree of similarity among flours and, therefore, about the possibility to substitute some flours for others in the elaboration of products when they are either located in the same cluster or very close. However, the principal component analysis will allow for a better understanding of how similar or different the flours are.
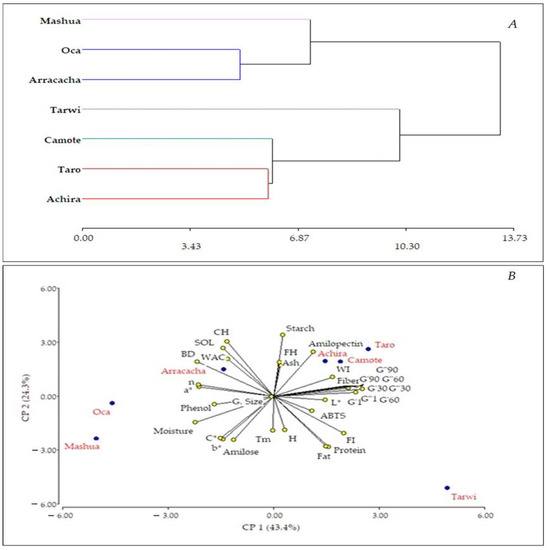
Figure 7.
(A) Hierarchical cluster analysis, and (B) principal component analysis.
The principal component analysis (PCA) yields several principal components (PC), PC1 and PC2 explain 67.7% variance (Table 7, Figure 7B). Table 7 shows, in colored bands, the variables analyzed according to composition, color, granulometry, gelatinization temperature, functional properties, rheology, and bioactive properties. PC1 explained flour constituents with high correlation, such as moisture and fiber, and with a lower loading such as protein, fat, and non-starch carbohydrate contents (negative correlation). PC1 also showed a high loading of the fineness index and bulk index (negative correlation). However, the average granule size, observed in microscopy, does not seem to have any relevance or loading in any of the PCs. Regarding hydration properties, only solubility showed a very low loading with negative correlation, which is attributed to the non-starch compounds of the flours absorbing water and favoring hydration, as previously described. Concerning the viscoelastic properties, all of them showed loading in PC1 with a high and positive correlation, which indicates the importance of fiber and, to a lesser extent, of protein, in the gelling and viscoelastic behavior of flours. The phenol content showed some loading in PC1 (negative correlation), but not with the antioxidant activity (ABTS). Moreover, ABTS does not show a correlation with any PC. Weight of the color parameters was distributed in the different PCs; however, a* showed more loading in PC1, with a negative correlation, as well as the phenol content. The greater tendency to redness could be linked to the correlation of the phenol content.
Table 7.
Variance, variance cumulative, and factor loading of principal components (PC) for the variables of flours.
Amylose and amylopectin contents, highly correlated with opposite sign, were explained in PC2 in which starch showed a greater loading. Protein and fat, also explained in PC2, have a high negative correlation, as well as non-starch carbohydrates (positive correlation). The gelatinization temperature (Tm) has a certain negative correlation in this PC2 (−0.55), not as markedly as expected owing to the presence of starch and amylopectin, perhaps due to the existence of non-starch compounds which, as mentioned above, hinder and delay gelatinization. However, all the hydration properties studied have a positive weight in PC2, being solubility the highest.
The swelling index is a property of interest to evaluate the state of starch prior to gelatinization. However, the factor loading is spread between PC2 and PC3. The highest loading of the swelling index (FH) is in PC 3 with a high positive correlation (Table 7). This factor explains 13.9% of the variance, in which ash and amylose, amylopectin with inverse sign, and total phenol content also showed loading. Thus, the role of amylose in swelling is observed in this component (PC3). It is worth noting that Tm was highly correlated with PC4, the explained variance being 9.2%, but its correlation was very high, which indicates that Tm is a very independent factor. This is interesting because there are many studies that evaluate the behavior of isolated starch, but very few evaluate that of flour, and the results show the influence of non-starch compounds, and thus the need to study them to evaluate the effect of the application of these materials in foods.
PCA is represented in its first two PC (Figure 7B). The group for each flour can be observed marked with the centroid, revealing how achira, camote and taro flours are very close, indicating that they share a degree of similarity in physico-chemical and functional properties, mainly in viscoelastic properties, fiber and amylopectin contents. Tarwi flour seems to be as strongly influenced by viscoelastic properties and fiber as the previous ones (PC1), however, the legume shows a strong loading of the fineness index (FI), protein and fat content, markedly in PC2. Arracacha flour is quite different from the aforementioned flours in PC1, but similar in PC2. Oca flour is even more distant in PC1 and PC2. Mashua flour is opposite in all the properties to achira, camote and taro flours. The results from PCA allow us to know the similarities and differences among the characteristics of flours from different crops in order to formulate new products or use them as ingredients in existing ones. The knowledge of their physico-chemical characteristics as well as their techno-functional capacities makes possible their design in a more competitive way and even mixing these flours, thus enhancing their nutritional and functional capacities.
4. Conclusions
The results of this study provide information on the proximal composition, physico-chemical and technological properties of underused Andean crop flours from Ecuador. The proportions of carbohydrates, protein and fiber are the determinants of the nutritional quality of these flours. In fact, all the flours accomplish the requirements to be labeled as “high in fiber”, except for oca flour, which can be considered a “source of fiber”. The starch content of flours was lower than expected; therefore, foods in which Andean crop flour is incorporated would be of interest for the control of the glycemic index.
The color of flours was located in the area of intense yellow with tones that are slightly shifted to the orange area, probably due to the effect of Maillard reactions and caramelization resulting from their production process, although some presented a yellow or orange coloration characteristic of the crop. Regarding the granulometric analysis, the fineness modulus characterized the particles of these flours as medium-sized. The structural morphology of the Andean crop flours revealed the integrity of starch granules and the presence of protein and fiber, more abundant as their concentration was higher. The gelatinization temperature of the starch ranged from 68.4 to 81.5 °C, attributed to the presence of non-starch compounds, which compete with starch for water, and inhibit gelatinization until higher temperatures are reached. The rheology of doughs developed with Andean crop flours showed a viscoelastic behavior, although at high angular frequencies, taro showed a greater fluidity (G″ > G′). As with their crops of origin, all flours presented total phenol contents, especially mashua flour, and in all flours there was evidence of antioxidant activity. The cluster and PCA allowed establishing the relationship among the properties and characteristics of flours, in order to determine their role in the new components as well as similarities and discrepancies, simplifying knowledge for future applications. The results of the present study demonstrate that Andean crops, when subjected to a flour production process, present interesting properties to be used as ingredients in food production. Since the compositions and properties of the flours are different, mixing them in different proportions will allow the formulation of foods with interesting nutritional and techno-functional properties.
Author Contributions
Conceptualization, D.S. and M.A.; methodology, D.S.; software, D.S. and M.A.; formal analysis, D.S., M.A., M.E.L.-C. and M.P.M.; investigation, D.S., I.O., M.B., R.R.-M. and M.A.; resources, D.S., M.A., M.E.L.-C. and M.P.M.; data curation, D.S., M.A., M.E.L.-C. and M.P.M.; writing—original draft preparation, D.S.; writing—review and editing, M.A., R.R.-M., M.E.L.-C. and M.P.M.; visualization, D.S., M.E.L.-C. and M.P.M.; supervision, M.A., M.E.L.-C. and M.P.M.; project administration, M.A., M.E.L.-C. and M.P.M.; funding acquisition, M.A., M.E.L.-C. and M.P.M. All authors have read and agreed to the published version of the manuscript.
Funding
This research was funded by Dirección de Investigación y Desarrollo (DIDE) and the Universidad Técnica de Ambato-Ecuador project PFCIAL-031-DS, the Inédita Project 20190015 funded by Secretaría Nacional de Educación Superior, Ciencia y Tecnología-Ecuador (SENESCYT), and the NANOALIVAL project AGL2017-84161 funded by MICINNIN, SPAIN and European Regional Development Fund (FEDER) and project 202070E218 funded by CSIC, SPAIN.
Acknowledgments
The authors would like to thank the organizations that have made possible the development of this work through the funding of the following projects: PFCIAL-031-DS Project “Development of a prototype of a gluten-free farinaceous mixture for confectionery, using underutilized traditional Andean crops, funded by the Dirección de Investigación y Desarrollo (DIDE) and the Universidad Técnica de Ambato-Ecuador (resolution 0193-CU-P-2018), the Inédita Project 20190015 “Development of wheat and gluten-free food products from underused Andean crops and agro-industrial waste”, funded Secretaría Nacional de Educación Superior, Ciencia y Tecnología- Ecuador (SENESCYT). Unpublished Project 20190015. 02/05/2019-02/08/2020.NANOALIVAL project AGL2017-84161 funded by MICINNIN, SPAIN and European Regional Development Fund (FEDER) and project 202070E218 funded by CSIC, SPAIN.
Conflicts of Interest
The authors declare no conflict of interest.
References
- Flores, H.E.; Walker, T.S.; Guimarães, R.L.; Bais, H.P.; Vivanco, J.M. Andean Root and Tuber Crops: Underground Rainbows. HortScience 2003, 38, 161–167. [Google Scholar] [CrossRef] [Green Version]
- Málaga, J.; Avila-Santamaría, J.J.; Carpio, C.E. The Andean Region: An Important and Growing Us Agricultural Trade Partner. Choices 2019, 34, 1–9. [Google Scholar]
- Bravo, K.; Alzate, F.; Osorio, E. Fruits of selected wild and cultivated Andean plants as sources of potential compounds with antioxidant and anti-aging activity. Ind. Crop. Prod. 2016, 85, 341–352. [Google Scholar] [CrossRef]
- Rubio, A.L.; Rodríguez, J.; Fernández, C.; Crespo, J.F. Storage Proteins: Physiological and Antigenic Effects. Pub. Eur. Assoc. Anim. Prod. 2004, 110, 159–176. [Google Scholar]
- Silva, A.; Caro, J.C.; Magaña-Lemus, D. Household food security: Perceptions, behavior and nutritional quality of food purchases. J. Econ. Psychol. 2016, 55, 139–148. [Google Scholar] [CrossRef]
- Hermann, M. The impact of the European Novel Food Regulation on trade and food innovation based on traditional plant foods from developing countries. Food Policy 2009, 34, 499–507. [Google Scholar] [CrossRef]
- Andrade-Mahecha, M.M.; Tapia-Blácido, D.; Menegalli, F.C. Physical-chemical, thermal, and functional properties of achira (Canna indica L.) flour and starch from different geographical origin. Starch 2012, 64, 348–358. [Google Scholar] [CrossRef]
- Pinto, L.C.; de Oliveira, T.P.; de Souza, R.; Santos, N.B.F.; Santos, L.F.P.; de Assis Santos, A.; de Santos, T.X.; Santos, C.T.; Nunes, C.J.; Costa, I.B. Probiotic Kefir-Fermented Beverage-Based Colocasia Esculenta, L.: Development, Characterization, and Microbiological Stability During Chilled Storage. J. Food Process. Preserv. 2021, 45, e15113. [Google Scholar] [CrossRef]
- Wongsagonsup, R.; Nateelerdpaisan, T.; Gross, C.; Suphantharika, M.; Belur, P.D.; Agoo, E.M.G.; Janairo, J.I.B. Physicochemical Properties and in Vitro Digestibility of Flours and Starches from Taro Cultivated in Different Regions of Thailand. Int. J. Food Sci. Technol. 2021, 56, 2395–2406. [Google Scholar] [CrossRef]
- Cui, R.; Zhu, F. Physicochemical and functional properties of sweetpotato flour. J. Sci. Food Agric. 2019, 99, 4624–4634. [Google Scholar] [CrossRef]
- Manzelli, M.; Romagnoli, S.; Ghiselli, L.; Benedettelli, S.; Palchetti, E.; Andrenelli, L.; Vecchio, V. Typicity in Potato: Characterization of Geographic Origin. Ital. J. Agron. 2010, 5, 61–68. [Google Scholar] [CrossRef]
- Sulistiani, R.; Siregar, L.A.; Harahap, F. The Effects of Temperature and Potassium Fertilizer on the Growth, Yield, and Biochemical Parameters of Ipomoea Batatas Var. Antin-1. Acta Agrobot. 2020, 73, 7337. [Google Scholar] [CrossRef]
- Calle, J.; Benavent-Gil, Y.; Rosell, C.M. Use of Flour from Cormels of Xanthosoma sagittifolium (L.) Schott and Colocasia esculenta (L.) Schott to Develop Pastes Foods: Physico-Chemical, Functional and Nutritional Characterization. Food Chem. 2021, 344, 128666. [Google Scholar] [CrossRef] [PubMed]
- De Souza, A.G.; Viana, D.J.S.; Dos Santos, A.S.; Júnior, V.C.D.A.; Rosa, D.D.S. Structure and properties of starch and flour of four Brazilian sweet potatoes (Ipomoea batatas) cultivars. Matéria 2020, 25. [Google Scholar] [CrossRef]
- Sanchez, R.G.R.; Juan, G.A.C.S.; Lim, P.A.A.; Gabriel, A.A. Effect of flour processing on the proximate composition, polyphenolic content, and antioxidant activity of 19 Philippine sweet potato cultivars. J. Food Process. Preserv. 2020, 44. [Google Scholar] [CrossRef]
- Ali, M.I.; Mousa, E.A.; Hassan, N.A. Production of Healthy Chips Ready to Eat Using Potato, Green Pea and Lupine Flour for Malnourished Children. Age 2019, 1, 2. [Google Scholar]
- AOAC. Official Methods of Analysis, 18th ed.; AOAC, Ed.; The Association of Official Analytical Chemists: Washington, DC, USA, 2005. [Google Scholar]
- FAO. Food Energy—Methods of Analysis and Conversion Factors. In Report of a Technical Workshop, Rome, 3–6 December 2002; Food and Agriculture Organization of the United Nations: Rome, Italy, 2003. [Google Scholar]
- Salazar, D.; Arancibia, M.; Raza, K.; López-Caballero, M.; Montero, M. Influence of Underutilized Unripe Banana (Cavendish) Flour in the Formulation of Healthier Chorizo. Foods 2021, 10, 1486. [Google Scholar] [CrossRef] [PubMed]
- Salazar, D.; Arancibia, M.; Lalaleo, D.; Rodríguez-Maecker, R.; López-Caballero, M.E.; Montero, M.P. Physico-Chemical Properties and Filmogenic Aptitude for Edible Packaging of Ecuadorian Discard Green Banana Flours (Musa acuminanta AAA) Food Hydrocolloids. Food Hydrocoll. 2021, 122, 107048. [Google Scholar] [CrossRef]
- Gujska, E.; Khan, K. Effect of Temperature on Properties of Extrudates from High Starch Fractions of Navy, Pinto and Garbanzo Beans. J. Food Sci. 1990, 55, 466–469. [Google Scholar] [CrossRef]
- JJinapong, N.; Suphantharika, M.; Jamnong, P. Production of Instant Soymilk Powders by Ultrafiltration, Spray Drying and Fluidized Bed Agglomeration. J. Food Eng. 2008, 84, 194–205. [Google Scholar] [CrossRef]
- Henshaw, F.O.; McWatters, K.H.; Akingbala, J.O.; Chinnan, M.S. Thermal properties of cowpea flour: A study by differential scanning calorimetry. Food/Nahrung 2003, 47, 161–165. [Google Scholar] [CrossRef] [PubMed]
- Pacheco, M.T.; Moreno, F.J.; Moreno, R.; Villamiel, M.; Hernandez-Hernandez, O. Morphological, technological and nutritional properties of flours and starches from mashua (Tropaeolum tuberosum) and melloco (Ullucus tuberosus) cultivated in Ecuador. Food Chem. 2019, 301, 125268. [Google Scholar] [CrossRef] [PubMed]
- Singleton, V.; Rossi, J.A. Colorimetry of Total Phenolics with Phosphomolybdic—Phosphotungstic Acid Reagents. Am. J. Enol. Vitic. 1965, 16, 144–158. [Google Scholar]
- Villacrés, E.; Quelal, M.B.; Fernández, E.; Garcìa, G.; Cueva, G.; Rosell, C.M. Impact of debittering and fermentation processes on the antinutritional and antioxidant compounds in Lupinus mutabilis sweet. LWT 2020, 131, 109745. [Google Scholar] [CrossRef]
- Ortega-Rivas, E.; Juliano, P.; Yan, H. Food Powders: Physical Properties, Processing, and Functionality; Kluwer Academic/Plenum: New York, NY, USA, 2005. [Google Scholar]
- Bernabé, Y.; Fanny, C. Caracterización Fisicoquímica, Fitoquímica y Funcional de la Harina De Khaya y Oca (Oxalis tuberosa) Para Uso Industrial; Universidad Nacional del Centro del Peru: Huancayo, Peru, 2017. [Google Scholar]
- Villacrés, E.; Rubio, A.; Egas, L.; Segovia, G. Usos Alternativos Del Chocho: Chocho (Lupinus Mutabilis Sweet) Alimento Andino Redescubierto; INIAP, Estación Experimental Santa Catalina, Departamento de Nutrición y Calidad: Quito, Ecuador, 2006. Available online: http://repositorio.iniap.gob.ec/handle/41000/298 (accessed on 21 August 2021).
- Sulas, L.; Canu, S.; Ledda, L.; Carroni, A.M.; Salis, M. Yield and nitrogen fixation potential from white lupine grown in rainfed Mediterranean environments. Sci. Agric. 2016, 73, 338–346. [Google Scholar] [CrossRef] [Green Version]
- Tiuquinga, J. Utilización de Diferentes Niveles de Harina de Canna Edulis (Achira) en la Alimentación de Cuyes en la Etapa de Gestación–Lactancia. Bachelor’s Thesis, Facultad De Ciencias Pecuarias—Escuela De Ingeniería Zootécnica, Riobamba, Ecuador, 2017. [Google Scholar]
- Ayusman, S.; Duraivadivel, P.; Gowtham, H.G.; Sharma, S.; Hariprasad, P. Bioactive Constituents, Vitamin Analysis, Antioxidant Capacity and A-Glucosidase Inhibition of Canna indica L. Rhizome Extracts. Food. Biosci. 2020, 35, 100544. [Google Scholar] [CrossRef]
- Yadav, A.R.; Guha, M.; Tharanathan, R.; Ramteke, R. Changes in characteristics of sweet potato flour prepared by different drying techniques. LWT 2006, 39, 20–26. [Google Scholar] [CrossRef]
- Valcárcel-Yamani, B.; Rondan-Sanabria, G.G.; Finardi-Filho, F. The physical, chemical and functional characterization of starches from Andean tubers: Oca (Oxalis tuberosa Molina), olluco (Ullucus tuberosus Caldas) and mashua (Tropaeolum tuberosum Ruiz & Pavón). Braz. J. Pharm. Sci. 2013, 49, 453–464. [Google Scholar] [CrossRef] [Green Version]
- Restrepo, S.M.L.; Rincón, N.; Contreras-Padilla, M.; Millan-Malo, B.M.; Rodriguez-Garcia, M.E. Morphological, structural, thermal, compositional, vibrational, and pasting characterization of white, yellow, and purple Arracacha Lego-like starches and flours (Arracacia xanthorrhiza). Int. J. Biol. Macromol. 2018, 113, 1188–1197. [Google Scholar] [CrossRef]
- Okonwu, K.; Ariaga, C.A. Nutritional Evaluation of Various Parts of Canna indica L. Annu. Res. Rev. Biol. 2016, 11, 1–5. [Google Scholar] [CrossRef]
- Choquechambi, L.A.; Callisaya, I.R.; Ramos, A.; Bosque, H.; Mújica, A.; Jacobsen, S.-E.; Sørensen, M.; Leidi, E.O. Assessing the Nutritional Value of Root and Tuber Crops from Bolivia and Peru. Foods 2019, 8, 526. [Google Scholar] [CrossRef] [Green Version]
- No, R. Regulation (Ec) No 1924/2006 of the European Parlament and of the Council of 20 December 2006 on Nutrition and Health Claims Made on Foods. Corrigendum to Regulation (Ec) No 1924/2006. OJEU 2007, L12, 3–17. [Google Scholar]
- Leidi, E.O.; Altamirano, A.M.; Mercado, G.; Rodriguez, J.P.; Ramos, A.; Alandia, G.; Sørensen, M.; Jacobsen, S.-E. Andean roots and tubers crops as sources of functional foods. J. Funct. Foods 2018, 51, 86–93. [Google Scholar] [CrossRef] [Green Version]
- Matsuguma, L.S.; Lacerda, L.G.; Schnitzler, E.; Carvalho Filho, M.A.D.S.; Franco, C.M.L.; Demiate, I.M. Characterization of Native and Oxidized Starches of Two Varieties of Peruvian Carrot (Arracacia xanthorrhiza, B.) from Two Production Areas of Paraná State, Brazil. Braz. Arch. Biol. Technol. 2009, 52, 701–713. [Google Scholar] [CrossRef] [Green Version]
- Gross, R.; Von Baer, E.; Koch, F.; Marquard, R.; Trugo, L.; Wink, M. Chemical Composition of a New Variety of the Andean Lupin (Lupinus mutabilis Cv. Inti) with Low-Alkaloid Content. J. Food Compos. Anal. 1988, 1, 353–361. [Google Scholar] [CrossRef]
- Jacobsen, S.-E.; Mujica, A. El Tarwi (Lupinus mutabilis Sweet.) Y Sus Parientes Silvestres. Bot. Econ. Andes. Cent. 2006, 28, 458–482. [Google Scholar]
- Moorthy, S.N.; Sajeev, M.S.; Anish, R.J. Chapter 11—Functionality of Tuber Starches. In Starch in Food, 2nd ed.; Malin, S., Lars, N., Eds.; Woodhead Publishing: Sawston, UK, 2018; pp. 421–508. [Google Scholar]
- Azeem, M.; Mu, T.-H.; Zhang, M. Influence of Particle Size Distribution on Nutritional Composition, Microstructural and Antioxidant Properties of Orange and Purple-Fleshed Sweet Potato Flour. J. Food Process. Preserv. 2021, 45, e15283. [Google Scholar] [CrossRef]
- Escalante-Aburto, A.; Ponce-García, N.; Ramírez-Wong, B.; Santiago-Ramos, D.; Véles-Medina, J.J.; Cárdenas, J.D.D.F. Effect of extrusion factors and particle size on starch properties of nixtamalized whole blue corn snacks. Starch-Stärke 2016, 68, 1111–1120. [Google Scholar] [CrossRef]
- Aliaga, P.; Cecilia, N. Contenido De Azúcares En Raíces Reservantes De 106 Clones De Camote (Ipomoea batatas (L.) Lam.) De La Colección De Germoplasma. Anales Científicos 2009, 70, 1–10. [Google Scholar]
- Khajehei, F.; Merkt, N.; Claupein, W.; Graeff-Hoenninger, S. Yacon (Smallanthus sonchifolius Poepp. & Endl.) as a Novel Source of Health Promoting Compounds: Antioxidant Activity, Phytochemicals and Sugar Content in Flesh, Peel, and Whole Tubers of Seven Cultivars. Molecules 2018, 23, 278. [Google Scholar] [CrossRef] [Green Version]
- Rocha-Villarreal, V.; Serna-Saldivar, S.O.; García-Lara, S. Effects of Parboiling and Other Hydrothermal Treatments on the Physical, Functional, and Nutritional Properties of Rice and Other Cereals. Cereal Chem. 2018, 95, 79–91. [Google Scholar] [CrossRef]
- Torres, A.; Durán, M.; Montero, P. Evaluación De Las Propiedades Funcionales Del Almidón Obtenido a Partir De Malanga (Colocasia esculenta). Cienc. Ing. Dia 2013, 8, 29–38. [Google Scholar]
- Aboubakar, N.Y.; Scher, J.; Mbofung, C. Physicochemical, thermal properties and microstructure of six varieties of taro (Colocasia esculenta L. Schott) flours and starches. J. Food Eng. 2008, 86, 294–305. [Google Scholar] [CrossRef]
- Moorthy, S. Tuber Crop Starches. Tech. Bull 2000, 18. [Google Scholar]
- Ledezma, C.C.Q. Los almidones resistentes y la salud. Investig. Desarro. 2008, 8, 130–141. [Google Scholar] [CrossRef] [Green Version]
- Ramón, F. Efecto del Estrés Abiótico Post-Cosecha en las Características Físico-Químicas y de Algunos Metabolitos Primarios de Mashua Morada (Tropaeolum tuberosum Ruíz & Pavón). Bachelor’s Thesis, Universidad Nacional Agraria La Molina, Lima, Peru, 2017. [Google Scholar]
- Lim, T.K. Oxalis Tuberosa. In Edible Medicinal and Non-Medicinal Plants; Springer: New York, NY, USA, 2016; pp. 139–146. [Google Scholar]
- FAO; WHO. “Codex Alimentarius”. In Codex Standard 151-1989 (Rev. 1-1995); Food and Agriculture Organization of the United Nations (FAO), World Health Organization (WHO), Eds.; FAO; WHO: Rome, Italy, 2007. [Google Scholar]
- Kraithong, S.; Lee, S.; Rawdkuen, S. Physicochemical and functional properties of Thai organic rice flour. J. Cereal Sci. 2018, 79, 259–266. [Google Scholar] [CrossRef]
- Alkarkhi, A.; bin Ramli, S.; Yong, Y.S.; Easa, A.M. Comparing physicochemical properties of banana pulp and peel flours prepared from green and ripe fruits. Food Chem. 2011, 129, 312–318. [Google Scholar] [CrossRef] [PubMed]
- Martínez-Flórez, S.; González-Gallego, J.; Culebras, J.M.; Tuñón, M. Los Flavonoides: Propiedades Y Acciones Antioxidantes. Nutr. Hosp. 2002, 17, 271–278. [Google Scholar] [PubMed]
- Villacrés, E.; Cuadrado, L.; Quelal, M.B. Actividad Antimicrobiana De Extractos De Granos Andinos El Chocho, La Quinua, Amaranto Y Sangorache, Fuente De MoleéCulas Bioactivas; Académica Española: Madrid, Spain, 2016. [Google Scholar]
- Velásquez-Barreto, F.F.; A Bello-Pérez, L.; Nuñez-Santiago, C.; Yee-Madeira, H.; Sánchez, C.E.V. Relationships among molecular, physicochemical and digestibility characteristics of Andean tuber starches. Int. J. Biol. Macromol. 2021, 182, 472–481. [Google Scholar] [CrossRef]
- Cooperstone, J.; Schwartz, S. Recent Insights into Health Benefits of Carotenoids Elvesier; Woodhead Publishing: Sawston, UK, 2016. [Google Scholar]
- Young, A.; Lowe, G.M. Antioxidant and Prooxidant Properties of Carotenoids. Arch. Biochem. Biophys. 2001, 385, 20–27. [Google Scholar] [CrossRef]
- Campos, D.; Chirinos, R.; Ranilla, L.G.; Pedreschi, R. Chapter Eight—Bioactive Potential of Andean Fruits, Seeds, and Tubers. In Advances in Food and Nutrition Research; Fidel, T., Ed.; Academic Press: Cambridge, MA, USA, 2018. [Google Scholar]
- Savlak, N.; Türker, B.; Yeşilkanat, N. Effects of Particle Size Distribution on Some Physical, Chemical and Functional Properties of Unripe Banana Flour. Food Chem. 2016, 213, 180–186. [Google Scholar] [CrossRef]
- Martín, J.C.; Higuera, B.L. Glucosinolate composition of Colombian accessions of mashua (Tropaeolum tuberosum Ruíz & Pavón), structural elucidation of the predominant glucosinolate and assessment of its antifungal activity. J. Sci. Food Agric. 2016, 96, 4702–4712. [Google Scholar] [CrossRef]
- Kalyankar, S.D.; Deshmukh, M.A.; Chopde, S.S.; Khedkar, C.D.; Lule, V.K.; Deosarkar, S.S. Milk Powder. In Encyclopedia of Food and Health; Benjamin, C., Paul, M.F., Fidel, T., Eds.; Academic Press: Cambridge, MA, USA, 2016. [Google Scholar]
- Subramanian, S.; Viswanathan, R. Bulk density and friction coefficients of selected minor millet grains and flours. J. Food Eng. 2007, 81, 118–126. [Google Scholar] [CrossRef]
- Rayo, L. Processo de Aglomeração de Farinha de Banana Verde Com Alto Conteúdo de Amido Resistente em Leito Fluidizado Pulsado. Master’s Thesis, Escola Politécnica Chemical Engineerin, Sao Paulo, Brasil, 2013. [Google Scholar]
- Abdullah, E.C.; Geldart, D. The use of bulk density measurements as flowability indicators. Powder Technol. 1999, 102, 151–165. [Google Scholar] [CrossRef]
- Hernández-Uribe, J.P.; Meza-Nieto, M.; Palma-Rodríguez, H.M.; Navarro-Cortez, R.O.; Guzmán-Ortiz, F.A.; Bello-Pérez, L.A.; Vargas-Torres, A. Physicochemical, Morphological, and Molecular Properties of Starch Isolated from Dioscorea and Oxalis Tubers from Hidalgo State, Mexico. Starch-Stärke 2020, 72. [Google Scholar] [CrossRef]
- Lima, D.C.; Villar, J.; Castanha, N.; Maniglia, B.C.; Junior, M.D.M.; Augusto, P.E.D. Ozone modification of arracacha starch: Effect on structure and functional properties. Food Hydrocoll. 2020, 108, 106066. [Google Scholar] [CrossRef]
- Pinzon, M.I.; Sanchez, L.T.; Villa, C.C. Chemical, structural, and thermal characterization of starches from four yellow Arracacha (Arracacia xanthorriza) roots produced in Colombia. Heliyon 2020, 6, e04763. [Google Scholar] [CrossRef]
- Pang, Y.; Ali, J.; Wang, X.; Franje, N.J.; Revilleza, J.E.; Xu, J.; Li, Z. Relationship of Rice Grain Amylose, Gelatinization Temperature and Pasting Properties for Breeding Better Eating and Cooking Quality of Rice Varieties. PLoS ONE 2016, 11, e0168483. [Google Scholar] [CrossRef] [Green Version]
- Pacheco, M.T.; Hernández-Hernández, O.; Moreno, F.J.; Villamiel, M. Andean tubers grown in Ecuador: New sources of functional ingredients. Food Biosci. 2020, 35, 100601. [Google Scholar] [CrossRef]
- Zhang, Y.H.P. Starch: A High-Density Chemical Hydrogen Storage Compound for Pem Fuel Cells. In Portable Hydrogen Energy Systems; Paloma, F.-A., Antonio, M.C., Eds.; Academic Press: Cambridge, MA, USA, 2018; pp. 161–173. [Google Scholar]
- Wang, S.; Copeland, L. Phase Transitions of Pea Starch over a Wide Range of Water Content. J. Agric. Food Chem. 2012, 60, 6439–6446. [Google Scholar] [CrossRef]
- Wright, D.J.; Boulter, D. Differential scanning calorimetric study of meals and constituents of some food grain Legumes. J. Sci. Food Agric. 1980, 31, 1231–1241. [Google Scholar] [CrossRef]
- Lii, C.; Shao, Y.; Tseng, K. Gelations Mechanism and Rheological of Rice Starch. Cereal Chem. 1995, 72, 393–400. [Google Scholar]
- Sasaki, T.; Matsuki, J. Effect of Wheat Starch Structure on Swelling Power. Cereal Chem. J. 1998, 75, 525–529. [Google Scholar] [CrossRef]
- Zhang, P.; Whistler, R.L.; BeMiller, J.N.; Hamaker, B.R. Banana Starch: Production, Physicochemical Properties, and Digestibility—A Review. Carbohydr. Polym. 2005, 59, 443–458. [Google Scholar] [CrossRef]
- Awuchi, C.G.; Igwe, V.S.; Echeta, C.K. The Functional Properties of Foods and Flours. Int. J. Adv. Acad. 2019, 5, 139–160. [Google Scholar]
- Agama-Acevedo, E.; Islas-Hernandez, J.J.; Osorio-Díaz, P.; Rendón-Villalobos, R.; Utrilla-Coello, R.G.; Angulo, O.; Bello-Pérez, L.A. Pasta with Unripe Banana Flour: Physical, Texture, and Preference Study. J. Food Sci. 2009, 74, S263–S67. [Google Scholar] [CrossRef] [PubMed]
- Chang, Y.; Lim, S.; Yoo, B. Dynamic rheology of corn starch–sugar composites. J. Food Eng. 2004, 64, 521–527. [Google Scholar] [CrossRef]
- Rosalina, I.; Bhattacharya, M. Dynamic rheological measurements and analysis of starch gels. Carbohydr. Polym. 2002, 48, 191–202. [Google Scholar] [CrossRef]
- Arıcı, M.; Özülkü, G.; Kahraman, B.; Yıldırım, R.M.; Toker, Ö.S. Taro Flour Usage in Wheat Flour Bread and Gluten-Free Bread: Evaluation of Rheological, Technological and Some Nutritional Properties. J. Food Process Eng. 2020, 43, e13454. [Google Scholar] [CrossRef]
- Zi, Y.; Shen, H.; Dai, S.; Ma, X.; Ju, W.; Wang, C.; Guo, J.; Liu, A.; Cheng, D.; Li, H.; et al. Comparison of starch physicochemical properties of wheat cultivars differing in bread- and noodle-making quality. Food Hydrocoll. 2019, 93, 78–86. [Google Scholar] [CrossRef]
- Khatkar, B.S.; Schofield, J.D. Dynamic Rheology of Wheat Flour Dough. I. Non-Linear Viscoelastic Behaviour. J. Sci. Food Agric. 2002, 82, 827–829. [Google Scholar] [CrossRef]
- Zhang, D.; Mu, T.; Sun, H. Comparative study of the effect of starches from five different sources on the rheological properties of gluten-free model doughs. Carbohydr. Polym. 2017, 176, 345–355. [Google Scholar] [CrossRef] [PubMed]
- Zhu, F.; Cui, R. Comparison of Physicochemical Properties of Oca (Oxalis tuberosa), Potato, and Maize Starches. Int. J. Biol. Macromol. 2020, 148, 601–607. [Google Scholar] [CrossRef] [PubMed]
- Albano, K.M.; Franco, C.M.; Telis, V.R. Rheological behavior of Peruvian carrot starch gels as affected by temperature and concentration. Food Hydrocoll. 2014, 40, 30–43. [Google Scholar] [CrossRef]
- Georgopoulos, T.; Larsson, H.; Eliasson, A.-C. Influence of native lipids on the rheological properties of wheat flour dough and gluten. J. Texture Stud. 2006, 37, 49–62. [Google Scholar] [CrossRef]
- Santacruz, S.; Ruales, J.; Eliasson, A.C. Three under-Utilised Sources of Starch from the Andean Region in Ecuador. Part Ii. Rheological Characterisation. Carbohydr. Polym. 2003, 51, 85–92. [Google Scholar] [CrossRef]
- Singh, N.; Kaur, L. Morphological, thermal, rheological and retrogradation properties of potato starch fractions varying in granule size. J. Sci. Food Agric. 2004, 84, 1241–1252. [Google Scholar] [CrossRef]
- Singh, A.; Geveke, D.J.; Yadav, M.P. Improvement of rheological, thermal and functional properties of tapioca starch by using gum arabic. LWT 2017, 80, 155–162. [Google Scholar] [CrossRef]
- Xu, J.; Mohamed, A.A. Thermal and rheological properties of Lupinus albus flour. J. Am. Oil Chem. Soc. 2003, 80, 763–766. [Google Scholar] [CrossRef]
- Ahmad, F.B.; Williams, P.A. Rheological Properties of Sago Starch. J. Agric. Food Chem. 1998, 46, 4060–4065. [Google Scholar] [CrossRef]
- Choi, H.-M.; Yoo, B. Rheology of Mixed Systems of Sweet Potato Starch and Galactomannans. Starch-Stärke 2008, 60, 263–269. [Google Scholar] [CrossRef]
- Chaisawang, M.; Suphantharika, M. Effects of guar gum and xanthan gum additions on physical and rheological properties of cationic tapioca starch. Carbohydr. Polym. 2005, 61, 288–295. [Google Scholar] [CrossRef]
- Liu, S.; Chen, D.; Xu, J. The Effect of Partially Substituted Lupin, Soybean, and Navy Bean Flours on Wheat Bread Quality. Food Nutr. Sci. 2018, 9, 840–854. [Google Scholar] [CrossRef] [Green Version]
- Boonpichai, A.; Sirivongpaisal, P. Rheological Properties of Purple Sweet Potato Flour and Its Application to Noodle Product. In Proceedings of the 16th ASEAN Food Conference, Bali, Indonesia, 15–18 October 2019; Science and Technology Publications: Setúbal, Portugal, 2020. [Google Scholar]
- Fonseca-Florido, H.A.; Gómez-Aldapa, C.A.; López-Echevarría, G.; Velazquez, G.; Morales-Sánchez, E.; Castro-Rosas, J.; Méndez-Montealvo, G. Effect of Granular Disorganization and the Water Content on the Rheological Properties of Amaranth and Achira Starch Blends. LWT 2018, 87, 280–286. [Google Scholar] [CrossRef]
- Sánchez, A.; del Pilar, B. Caracterización Fisicoquimica Y Reologica De Almidon De Arracacha (Arracacia xanthorrhiza) Variedad Amarilla Procedente De La Provincia San Ignacio-Departamento De Cajamarca. Bachelor’s Thesis, Universidad Cesar Vallejo, Trujillo, Peru, 2015. [Google Scholar]
- Graf, B.L.; Zhang, L.; Corradini, M.; Kuhn, P.; Newman, S.S.; Salbaum, J.M.; Raskin, I. Physicochemical differences between malanga (Xanthosoma sagittifolium) and potato (Solanum tuberosum) tubers are associated with differential effects on the gut microbiome. J. Funct. Foods 2018, 45, 268–276. [Google Scholar] [CrossRef]
- Saleh, M.; Al-Ismail, K.; Ajo, R. Pasta quality as impacted by the type of flour and starch and the level of egg addition. J. Texture Stud. 2016, 48, 370–381. [Google Scholar] [CrossRef]
- Catunta, D. Efecto De La Deshidratación Osmótica Sobre Los Compuestos Antioxidantes En Dos Accesiones De Mashua (Tropaeolum tuberosum R&P). Bachelor’s Thesis, Universidad Nacional del Altiplano, Puno, Peru, 2016. [Google Scholar]
- Doyle, R.; Rodriguez, L. Estudio Comparativo De La Composición Química Y Carácter Reductor De Dos Variedades De Tropaeolum Tuberosum (Ruíz Y Pavón, Kuntze) Mashua. Bachelor’s Thesis, Universidad de Guayaquil, Guayaquil, Ecuador, 2018. [Google Scholar]
- Aleman, A.; Blanco-Pascual, N.; Montero, M.; Gómez-Guillén, M. Simple and efficient hydrolysis procedure for full utilization of the seaweed Mastocarpus stellatus to produce antioxidant films. Food Hydrocoll. 2016, 56, 277–284. [Google Scholar] [CrossRef]
- Pérez-Balladares, D.; Castañeda-Terán, M.; Granda-Albuja, M.G.; Tejera, E.; Iturralde, G.; Granda-Albuja, S.; Jaramillo-Vivanco, S.; Giampieri, F.; Battino, M.; Alvarez-Suarez, J. Chemical Composition and Antioxidant Activity of the Main Fruits, Tubers and Legumes Traditionally Consumed in the Andean Regions of Ecuador as a Source of Health-Promoting Compounds. Plant Foods Hum. Nutr. 2019, 74, 350–357. [Google Scholar] [CrossRef]
- Córdova-Ramos, J.S.; Glorio-Paulet, P.; Hidalgo, A.; Camarena, F. Efecto Del Proceso Tecnológico Sobre La Capacidad Antioxidante Y Compuestos Fenólicos Totales Del Lupino Andino (Lupinus mutabilis Sweet). Sci. Agropecu. 2020, 11, 157–165. [Google Scholar] [CrossRef]
Publisher’s Note: MDPI stays neutral with regard to jurisdictional claims in published maps and institutional affiliations. |
© 2021 by the authors. Licensee MDPI, Basel, Switzerland. This article is an open access article distributed under the terms and conditions of the Creative Commons Attribution (CC BY) license (https://creativecommons.org/licenses/by/4.0/).