Article

Multi-Trait Selection Indices for Identifying New Cassava Varieties Adapted to the Caribbean Region of Colombia

1
Centro de Investigación Caribia, Corporación Colombiana para la Investigación Agropecuaria-AGROSAVIA, Sevilla-Zona Bananera, Magdalena 478020, Colombia
2
Centro de Investigación Turipana, Corporación Colombiana para la Investigación Agropecuaria-AGROSAVIA, Kilómetro 13, Vía Montería-Cereté 230558, Colombia
3
Centro de Investigación Motilonia, Corporación Colombiana para la Investigación Agropecuaria-AGROSAVIA, Kilómetro 5 vía a Becerril, Agustín Codazzi 202050, Colombia
4
Centro de Investigación La Suiza, Corporación Colombiana para la Investigación Agropecuaria-AGROSAVIA, Kilometro 32 via al mar, Rionegro 687519, Colombia
5
CGIAR Research Program on Roots Tubers and Bananas (RTB), The Alliance of Bioversity International and the International Center for Tropical Agriculture (CIAT), Cali 6713, Colombia
*
Author to whom correspondence should be addressed.
Agronomy 2021, 11(9), 1694; https://doi.org/10.3390/agronomy11091694
Submission received: 10 July 2021 / Revised: 12 August 2021 / Accepted: 13 August 2021 / Published: 25 August 2021
(This article belongs to the Section Crop Breeding and Genetics)

Abstract

:
In Colombia, the highest cassava production comes from the semi-arid region of the Atlantic Coast with relatively low yield for fresh consumption (≤11 t/ha). Development of improved varieties is based on a plant ideotype which integrates a group of desirable traits independently measured in the field. However, selecting high performance genotypes for several traits simultaneously is a complex process. Sixteen genotypes were evaluated under four environmental conditions (localities) of the Colombian Caribbean region (Cereté, Carmen de Bolivar, Agustín Codazzi, and Sevilla), and two production cycles (2016/2017–2017/2018) in order to assess phenotypic expression of selected traits, their stability, and utility in genotype selection. Selection of promising genotypes should consider both their superiority and stability. Genotypes SM3106-14, GM1692-56, CM9456-12, and GM214-62 were selected based on their agronomic performance. In addition, frequency analysis of sensorial data showed that genotypes CM9456-12, SM1127-8, SM3553-27, and SM3562-32 were preferred by panelists who assessed, color, flavor, texture, and root shape. Determination of superiority through across-environments, multi-trait selection index allows identifying genotypes with superior performance. However, selection was improved when local multi-trait selection indices were included—phenotypic stability determination (through Lin and Binns index and AMMI model) supported an adequate selection of superior and stable cassava genotypes. The inclusion of palatability response and quality features determination in cassava genotypes can be recommended to identify genotypes with higher adoption rates by farmers and consumers.

1. Introduction

Cassava is considered a staple food for more than 1 billion people worldwide. Furthermore, regarding alternative sources of energy, the caloric intake from cassava is higher than that provided by different cereals and legumes. Therefore, the crop has become essential for the food security of developing countries, particularly in sub-Saharan Africa. In terms of per capita consumption, Colombia occupies the tenth place worldwide reporting an average of 38.5 kg per person per year [1]. In Latin America, approximately 45% of the area cultivated with cassava corresponds to regions with limited water availability or sporadic rainfall cycles [2]. Cassava is cultivated in all the regions of Colombia, finding in the semiarid environments the highest yields.
The genetic improvement in crops has generated the highest rates of returns in agricultural research. Cassava breeding programs date back to the year 1930 initially in African countries and in Brazil, but these efforts were discontinuous throughout the years. Only after the 1960s, there was a rapid expansion in the use of cassava genetic resources from Asia, Africa, and Latin America thanks to the creation of the International Institute of Tropical Agriculture (IITA) and the International Center for Tropical Agriculture (CIAT) [3]. National cassava programs also became very active during the 1970s.
Selection in multi-environmental conditions such as contrasting seasons, either at the same location or at different sites, has been used to expose materials to a broad range of potential production environments. Therefore, although crop cultivars are bred in and for specific regions, they need to be adapted to weather variability within those regions, both within and across years [4]. This is especially the case where production areas have different edapho-climatic conditions, are susceptible to suffer the effects of large-scale climatic events and planting time is defined by seasonality and rainfall availability [5]. In cassava, uniform yield trials are planted for 2 consecutive years in 5–10 locations, this typically to identify and select superior, stable and high-yielding cultivars with high potential commercial use [3]. Farmer and end user criteria are used during each step of selection, and they are invited to participate for more intensive input and interaction with breeders during the harvest [3].
Several economically relevant traits in cassava are inherited quantitatively, and the phenotypic variance is influenced by the effects of the joint action of the genotype, the environment and the genotype by environment interaction (G × E), as described by [6]. Single environment results are ineffective improving quantitative traits, since the identification of superior cultivars should take into consideration and be based on an G × E interaction analysis as well as in their phenotypic stability [7]. Phenotypic stability is desirable during cultivar selection for a predictable behavior in varying environmental conditions. Among the methodologies commonly used for this purpose, the ones published by [8,9,10,11] and recently the AMMI model [12,13,14] could be highlighted.
In addition to appropriate consideration of G × E interaction, breeders need to consider several traits simultaneously. The use of multi-trait selection indices facilitates the integration of several desirable attributes determined by the breeder cultivar ideotypes can then be selected according to their genetic superiority and phenotypic stability [15,16]. The application of accurated indices promote the efficiency of the selection [17,18]. The integration of several characteristics in a selection index favors the identification of superior genotypes that are expected to have a positive impact on the value chain of a crop, hence, enhancing the adoption rate of the released varieties [17,19]. In cassava, [3] reported the use of a selection index considering agronomic aspects of the crop, such as total fresh root yield, dry matter content, plant type, response to diseases and harvest index.
This study shows the potential of integrating different tools and calculations of selection indices that allows the identification of promising cassava genotypes with high potential for fresh consumption evaluated in multi-location trials.

2. Materials and Methods

2.1. Plant Material

Fourteen improved experimental clones (CM9456-12, CMB8527, GM1692-56, GM214-62, GM3766-5, GM3790-2, SM1127-8, SM2773-32, SM3106-14, SM3385-55, SM3386-49, SM3387-73, SM3474-139 and SM3553-27) developed at International Center for Tropical Agriculture (CIAT) and two commercial checks (CORPOICA CAISELI and ICA-COSTEÑA) were evaluated through uniform yield trials (UYT). The nomenclature used to identify each genotype indicates that CM, GM or CMB clones come from controlled pollinations with known male and female progenitors. On the other hand, SM indicates materials derived from open pollination nurseries and thus only the female progenitor is known.

2.2. Study Area

The study was conducted in four locations of the Colombian Caribbean region corresponding to four locations: Agustín Codazzi (Codazzi), Carmen de Bolivar (CarmenB), Cereté (Cerete), and the Zona Bananera (Sevilla), corresponding to the departments Cesar, Bolívar, Córdoba and Magdalena (Figure 1), respectively, during two production cycles (2016/2017-2017/2018), except in Coddazi, where it was not established in 2016 due to administrative issues. Soil fertility and other characteristics of the study area are described in Table 1.

2.3. Experimental Design and Management

The study was conducted during two crop cycles: (i) July 2016–April 2017 and (ii) June 2017–March 2018. The experiment employed a completely randomized block design (CRBD) with three replicates. The experimental unit per genotype was a plot of 25 m2 with a conventional spatial arrangement of five rows of 5 m spaced at 0.9 m with the same distance between plants (25 plants per genotype per block). Soil preparation and planting were carried out according to the edaphological and agroclimatic conditions of each zone. Weed management included the application of pre-emergent herbicides, graminicides, and with a screen for herbicides that can cause phytotoxicity to the crop. The fertilization was done according to the results of the soil analysis of each location and considering the management that the farmer conventionally offers to the crop. All parameters were evaluated using the central plants from each plot (nine plants). Plant type was evaluated using a scale: (1) Clearly better than the average; (2) Slightly better than the average; (3) Average; (4) Slightly worse than the average; (5) Clearly worse than the average [3]. Total and commercial fresh root yield was calculated from parameters taken per plot (commercial and total root weight), dry matter content was calculated according to the gravimetric method [20].

2.4. Cooking and Sensory Test

After agronomic evaluation and cyanide estimation, a preliminary selection was done to establish a trial during crop cycle 2018–2019 to produce roots for sensory evaluation. Cassava roots of uniform shape and weight were randomly selected, carefully washed, and left to dry in open air. Sections with length and diameter of approximately 5 cm extracted from the middle of three roots were peeled and cooked. After 10 min of boiling and every 5 min thereafter, softness was evaluated using a toothpick. The time required to soften the root was registered and used to prepare a sample for sensory test (approximately 20 g samples). A hedonic scale was used to sensorially assess the cooking quality of roots from different genotypes. The scale had five categories ranging from “extremely dislike” to “extremely like”. It was used to produce preference evaluation based on a 9-point hedonic scale [21]. Cassava consumers (n = 90) were recruited to evaluate roots from 11 of the experimental clones (CM9456-12, CMB8527, GM1692-56, GM3790-2, SM1127-8, SM3106-14, SM3387-73, SM3386-49, SM3474-139, SM3553-27, and SM3562-32) and three commercial checks (Corpoica Caiseli, ICA-Costeña, and Venezolana). Venezolana variety was introduced in this experiment due to its high culinary attributes and preference by consumers. Roots from GM214-62, GM3766-5, and SM3385-55 were not evaluated. The order of sample presentation was randomized. The consumers were briefed on the hedonic scale and its use prior to sample testing, and also received a glass with ambient temperature water to cleanse their mouth between sample testing. Participants were asked to evaluate the color, flavor, and texture for each sample. Finally, a whole representative root from each genotype was exhibited to be evaluated and scored according to the root shape and other morphological traits that end users take into consideration.

2.5. Quantification of Cyanide Content

Cyanide content was determined by the methodology described by [22]. Orthophosphoric acid, ethanol, sodium hydroxide, hydrogen cyanide were obtained from Merck (Billerica MA, 01821 USA) and chloramine T, 1,3-dimethyl barbituric acid and isonicotinic acid were obtained from Sigma-Aldrich (St. Louis, MO 68178 USA). Forty grams of grated pulp from fresh roots was homogenized in a blender (Osterizer, model 4655, Ciudad de Mexico, Mexico) with 50 mL of an extracting solution consisting of 0.1 M orthophosphoric acid in a 25% (v/v) ethanol-water mixture for 2 min. The resulting mixture was centrifuged (Eppendorf 5804R, Hamburg, Germany) at 6000 RPM for 10 min at room temperature, then filtered with Whatman No. 1 paper. In addition, 0.1 mL was taken and added to a test tube containing 0.4 mL of a phosphate buffer solution (0.1 M, pH 7.0) and then, 0.1 mL of the enzyme Linamarase (isolated and prepared according to Cooke’s (1978) method) was added. The tube was incubated at 30 °C for 15 min, when 0.6 mL of 0.2 M NaOH was added and was left for 5 min at room temperature. Then, 2.8 mL of pH 6.0 buffer solution was added and 0.1 mL of chloramine T was incubated for 5 min at room temperature. In addition, 0.6 mL of reactive color (solution of 1,3-dimethyl barbituric acid and isonicotinic acid) was added, homogenized in a vortex, and allowed to react for 10 min. Absorbance was observed in a spectrophotometer at 605 nm at room temperature. The total HCN content was quantified with 5 points on a calibration curve (0.015–0.363 µg HCN/mL), where the result is expressed in µg HCN/g fresh root.

2.6. Determination of Total Starch and Glucose Contents

The starch content was determined according to the methodology suggested by [23], with some modifications. The Termamyl 2X enzyme (thermostable α-amylase, Novo A/S, Copenhagen, Denmark) was used for this analysis. Sodium acetate, glucose and sulfuric acid were obtained from Merck (Billerica, MA 01821, USA) and amyloglucosidase, GOD-POD reagent were obtained from Sigma-Aldrich (St. Louis, MO, USA). Five hundred milligrams of cassava flour were weighed in a 125 mL Erlenmeyer flask, and then 30 mL of deionized water were added, gently stirred for 10 min with the help of a magnetic stirrer. In addition, 100 µL of Termamyl 2X was added and the suspension was stirred for 5 min. The Erlenmeyer with the mixture was taken in a thermal bath at 98 °C for 20 min, mixing every 5 min. The cold suspension was transferred to a 100 mL volumetric balloon with deionized water, 500 µL of the above solution were taken in test tubes, and a blank was prepared with 500 µL of deionized water. Then, 1 mL of amyloglucosidase solution (amyloglucosidase from Aspergillus niger, lyophilized, powder, ~70 U/mg Sigma-Aldrich, (St. Louis, MO, USA).) prepared at 0.5 mg/mL in 0.1 M sodium acetate buffer (pH 4.8) was added to each tube. The tubes were incubated at 60 °C for 30 min. Once cooled, 8.5 mL of deionized water was added and vortexed. A 75 µL aliquot of the above solution was obtained and transferred to another test tube, adding 1.5 mL of the GOD-POD reagent, (4-amino-antipyrine, Ref. A4382; GO, Glucose oxidase Ref. G6125-50 KU, POD, peroxidase Ref. P8112-25KU) incubating at 37 °C for 10 min, a blank with water was prepared. The samples were read at an absorption of 510 nm (BioTek Instruments, Inc. Highland Park, IN, USA). The glucose content is quantified by means of a calibration curve prepared with 5 points (0.5–25 µg glucose/mL). In addition to this, it was necessary to determine the content of free glucose, weighing 100 mg in a test tube to which 1 mL of sulfuric acid (0.005 M) was added, stirring in a vortex for 1 min. Followed by centrifugation at 7000 rpm for 3 min, the supernatant was membrane filtered (0.22 µm), 100 µL of the extract were needed in test tubes, 200 µL of the amyloglucosidase solution were added, after 30 min of reaction, 2.5 mL of the GOD-POD solution were obtained, and the mixture was incubated for 20 min at room temperature. After the reaction, the absorbance reading at 510 nm is required to determine glucose with the aid of calibration as specified above. Where: Total starch (% w/w, db), CT is total glucose (% w/w, db), FG is free glucose (% w/w, db), and 0.9 is the factor to conversion between starch and glucose.
Total starch content was calculated using the following equation:
Total Starch = (CT − FG) × 0.9

2.7. Analysis of Variance

A combined analysis of variance (ANOVA) was performed to detect the significance of the sources of variation for each variable, followed by a multiple comparison analysis using the R program [24]. The statistical model used to analyze the data was with mixed effects (genotypes fixed, and locations, seasons and blocks random). Since the individual effect of locations and growing seasons had marginal interest for this research, the combination of location and growing season was considered as a single environment (for a total of seven environmental conditions in the study):
Υ i j k =   µ + α i + β j α i + i k + α i i k + ε i j k
where Υ i j corresponds to the response variable, µ is the general average of the experiment, α i is the effect of the ith environment, β i j corresponds to the effect of the jth block within the ith environment, i k is the effect of the kth genotype, α i i k is the effect of the interaction of the ith environment with the kth genotype, and ε i j is the experimental error in the ith environment, in the jth block under the kth genotype.

2.8. Stability and Phenotypic Adaptability Analysis

Stability and phenotypic adaptability of the genotypes were established for yield data and its components, using the method of [9]. The most stable varieties were those that showed the value for the stability parameter statistic of a given cultivar (Pig) closer to zero. Equation (2) was used to obtain the stability parameter statistic:
P i g = J = 1 n P i   ( X   i ( j )     M   ( j ) ) 2 2 n
where Pig is the stability parameter statistic of the cultivar i, Xi(j) is the response of the dependent variable of the ith cultivar in the jth location, Mj is the maximum observed response among all the cultivars in location j, and n is the number of locations. These results were contrasted with the estimation of phenotypic stability by the AMMI multi-variate analysis method, using the routine proposed by [25,26]. This analysis allowed selecting the best cassava genotypes adapted to the target environment (Caribbean Coast).

2.9. Selection Index

The standardized selection index (SIN) integrated relevant variables by assigning a weight established by the breeder following the methodology proposed by [3]. A negative weight was assigned to the plant type score (PTS), considering that high values were assigned to undesirable morphotypes. Commercial fresh root yield (CFRY) and dry matter content (DMC) were also considered. The equation was then represented as follows:
S I N = C F R Y × 10 + D M C × 10 P T S × 5
The desirable genotypes were those that showed the highest value for the SIN.

3. Results and Discussion

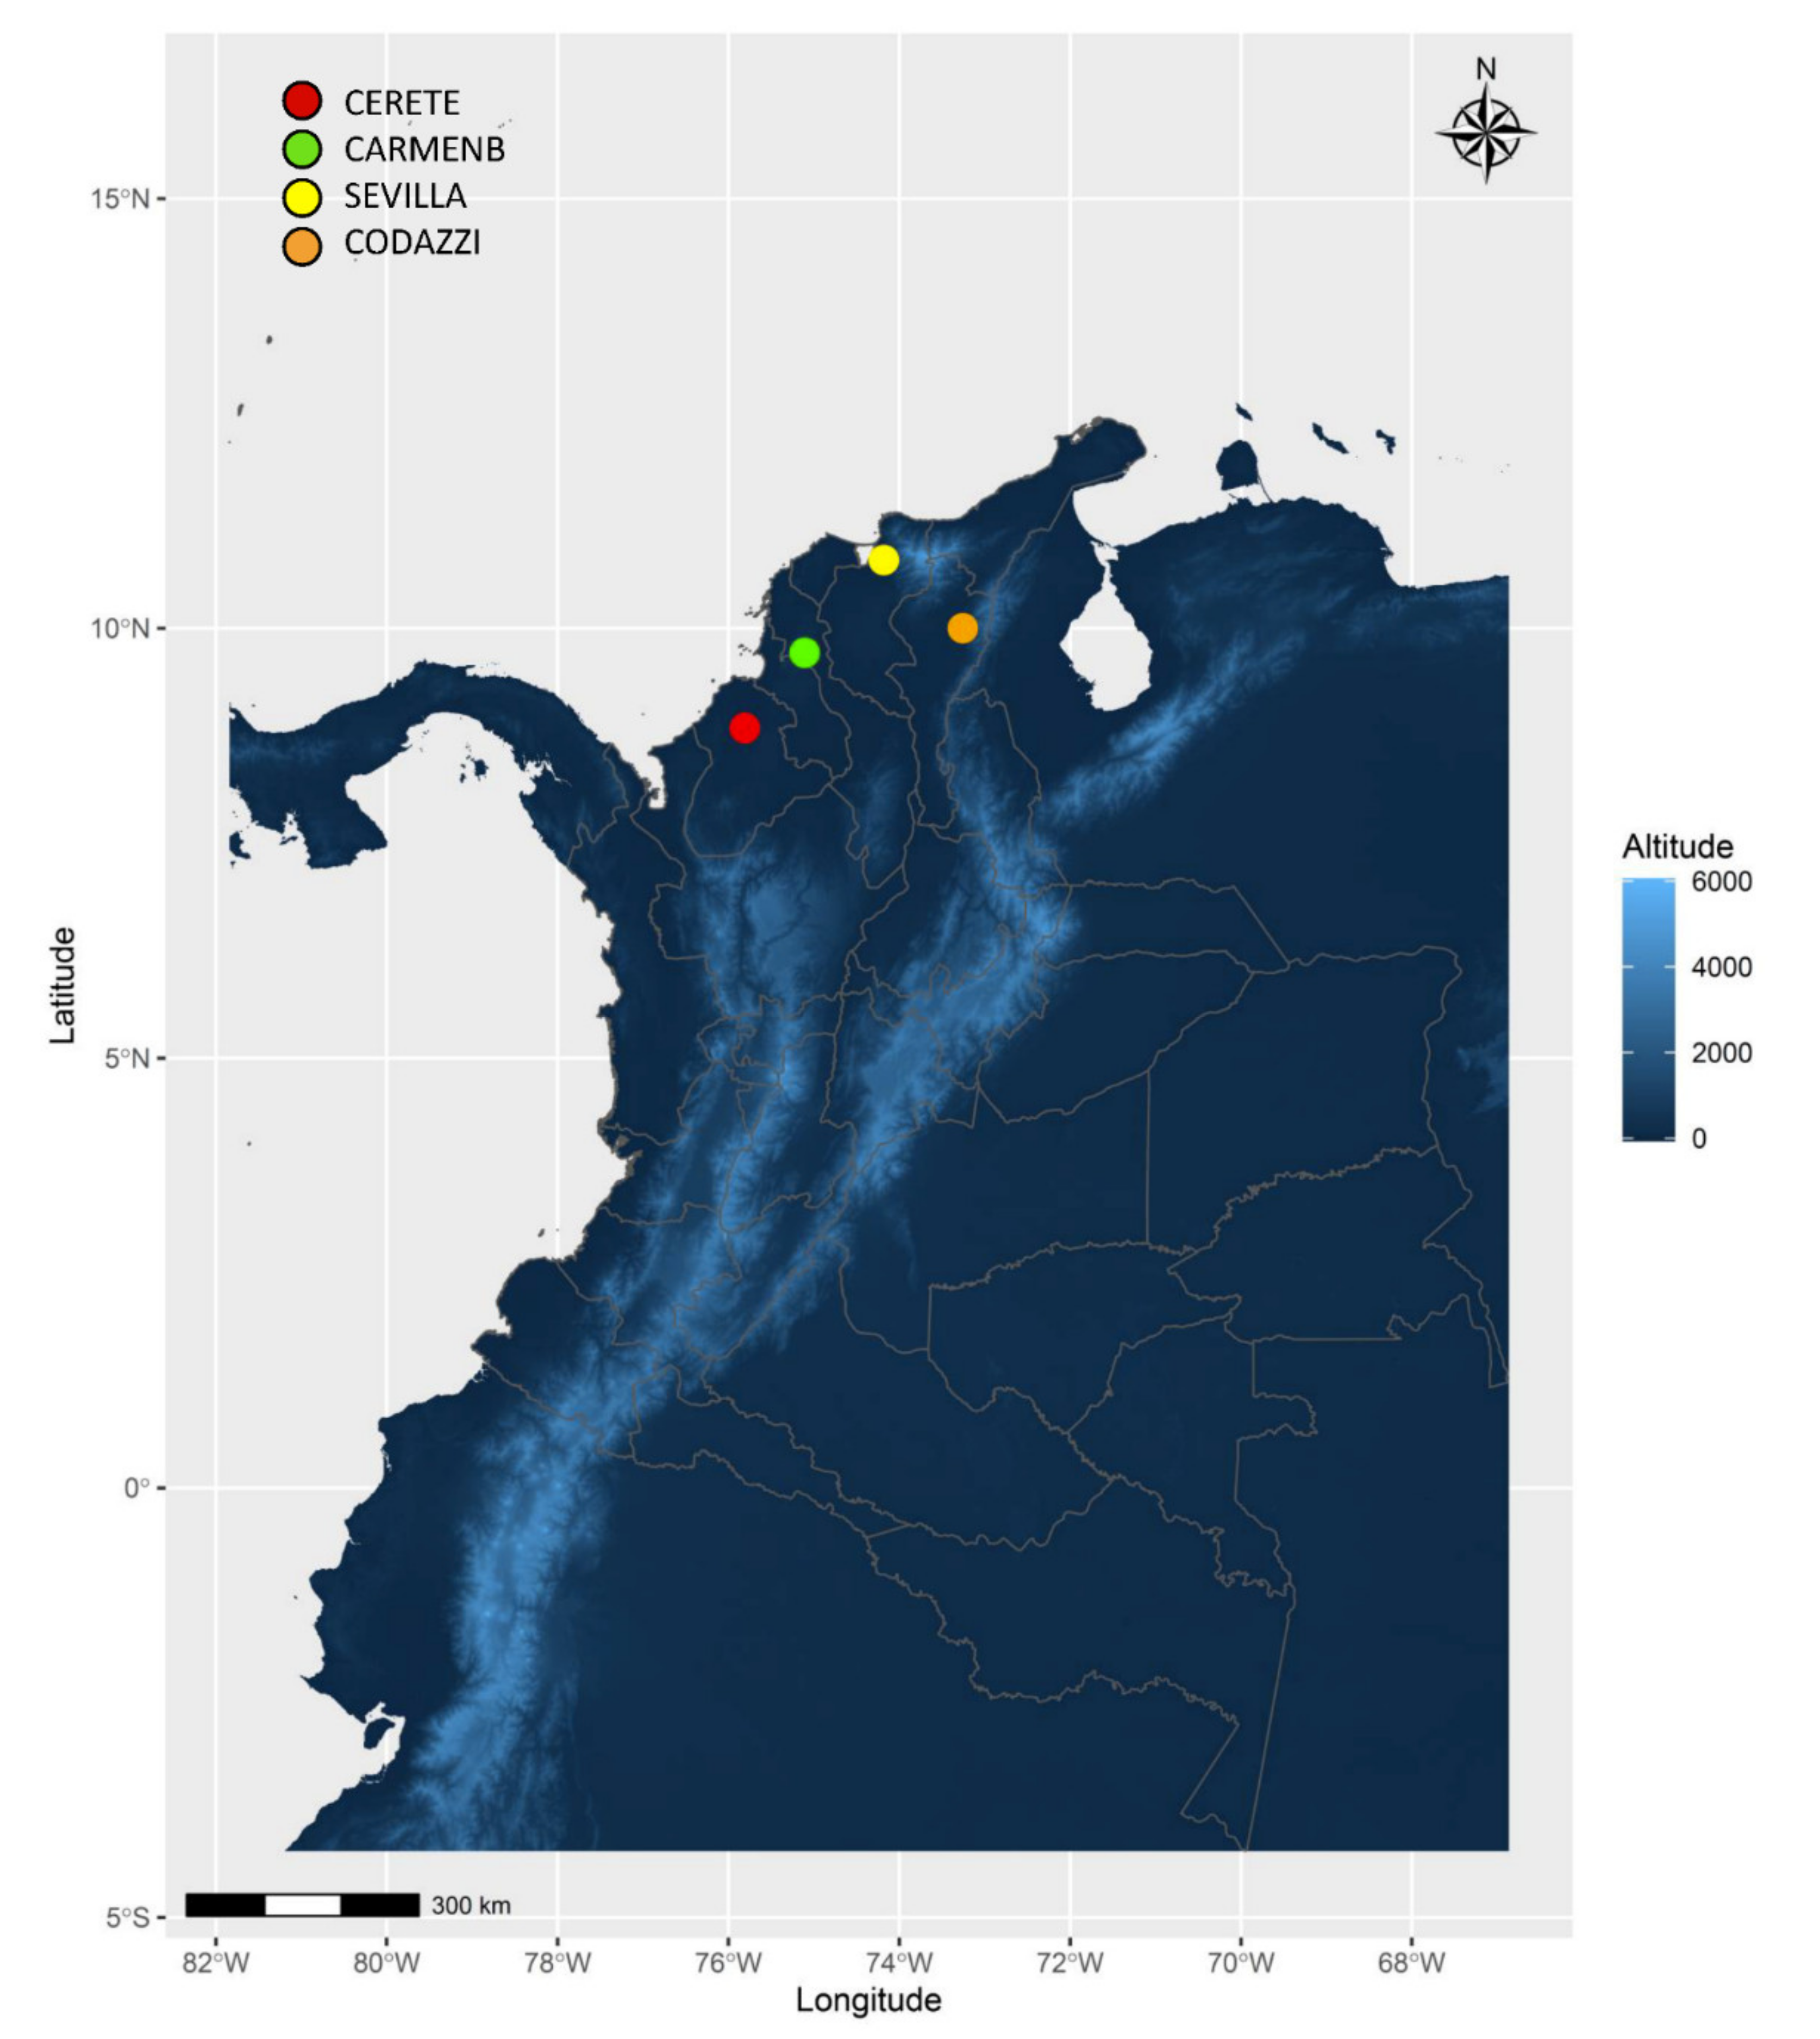
The Caribbean Coast region is characterized by high temperatures. Maximum temperatures ranging between 35–40 °C, minimum between 20–25 °C, and average around 28 °C were recorded (Table 2). Cassava growth requires in its first vegetative phase at least 300 mm of water, rain fall was sufficient throughout the crop cycle in the different trials. Cereté, Seville, and Codazzi showed an accumulated rainfall above 900 mm, Carmen de Bolívar had the lowest rainfall values, but were still acceptable for cassava (Table 2). The observed environmental conditions presented in all locations met the expectation for this agroecological region and were suitable for the germplasm evaluated.

3.1. Response of Cassava Genotypes to Different Environmental Conditions

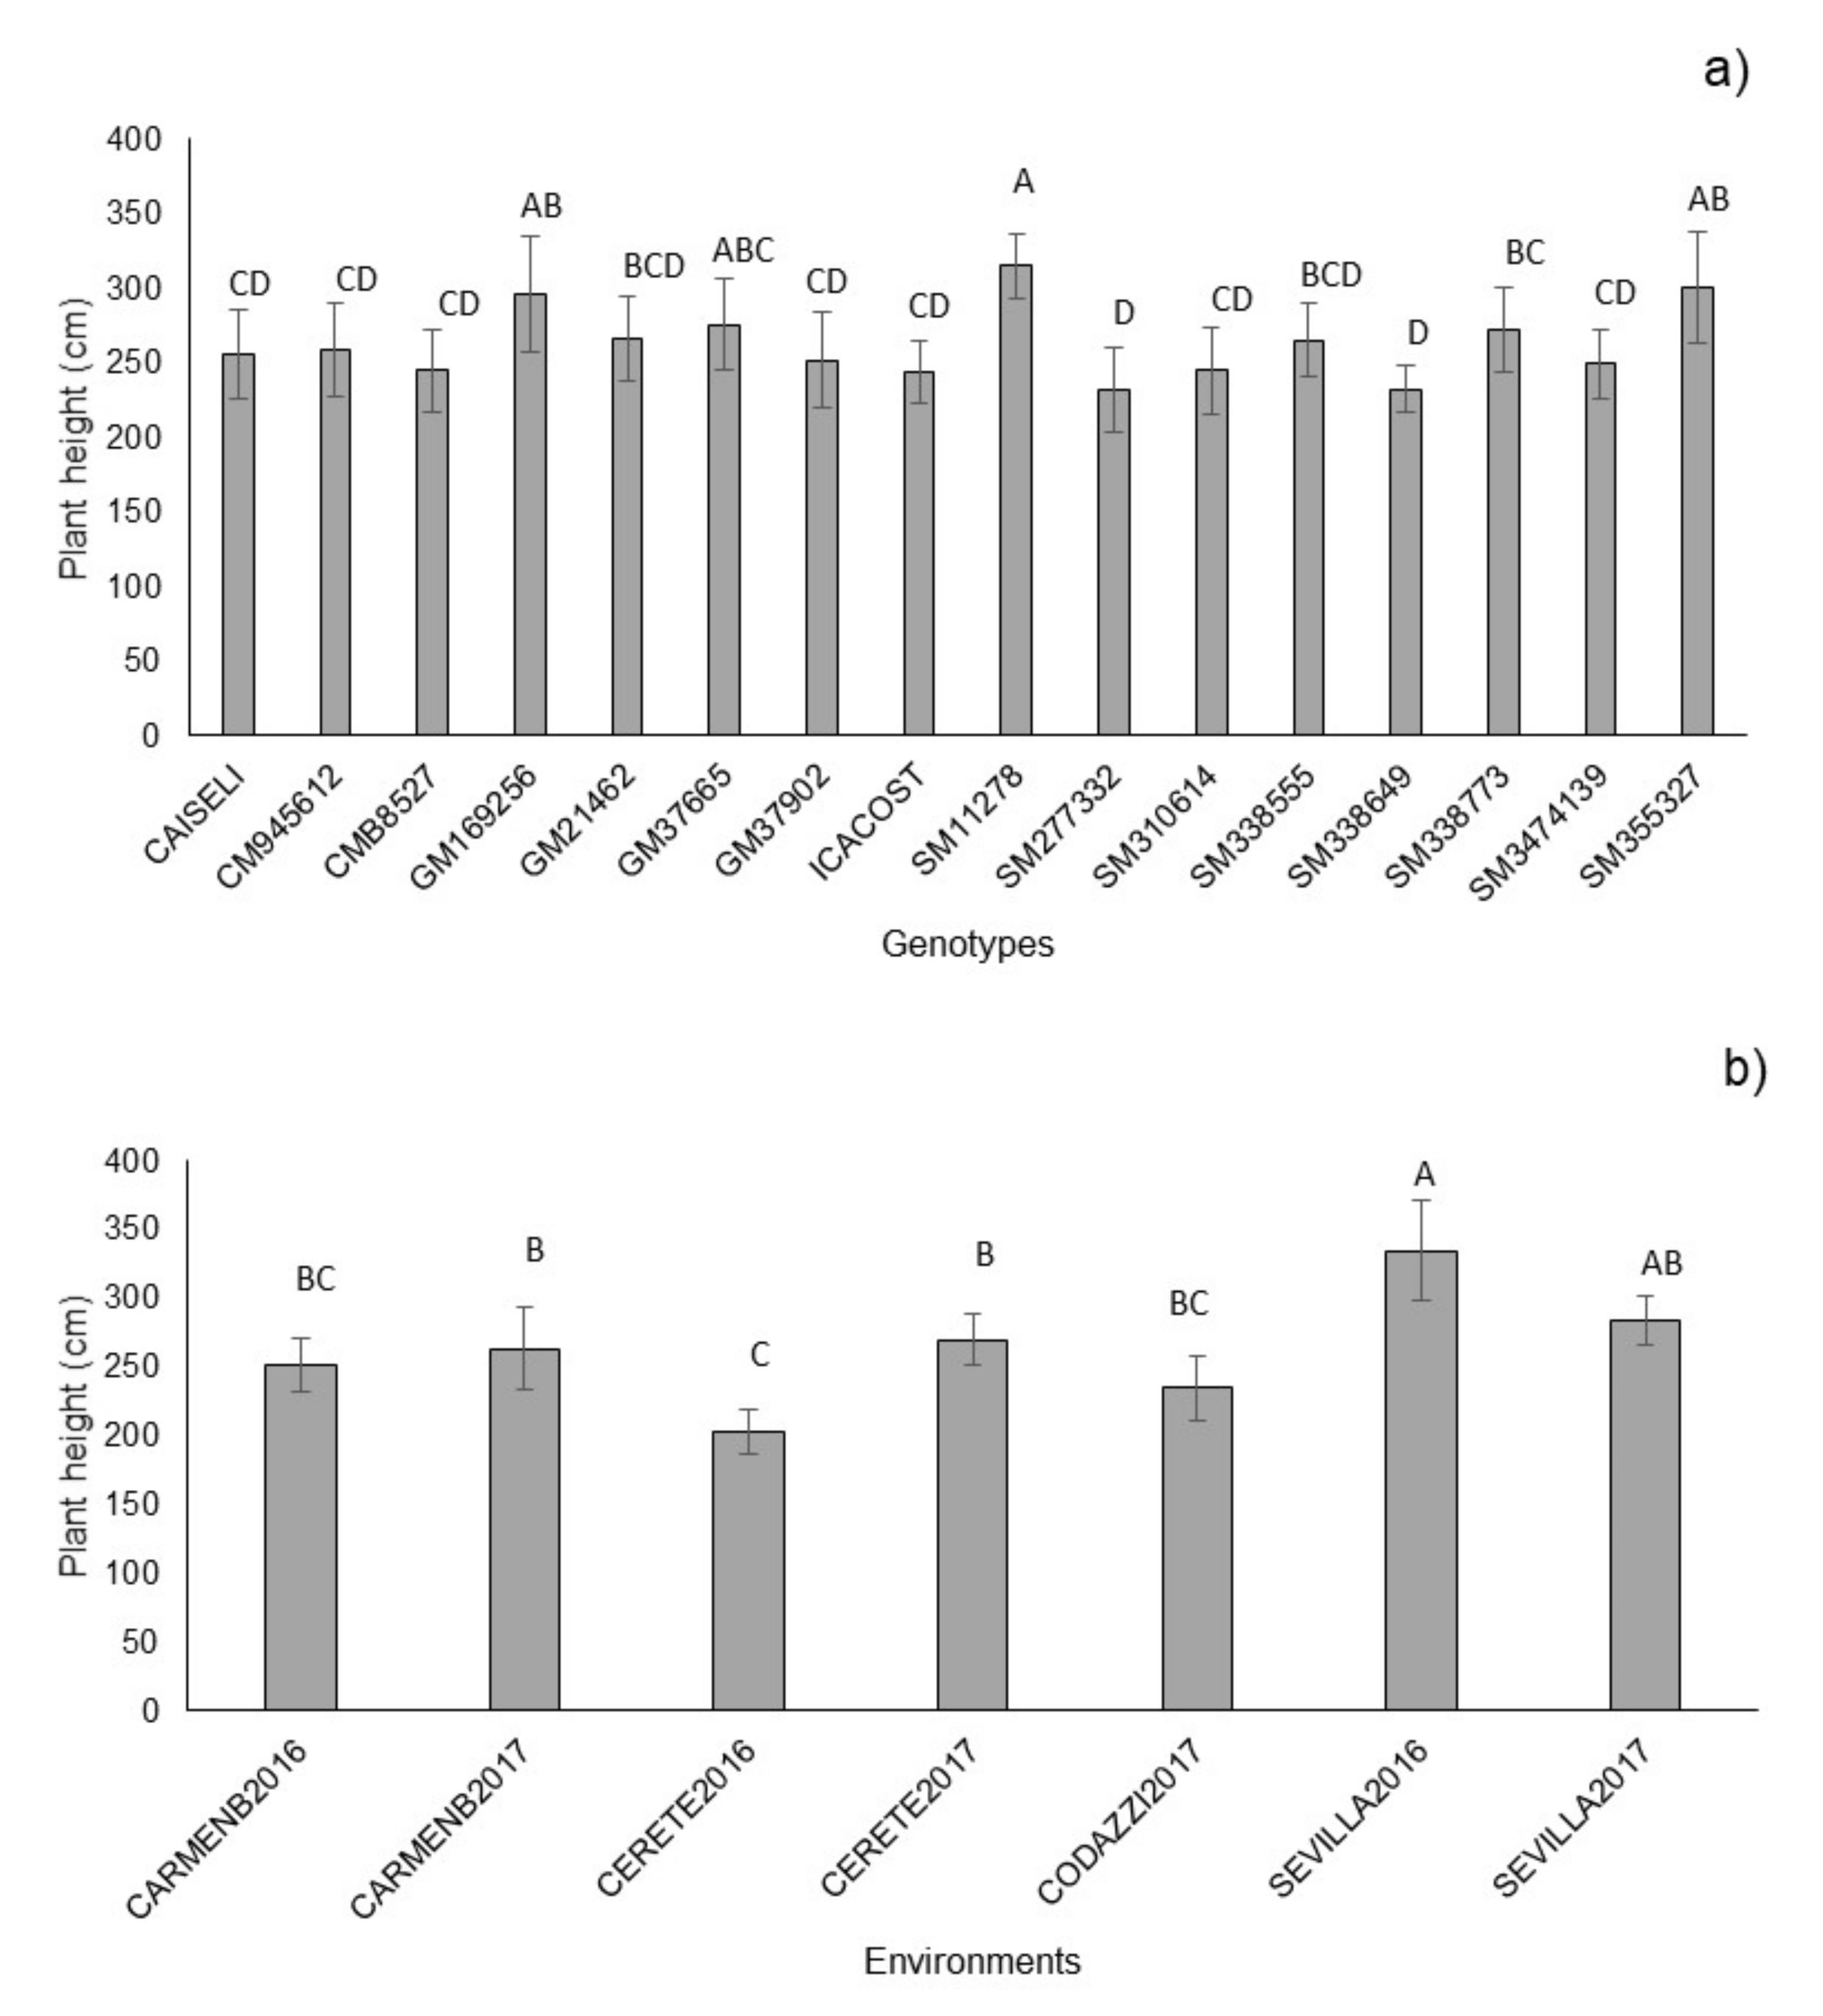
Most of the evaluated genotypes showed adequate sprouting (>80%), except SM1127-8, which exhibited a reduced sprouting. The environmental conditions at Sevilla and Carmen de Bolívar promoted higher sprouting, in comparison with Cereté and Codazzi. However, averages were not below 90%. Plant height was >200 cm in all genotypes (Figure 2a). Although this trait is not directly included in the selection index, it is an important component of PTS. Excessively high plants are undesirable due to increased vulnerability to lodging [27,28]. Interestingly, the tallest genotype (SM1127-8) showed the lowest sprouting, possibly since an excessive plant height increases lodging which, in turn, promotes early sprouting in pre-harvested plants. CM9456-12, CMB8527, GM3790-2, SM2773-32, SM3106-14, SM3386-49 and SM3474-139 showed plant heights comparable to commercial varieties (Corpoica-Caiseli and ICA-Costeña). The environmental conditions at Sevilla and Carmen de Bolívar promoted higher plant height, whereas in Codazzi, plants showed lower average height (Figure 2b).
The environment, genotype, and G × E interaction sources of variation were highly significant (p < 0.01) for total root yield (TRY), CFRY, and DMC (
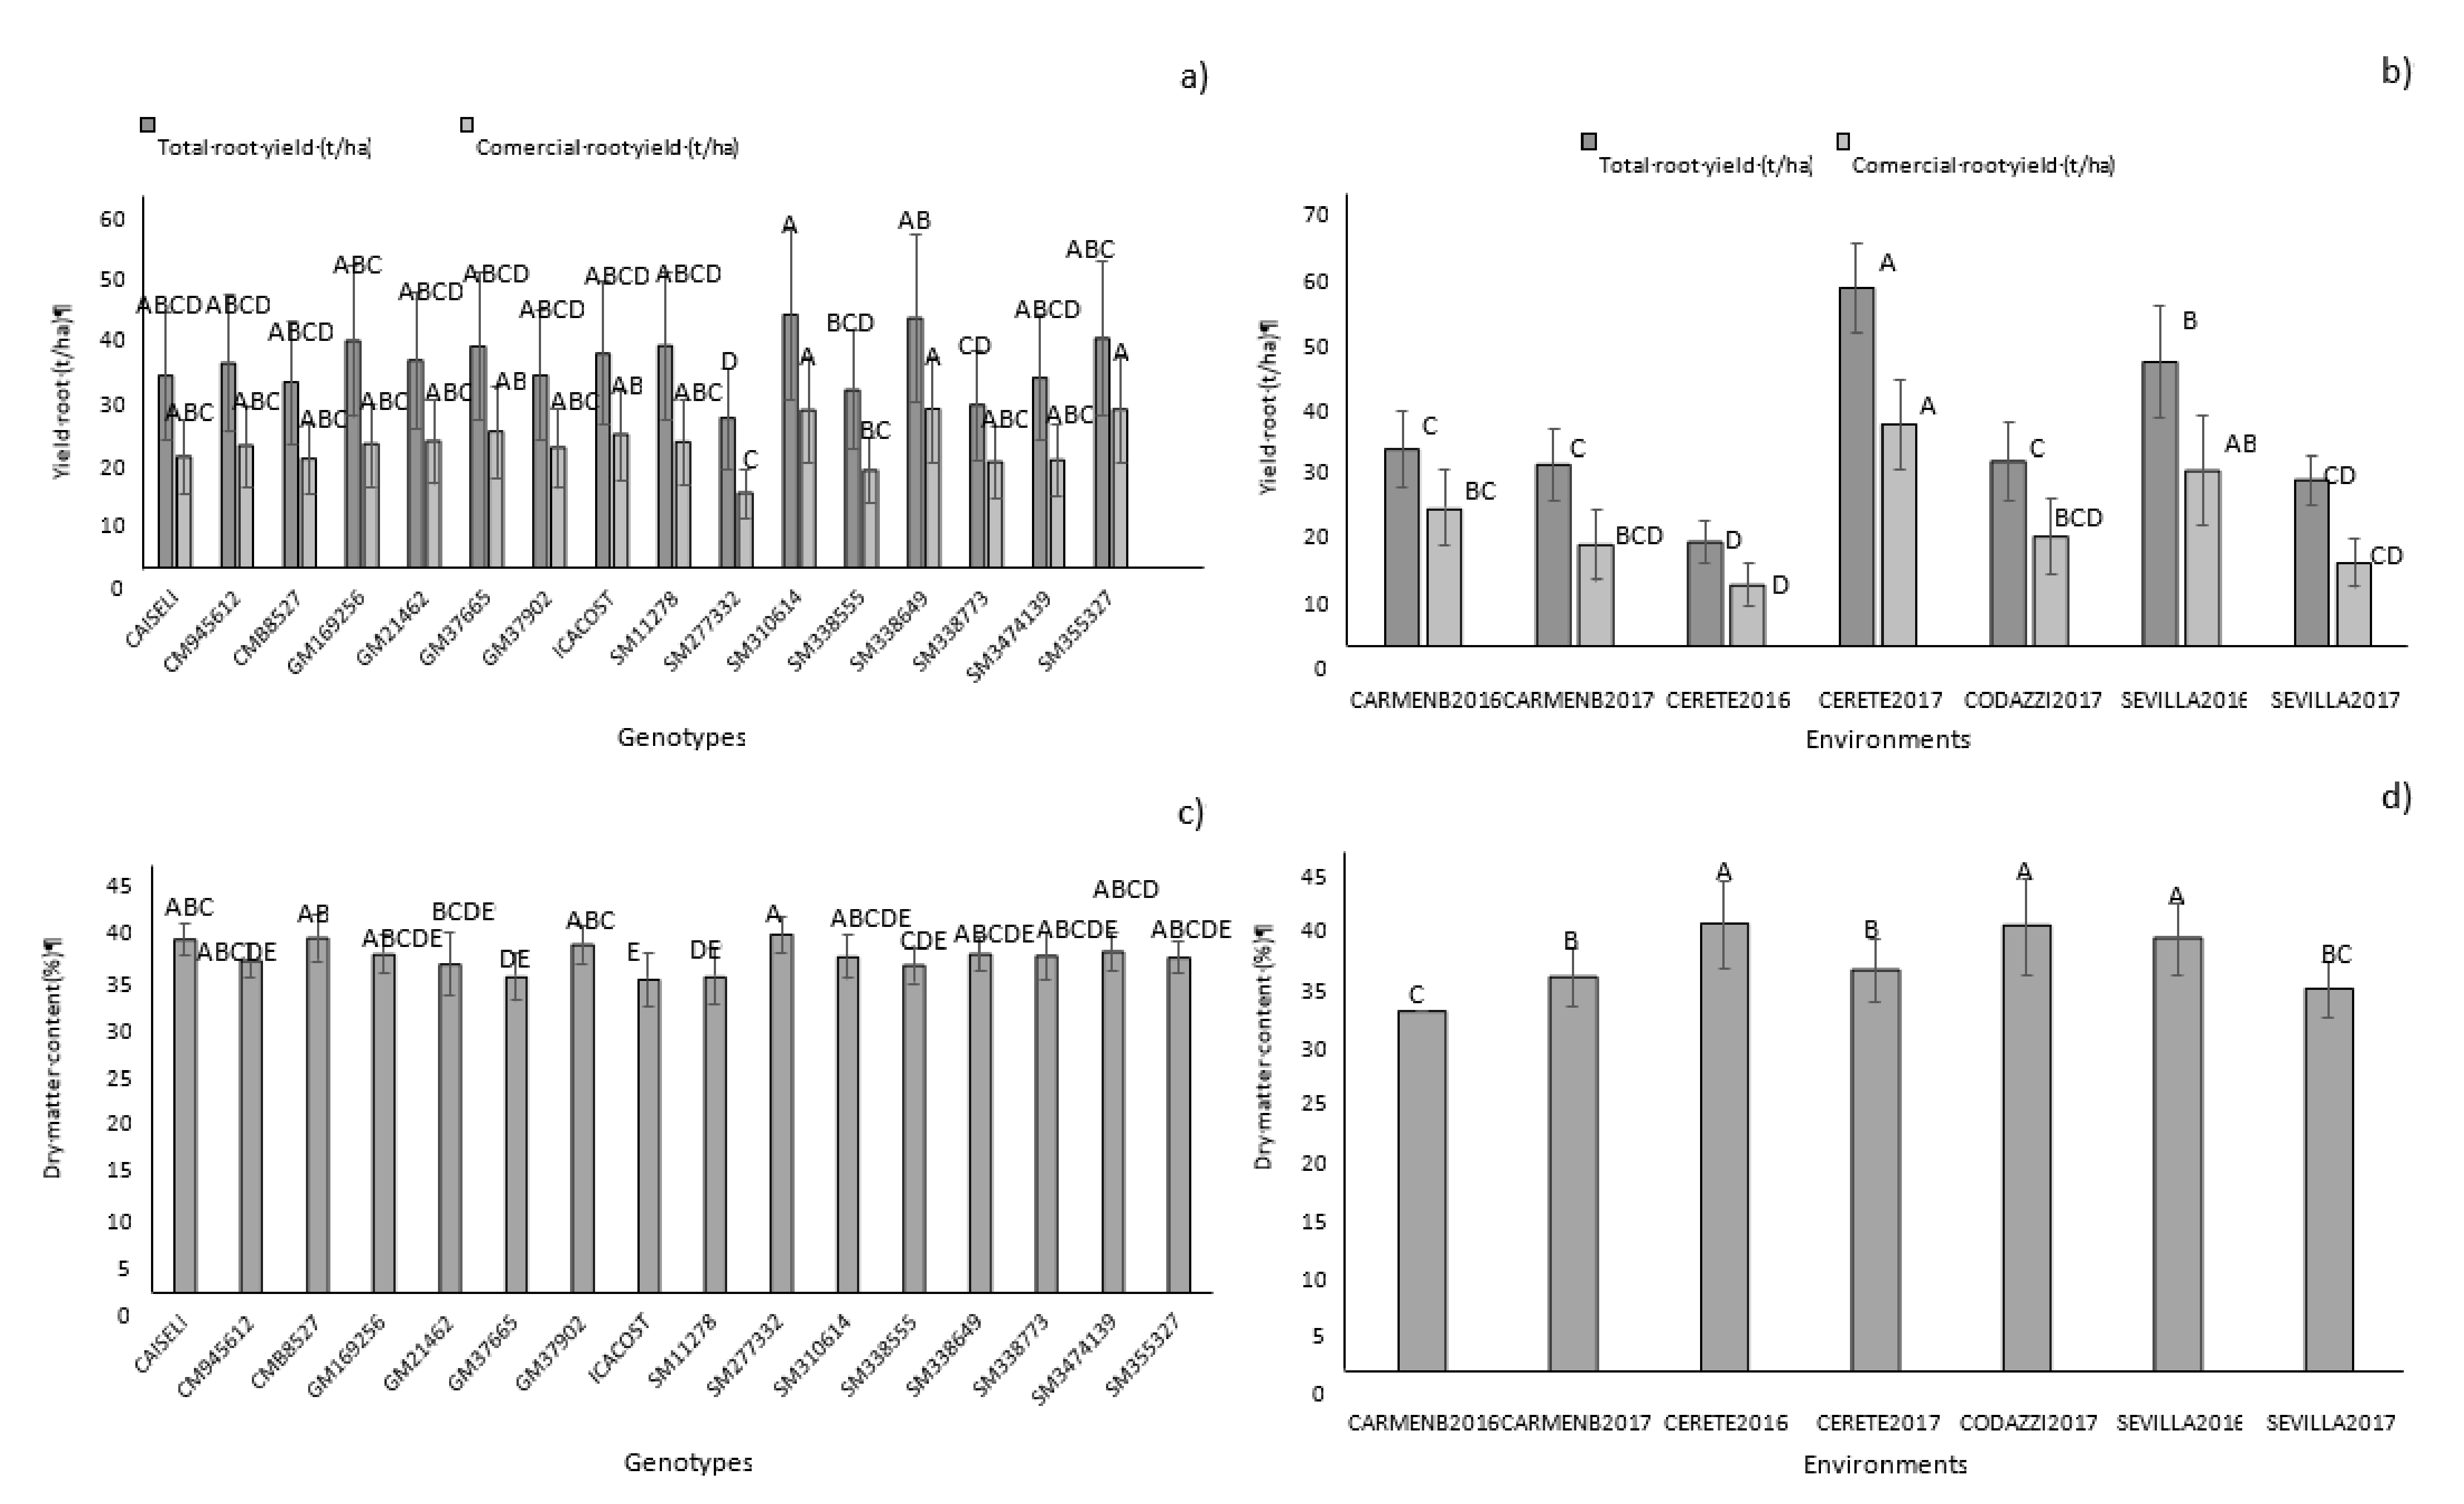
Table 3). The environmental effect (combination of location and season) had the highest contribution to the variance of the model. A significant proportion of the phenotypic expression of the genotypes, therefore, was influenced by the environmental conditions where they were evaluated. However, the significant effect of genotype on total variation was demonstrated. CM9456-12, GM1692-56, GM214-62, GM3766-5, SM1127-8, SM3106-14, SM3385-55, SM3386-49, and SM 3553-27 showed higher overall averages in total root yield (Figure 3a, Table 4). In terms of commercial yield, genotypes SM 3106-14, SM 3553-27, and SM 3386-49 stood out. Significant differences were found between locations (Table 3 and Table 4, Figure 3b). Cereté in the year 2017 showed the highest average for the total and commercial yield of 55.3 and 34.5 t/ha, respectively, followed by Sevilla 2016 (43.9 and 26.4 t/ha, respectively) and Carmen 2016 (30.5 and 21.3 t/ha, respectively).
Differences among crop cycles were found in Cereté and Sevilla (Table 4). Despite being a vegetative propagated crop, cassava shows high variation among plants stemming from the same clone cultivated in the same plot, which is mainly due to factors such as micro-environmental variation and lack of uniformity in the quality of planting material [29,30]. On average, rainfall in the localities mentioned above was higher than 1.000 mm per year (Table 1). Conditions of low water availability reduce yield especially in annual species [31,32]. The experimental clones evaluated had been previously selected for their adaptation to the Caribbean environmental conditions and their superiority in single row trials (SRT), followed by preliminary (PYT) and advanced (AYT) yield trials [33]. However, some of these genotypes showed average yields for total and commercial roots below the values found in the control genotypes. This illustrates the limitation of selection in early stages. It has been stated that genotypes need to stabilize their phenotypic responses, and this requires several cycles of growth under the target environmental conditions [33].
Environmental conditions affect the phenotypic expression of characteristics with low heritability. In this case, phenotypic features such as productive parameters (yield) and plant architecture (height) are affected by the environment, for which the appropriate selection of promising genotypes needs to be performed in multi-location evaluations and, preferably, through several growing seasons. In cassava, characteristics such as CFRY, DMC, and plant architecture are highly influenced by the genotype by environment interaction [19,33,34,35,36,37].
DMC averages across environments ranged between 25–40%, which were positive since the minimum established to carry out the selection of promising genotypes was 35.17%. In this sense, 64% of the evaluated genotypes stood out for showing high DMC averages (Figure 3c, Table 4). High and stable DMC is one of the objectives pursued by cassava breeding programs. Furthermore, varieties with mealy texture must have dry matter (and starch) content above 33–35%. Starch in fresh cassava roots represents around 85–90% of the DMC. Starch, after water, is the most abundant component in cassava roots [38]. For fresh consumption, the market requires materials with good culinary quality, low cyanogenic potential and high dry matter content [30,39]. However, the results showed significant environmental effects on DMC (p > 0.05) (Figure 3d, Table 3 and Table 4). Codazzi 2017 presented the highest overall average among environments. Environmental and cultural practices have strong influence on DMC in roots. For example, sprouting before harvest, drastically reduces DMC in roots [3]. DMC of each genotype in specific environmental conditions represent an expression of G × E interaction. Many studies have identified a differential adaptation for genotypes in diverse environmental conditions and significant G × E effects [32,40,41,42]. In those cases, a stability analysis must be performed to identify genotypes showing stable performance across seasons and locations.

3.2. Use of Selection Indices and Analysis of Phenotypic Stability to Identify Promising Genotypes

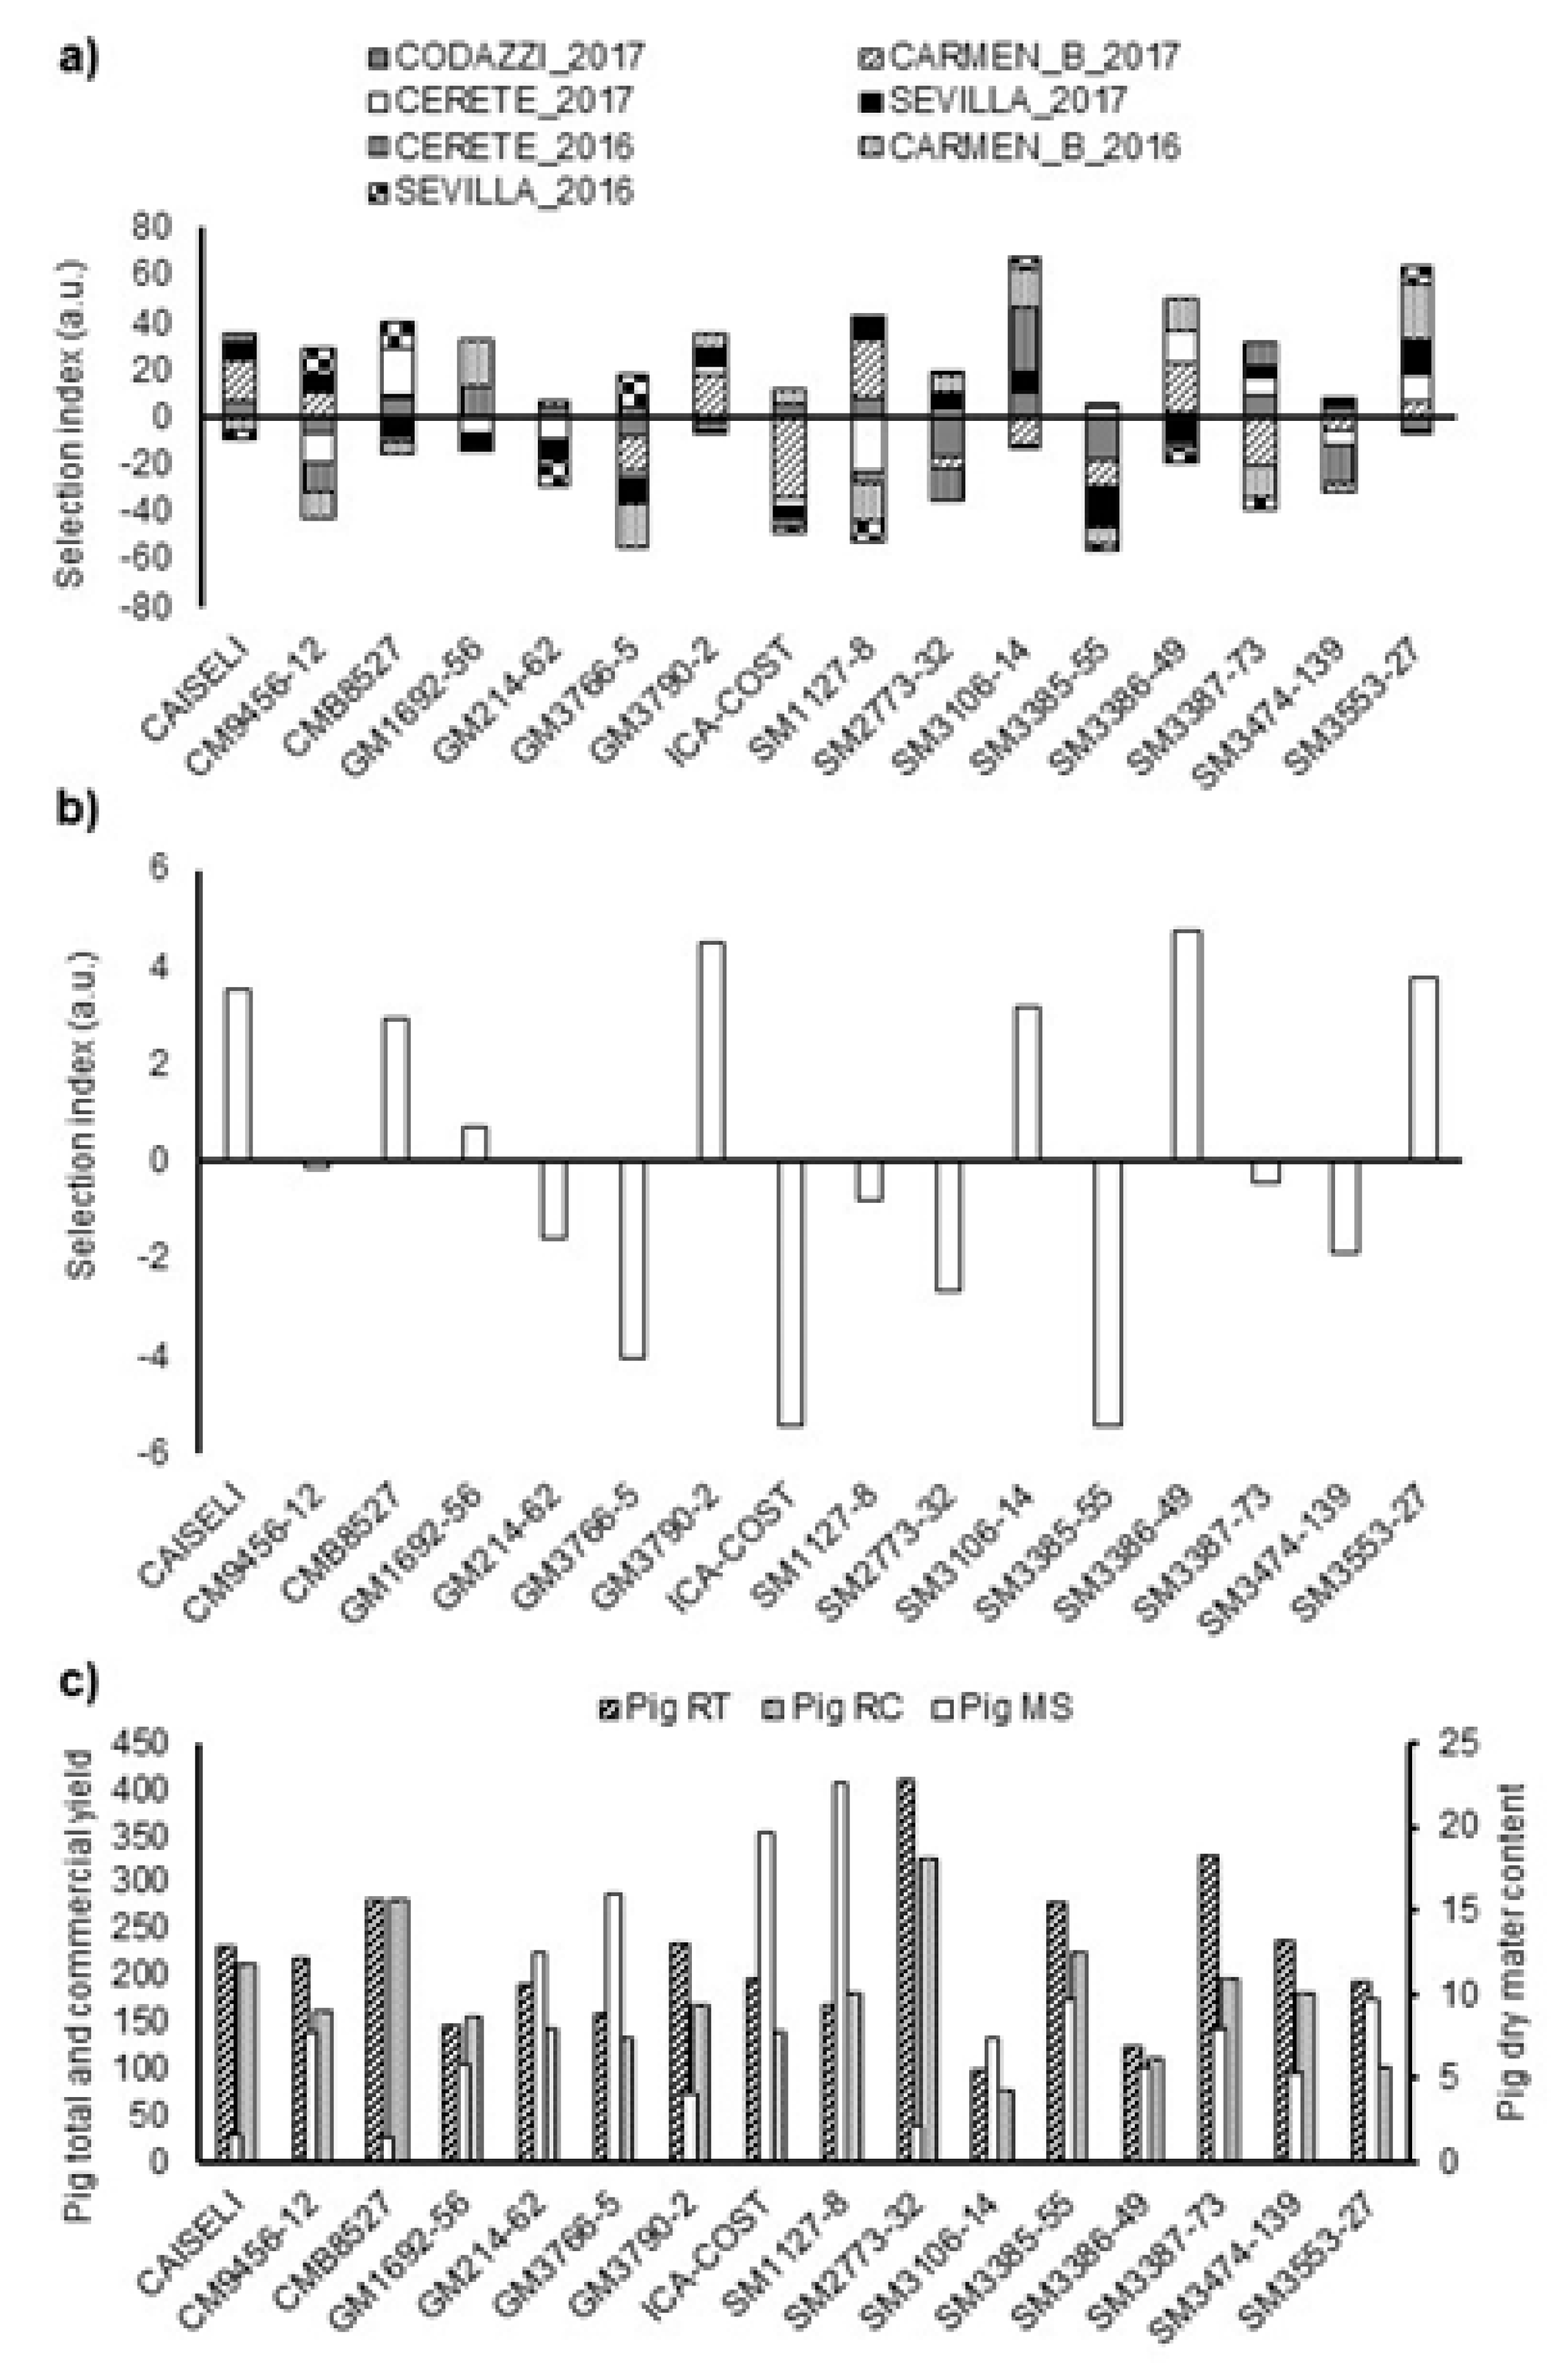
The multi-trait selection index (SIN) considered variables such as CRY, DMC and PTS as previously mentioned. SINs were obtained for both local (individual) and across-locations performances. The results of the analysis by environment (combination of location and season) showed that the genotypes CMB8527, GM1692-56, GM3790-2, SM3106-14, SM3386-49, and SM3553-27 had large positive SIN values in more than three different environments (Figure 4a. CM9456-12, SM1127-8 and SM3387-73 had desirable performances in at least three environments, but also negative SIN values (of similar magnitude) in at least three environments, indicating that these were genotypes with good adaptation only to particular environments. Finally, genotypes GM214-62, ICA-COSTEÑA, SM2773-32, SM3385-55, and SM3474-139 showed negative values in more than four environments (Figure 4a).
The analysis combined across locations showed that genotypes with positive SIN, as expected, had good agronomic performance in most environments. However, selecting genotypes based on average SIN across environments may not be adequate since performances of some genotype(s) in some environment(s) may result in undesirable biases. For example, SM 3386-49, SM 3553-27, SM 3106-14, and GM 3790-2 were the genotypes with positive average performances (Figure 4b, Table 5), which would indicate their superiority. However, some of those genotypes exhibited a negative performance in some environments, and the average hid this response. The average SIN, for example, may be strongly affected by unrealistically high yields in certain environments. It is important, therefore, to assess the stability and regularity of performance across environments. This is ultimately what defines an outstanding variety and defines if farmers will adopt a variety or not.
The general performance of the genotypes, according to the [9] index, is defined as the mean square of the distance between the average value of the cultivar and the maximum average response for all locations. Genotypes with lower index values correspond to those with higher phenotypic stability. The most stable genotypes obtained through this analysis mostly coincide with the genotypes considered as stable according to the AMMI analysis [43]. Although Lin and Binns index is useful for the stability analysis, it can be affected by atypical data, and result in selecting genotypes that adapt very well to a particular environment(s). That is, genotypes SM3386-49, SM3106-14, GM1692-56, and CAISELI were selected for their total root yield (TRY), genotypes CAISELI, SM2773-32, SM3474-139, and GM214-62 for their CRY, and genotypes SM3386-49, SM3553-27, SM3106-14, and CAISELI for their DMC in almost all the environments (Figure 4c and Table 5).
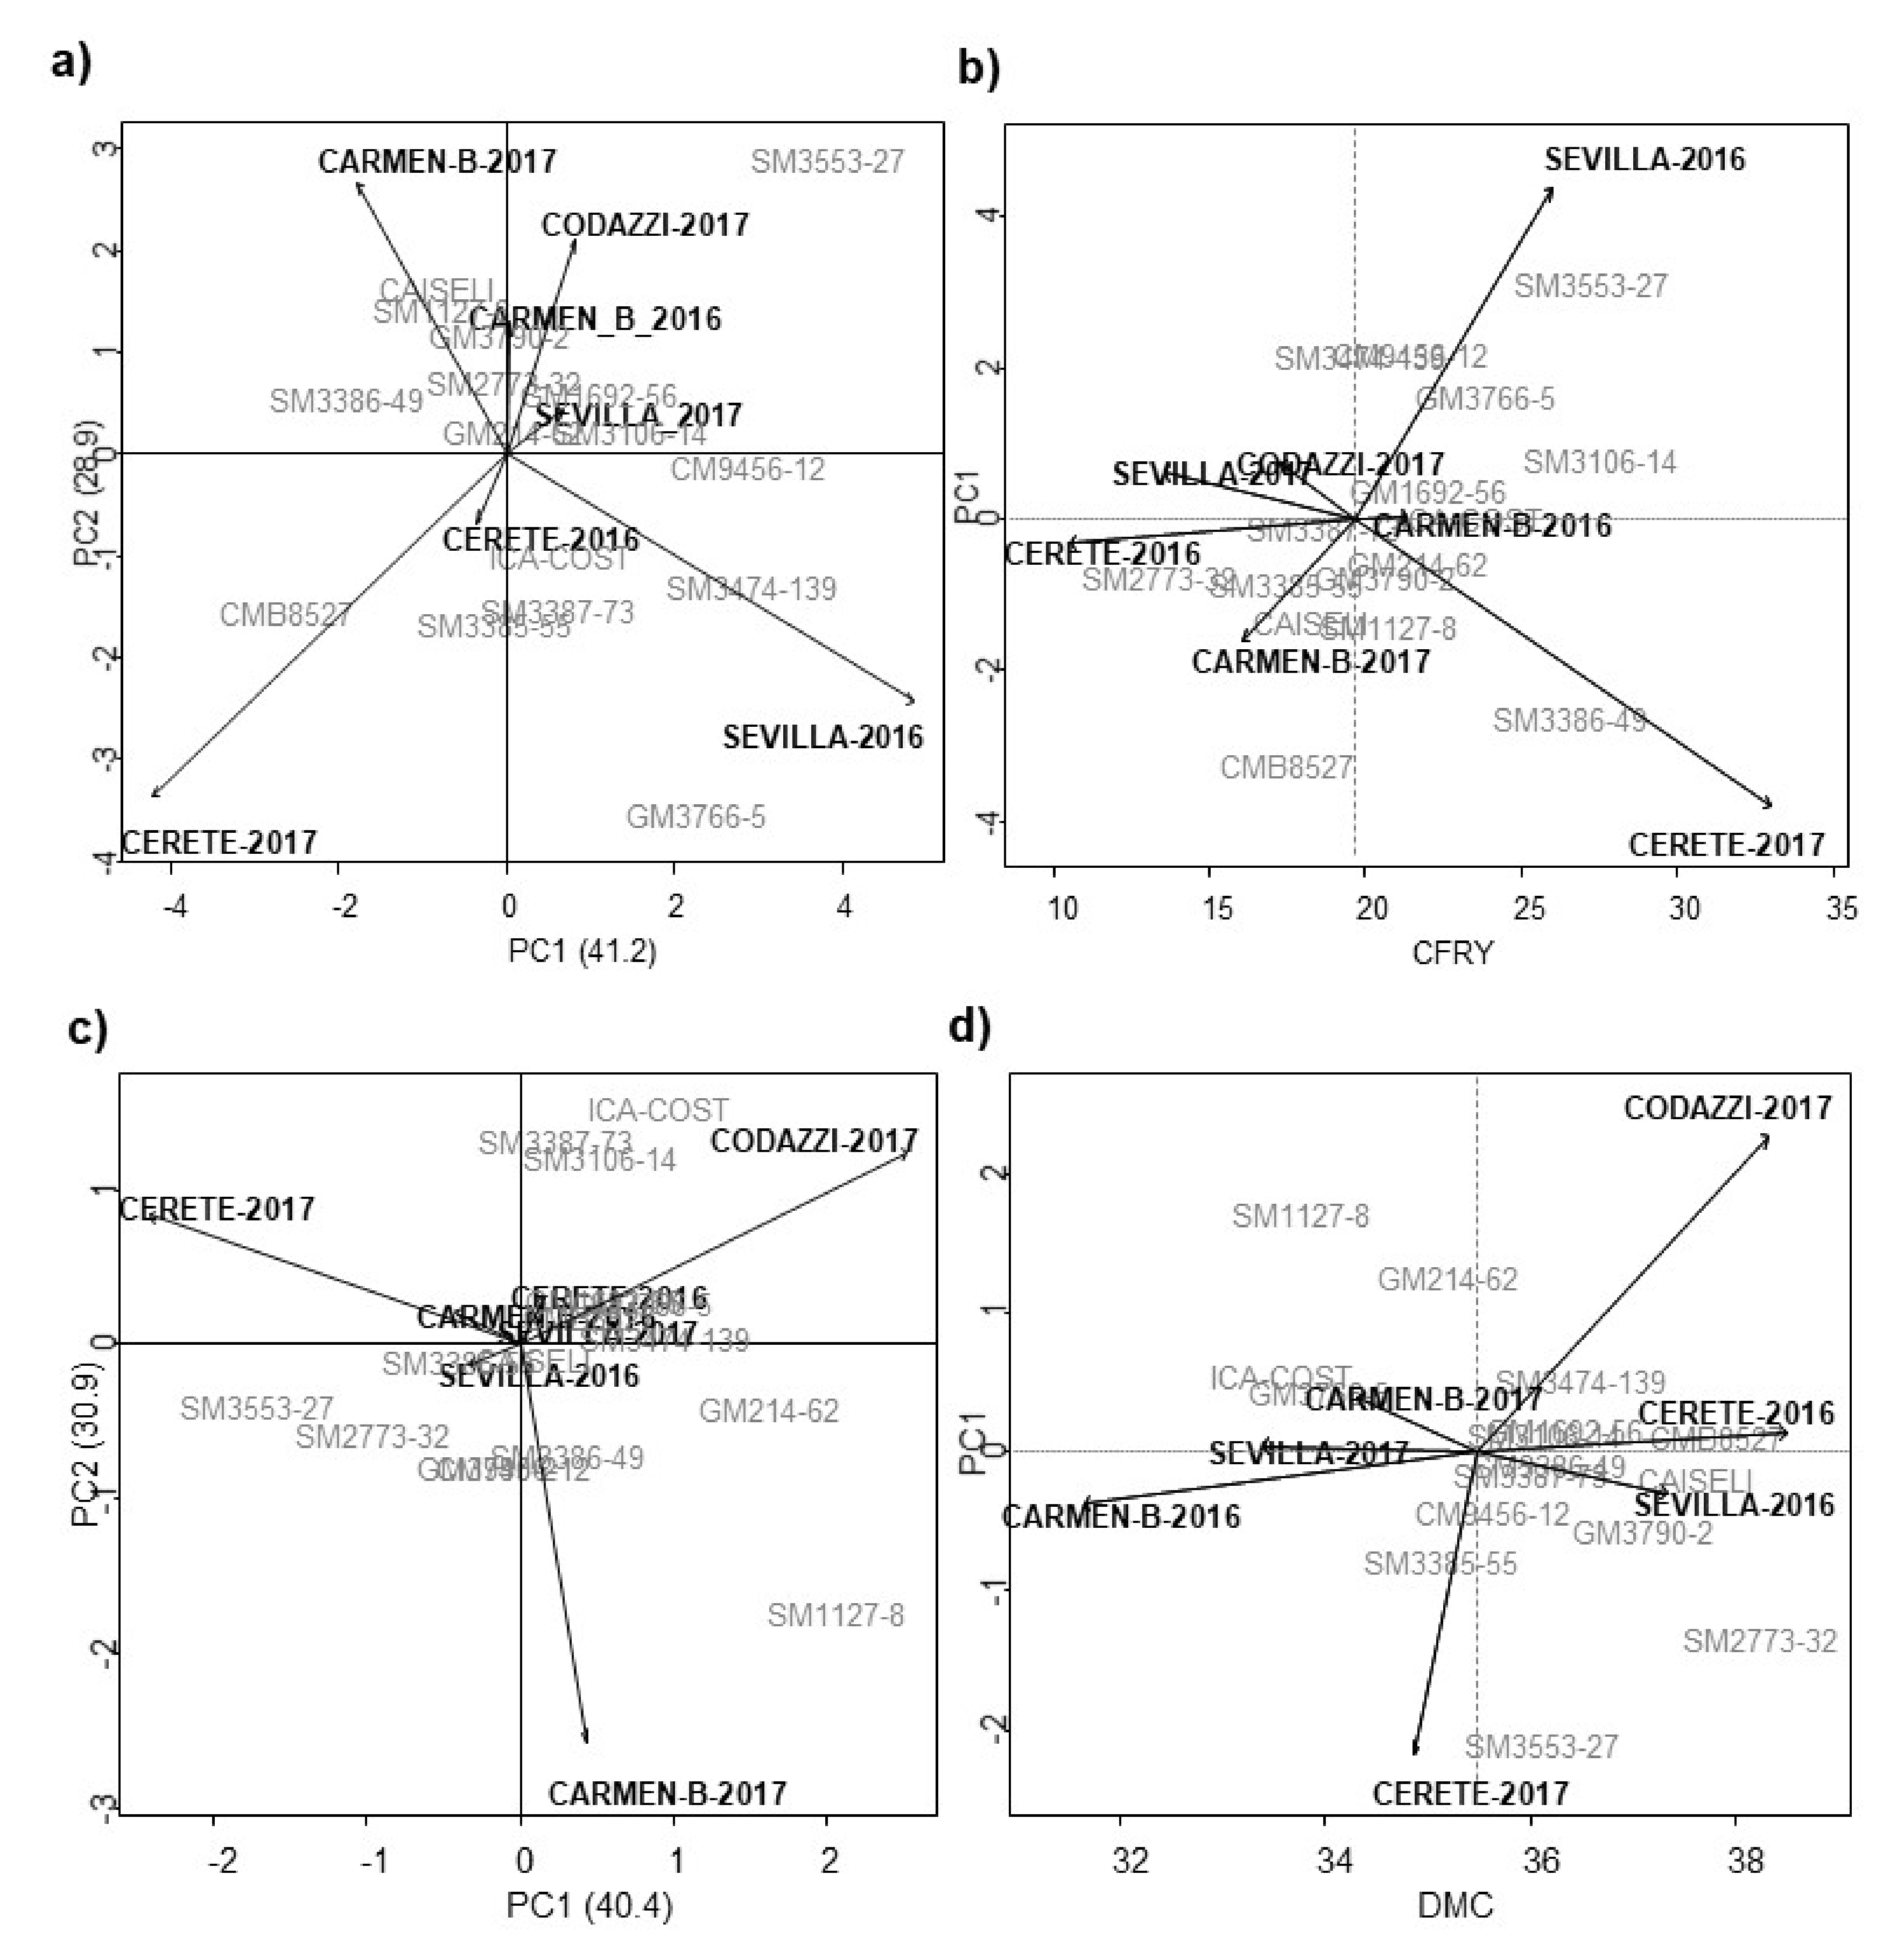
The analysis of variance quantified the effects attributable to the genotypes (G), environment (E), and their interaction (G×E) on the expression of CRY and DMC (Table 6). The AMMI analysis, showed that the first component explained 65.8 and 65% of the variance contained in the G × E interaction for CRY and DMC, while the second component explained 28.9 and 30.9% of them, respectively. Therefore, the selection of a single multiplicative term of the AMMI model was sufficient to explain a large proportion of the relevant data [44]. The AMMI biplot obtained from the main genotypes and environments effects, the general mean and the first multiplicative term of the AMMI model (PC1) for CRY and DMC is shown in Figure 5. Figure 5a shows that 70% of the sum of squares of the G × E interaction for TRY was decomposed into two main components (PC1 and PC2). The genotypes closest to the origin point were those with little contribution to the interaction effects and, therefore, can be considered more stable. Genotypes GM214-62, SM3106-14, and GM1692-56 were stable. Meanwhile, SM3474-139 and CM9456-12 were located close to the Sevilla environment during 2016 and 2017, SM3387-73, SM3385-55, and CM85-27 showed an interaction with the environment in Cereté during 2016 and 2017, and genotypes SM1127-8 and GM3790-2 in Carmen de Bolívar during 2016. SM3553-27 and GM3766-5 showed the lower stability and high interaction with the environmental conditions found in Codazzi-2017 and Sevilla-2016, respectively (Figure 5b). Comparing the averaged CRY and PC1), the genotypes GM1692-56, GM214-62, SM3106-14, SM3553-27, and SM3386-49 showed a CRY up to 20 tn/ha and they were closest to the origin point of PC1. The last two genotypes were outstanding for yield variables, and had a higher selection index and were more stable according to Lin and Binns (Figure 5c).
In terms of DMC, GM3790-2, SM2773-32 and CMB8527 showed values above 35% and comparable with the best commercial control, Caiseli (Figure 5d); the last two genotypes were also the most stable according to the Lin and Binns index. Cereté-2016, Codazzi-2017, and Sevilla-2016 showed the highest DMC values for most of the genotypes (Figure 5c).
Several authors have reported significant interactions between the environment and cassava cultivars [45,46], representing an opportunity to identify the best discriminating environments and select stable genotypes in different environmental conditions [47,48]. Alternatively, it may be desirable to select clones adapted to specific environments [49]. AMMI allows an adequate selection of stable genotypes across environments as well as genotypes adapted to specific environments [12,13,14,41,42,50]. The AMMI analysis allows a straightforward interpretation of the results using biplot graphics. According to [12], the AMMI tool is powerful to improve the precision of the genotype by environment interaction. It allows eliminating the error of the estimators of phenotypic stability parameters generated by the effect of some environments in particular genotypes.
Ref. [51] pointed out that those treatments that exhibit an angle close to 90° are not related to each other, and those that have an angle close to 180° tend to have an opposite behavior, as was the case between the four locations assessed. These were very different from each other, and seven macro environments for the locations of El Carmen de Bolívar, Cereté, Agustín Codazzi, and Sevilla were generated during 2 years (except for Codazzi). Genotypes and environments with high coordinates on PC1 considered in absolute value, contributed more to the G × E interaction. Meanwhile, genotypes and environments with PC1 close to zero had little participation in this effect [52].
The correlation coefficient between genotypes, environments or the genotype by environment interaction is given approximately by the cosine of the angle formed between the vectors. Thus, if the angle between the vectors is 180° the correlation coefficient is −1, if the angle is 0° the coefficient is +1, and if it is 90° the coefficient is 0. However, the AMMI analysis does not provide a quantitative measure of stability. For this reason, Ref. [53] proposed an average stability value (ASV) measure to quantify and classify genotypes according to their yield stability in that ASV is the distance of the varieties from point zero of the scatter diagram (PC1 vs. PC2). The genotypes with the lower scores were more stable (Table 7). According to the ranking using several indexes, SM214-64, GM1692-56, SM2773-32, CM9456-12 and SM3106-14 resulted in the best ASV values. Genotypes that were previously selected as superior, SM3553-27, GM3766-5 and SM3386-49, showed lower ASV values, suggesting lower stability. However, the selection of promising genotypes should consider both their superiority and stability. Therefore, SM3106-14, GM1692-56, CM9456-12 and GM214-62 were recommended for the next evaluation cycle.

3.3. Cooking and Sensory Properties in Selected Genotypes

HCN differs widely in cassava. Non-bitter roots usually have a cyanogenic glucoside concentration < 100 mg HCN equivalents/kg fresh [54,55]. All varieties (except Tai 8) can be considered non bitter. SM3474-139, GM3766-5, and SM2773-32 HCN contents close to 100 mg/kg, and the rest showed lower concentration values. Genotypes such as CMB8527, GM3790-2, SM1127-8, SM3385-55, and SM3553-27 showed the HCN content <50 mg/kg, as did the checks Venezolana and Caiseli.
The cooking time for most of the evaluated genotypes was in the range of 20–30 min, however, genotypes such as GM1692-56, GM3766-5, GM3790-2, SM3387-73, SM3553-27, and SM3562-32 showed an extended and undesirable cooking period (Table 8).
Sensorial description of cassava genotypes from untrained panelists aided to improve the selection of promising genotypes, hedonic scale was used to qualify parameters such color, flavor, texture, and root shape (Table 9). Frequency analysis of sensorial data showed that CM9456-12, SM1127-8, SM3553-27, and SM3562-32 were preferred by panelists, their color, flavor, texture, and root shape seemed to be superior to commercial varieties. Although, previous reports showed that varieties with mealy texture contain higher contents of dry matter and starch contents. Although larger starch granules were observed in mealy varieties than those of non-mealy varieties [56], the factors related to flavor and texture remain still poorly understood.
The inclusion of palatability response and quality features determination in cassava genotypes allowed identifying genotypes with higher opportunity to be adopted by farmers as new cassava varieties.

4. Conclusions

Environmental conditions influenced the expression of several phenotypic (polygenic) traits related to root yield, plant architecture, and dry matter content in the evaluated genotypes.
The use of local and multi-location and multi-trait selection indexes allowed the identification of superior genotypes with a stable performance, which can be released as new varieties. Moreover, phenotypic stability determination through the Lin and Binns index, ASV measurement, and AMMI model supported an adequate selection of superior and stable cassava genotypes.
The inclusion of palatability response and quality features provides crucial information regarding the acceptability of the roots from the consumer’s point-of-view. Therefore, it should be considered as a participative selection process that ensures a major adoption of new cassava varieties.
The genotypes CM9456-12 and SM3553-27 exhibited promissory agronomic performance and good acceptance by consumers, with yields higher than the national average, good culinary quality, and adapted to the Caribbean Region.

Author Contributions

Conceptualization, R.L., A.R., and H.C.; methodology, all authors; formal analysis, R.L., A.R. and H.C.; investigation, all authors; writing—review and editing, all authors; supervision, A.R. and R.L. All authors have read and agreed to the published version of the manuscript.

Funding

This research was funded by “Ministerio de Agricultura y Desarrollo Rural-MADR” by TV15-16 agreements.

Acknowledgments

The authors would like to thank Jorge Iván Lenis for all his support in the propagation of the material used in this work. Many thanks to CIAT for providing the plant material used in this research and to Agrosavia who funded the research under the project entitled “Cassava varieties for fresh consumption, and for the balanced feed industry and starch production”.

Conflicts of Interest

The authors declare no conflict of interest.

References

  1. Adjebeng-Danquah, J.; Manu-Aduening, J.; Gracen, V.E.; Asante, I.K.; Offei, S.K. AMMI Stability Analysis and Estimation of Genetic Parameters for Growth and Yield Components in Cassava in the Forest and Guinea Savannah Ecologies of Ghana. Int. J. Agron. 2017, 2017, 8075846. [Google Scholar] [CrossRef]
  2. Adugna, W.; Labuschagne, T. Clone-environment interactions and phenotypic stability analyses of Linseed in Ethiopia. Plant Breed. 2002, 121, 66–71. [Google Scholar] [CrossRef]
  3. Aina, O.O.; Dixon, A.G.O.; Ilona, P.; Akinrinde, E. G × E interaction effects on yield and yield components in the Savanna region of Nigeria. Afr. J. Biotechnol. 2009, 8, 4933–4945. [Google Scholar]
  4. Akinwale, M.G.; Alinyele, B.O.; Odiyi, A.C.; Dixon, A.G.O. Genotype × Environmnet interaction and yield performance of 43 improved cassava (Manihot esculenta Crantz) genotypes at three Agro-Climatic zones in Nigeria. Br. Biotechnol. J. 2011, 3, 68–84. [Google Scholar] [CrossRef]
  5. Allard, R.W.; Bradshaw, A.D. Implicaciones de las interacciones genotipo-ambientales en el fitomejoramiento aplicado. Crop Sci. 1964, 4, 503–508. [Google Scholar] [CrossRef] [Green Version]
  6. Aristizábal, J.; Sánchez, T. Guía Técnica Para la Producción y Análisis de Almidón de Yuca; Boletín 163 de Servicios Agrícolas de la Organización de las Naciones Unidas para la Agricultura y la Alimentación; FAO: Roma, Italy, 2007. [Google Scholar]
  7. Atlin, G.N.; Cairns, J.E.; Das, B. Rapid breeding and varietal replacement are critical to adaptation of cropping systems in the developing world to climate change. Glob. Food Secur. 2017, 12, 31–37. [Google Scholar] [CrossRef] [PubMed]
  8. Barros, M.A.; Rocha, M.D.M.; Gomes, R.L.F.; Silva, E.K.J.D.; Das Neves, A.C. Adaptabilidade e estabilidade produtiva de feijão-caupi de porte semiprostrado. Pesqui. Agropecuária Bras. 2013, 48, 403–410. [Google Scholar] [CrossRef] [Green Version]
  9. Benakanahalli, N.; Sridhara, S.; Ramesh, N.; Olivoto, T.; Sreekantappa, G.; Tamam, N.; Abdelbacki, A.; Elansary, H.; Abdelmohsen, S. A Framework for Identification of Stable Genotypes Basedon MTSI and MGDII Indexes: An Example in Guar (Cymopsis tetragonoloba L.). Agronomy 2021, 11, 1221. [Google Scholar] [CrossRef]
  10. Boakye, B.; Kwadwo, O.; Asante, I.; Parkes, E.Y. Performance of nine cassava (Manihot esculanta Crantz) clones across three environments. J. Plant Breed. Crop Sci. 2013, 5, 48–53. [Google Scholar] [CrossRef] [Green Version]
  11. Bright, P.; Kwadwo, O.; Asante, I.; Yaa, E. Performance of nine cassava (Manihot esculenta Crantz) clones across three envi-ronments. Afr. J. Soil Sci. 2015, 3, 110–114. [Google Scholar]
  12. Ceballos, H.; Fregene, M.; Pérez, J.; Morante, N.; Calle, F. Cassava Genetic Improvement. In Breeding Major Food Staples; Kang, M.S., Priyadarshan, P., Eds.; Blackwell Publishing: Hoboken, NJ, USA, 2007; pp. 365–391. [Google Scholar]
  13. Ceballos, H.; Perez, J.C.; Barandica, O.J.; Lenis, J.I.; Morante, N.; Calle, F.; Pino, L.; Hershey, C.H. Cassava Breeding I: The Value of Breeding Value. Front. Plant Sci. 2016, 7, 1227. [Google Scholar] [CrossRef] [Green Version]
  14. De Mendiburu, F. Agricolae: Statistical Procedures for Agricultural Research, R Package Version 1,2-8. 2017. Available online: https://CRAN.R-project.org/package=agricolae (accessed on 10 January 2019).
  15. Essers, S.A.J.A.; Bosveld, M.; Der Van Grift, R.M.; Voragen, A.G.J. Studies on the quantification of specific cyanogens in cassava products and introduction of a new chromogen. J. Sci. Food Agric. 1993, 63, 287–296. [Google Scholar] [CrossRef]
  16. Eberhart, S.A.; Russel, W.A. Parámetros de estabilidad para comparar variedades. Crop Sci. 1966, 6, 36–40. [Google Scholar] [CrossRef] [Green Version]
  17. Food and Agriculture Organization of the United Nations (FAO). Transforming Our World: The 2030 Agenda for Sustainable Development. Available online: http://www.fao.org/ (accessed on 20 January 2021).
  18. Gauch, H.G. Statistical Analysis of Yield Trials by AMMI and GGE. Crop Sci. 2006, 46, 1488–1500. [Google Scholar] [CrossRef]
  19. Gauch, H.G.; Zobel, W. Análisis de Ammi de ensayos de rendimiento. In Genotipo por Interacción de Ambiente; Kang, M.S., Gauch, H.G., Eds.; Prensa CRC: Boca Raton, FL, USA, 1996; pp. 85–122. [Google Scholar]
  20. Gonçalves, J.G.R.; Chiorato, A.F.; De Morais, L.K.; Perina, E.F.; Farias, F.L.; Carbonell, S.A.M. Estudo da estabilidade fenotípica de feijoeiro com grãos especiais. Ciência e Agrotecnologia 2010, 34, 922–931. [Google Scholar] [CrossRef] [Green Version]
  21. Gonçalves, J.G.R.; Chiorato, A.F.; Perina, E.F.; Carbonell, S.A.M. Estabilidade fenotípica em feijoeiro estimada por análise ammi com genótipo suplementar. Bragantia 2009, 68, 863–871. [Google Scholar] [CrossRef]
  22. Gomes, M.C.M.; Menezes, W.M.M.; Santos, D.L. Adaptabilidade e estabilidade de cultivares de mandioca via regressão bissegmentada e multivariada. Bol. Pesqui. Embrapa Tabul. Costeiros. 2013, 78, 1–20. [Google Scholar]
  23. Holm, J.; Björck, I.; Drews, A.; Asp, N.-G. A Rapid Method for the Analysis of Starch. Starch-Stärke 1986, 38, 224–226. [Google Scholar] [CrossRef]
  24. Barandica, O.J.; Pérez, J.C.; Lenis, J.I.; Calle, F.; Morante, N.; Pino, L.; Hershey, C.H.; Ceballos, H. Cassava Breeding II: Phenotypic Correlations through the Different Stages of Selection. Front. Plant. Sci. 2016, 7. [Google Scholar] [CrossRef] [PubMed] [Green Version]
  25. Kvitschal, M.; Filho, P.V.; Scapim, C.; Gonçalves-Vidigal, M.; Pequeno, M.; Sagrilo, E.; Rimoldi, F. Evaluation of phenotypic stability of cassava clones by AMMI analysis in northwestern Paraná state. Crop Breed. Appl. Biotechnol. 2006, 6, 236–241. [Google Scholar] [CrossRef]
  26. Kawano, K.; Fukuda, W.M.G.; Cenpukdee, U. Genetic and Environmental Effects on Dry Matter Content of Cassava Root 1. Crop Sci. 1987, 27, 69–74. [Google Scholar] [CrossRef]
  27. Lahai, T.; Ekanayake, I.J.; Koroma, J.P.C. Influence of canopy structure on yield of cassava cultivars at various toposequences of an inland valley agro ecosystem. J. Agric. Biotechnol. Sustain. Dev. 2013, 5, 36–47. [Google Scholar] [CrossRef] [Green Version]
  28. Leon, R.; Pérez, M.; Fuenmayor, F.; Rodríguez, A.; Rodríguez, G.; Marín, C. Calidad de las raíces en cuatro clones de yuca (Manihot esculenta crantz) y efecto del régimen de riego. Bioagro. 2018, 30, 87–91. [Google Scholar]
  29. Lin, C.S.; Binns, M.R. A method of analyzing cultivar x location x year experiments: A new stability parameter. Theor. Appl. Genet. 1988, 76, 425–430. [Google Scholar] [CrossRef] [PubMed]
  30. Marín, C.; Vicente, F.S.; Segovia, S. Métodos recientes para el análisis de la interacción genotipo-ambiente en prue-bas regionales de cultivares de maíz (Zea mays L.). VI Jorn. Científica Maíz. Maracay (Venezuela) Fasc. 2004, 1, 6. [Google Scholar]
  31. Maroya, N.G.; Kulakow, P.; Dixon, A.G.O.; Maziya-Dixon, B.B. Genotype × Environment Interaction of Mosaic Disease, Root Yields and Total Carotene Concentration of Yellow-Fleshed Cassava in Nigeria. Int. J. Agron. 2012, 2012, 1–8. [Google Scholar] [CrossRef] [Green Version]
  32. Missanjo, E.; Matsumura, J. Multiple Trait Selection Index for Simultaneous Improvement of Wood Properties and Growth Traits in Pinus kesiya Royle ex Gordon in Malawi. Forests 2017, 8, 96. [Google Scholar] [CrossRef] [Green Version]
  33. Montagnac, J.A.; Davis, C.R.; Tanumihardjo, S.A. Processing Techniques to Reduce Toxicity and Antinutrients of Cassava for Use as a Staple Food. Compr. Rev. Food Sci. Food Saf. 2008, 8, 17–27. [Google Scholar] [CrossRef]
  34. De Morais, L.K.; Moura, M.F.; Vencovsky, R.; Pinheiro, J.B. Adaptabilidade e estabilidade fenotípica em soja avaliada pelo método de Toler. Bragantia 2008, 67, 275–284. [Google Scholar] [CrossRef] [Green Version]
  35. Nesreen, A.; Helal, S.; Attia, A. Morphological and chemical studies on influence of water deficit on cassava. World J. Agric. Sci. 2013, 9, 369–376. [Google Scholar] [CrossRef]
  36. Oliveira, E.; De Freitas, J.P.X.; De Jesus, O.N. AMMI analysis of the adaptability and yield stability of yellow passion fruit varieties. Sci. Agric. 2014, 71, 139–145. [Google Scholar] [CrossRef] [Green Version]
  37. Olivoto, T.; Nardino, M. MGIDI: Toward an effective multivariate selection in biological experiments. Bioinformatics 2021, 37, 1383–1389. [Google Scholar] [CrossRef] [PubMed]
  38. Okechukwu, R.U.; Akoroda, M.O.; Ogbe, F.; Dixon, A.G.O. Analytical steps to a multi-trait selection index for rapid participatory appraisal of cassava varieties for release to farmers. Afr. J. Root Tuber Crops 2010, 8, 31–50. [Google Scholar]
  39. Okogbenin, E.; Fregene, M. Genetic mapping of QTLs affecting productivity and plant architecture in a full-sib cross from non-inbred parents in Cassava (Manihot esculenta Crantz). Theor. Appl. Genet. 2003, 107, 1452–1462. [Google Scholar] [CrossRef] [Green Version]
  40. Okpara, A.D.; Mbah, E.U.; Chukwu, I.E. Assessment of growth and yield of some high-and low-cyanide cassava genotypes in acid ultisols of south eastern Nigeria. Afr. J. Biotechnol. 2014, 13, 651–656. [Google Scholar] [CrossRef] [Green Version]
  41. Pérez, J.C.; Ceballos, H.; Ortega, E.; Lenis, J. Análisis de la interacción genotipo por ambiente en yuca (Manihot esculenta Crantz) usando el modelo AMMI. Fitotec. Colomb. 2005, 5, 11–19. [Google Scholar]
  42. Peryam, D.R.; Pilgrim, F.J. Hedonic scale method of measuring food preference. Food Technol. 1957, 11, 9–14. [Google Scholar]
  43. Pizarro, M.; Sánchez, T.; Ceballos, H.; Morante, N.; Dufour, D. Diversificación de los Almidones de Yuca y sus Posibles Usos en la Industria Alimentaria. Rev. Politécnica 2016, 37, 1–6. [Google Scholar]
  44. Purchase, J.L.; Hatting, H.; Van Deventer, C.S. Genotype × environment interaction of winter wheat (Triticum aestivum L.) in South Africa: II. Stability analysis of yield performance. South. Afr. J. Plant. Soil 2000, 17, 101–107. [Google Scholar] [CrossRef]
  45. Venables, W.N.; Ripley, B.D. Package MASS. Available online: http://www.r-project.org. (accessed on 17 October 2012).
  46. Rojas, M. Estudio de las Características Fisicoquímicas de la Yuca (Manihot esculenta Crantz) y sus Efectos en la Calidad de Hojuelas Fritas para su Procesamiento en la Empresa Pronal S.A.; Tecnología de Alimentos, Universidad Tecnológica de Pereira: Pereira, Colombia, 2012; p. 130. [Google Scholar]
  47. Szabo, E.A.; Jansson, E.; Miles, D.; Hambridge, T.; Stanley, G.; Baines, J.; Brent, P. Responding to Incidents of Low Level Chemical Contamination in Food. In Ensuring Global Food Safety; Boisrobert, C.E., Stjepanovic, A., Oh, S., Lelieveld, H.L.M., Eds.; Academic Press: Cambridge, MA, USA, 2010; pp. 411–437. [Google Scholar]
  48. Sagrilo, E.; Vidigal-Filho, P.S.; Pequeño, M.G.; Gonçalves-Vidigal, M.C.; Kvitschal, M.V. Producción y distribución de ma-teria seca en tres cultivares de yuca (Manihot esculenta Crantz) durante el segundo ciclo de la planta vegetativa. Arch. Bras. De Biol. Y Tecnología. 2008, 51, 1079–1087. [Google Scholar] [CrossRef] [Green Version]
  49. Safo-Kantanka, O.; Owusu-Nipah, J. Cassava varietal screening for cooking quality: Relationship between dry matter, starch content, mealiness and certain microscopic observations of the raw and cooked tuber. J. Sci. Food Agric. 1992, 60, 99–104. [Google Scholar] [CrossRef]
  50. Santiago, A.D.; Morais, L.K.; Cavalcante, M.H.B. Recomendação de diferentes épocas de colheita de mandioca tipo industria em Alagoas. Comun. Técnico Embrapa Tabul. Costeiros. 2015, 164, 1–6. [Google Scholar]
  51. Toler, J.E.; Burrows, P.M. Rendimiento genotípico sobre matrices ambientales: Un protocolo de agrupamiento no lineal. D. Estadísticas Apl. 1998, 25, 131–143. [Google Scholar]
  52. Turyagyenda, L.; Kizito, E.B.; Ferguson, M. Evaluation of Ugandan cassava germplasm for drought tolerance. Int. J. Agric. Crop Sci. 2013, 5, 212–226. [Google Scholar]
  53. Yan, W.; Hunt, L.; Sheng, Q.; Szlavnics, Z. Cultivar Evaluation and Mega-Environment Investigation Based on the GGE Biplot. Crop Sci. 2000, 40, 597–605. [Google Scholar] [CrossRef]
  54. Yaseen, M.; Eskridge, K.M.; Murtaza, G. Stability: Stability Analysis of Genotype by Environment Interaction (GEI), R Package Version 0,5,0. 2018. Available online: https://CRAN,R-project,org/package=stability (accessed on 20 July 2019).
  55. Vargas-Escobar, E.A.; García, D.B.; Sánchez, J.E.V. Análisis de estabilidad y adaptabilidad de híbridos de maíz de alta calidad proteica en diferentes zonas agroecológicas de Colombia. Acta Agronómica 2015, 65, 72–79. [Google Scholar] [CrossRef]
  56. Wei, M.; Fu, J.; Li, X.; Wang, Y.; Li, Y. Influence of dent corn genetic backgrounds on QTL detection for plant-height traits and their relationships in high-oil maize. J. Appl. Genet. 2009, 50, 225–234. [Google Scholar] [CrossRef]
Figure 1. Study area showing locations with geographical and altitudinal information.
Agronomy 11 01694 g001
Figure 2. Sprouting and plant height of selected genotypes evaluated under several environmental conditions. (a) Plant height in evaluated genotypes, (b) plant height in genotypes evaluated in seven environments. Different letters show significant differences obtained by Tukey’s test (p < 0.05).
Agronomy 11 01694 g002
Figure 3. Agronomic performance of selected genotypes evaluated under several environmental conditions. (a) Total and commercial fresh root yield in evaluated genotypes. (b) Total and commercial fresh root yield in seven environments. (c) Dry matter content in evaluated genotypes. (d) Dry matter content of plants evaluated in seven environments. Different letters show significant differences obtained by Tukey’s test (p < 0.05).
Agronomy 11 01694 g003
Figure 4. Multi-factorial response of genotypes evaluated in multiple Caribbean conditions. (a) Genotype selection index in the environment. (b) General selection index of genotypes evaluated in multiple environments. (c) Lin and Binns superiority index for the total and commercial yields and dry matter content.
Agronomy 11 01694 g004
Figure 5. Biplot of AMMI analysis of the total yield and dry matter content. (a) Biplot obtained between PC1 and PC2 for total yield. (b) Biplot between PC1 and total commercial yield. (c) Biplot obtained between PC1 and PC2 for dry matter content. (d) Biplot between PC1 with the dry matter content.
Agronomy 11 01694 g005
Table 1. Locations description and soil fertility.
Features * UnitsCodazziCereteCarmen BSevilla
Coordinates 10°00′01.2″ N, 73°15′22.4″ W8°50′27.47″ N, 75°48′27.56″ W9°42′50.8″ N, 75°06′26.9″ W10°47′35.4″ N 74°10′49.9″ W
Topography PiedmontPlainMountains and PiedmontPlain
Mean temperature (°C)28.127.726.928
Annual rainfall (mm)1560126411791280
Relative humidity(%)89828082
Altitude(m.a.s.l.)1351219718
Soil characteristics
Texture
Sandy-loamClayedClay-loamPlain
pH 7.846.997.186.39–6.4
OM%1.662.872.550.77–1.55
Pmg/kg150.3010.0928.8314.5–30
Cacmol(+)/kg13.0414.7921.749.97–7.51
Mgcmol(+)/kg1.146.116.691.36–1.19
Kcmol(+)/kg0.310.500.200.14–0.10
ECdS/m0.610.920.200.20–0.21
* pH water: Soil 2.5: 1.0, organic matter (OM), phosphorus (P) [Bray II], calcium (Ca), magnesium (Mg), potassium (K), electrical conductivity (CE) relation 2.5:1.0.
Table 2. Climatic conditions during evaluation period in four locations in the Caribbean Coast region of Colombia.
YearMonthCeretéCarmen B.SevillaCodazzi
Temperature (°C)Rain
(mm)
Temperature (°C)Rain (mm)Temperature (°C)Rain (mm)Temperature (°C)Rain (mm)
MaxMinMediaMaxMinMediaMaxMinMediaMaxMinMedia
Cycle 1 (July 2016–April 2017)
2016JUL35.521.628.4116.621.637.62976.237.721.62976.536.824.730.169
2016AUG36.52228.5160.921.437.628.8173.937.521.929.4130.335.924.129.7186.6
2016SEP35.321.828111.421.436.427.372.237.322.128.8142.733.923.728.7173
2016OCT37.522.228.7153.321.635.227.4180.235.220.827.9423.932.523.227.1316.8
2016NOV33.122.427.8110.620.43427158.635.421.628.1196.9 32.422.727.6272.4
2016DEC3722.228.616719.435.627.19.434.620.427.71.234.222.32838.7
2017JAN35.719.22812.9117.236.627034.817.927.1035.621.72910.6
2017FEB37.420.628.701838289.736.817.927.8036.822.52911
2017MAR36.222.728.847.520.63928.751.136.421.128.703524.129.666.4
2017APR4022.429.1198.621.637.429.137.237.822.429.4035.324.529.7153.3
Mean36.4221.7128.451078.8136.7420.3227.95768.536.3520.7728.39971.453523.3528.671297.8
Cycle 2 (June 2017–March 2018)
2017MAY 33.924.828.5290.2
2017JUN34.722.428.219439.621.428.3160.336.822.328.8159.333.724.728.6206.4
2017JUL34.92228.1254.835.621.628.217536.221.528.6131.334.524.129231.4
2017AUG352128.3134.235.621.628103.335.821.228.4241.633.823.828.3221.9
2017SEP3522.228.1376.834.622.228.2138.4535.321.828.1255.23323.727.9187
2017OCT3722.228.477.735.620.913.480.936.220.928.1256.43423.928.5233.8
2017NOV35.822.328.360.135.417.327.113134.722.128339.133.123.127.6304.8
2017DIC3621.228.630.934.41927.250.435.41927.76.435.423.628.191
2018ENE35.521.628.539.635.419.126.946.335.22127.9303523.228.635.2
2018FEB3720.72903517.226.42.835.519.127.40.437.323.530.25.1
2018MAR37.621.629.524.436.41828.47.236.619.828.50.637.824.930.837.9
Mean35.8521.7228.51192.535.7619.8326.21895.6535.7720.8728.151420.1734.8123.928.881554.5
Table 3. Mean squares for total root yield (TRY), commercial root yield (CRY), and dry matter content (DMC).
Scheme.dfTRYCRYDMC
Environments66643.89 **2374.41 **317.01 **
Reps/Environments 1190.83310.41 **7.73
Genotypes15190.51 **312.48 **36.81 **
Genotypes × Environments90126.76 **153.96 **12.33 **
Error16580.7279.76.18
Total287
** Significance for α = 0.01.
Table 4. Average and standard error values for total root yield, commercial root yield and dry matter content for the 16 genotypes assessed per location and production cycle.
GenotypesCarmen B_CARMEN_B_CERETE_CERETE_CODAZZI_SEVILLA_SEVILLA_
2016201720162017201720162017
Total root yield (T/ha)
CAISELI *24.7 ± 8.231.3 ± 5.2 ab17.5 ± 11.253.7 ± 6.7 ab25.7 ± 7.5 b34.9 ± 2.623.7 ± 8.6
CM9456-1234.2 ± 12.131.9 ± 9.6 ab7.3 ± 6.547.2 ± 24.1 ab26 ± 11 b48.4 ± 31.432.5 ± 8
CMB852717.4 ± 1.820 ± 9.6 ab9.3 ± 0.574.4 ± 19.2 a23.8 ± 5.7 b38.5 ± 36.417.6 ± 6.6
GM1692-5640.6 ± 0.831.6 ± 13.3 ab26.2 ± 2.753.9 ± 14.3 ab28.2 ± 7.3 b47.4 ± 19.329.4 ± 5.6
GM214-6238.1 ± 12.232.8 ± 25.1 ab9.1 ± 4.858.5 ± 7.5 ab28 ± 2.9 b40.6 ± 2.222.5 ± 3.3
GM3766-532.3 ± 17.822.2 ± 8.8 ab15.7 ± 14.661.4 ± 8.6 ab28.2 ± 8.3 b61.5 ± 12.229.4 ± 8
GM3790-232.8 ± 23.330.5 ± 9.2 ab12.8 ± 7.348.2 ± 16.9 ab23.1 ± 5.9 b43.6 ± 7.324.7 ± 0.6
COSTEÑA *40.5 ± 3.614.6 ± 8.5 ab26.6 ± 10.260.6 ± 7.2 ab28.3 ± 5 b41.1 ± 3.331.7 ± 11.6
SM1127-818.9 ± 5.544.8 ± 0.6 a17.1 ± 4.653.5 ± 14.2 ab29.8 ± 0.8 b52.1 ± 22.427.8 ± 6.5
SM2773-3223.2 ± 6.220.9 ± 7.5 ab6.1 ± 044.3 ± 15.9 ab17.9 ± 5.1 b26.7 ± 6.824.2 ± 9.2
SM3106-1441 ± 3.839.2 ± 11.7 ab30.8 ± 460.8 ± 17.4 ab33.9 ± 9.8 b43.8 ± 22.133.1 ± 8.3
SM3385-5525.1 ± 1.318.1 ± 7.6 ab18.3 ± 5.460.2 ± 10 ab18.7 ± 3.5 b45 ± 21.815.6 ± 5.3
SM3386-4938.9 ± 0.545.1 ± 15 a16.3 ± 6.773,7 ± 9.5 a29.4 ± 11.6 b42.6 ± 1.427.4 ± 5.5
SM3387-7318 ± 4.69.9 ± 3.7 b18.7 ± 0.455.2 ± 5.8 ab27.2 ± 10,2 b32.6 ± 0.418.9 ± 7.8
SM3474-13929 ± 317.5 ± 3.8 ab10.1 ± 1.551.5 ± 8.8 ab26 ± 1.8 b56.6 ± 9.824.6 ± 6.5
SM3553-2733.1 ± 3.038.2 ± 3.8 ab14.9 ± 1.228.2 ± 3.2 b63 ± 2.08 a47.7 ± 7.427.4 ± 11.1
Mean30.5 ± 10.7 c28 ± 13.6 c16 ± 8.4 d55.3 ± 15.3 a28.6 ± 12.1 c43.9 ± 14.9 b25.7 ± 8 c
Commercial root yield (T/ha)
CAISELI *13.9 ± 823.4 ± 7.4 abc8.8 ± 4.830.1 ± 2.9 ab18.1 ± 7.1 ab13.9 ± 10.910.8 ± 7.9
CM9456-1219.2 ± 2.615.3 ± 5.9 abc4.1 ± 3.425.4 ± 18.5 ab14.8 ± 7.2 b38.9 ± 30.920.6 ± 9.8
CMB852710.6 ± 2.99.9 ± 7.6 abc6.8 ± 1.151.6 ± 8.9 a16.1 ± 3.4 b5.4 ± 7.67 ± 6
GM1692-5627.6 ± 6.517.6 ± 10 abc14.4 ± 4.528.1 ± 4.9 ab13.5 ± 6.8 b27 ± 8.914 ± 5.1
GM214-6230.5 ± 12.916.2 ± 11.9 abc3.6 ± 0.337.6 ± 7.6 ab17.1 ± 1.2 b24.7 ± 0.711.8 ± 2.7
GM3766-514.4 ± 8.99.6 ± 5.1 abc12.6 ± 12.343.4 ± 11.8 ab13.3 ± 6.2 b49.1 ± 15.614.1 ± 7.9
GM3790-229 ± 22.320.3 ± 6.4 abc4.2 ± 332.6 ± 14.1 ab15.5 ± 1.9 b20.6 ± 6.611.4 ± 2.5
COSTEÑA *31.7 ± 0.47 ± 6.9 bc15 ± 338.6 ± 7.1 ab15.8 ± 4.3 b28 ± 1.617.1 ± 12.3
SM1127-812.6 ± 2.126.8 ± 3.4 ab12 ± 733 ± 14.4 ab19.2 ± 2.7 ab16.7 ± 2.914.7 ± 3
SM2773-3215.2 ± 4.98.7 ± 6.2 bc3 ± 0.125.2 ± 6.5 ab8 ± 2.5 b11.2 ± 0.510.7 ± 6
SM3106-1434 ± 521.4 ± 6.4 abc18.5 ± 0.234.4 ± 17 ab20.7 ± 10.9 ab36.5 ± 28.715.9 ± 3.6
SM3385-5514.7 ± 0.210 ± 6.6 abc10.1 ± 7.438.7 ± 2.9 ab7.9 ± 4.2 b23.9 ± 22.25.3 ± 2.8
SM3386-4932.9 ± 0.430.8 ± 11.8 a8.9 ± 2.449.4 ± 10.4 a18.3 ± 8.1 ab21 ± 0.212.7 ± 3.2
SM3387-7311.3 ± 3.44.8 ± 3.2 c12.5 ± 2.637.1 ± 3 ab17.9 ± 8.7 ab25.5 ± 4.29.8 ± 6.6
SM3474-13919.8 ± 28 ± 2.8 bc5.6 ± 1.128.4 ± 6.7 ab12.9 ± 2.7 b40.3 ± 11.310.9 ± 3.6
SM3553-2726.8 ± 2.421.1 ± 3.1 abc11.6 ± 1.917.8 ± 1.2 b43 ± 25.1 a39.3 ± 10.219.4 ± 6.9
Mean21.3 ± 10.2 bc15.7 ± 9.6 cde9.5 ± 5.7 e34.5 ± 12 a17 ± 10,3 cd26.4 ± 15.4 b12.9 ± 6.5 de
Dry matter content (%)
CAISELI *33.8 ± 1.336.4 ± 2.4 a40.5 ± 0.337.4 ± 1 ab40.3 ± 1.1 a38 ± 0.634.2 ± 2.5
CM9456-1230.8 ± 2.935.9 ± 2.7 ab38.5 ± 2.934.8 ± 0.8 ab36.4 ± 2.4 ab37.6 ± 1.531.8 ± 0.7
CMB852731.9 ± 3.736 ± 3.1 ab39.8 ± 2.437.6 ± 2.1 ab42.3 ± 0.7 a40.7 ± 3.133.5 ± 2.8
GM1692-5634.3 ± 4.633.7 ± 4.2 ab37.7 ± 1.134.7 ± 1 ab40.2 ± 1.1 a37.4 ± 2.432.6 ± 0.4
GM214-6229.4 ± 0.535 ± 5.3 ab41.9 ± 4.330.2 ± 8.4 bc39.9 ± 1 a34.6 ± 3.732.1 ± 0.9
GM3766-527.9 ± 0.430.8 ± 2 ab38.8 ± 0.431 ± 3.3 abc37.5 ± 2.8 ab37.1 ± 431.4 ± 1.1
GM3790-230.4 ± 0.437.7 ± 3.3 a40.9 ± 3.537.4 ± 1 ab37.6 ± 3.4 ab37.4 ± 235.1 ± 0.8
COSTEÑA *29.5 ± 0.927.3 ± 2.3 b35.2 ± 4.132.2 ± 2.1 abc40.1 ± 0.5 a36.3 ± 0.831.2 ± 3.7
SM1127-828.7 ± 0.837 ± 1.3 a34.4 ± 2.825.9 ± 5.1 c38.3 ± 0.8 ab36.6 ± 1.832.3 ± 0.9
SM2773-3234.3 ± 0.737.3 ± 1.2 a40.7 ± 139.5 ± 1.2 a36.9 ± 6.5 ab41 ± 1.935.4 ± 09
SM3106-1432.9 ± 3.930.2 ± 2.7 ab40.1 ± 0.834.5 ± 2.1 abc40.1 ± 0.9 a37.7 ± 0.634 ± 11
SM3385-5530.5 ± 2.733 ± 3.9 ab37.9 ± 1.635.4 ± 2 ab35.7 ± 2.8 ab37.7 ± 2.932.2 ± 1.5
SM3386-4931.2 ± 2.137.1 ± 2.7 a38.6 ± 1.235.7 ± 0.9 ab38.7 ± 0.4 ab36.5 ± 0.932.1 ± 1.7
SM3387-7329.7 ± 1.730.8 ± 3.4 ab40.4 ± 0.637.4 ± 1.2 ab40.4 ± 1 a35.4 ± 4.534.4 ± 1.4
SM3474-13931.5 ± 0.635 ± 1.8 ab37.6 ± 5.834.7 ± 1.5 ab41.3 ± 0.7 a37.1 ± 3.734.2 ± 1.6
SM3553-2733.2 ± 333.7 ± 1.1 ab38 ± 138.4 ± 0.8 ab32.4 ± 1.3 b39.3 ± 0.534.2 ± 1.8
Mean31.2 ± 2.6 c34.2 ± 3.8 b38.8 ± 2.8 a34.8 ± 4.2 b38.6 ± 3.1 a37.5 ± 2.4 a33.2 ± 1.9 bc
Group of means with the same letter are not significant for α = 0.05 according to Tukey’s test. * Commercial genotypes (checks).
Table 5. Classification of 16 cassava genotypes using the selection index (SIN) evaluated in seven environments of the Colombian Caribbean region.
GenotypesCarmen-B Carmen-B CereteCereteCodazziSevillaSevilla
2016201720162017201720162017
GM1692-568.91−1−6.14−99.04−2−4.75−136.05−1116.43−9−13.69−10
SM3106-146.87−2−21.88−1320.02−12.65−919.52−124.28−4−5.29−3
SM3386-494.78−313.95−2−1.34−1115.05−110.01−911.24−11−16.63−12
GM3790-2−0.7−412.51−30.57−88−56.77−1016.84−7−7.15−5
ICA-COST *−0.81−5−44.43−16−4.69−13−4.32−1214.18−618.44−6−13.88−11
SM2773-32−1.76−6−12.3−11−8.57−155.68−7−9.37−155.31−15−7.71−6
GM214-62−5.94−7−3.85−72.74−6−17.16−1511.71−89.94−12−16.64−13
SM3553-27−6.45−8−0.2−6−0.16−1010.03−4−6.24−1424.64−3−0.78−1
SM3474-139−9.34−9−12.09−10−10.99−16−2.64−1111.88−723.23−5−10.33−9
CAISELI *−11.44−1012.13−43.93−47.5−616.91−47.31−13−8.85−7
CMB8527−12.3−11−5.03−80.12−912.74−215.55−5−5.74−16−17.31−15
SM3385-55−12.8−12−18.24−121.8−74.76−8−9.4−1613.98−10−22.31−16
CM9456-12−15.37−135.01−5−6.22−14−8.48−14−0.4−1334.2−2−3.7−2
SM3387-73−18.08−14−27.14−157.52−310.28−317.36−316.77−8−9.29−8
SM1127-8−19.59−1519.58−1−2.42−12−39.31−1617.67−26.42−14−5.46−4
GM3766-5−20.46−16−22.24−143.13−5−1.38−101.8−1240.55−1−17.11−14
* Commercial genotypes (checks).
Table 6. Mean squares and significance of commercial root yield (CFRY) and dry matter content (DMC) according to the AMMI model.
Source of VariationdfCFRY DMC
ENV63,164,400***317,020***
REP(ENV)11247,100***7630ns
GEN15238,700***36,880***
ENV*GEN90136,000***12,330***
Residuals16363,500 6170
Mean 19,755 35,420
CV 40,337 7015
PC120312,705(41.2%)24,277(40.4%)
PC218243,648(28.9%)20,660(30.9%)
*** significance for α = 0.001; ns: No significance; ENV: Environment; REP: Repetition; GEN: Genotype; CV: Coefficient of variation; PC: Principal component.
Table 7. Ranking and correlation for the commercial fresh root yield (CFRY), the selection index (SIN), and the phenotypic stability (Pig and ASV) of 16 cassava genotypes.
GenotypeSIN CRYPig CFRYASV CFRY
SM3106-14 6.601115
SM3553-27 2.9852216
GM3766-5 −2.24114314
SM3386-49 5.2923413
GM1692-56 2.266653
COSTEÑA −5.0715562
CM9456-12 0.7278711
SM3474-139 −1.47911812
GM214-62 −2.7412791
GM3790-2 5.26310107
SM3387-73 −0.37813116
CAISELI *3.934121210
SM3385-55 −6.031615138
SM1127-8 −3.30139149
SM2773-32 −4.101416154
CMB8527 −1.7110141615
Ranking coefficient CRYPig CRYASV CRY
SIN 0.4650.503−0.253
CRY 0.900−0.076
Pig CRY −0.088
PIG: Stability parameter statistic of a given genotype; * commercial varieties (control); ASV: AMMI stability value.
Table 8. Quality features of the evaluated cassava genotypes.
GenotypeDry Matter ContentStarch ContentHCNCooking Time
(%)(%)(µg/g P.F.)(Minutes)
CM9456-1234.6 ± 3.1 ab86.1 ± 8.257.7 ± 20.3 bcd23 ± 3.6
CMB852738 ± 4.4 a81.1 ± 1.436.8 ± 9.1 cd23 ± 1.4
GM1692-5636.2 ± 4.4 ab77.8 ± 0.362.5 ± 23.2 bcd41 ± 26.9
GM214-6234.3 ± 5.7 ab82 ± 2.670.7 ± 22.2 bcd27 ± 1.4
GM3766-532.7 ± 3.6 b86.4 ± 6.296 ± 38.8 b50 ± 13.2
GM3790-236.8 ± 3.4 ab82.5 ± 3.236.5 ± 18.4 cd41 ± 26.9
SM1127-834.3 ± 4.6 ab86 ± 4.326.6 ± 13.2 cd25.3 ± 4.7
SM2773-3237.3 ± 3.3 ab83.4 ± 1.283 ± 9.6 bc27.5 ± 0.7
SM3106-1435.7 ± 5.3 ab82.2 ± 362.6 ± 41.4 bcd22
SM3385-5534.1 ± 2.8 ab82.6 ± 1.837.2 ± 14.5 cd30.5 ± 0.7
SM3386-4935.6 ± 4 ab79.6 ± 6.973 ± 14 bcd24.3 ± 2.5
SM3387-7337.2 ± 5.1 ab85.9 ± 5.656.4 ± 18 bcd43.5 ± 23.3
SM3474-13936.5 ± 3.5 ab86 ± 1.5109.4 ± 55.2 ab24.7 ± 4
SM3553-2734.7 ± 4.1 ab84.1 ± 1.336.3 ± 8.7 cd40.3 ± 17
SM3562-3234.6 ± 4.1 ab81.8973.15 bcd42
Caiseli36.8 ± 4.1 ab83.6 ± 1.831.5 ± 9.5 cd29
Costeña33.8 ± 4.8 ab80.3 ± 6.955.5 ± 55 bcd28
Venezolana34.7 ± 4.8 ab81 ± 0.924.4 ± 6.7 d29
Tai 158.5 ± 39.9 a
Different letters show significant differences obtained by Tukey’s test (p < 0.05).
Table 9. Liking categories for the evaluated cassava genotypes.
GenotypeColourFlavourTextureRoot shape
CM9456-124–5 (0.83)4–5 (0.78)4–5 (0.72)4–5 (0.78)
CMB85274–5 (0.68)4–5 (0.60)4–5 (0.64)4–5 (0.71)
GM1692-564–5 (0.66)4–5 (0.47)2–3 (0.50)4–5 (0.64)
GM3790-22–3 (0.52)2–4 (0.51)2–4 (0.49)4-5 (0.70)
SM1127-84–5 (0.85)4–5 (0.82)4–5 (0.86)4–5 (0.81)
SM3106-144–5 (0.59)4–5 (0.74)4–5 (0.68)4–5 (0.51)
SM3386-494–5 (0.73)4–5 (0.63)4–5 (0.65)4–5 (0.67)
SM3387-731–3 (0.59)1–4 (0.48)1–5 (0.56)4–5 (0.68)
SM3474-1393–5 (0.54)2–4 (0.60)3–4 (0.58)4–5 (0.61)
SM3553-274–5 (0.87)4–5 (0.78)4–5 (0.70)4–5 (0.84)
SM3562-324–5 (0.81)4–5 (0.63)4–5 (0.63)4–5 (0.69)
Caiseli4–5 (0.58)4–5 (0.59)4–5 (0.55)4–5 (0.63)
Costeña5 (0.54)4–5 (0.78)4–5 (0.68)4–5 (0.82)
Venezolana1–5 (0.63)4–5 (0.67)4–5 (0.52)4–5 (0.63)
Numbers show more frequent categories and the frequency is between parentheses, Hedonic scale 1: Dislike extremely, 2: Dislike moderately, 3: Neither like nor dislike, 4: Like moderately, 5: Like extremely.
Publisher’s Note: MDPI stays neutral with regard to jurisdictional claims in published maps and institutional affiliations.

