
The Influence of Fillers on the Reinforcement Capabilities of Polypropylene Based Mono-Material and Core-Shell Fibers in Concrete, a Comparison


Abstract
1. Introduction
2. Materials and Methods
2.1. Materials
2.2. Processing
2.2.1. Compounding
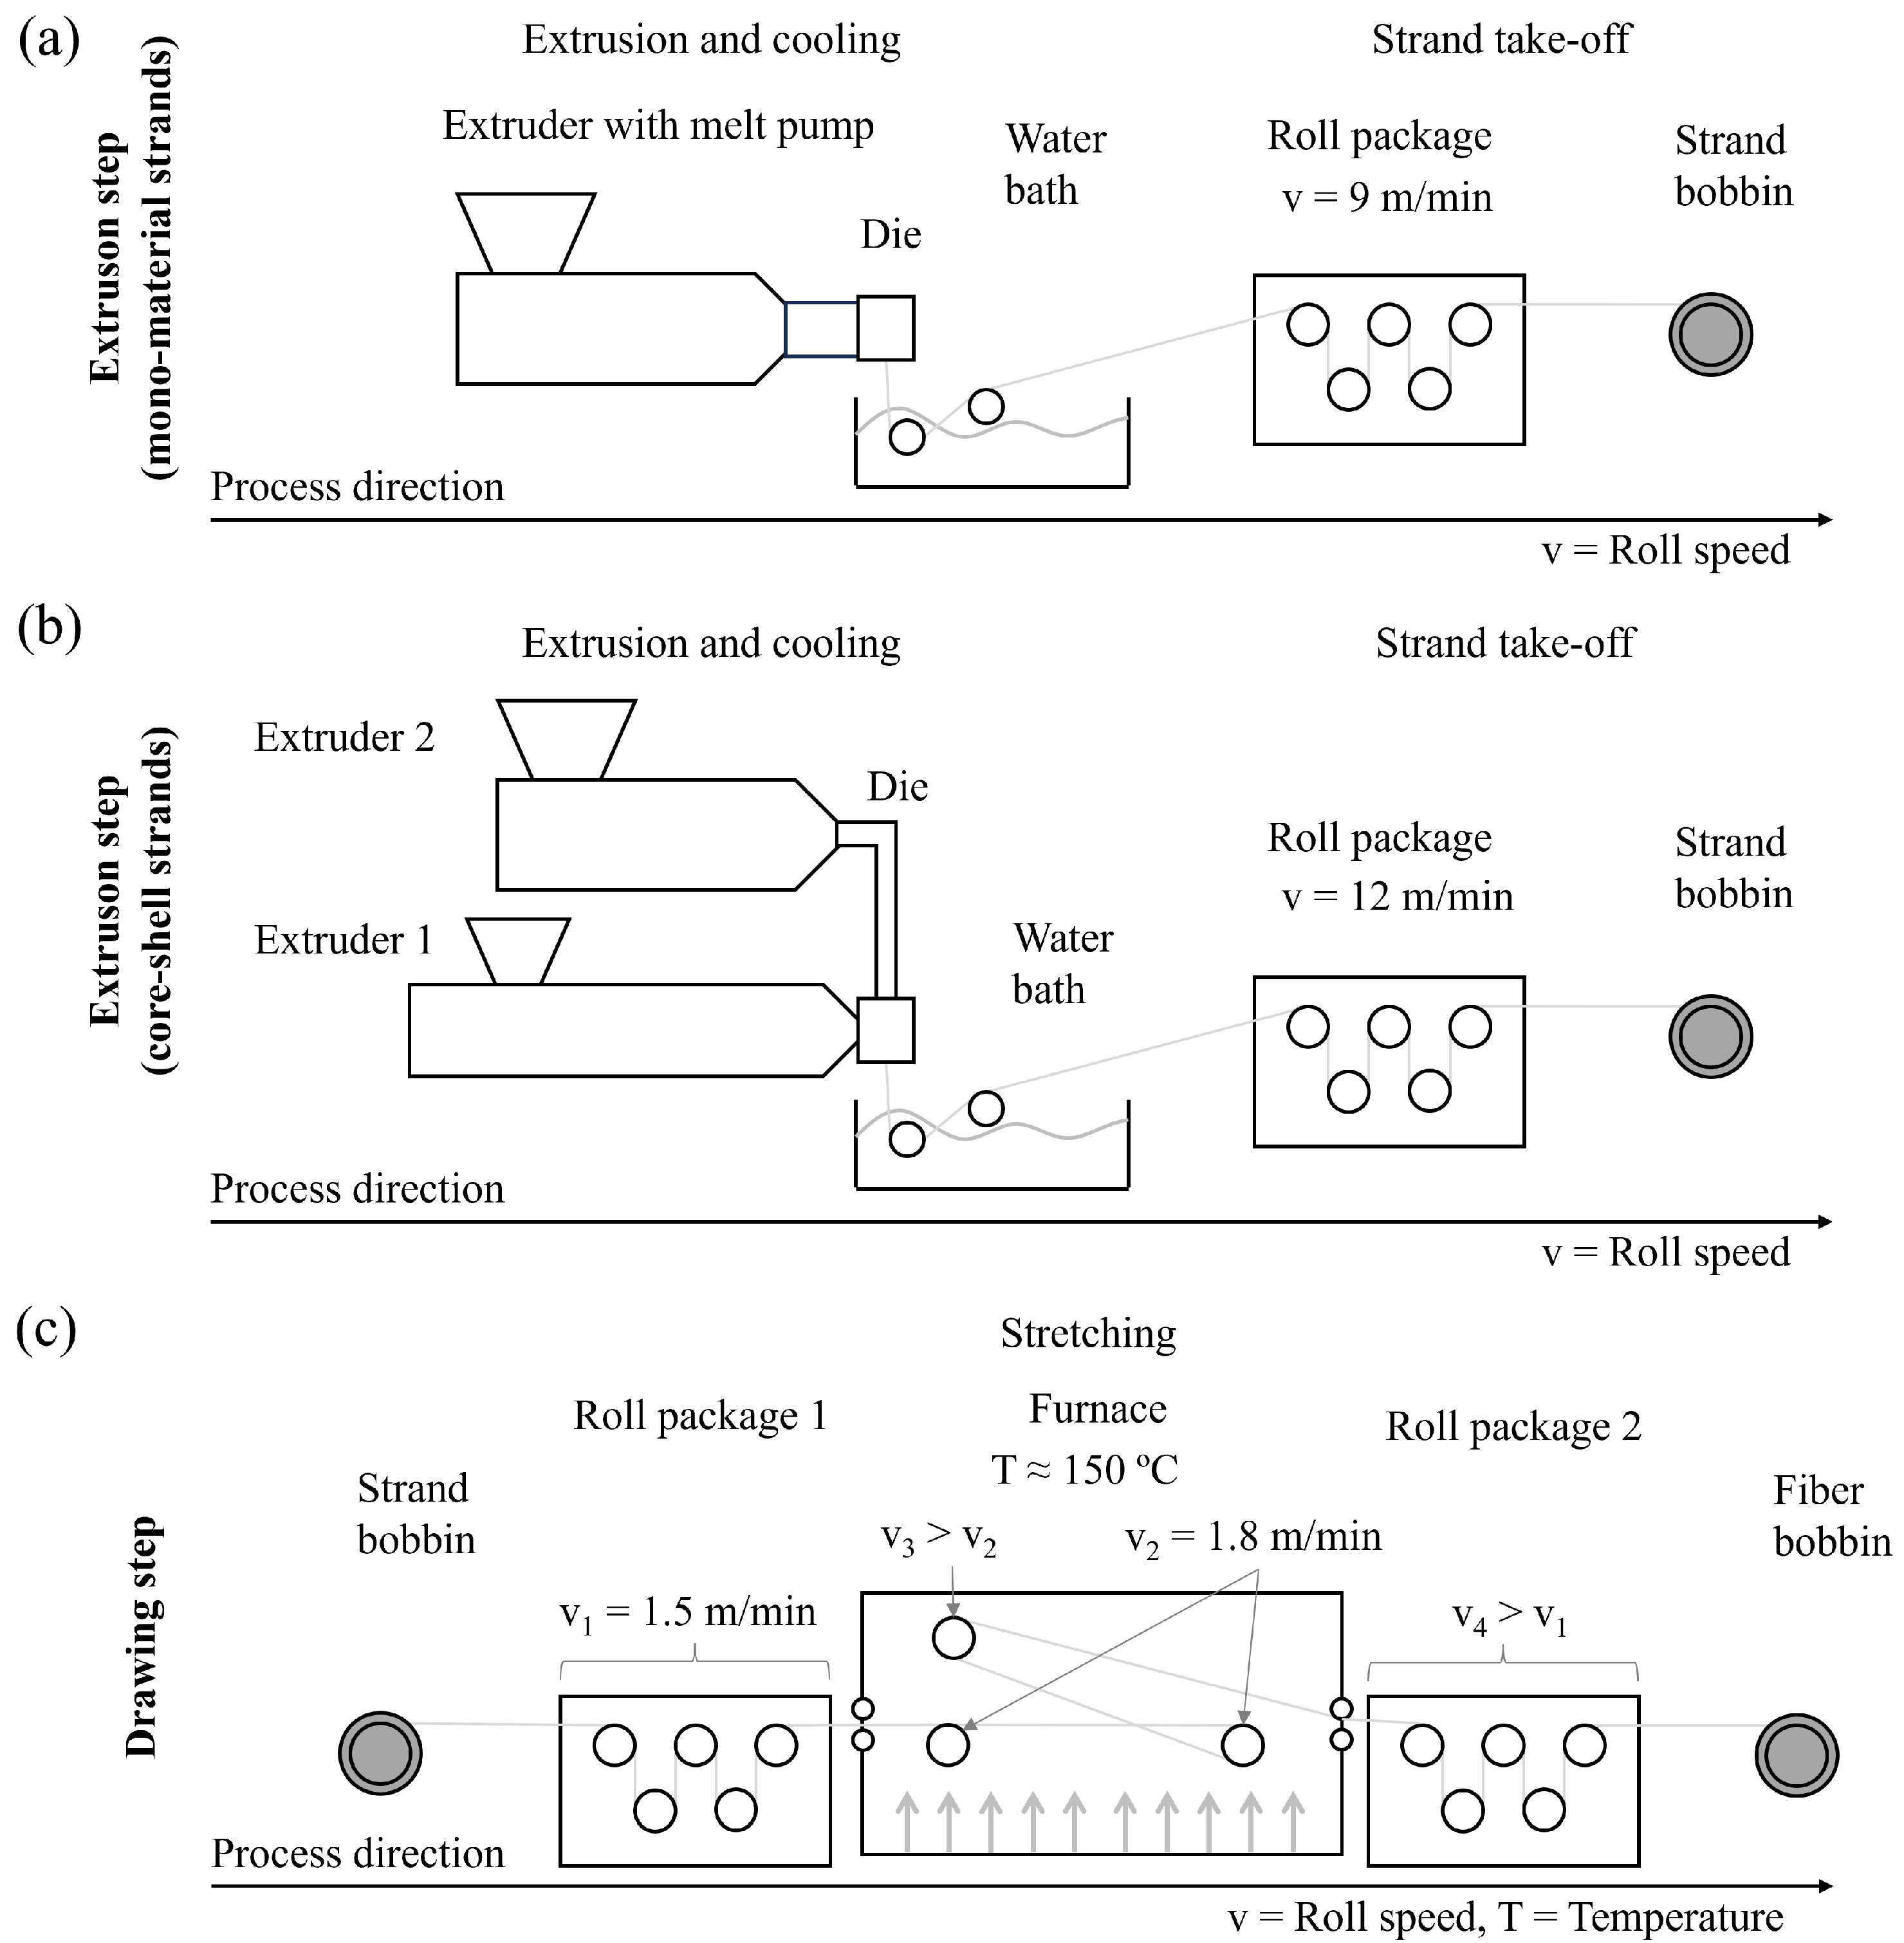
2.2.2. Fiber Production
2.3. Analyses
2.3.1. Tensile Tests
2.3.2. Density Measurements
2.3.3. Single-Fiber Pull-Out Test
2.3.4. Contact Angle Measurements
2.3.5. Topography Measurements
2.3.6. Reflected Light Microscopy
2.3.7. Thermogravimetric Analysis
3. Results and Discussion
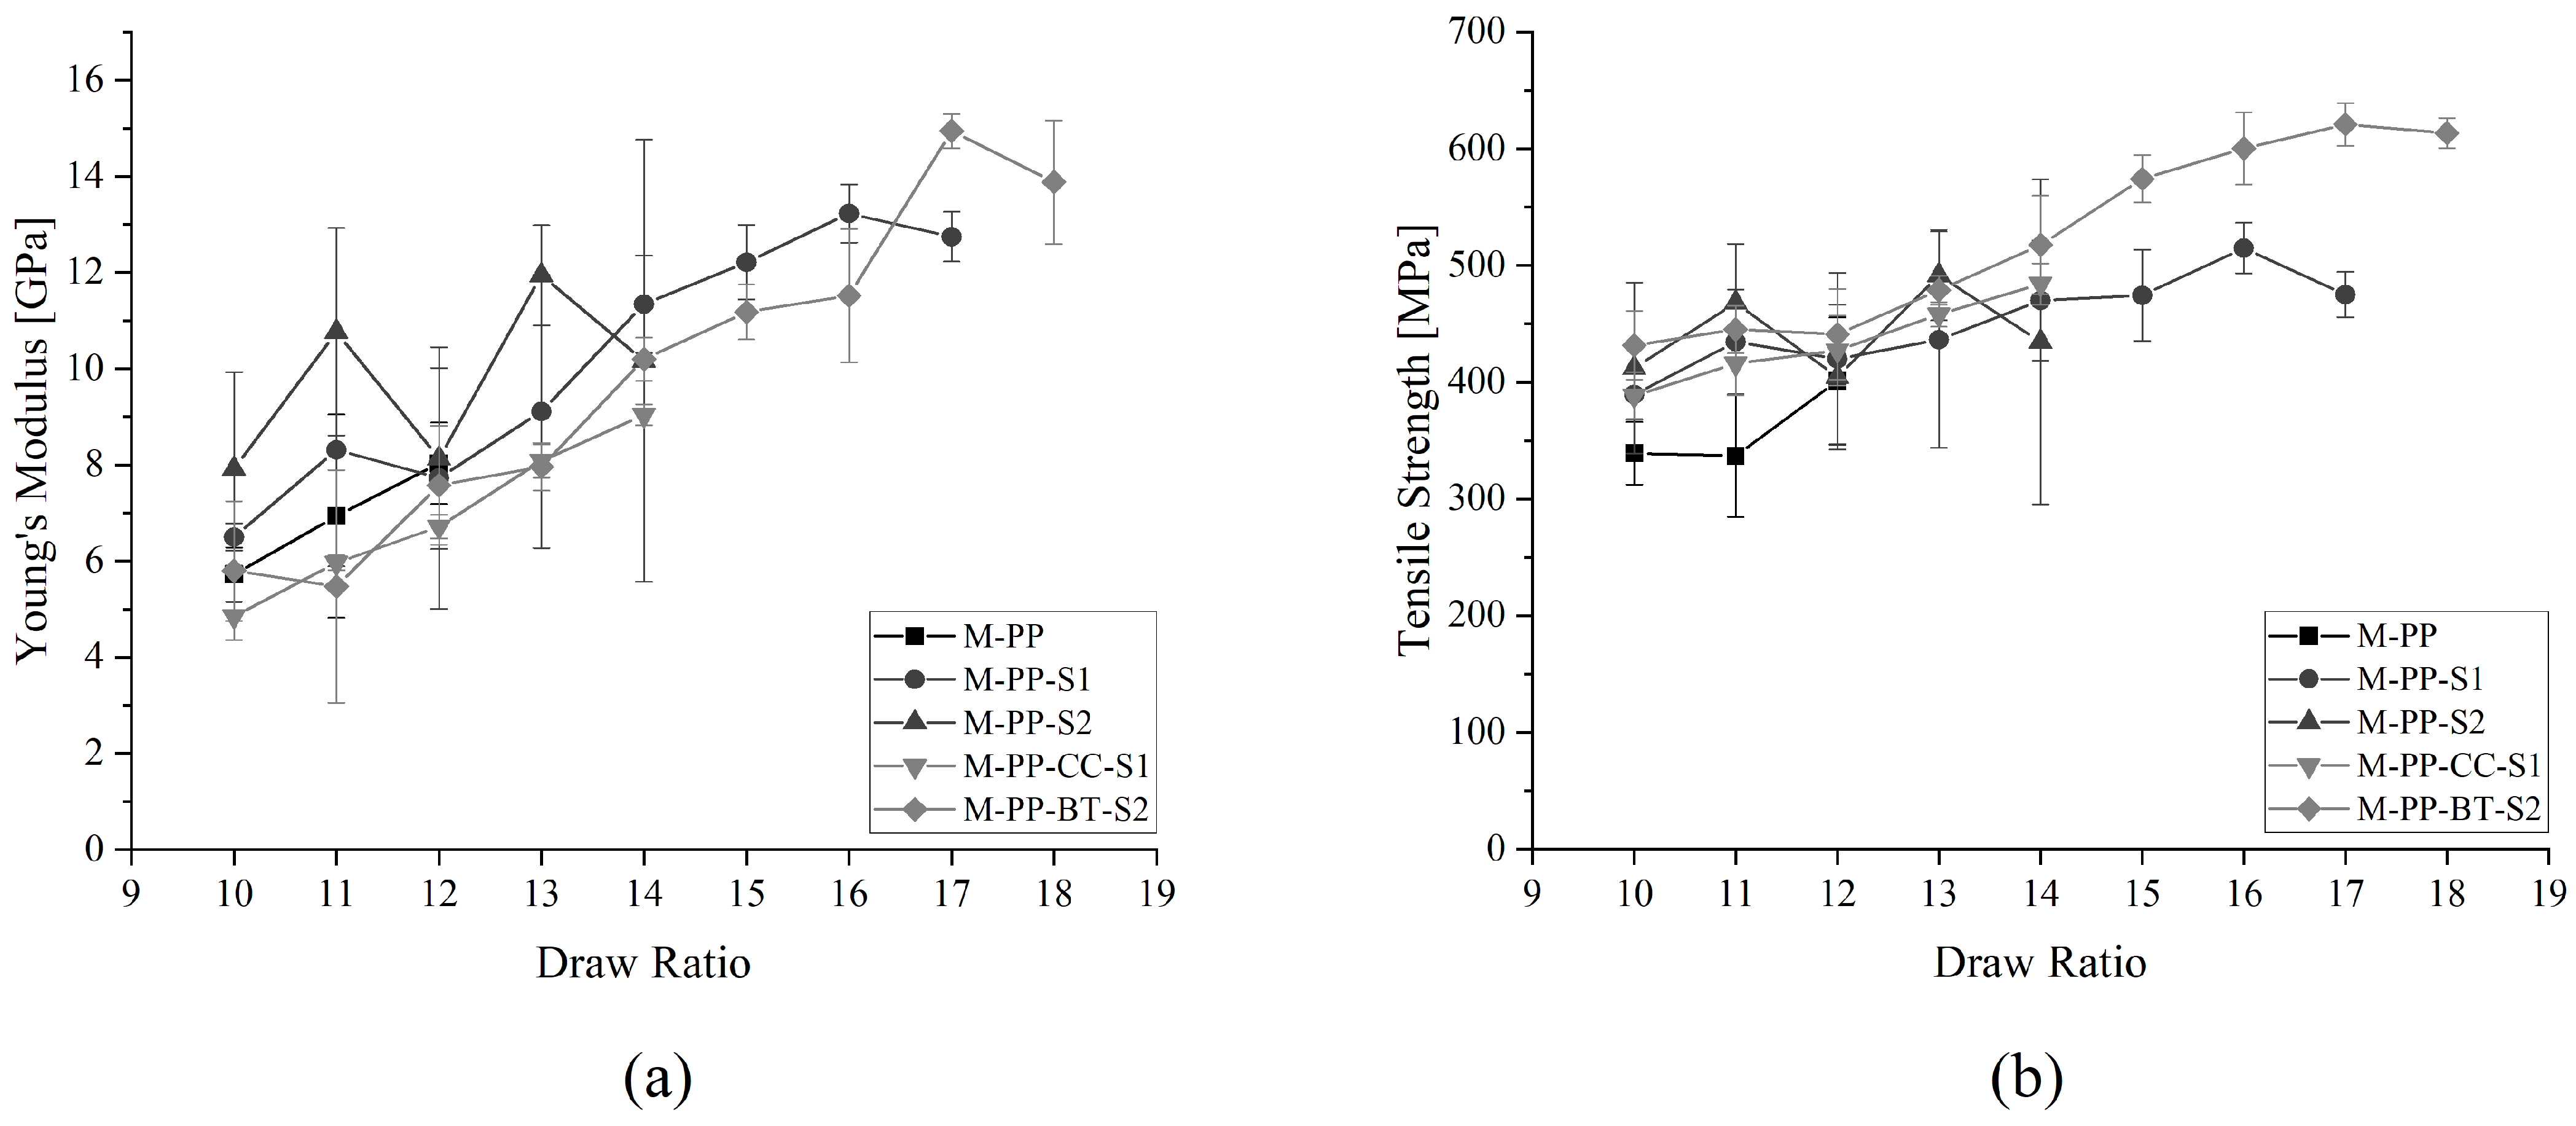
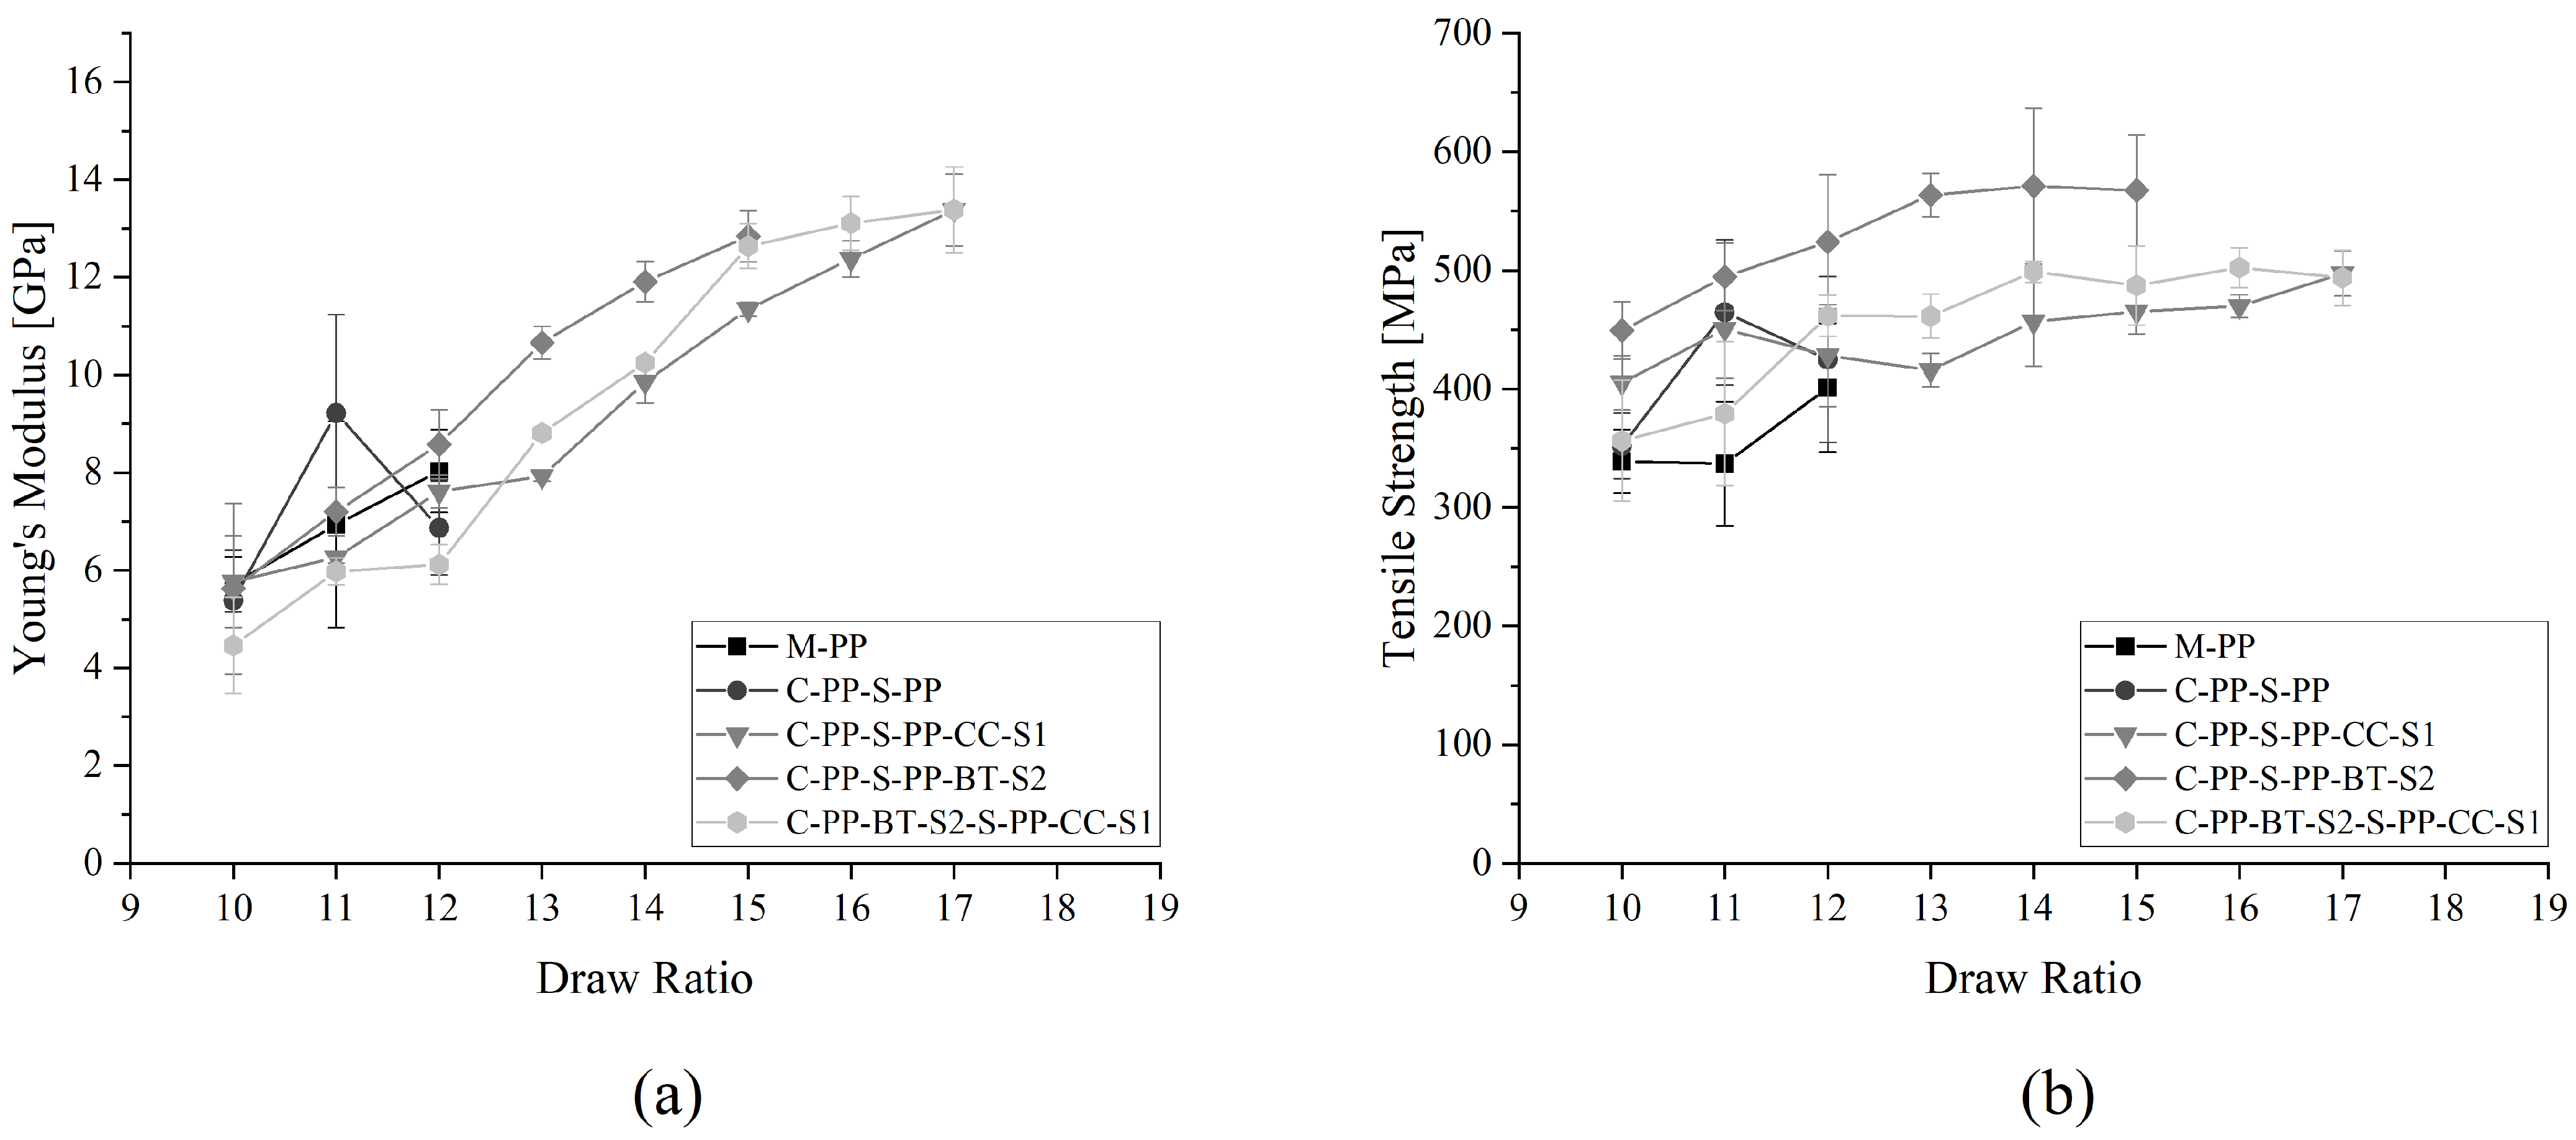
3.1. Mechanical Properties
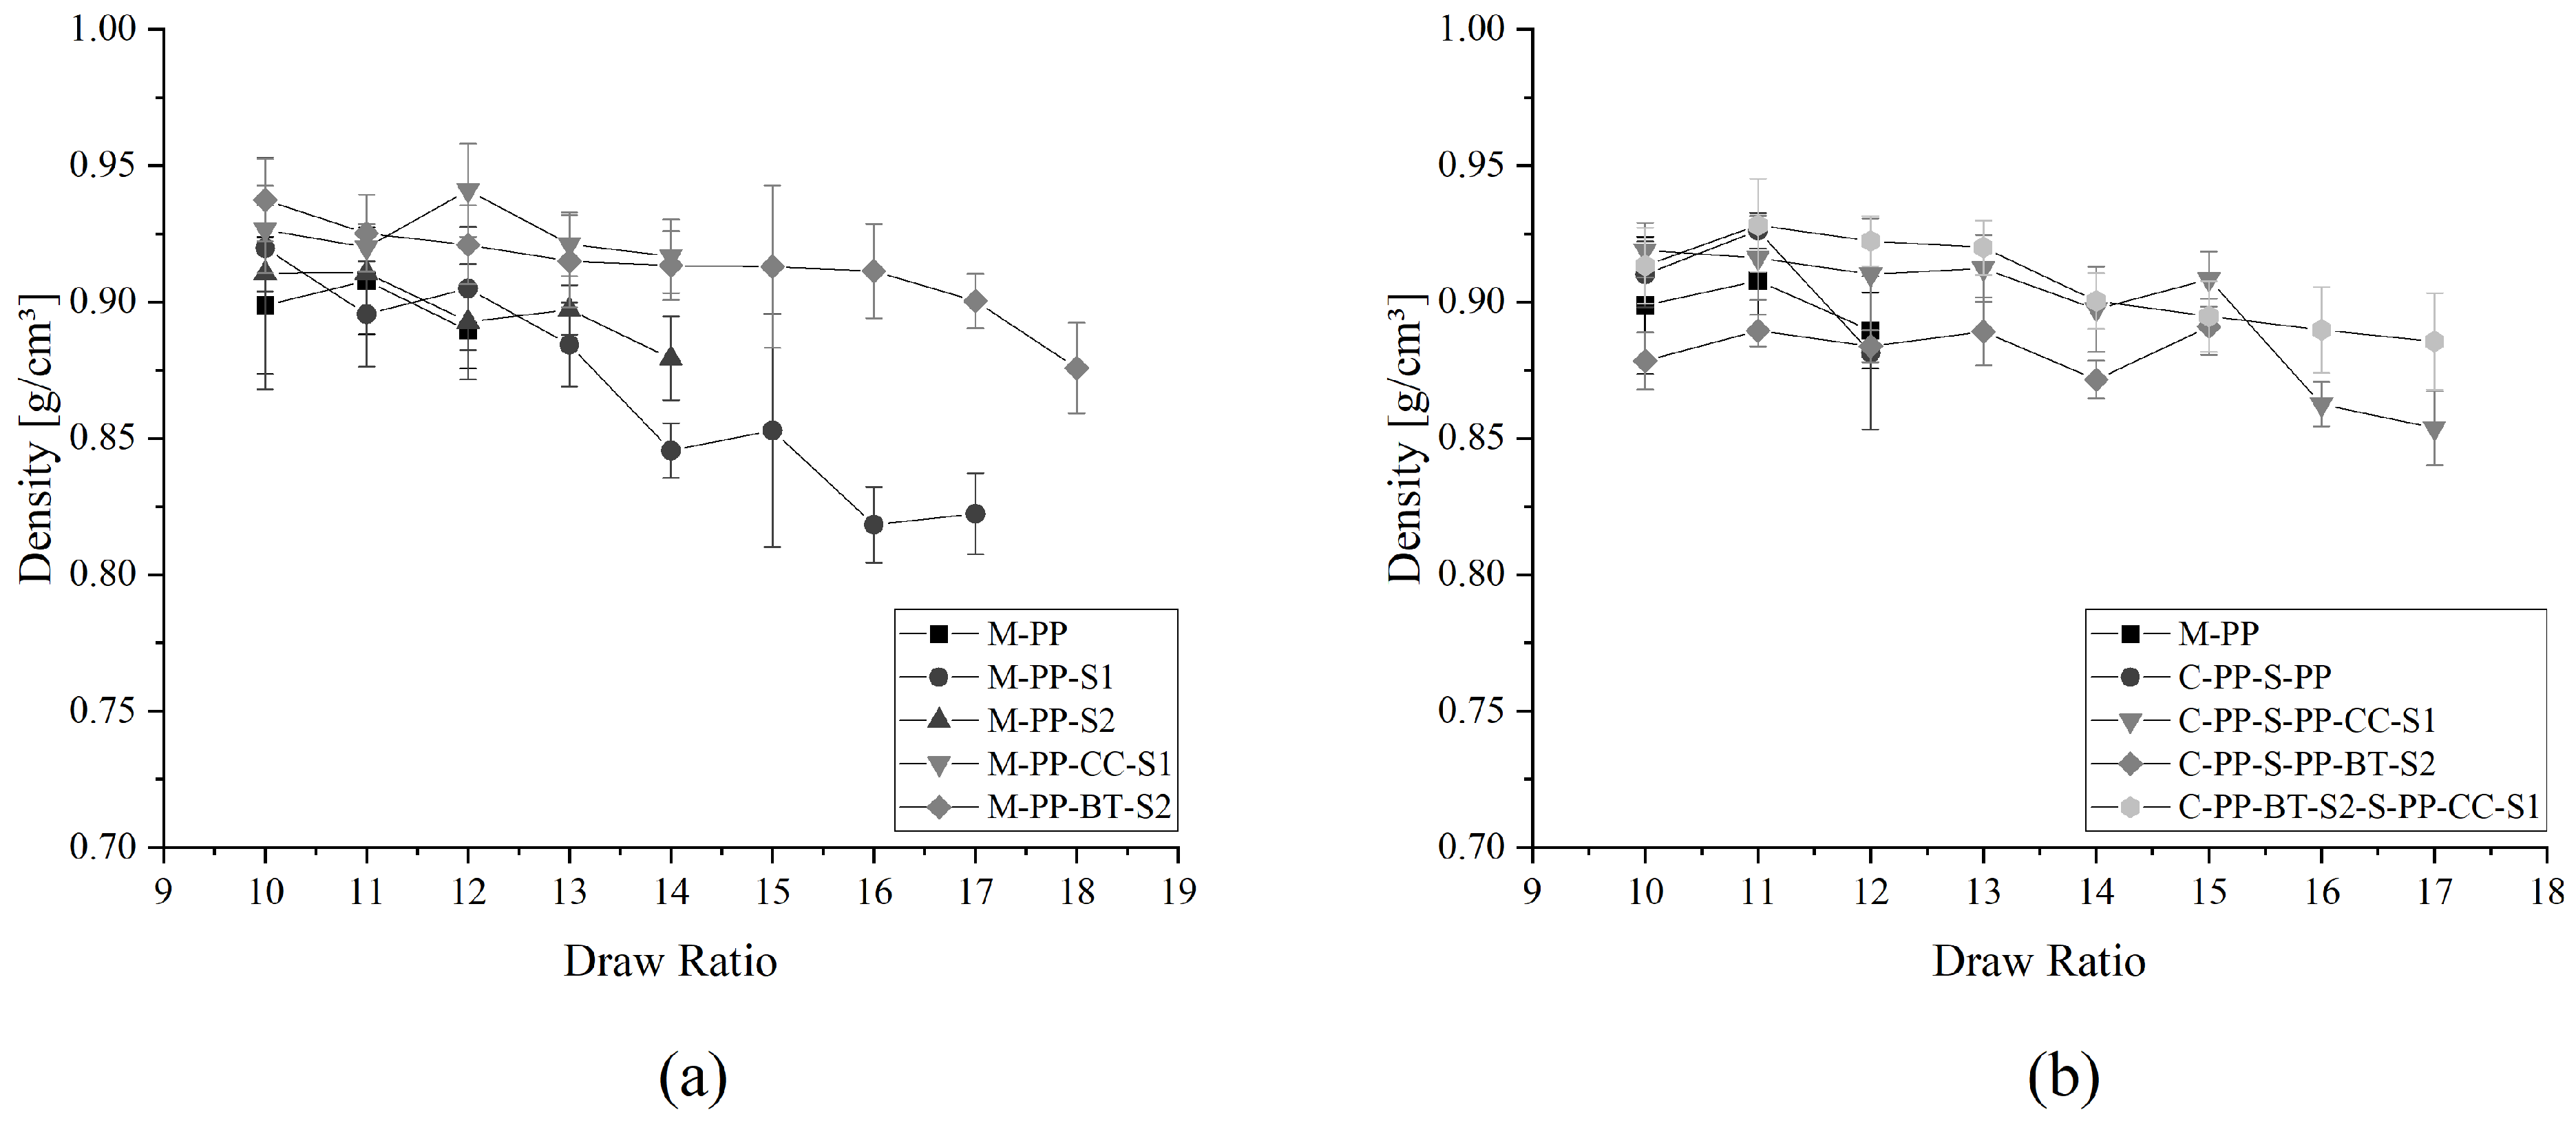
3.2. Density
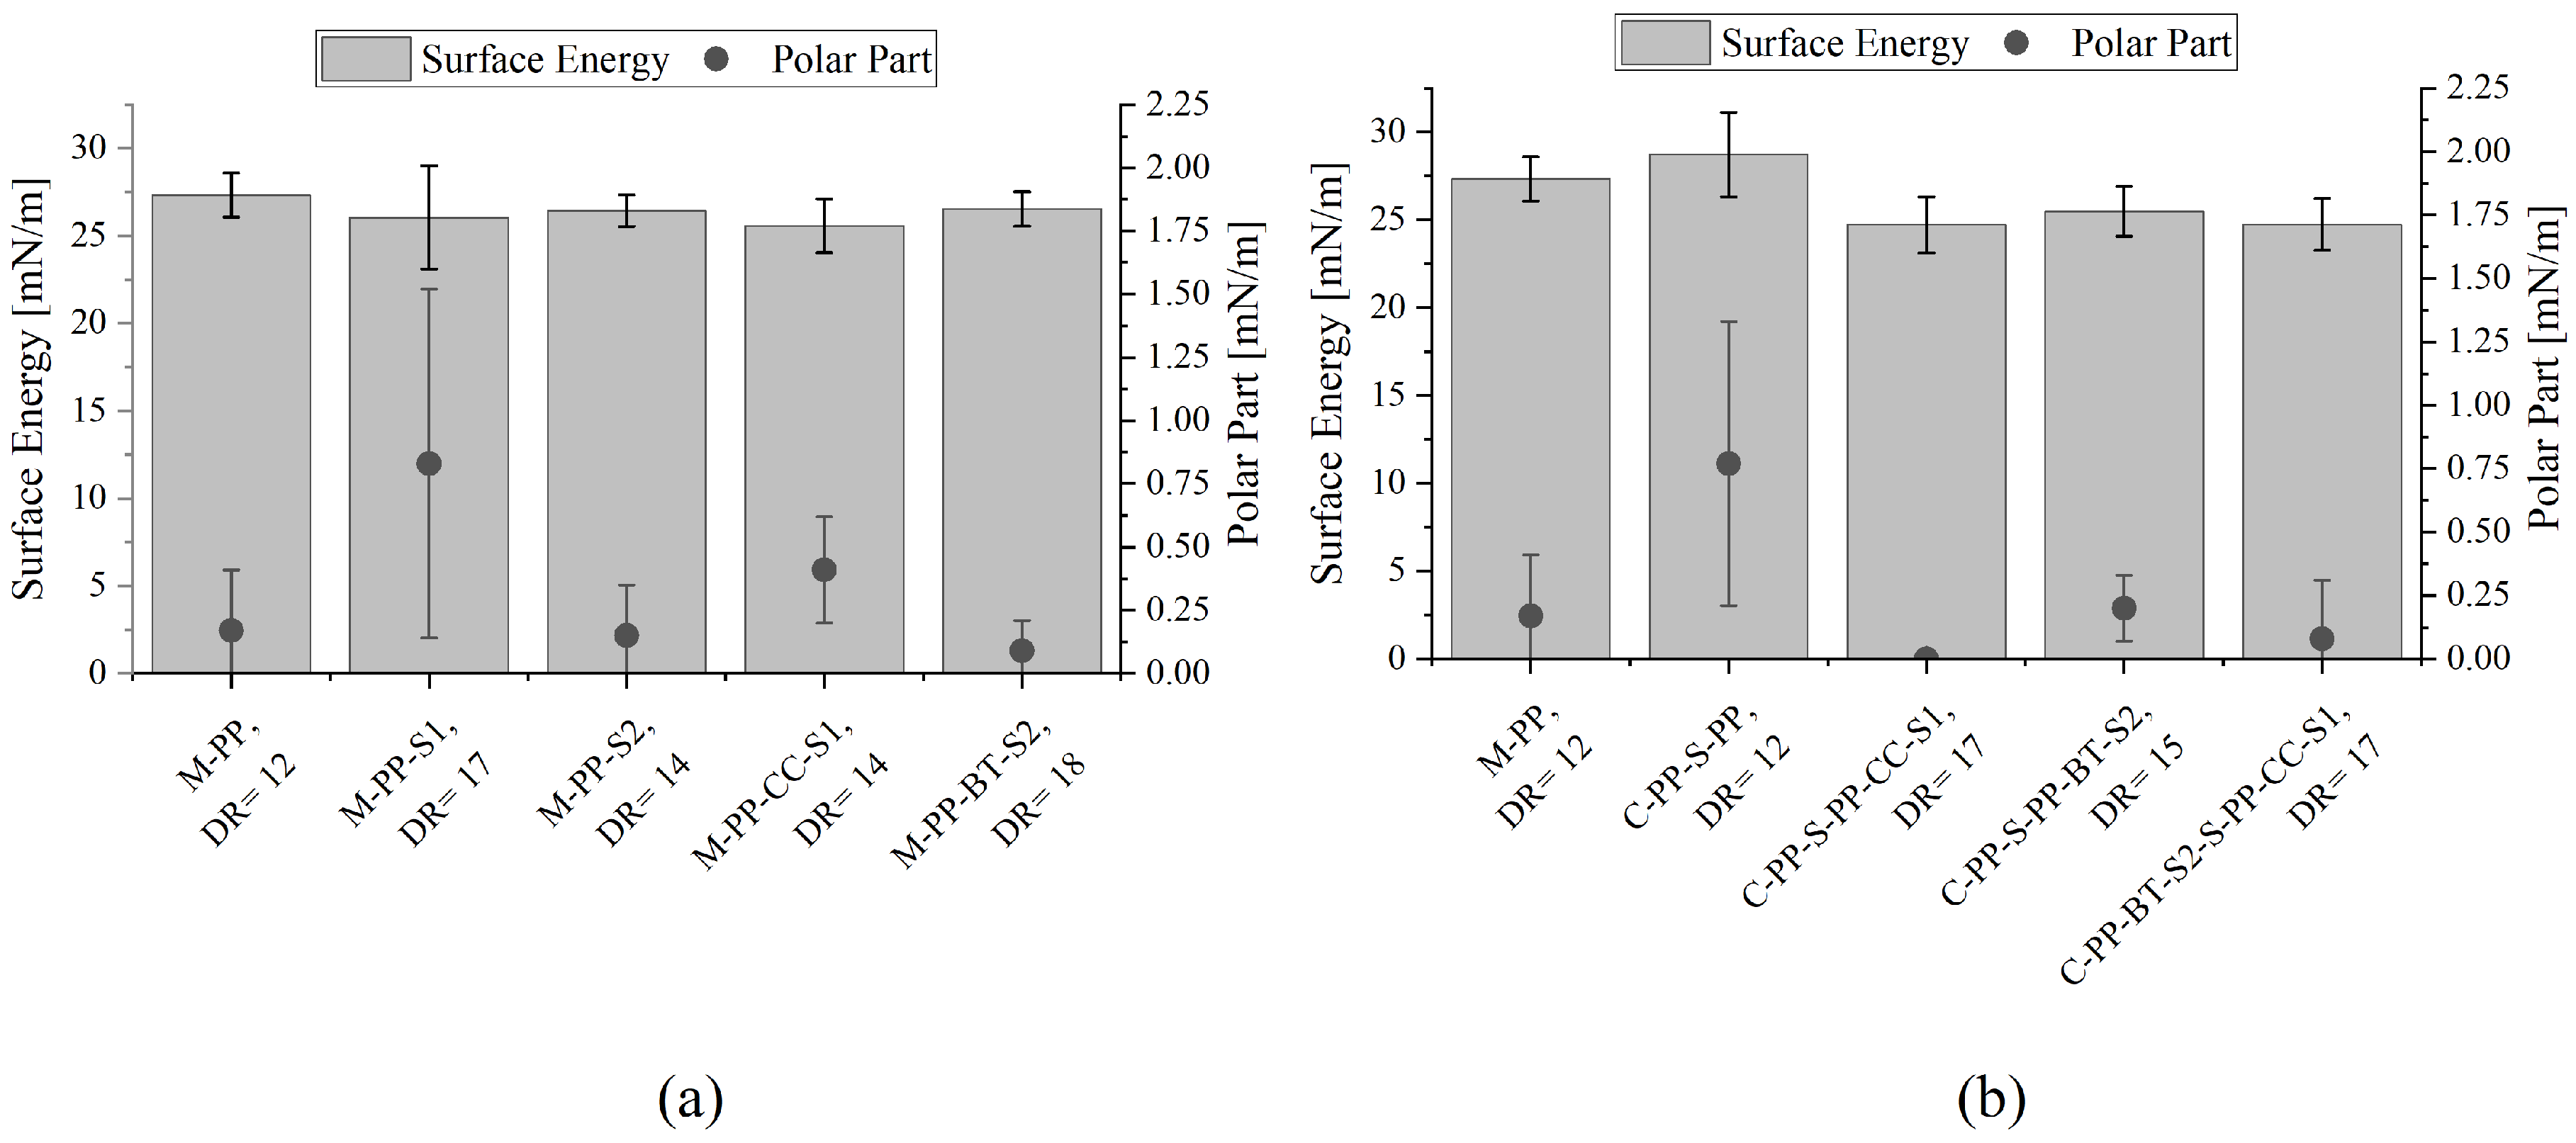
3.3. Contact Angle Measurement
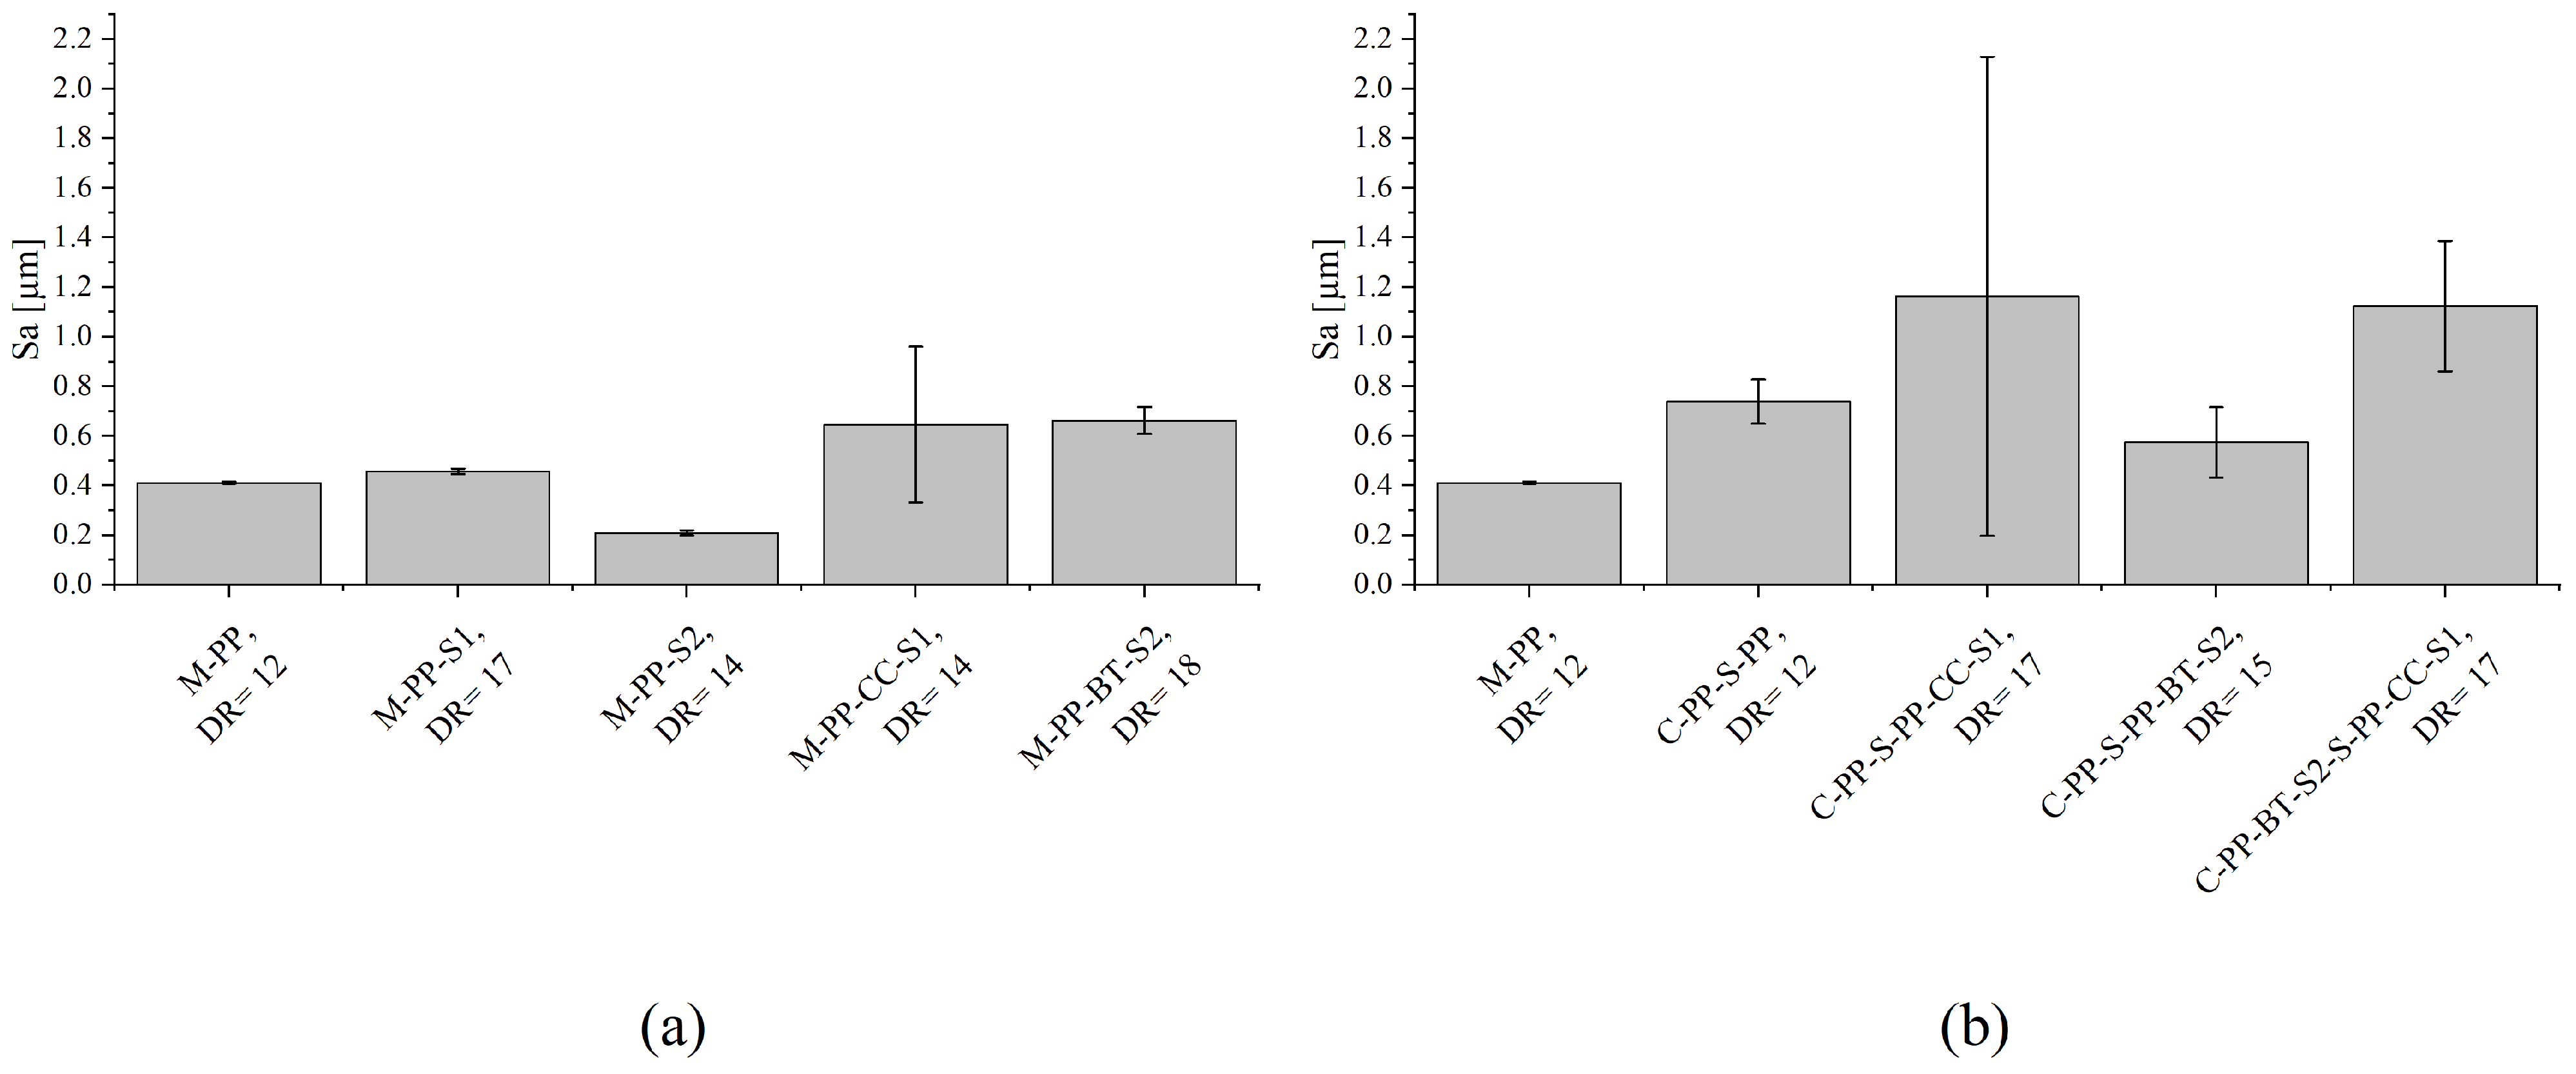
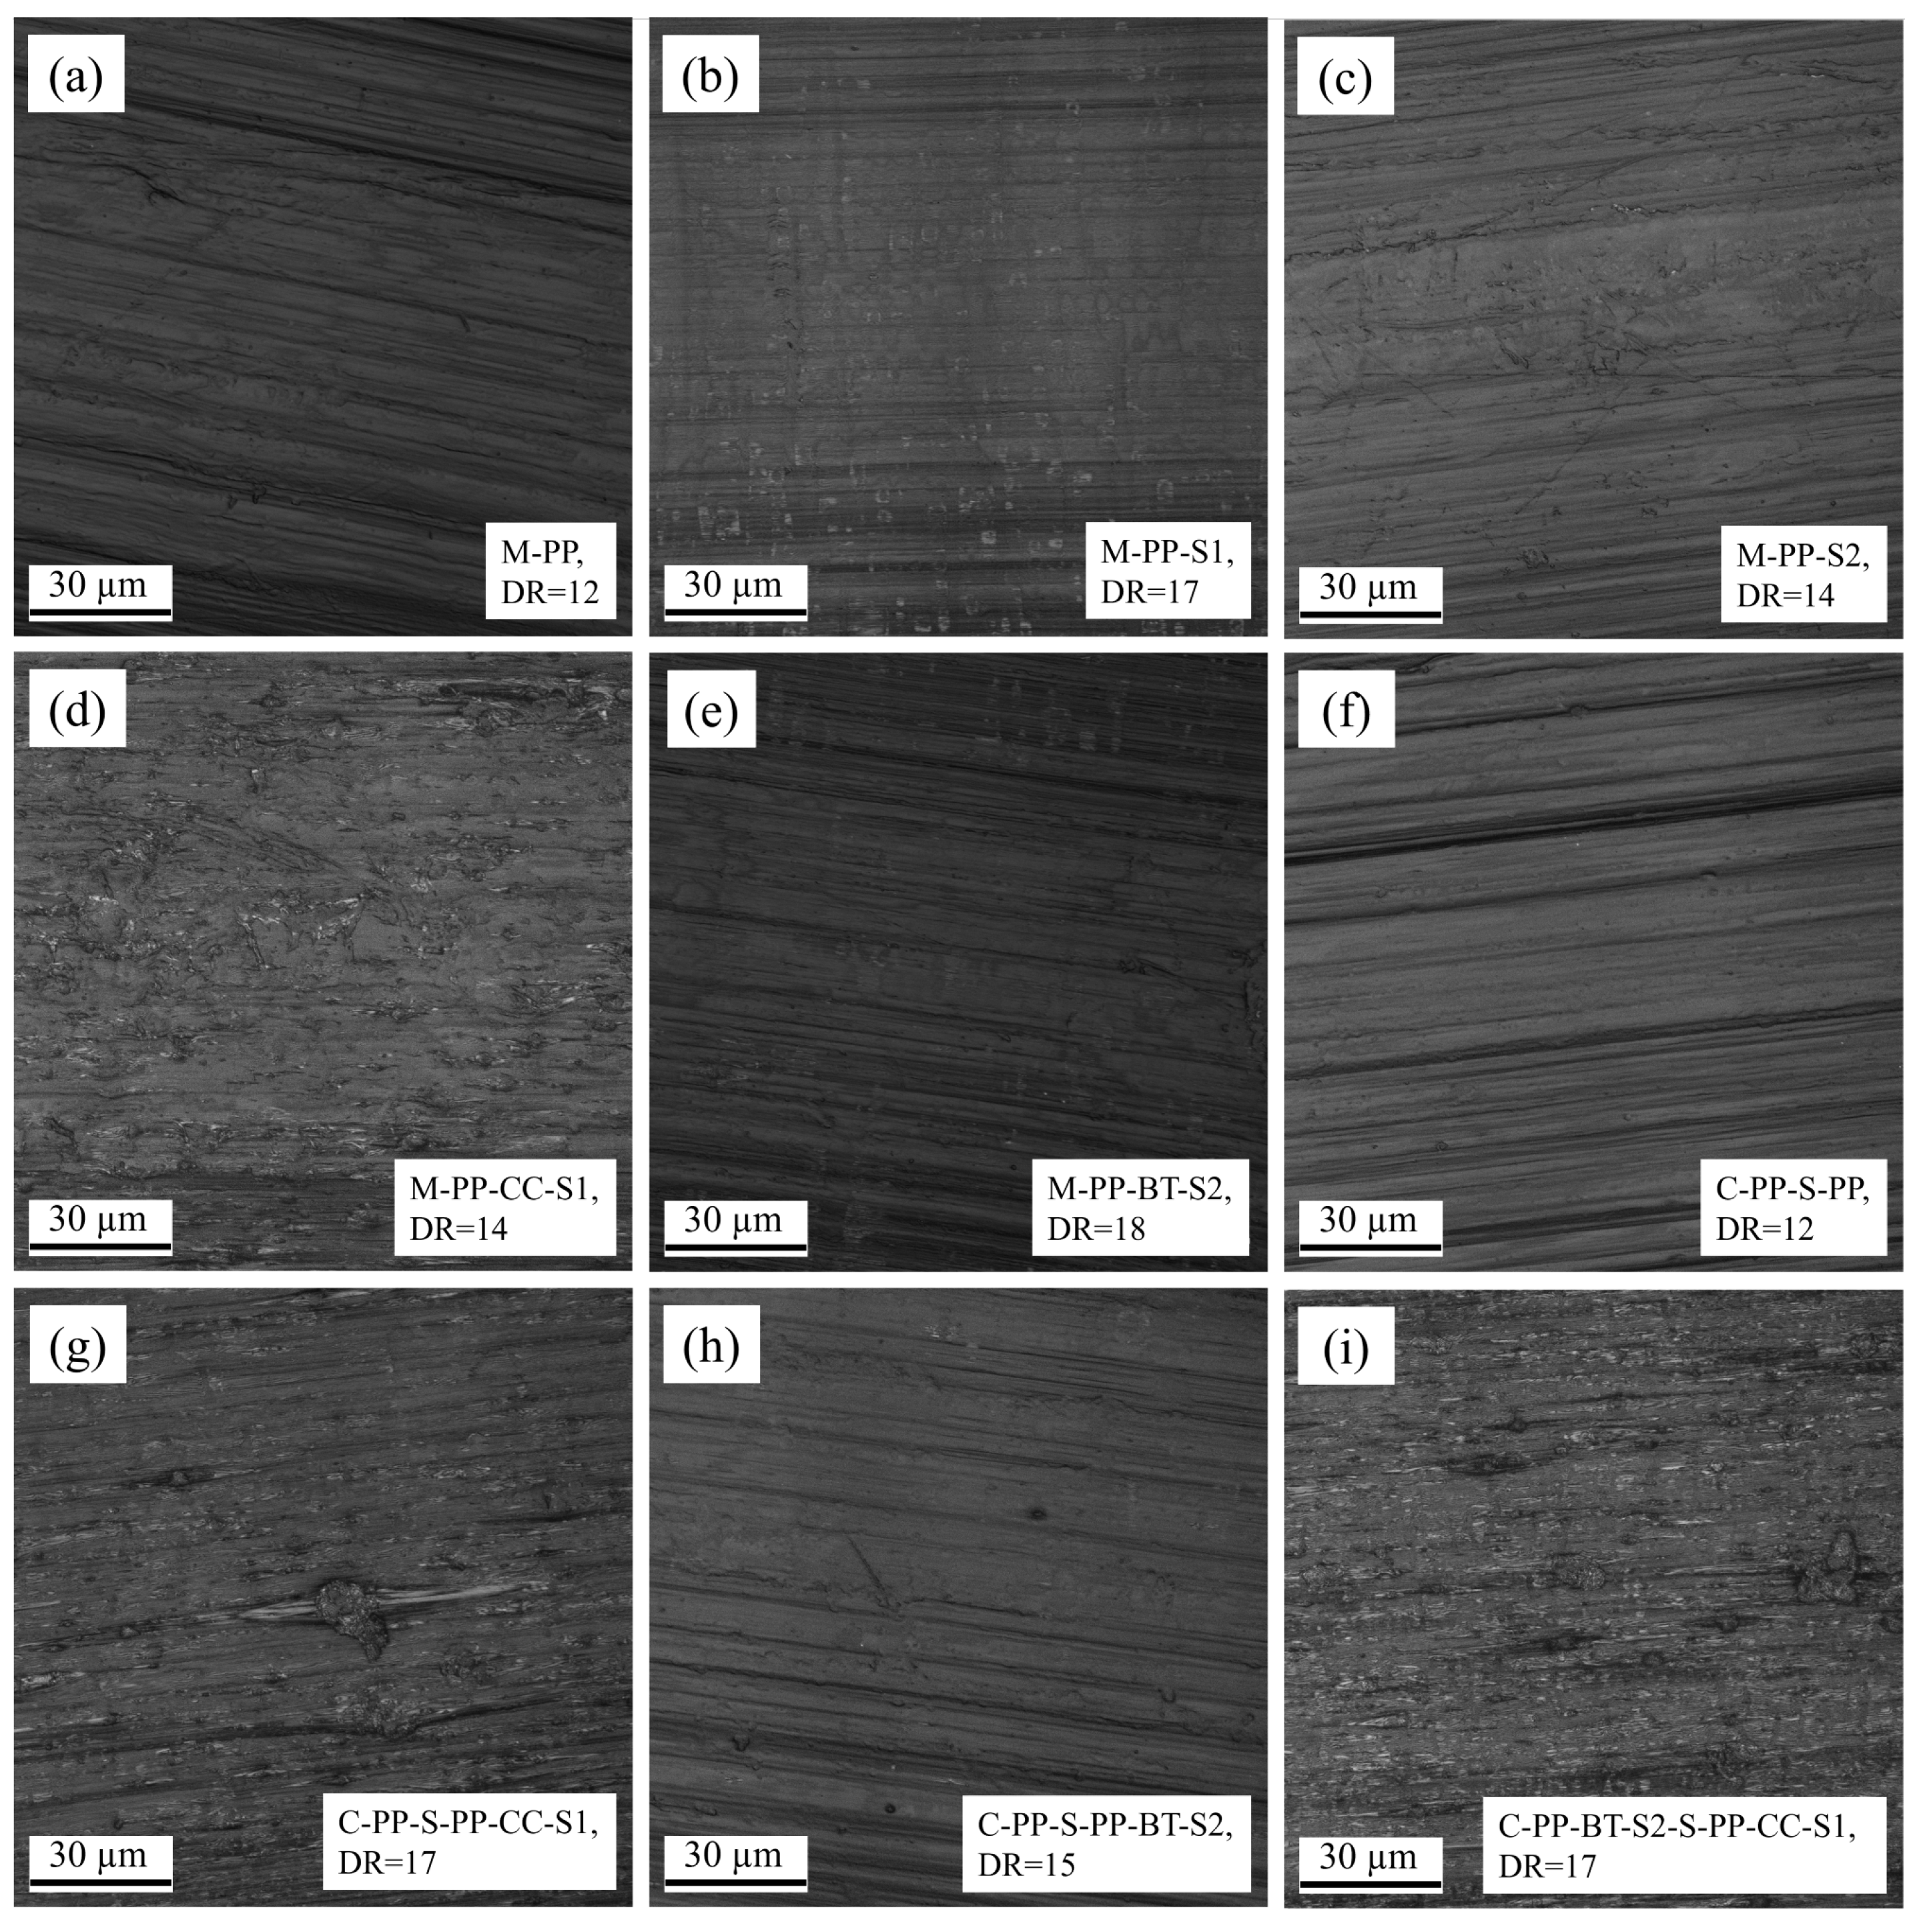
3.4. Topography Measurement
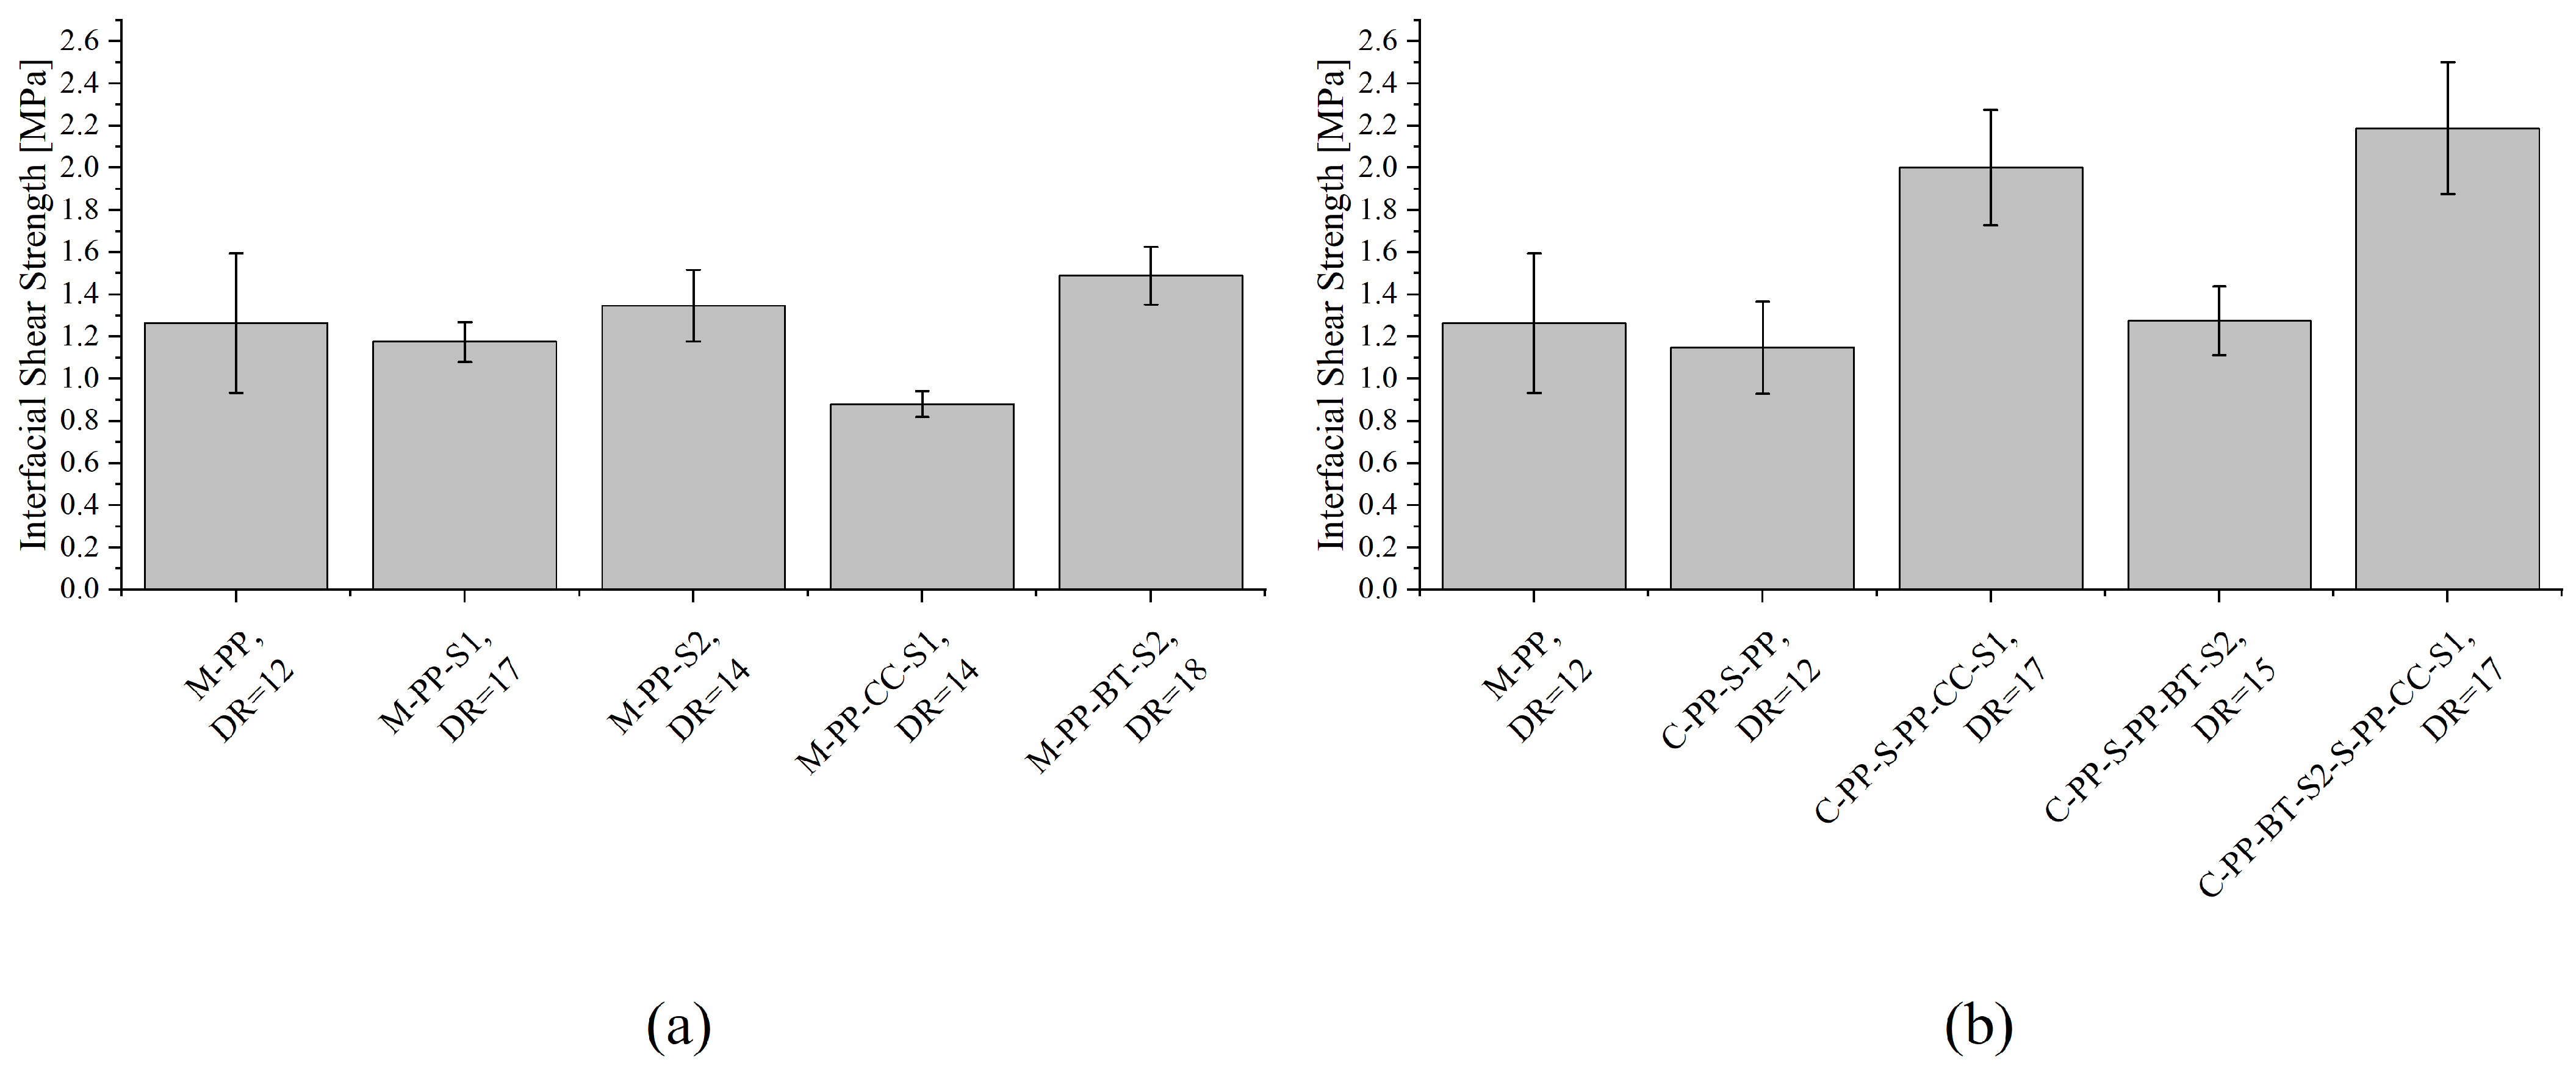
3.5. Single-Fiber Pull-Out Test
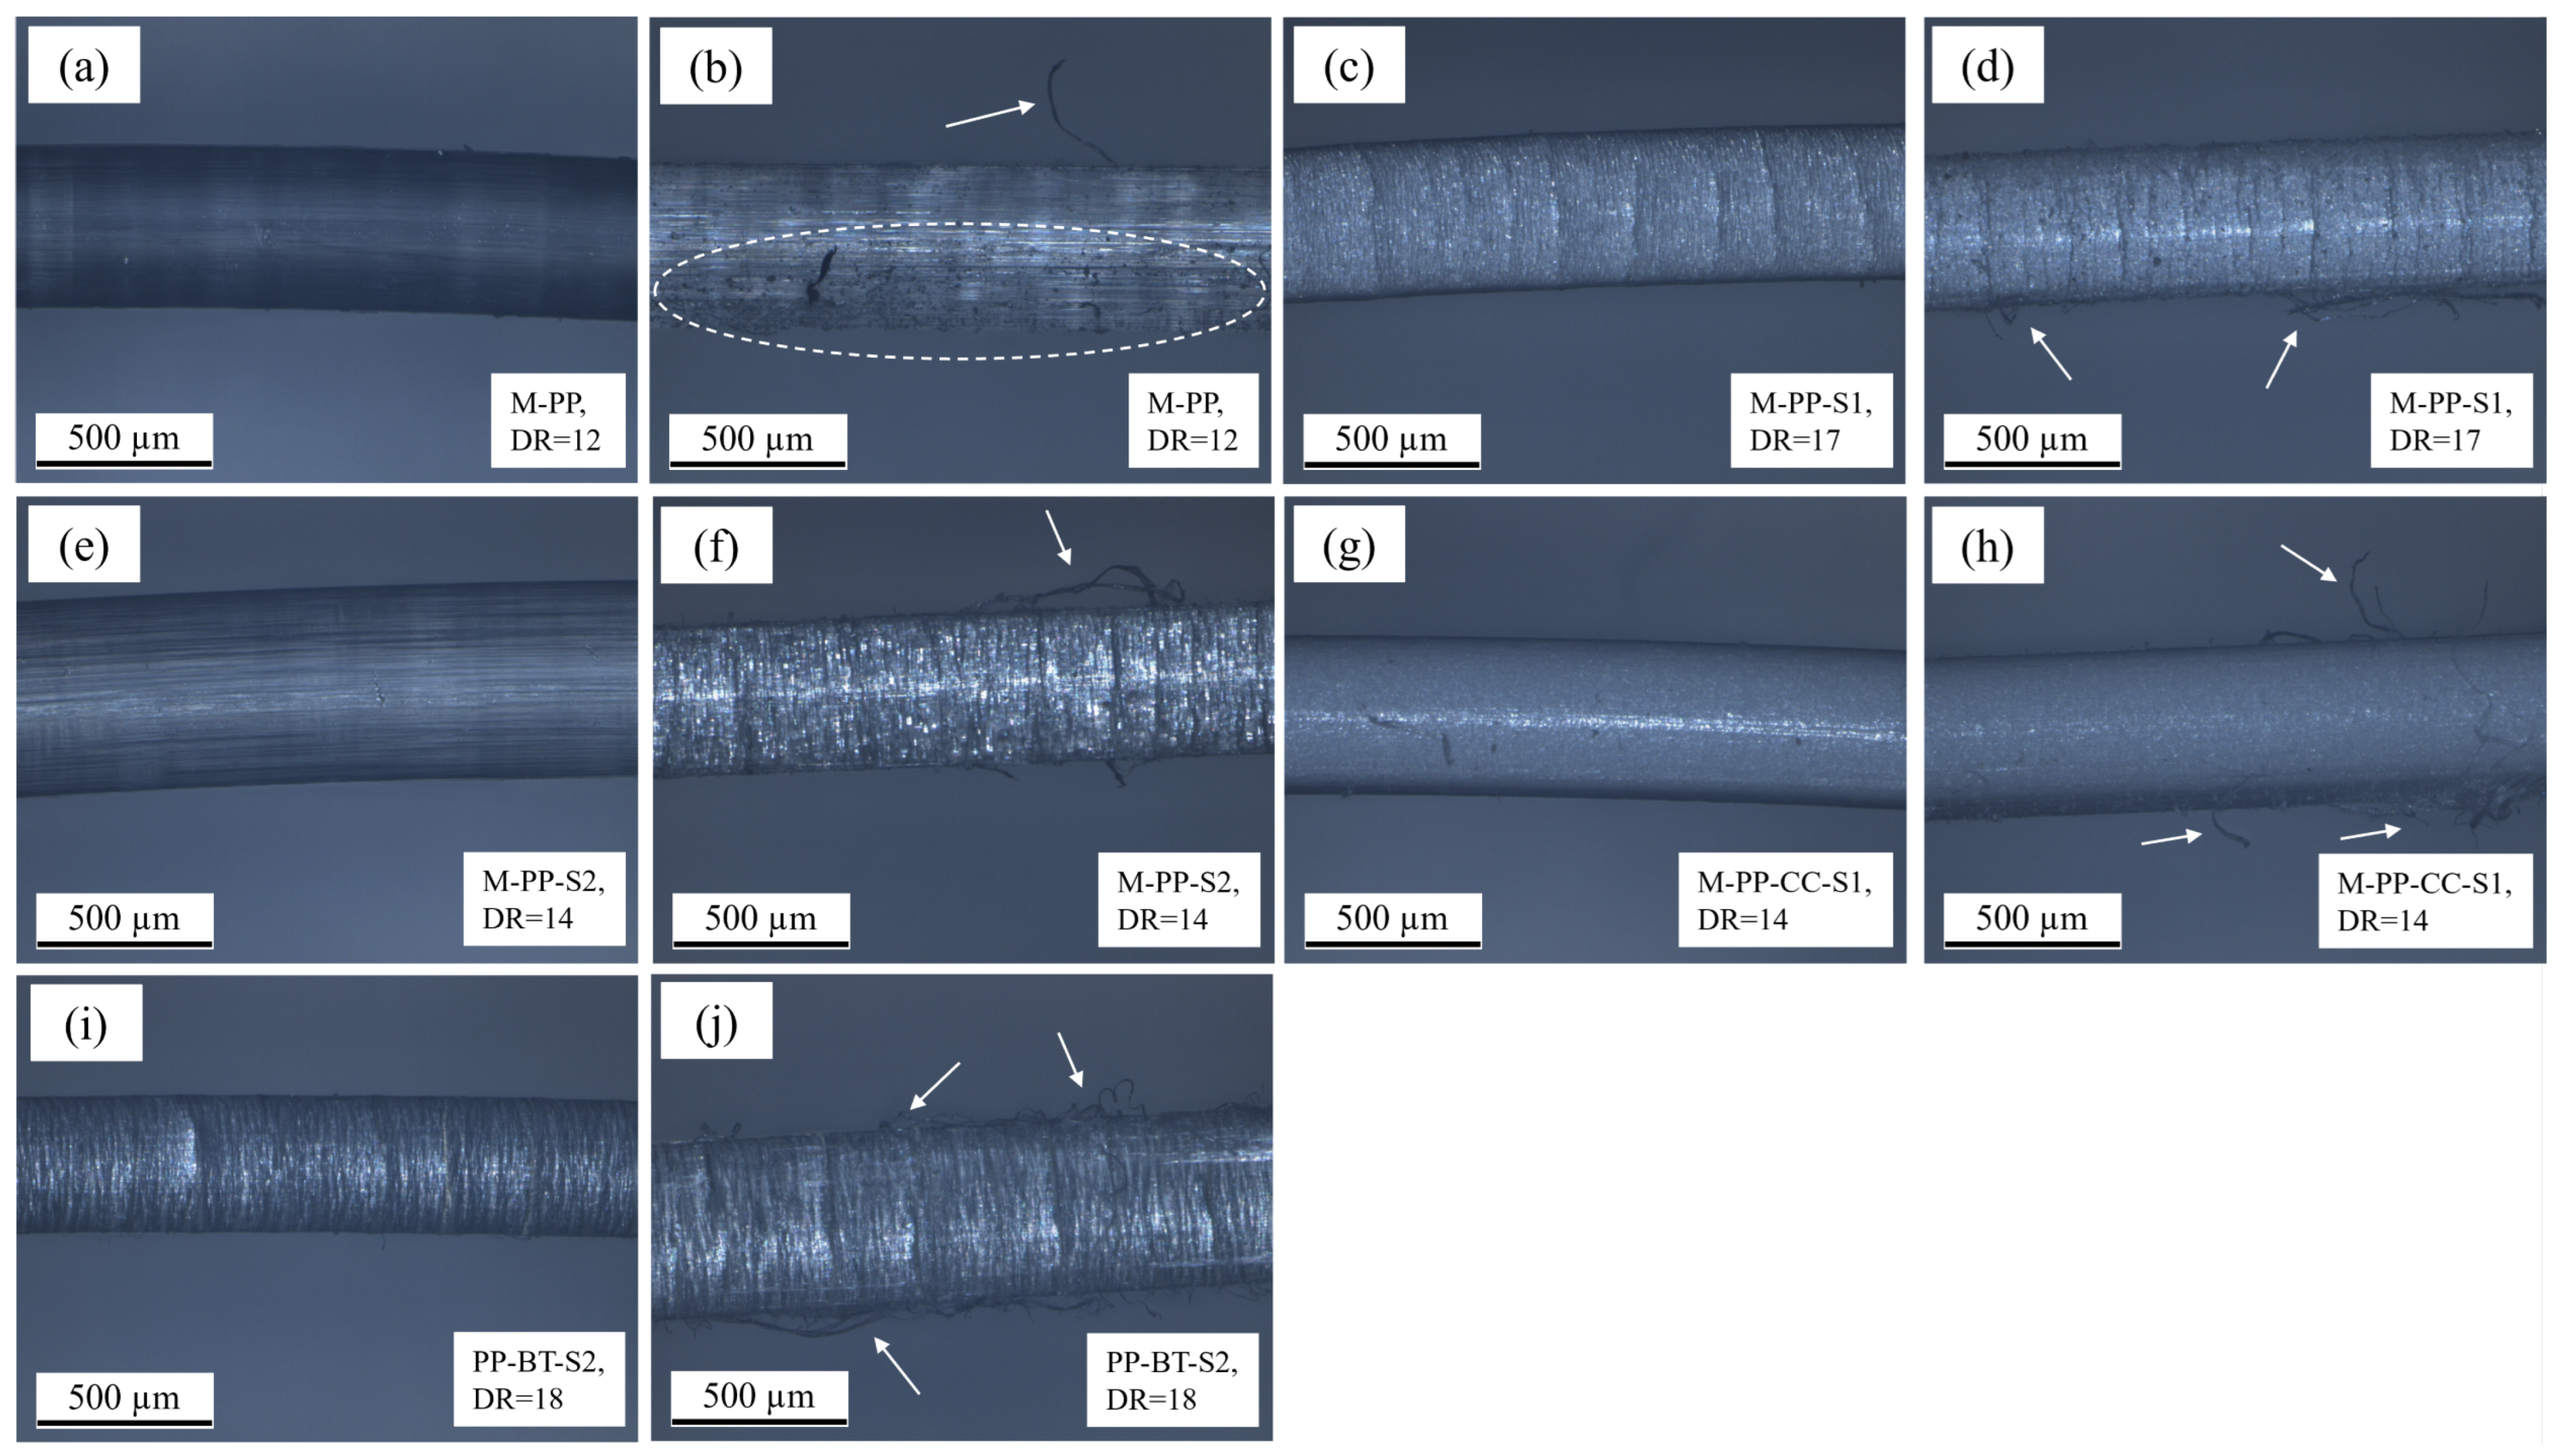
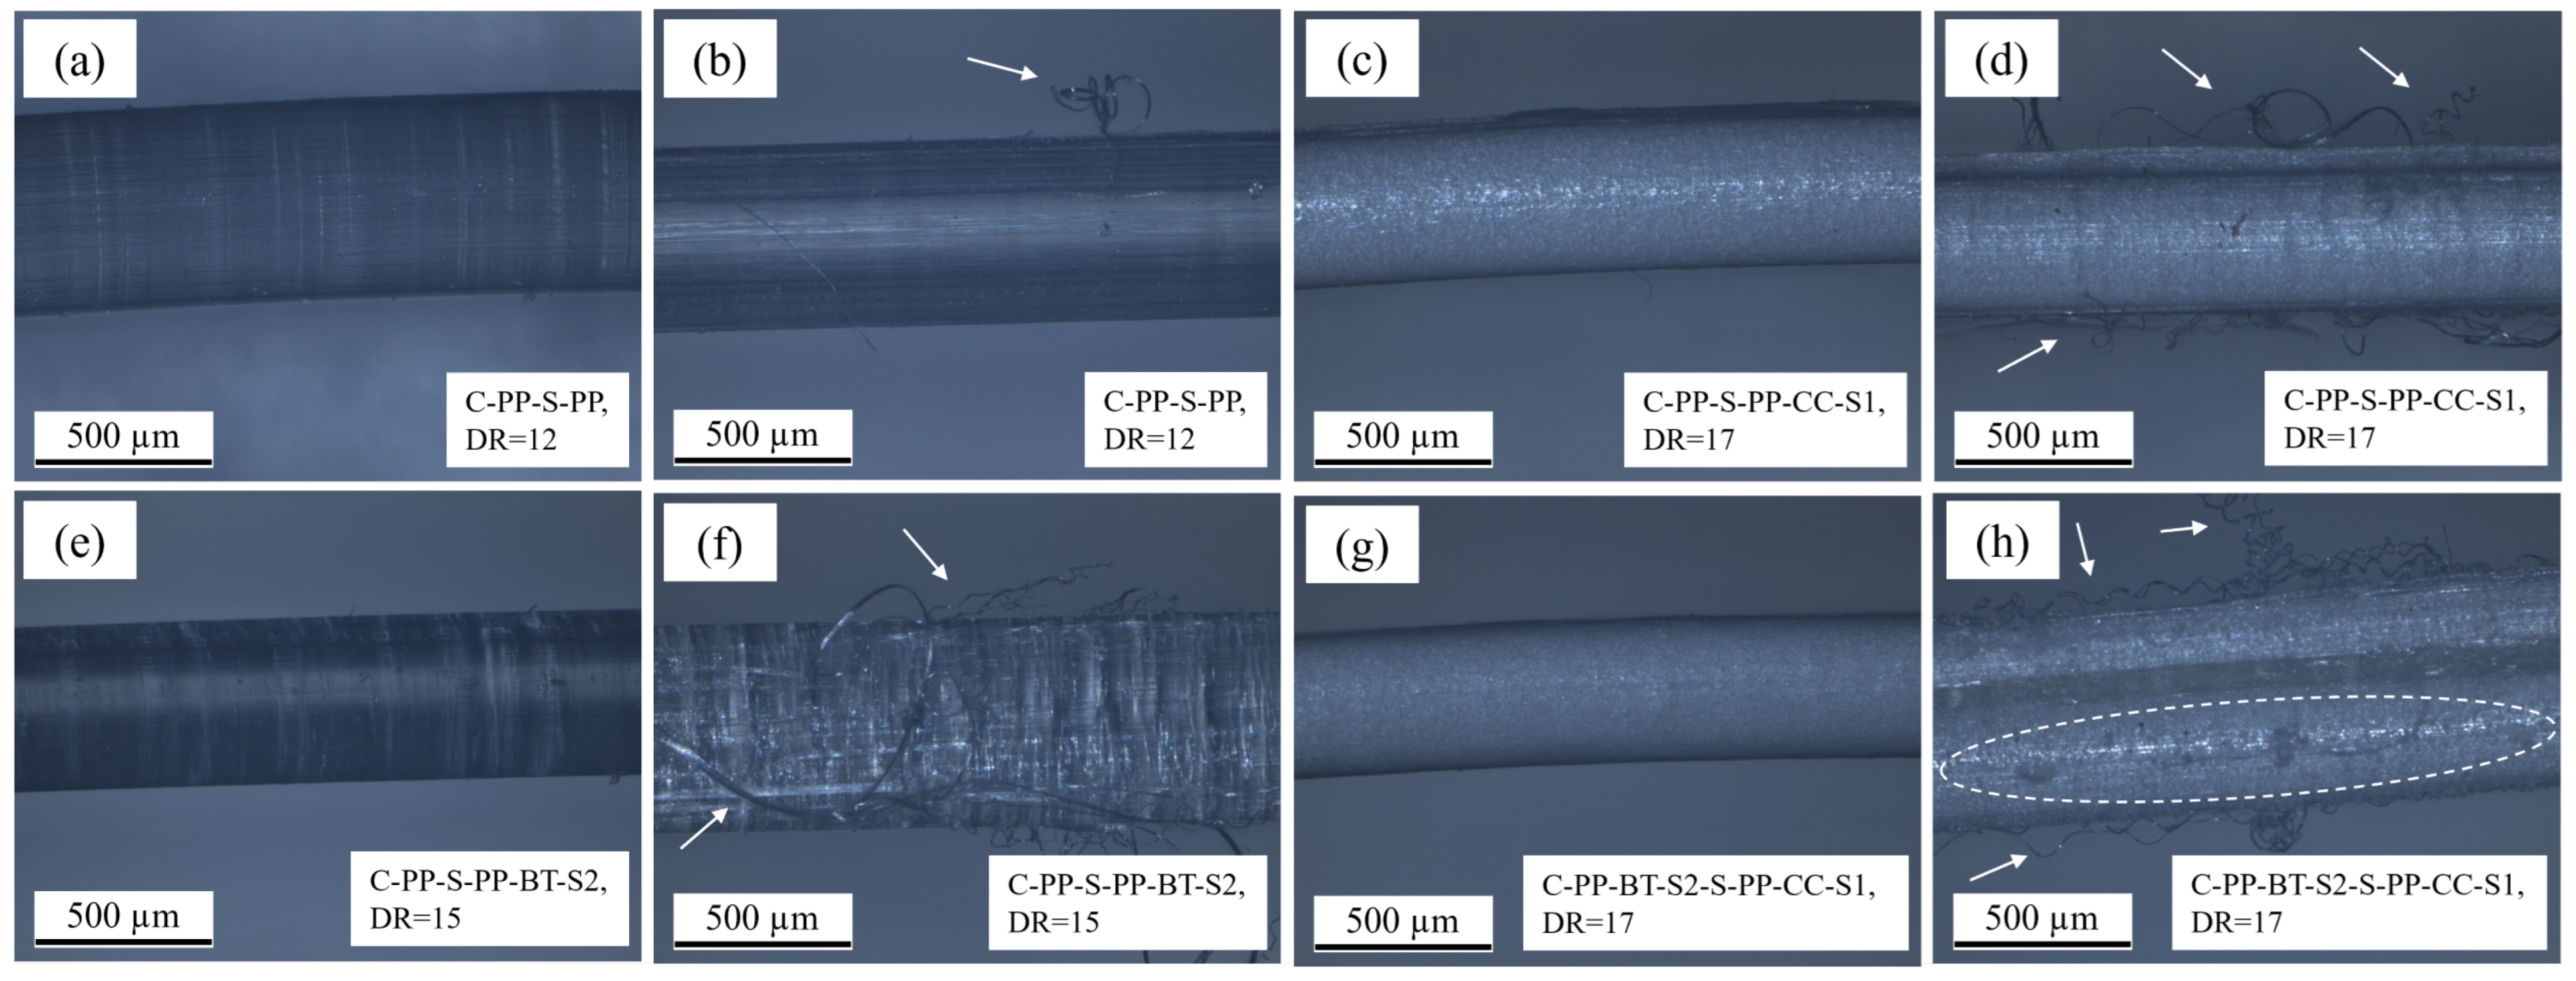
3.6. Reflected Light Microscopy
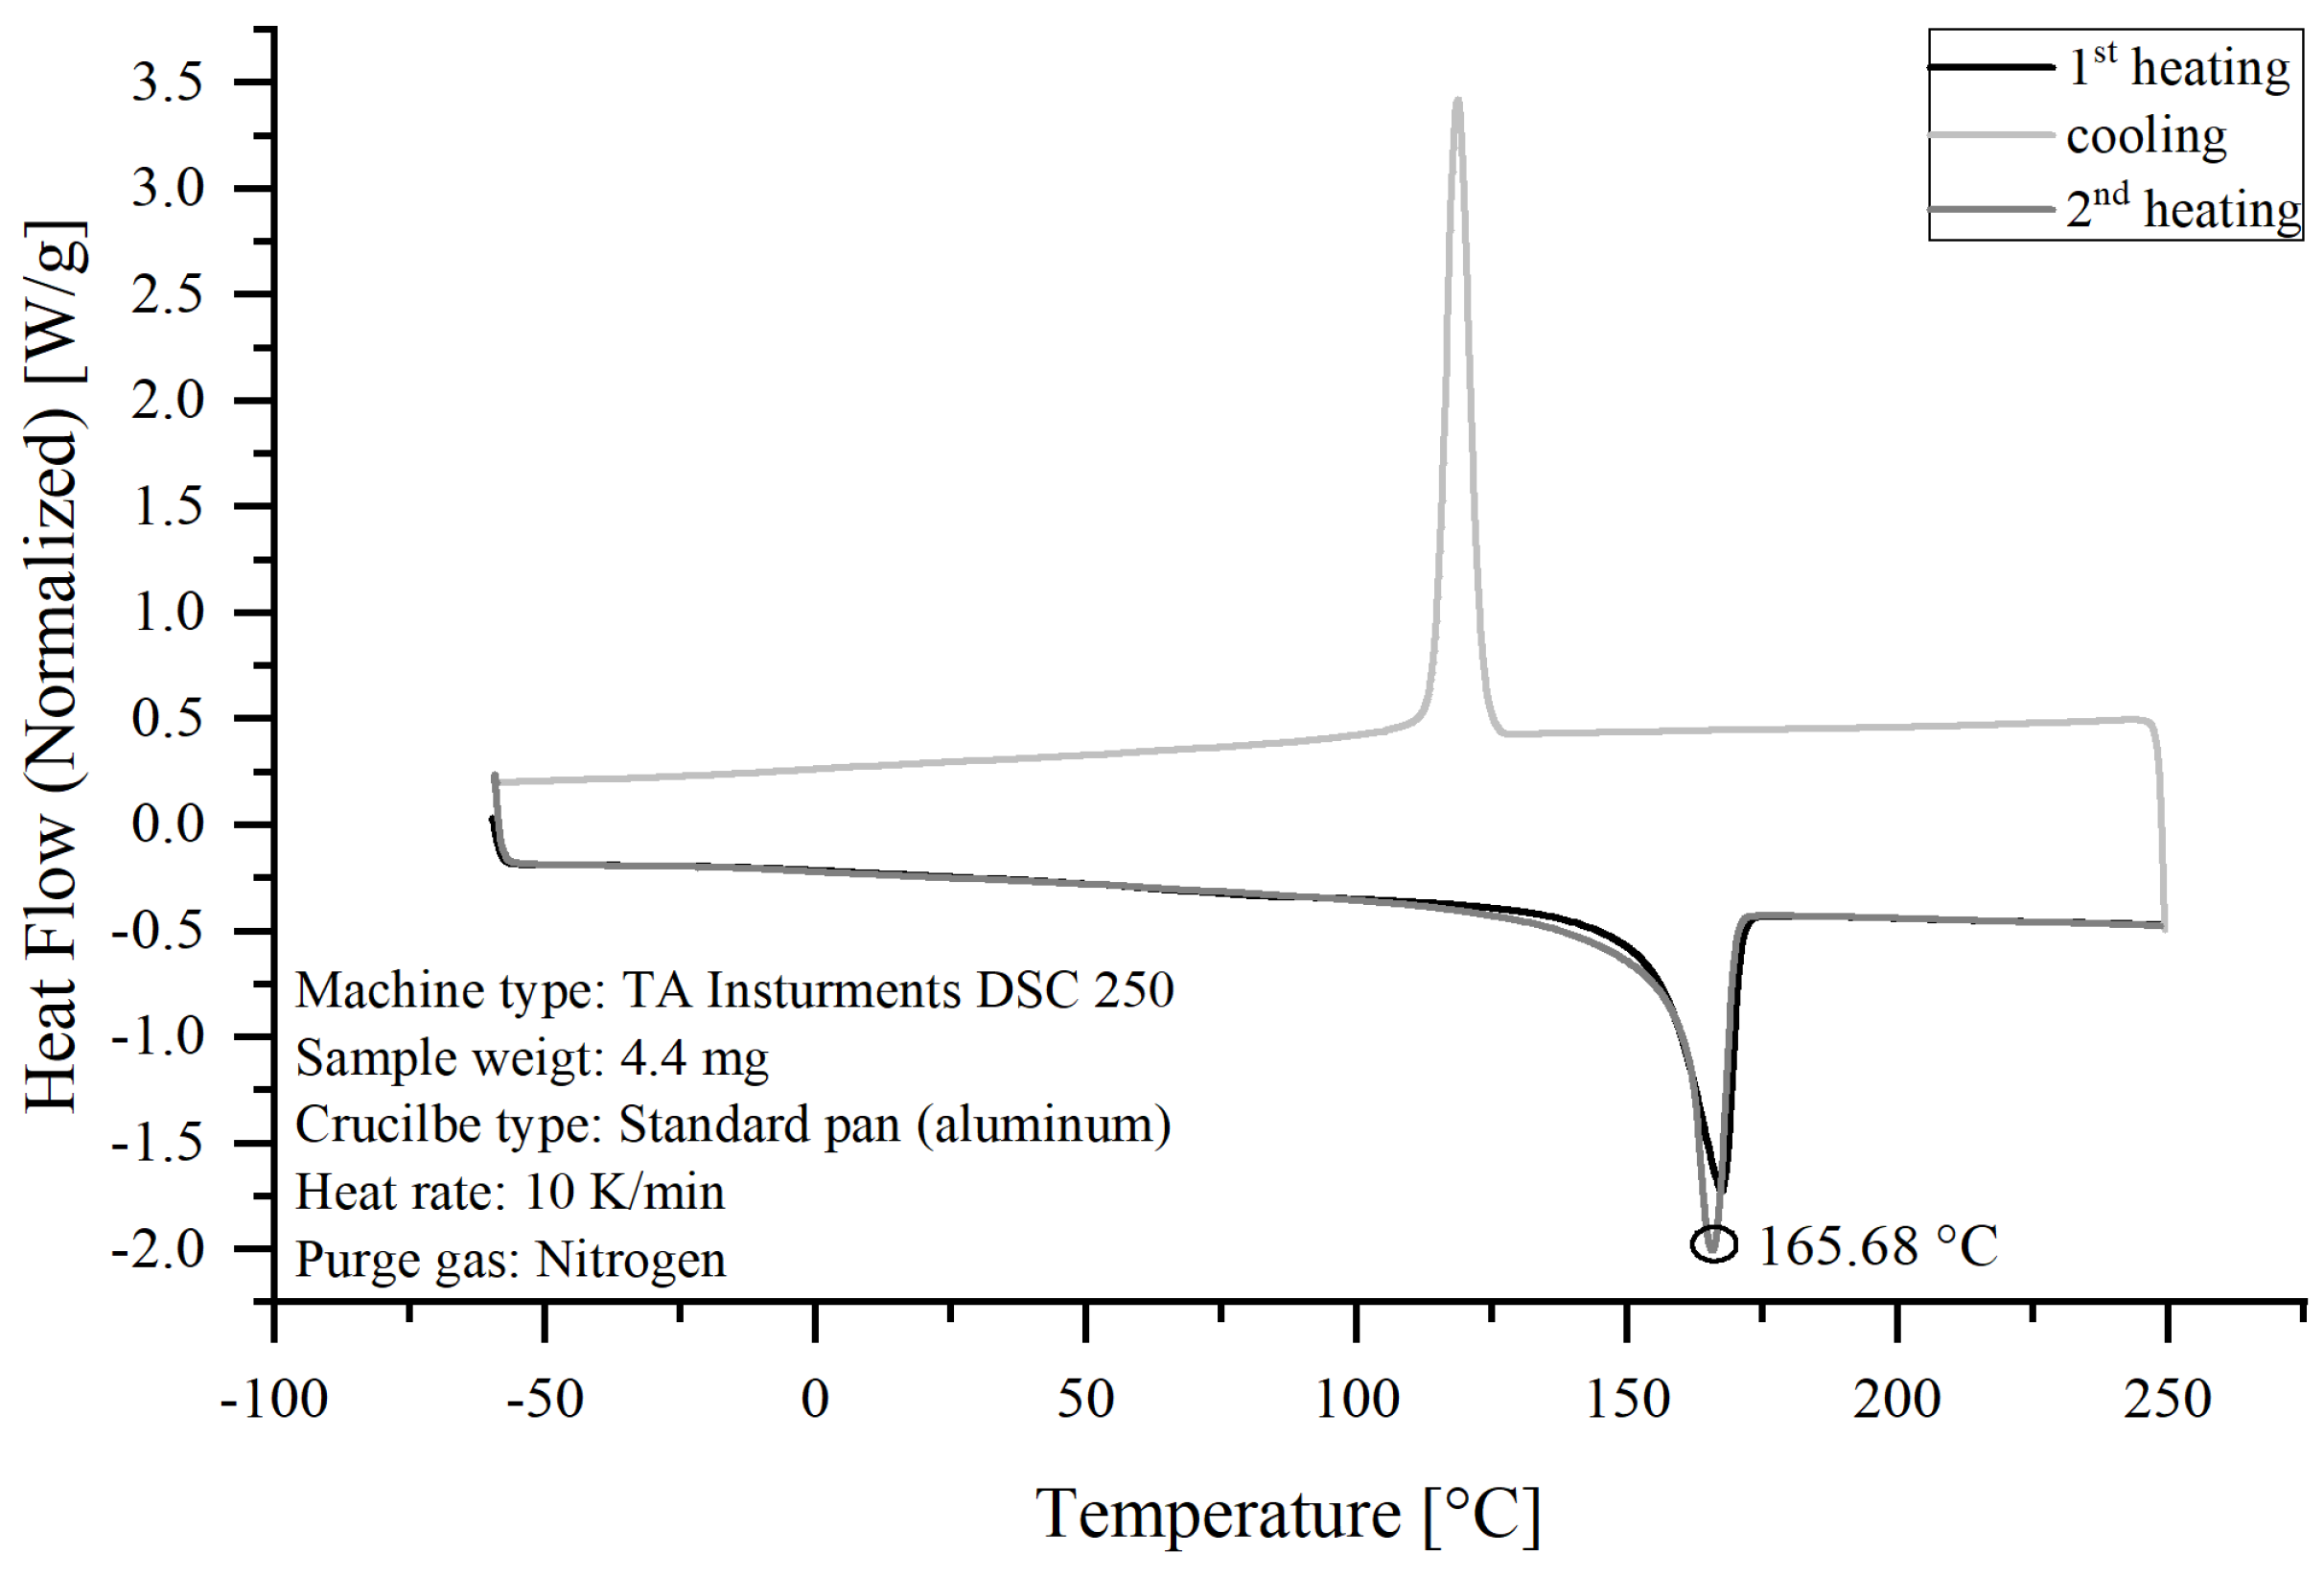
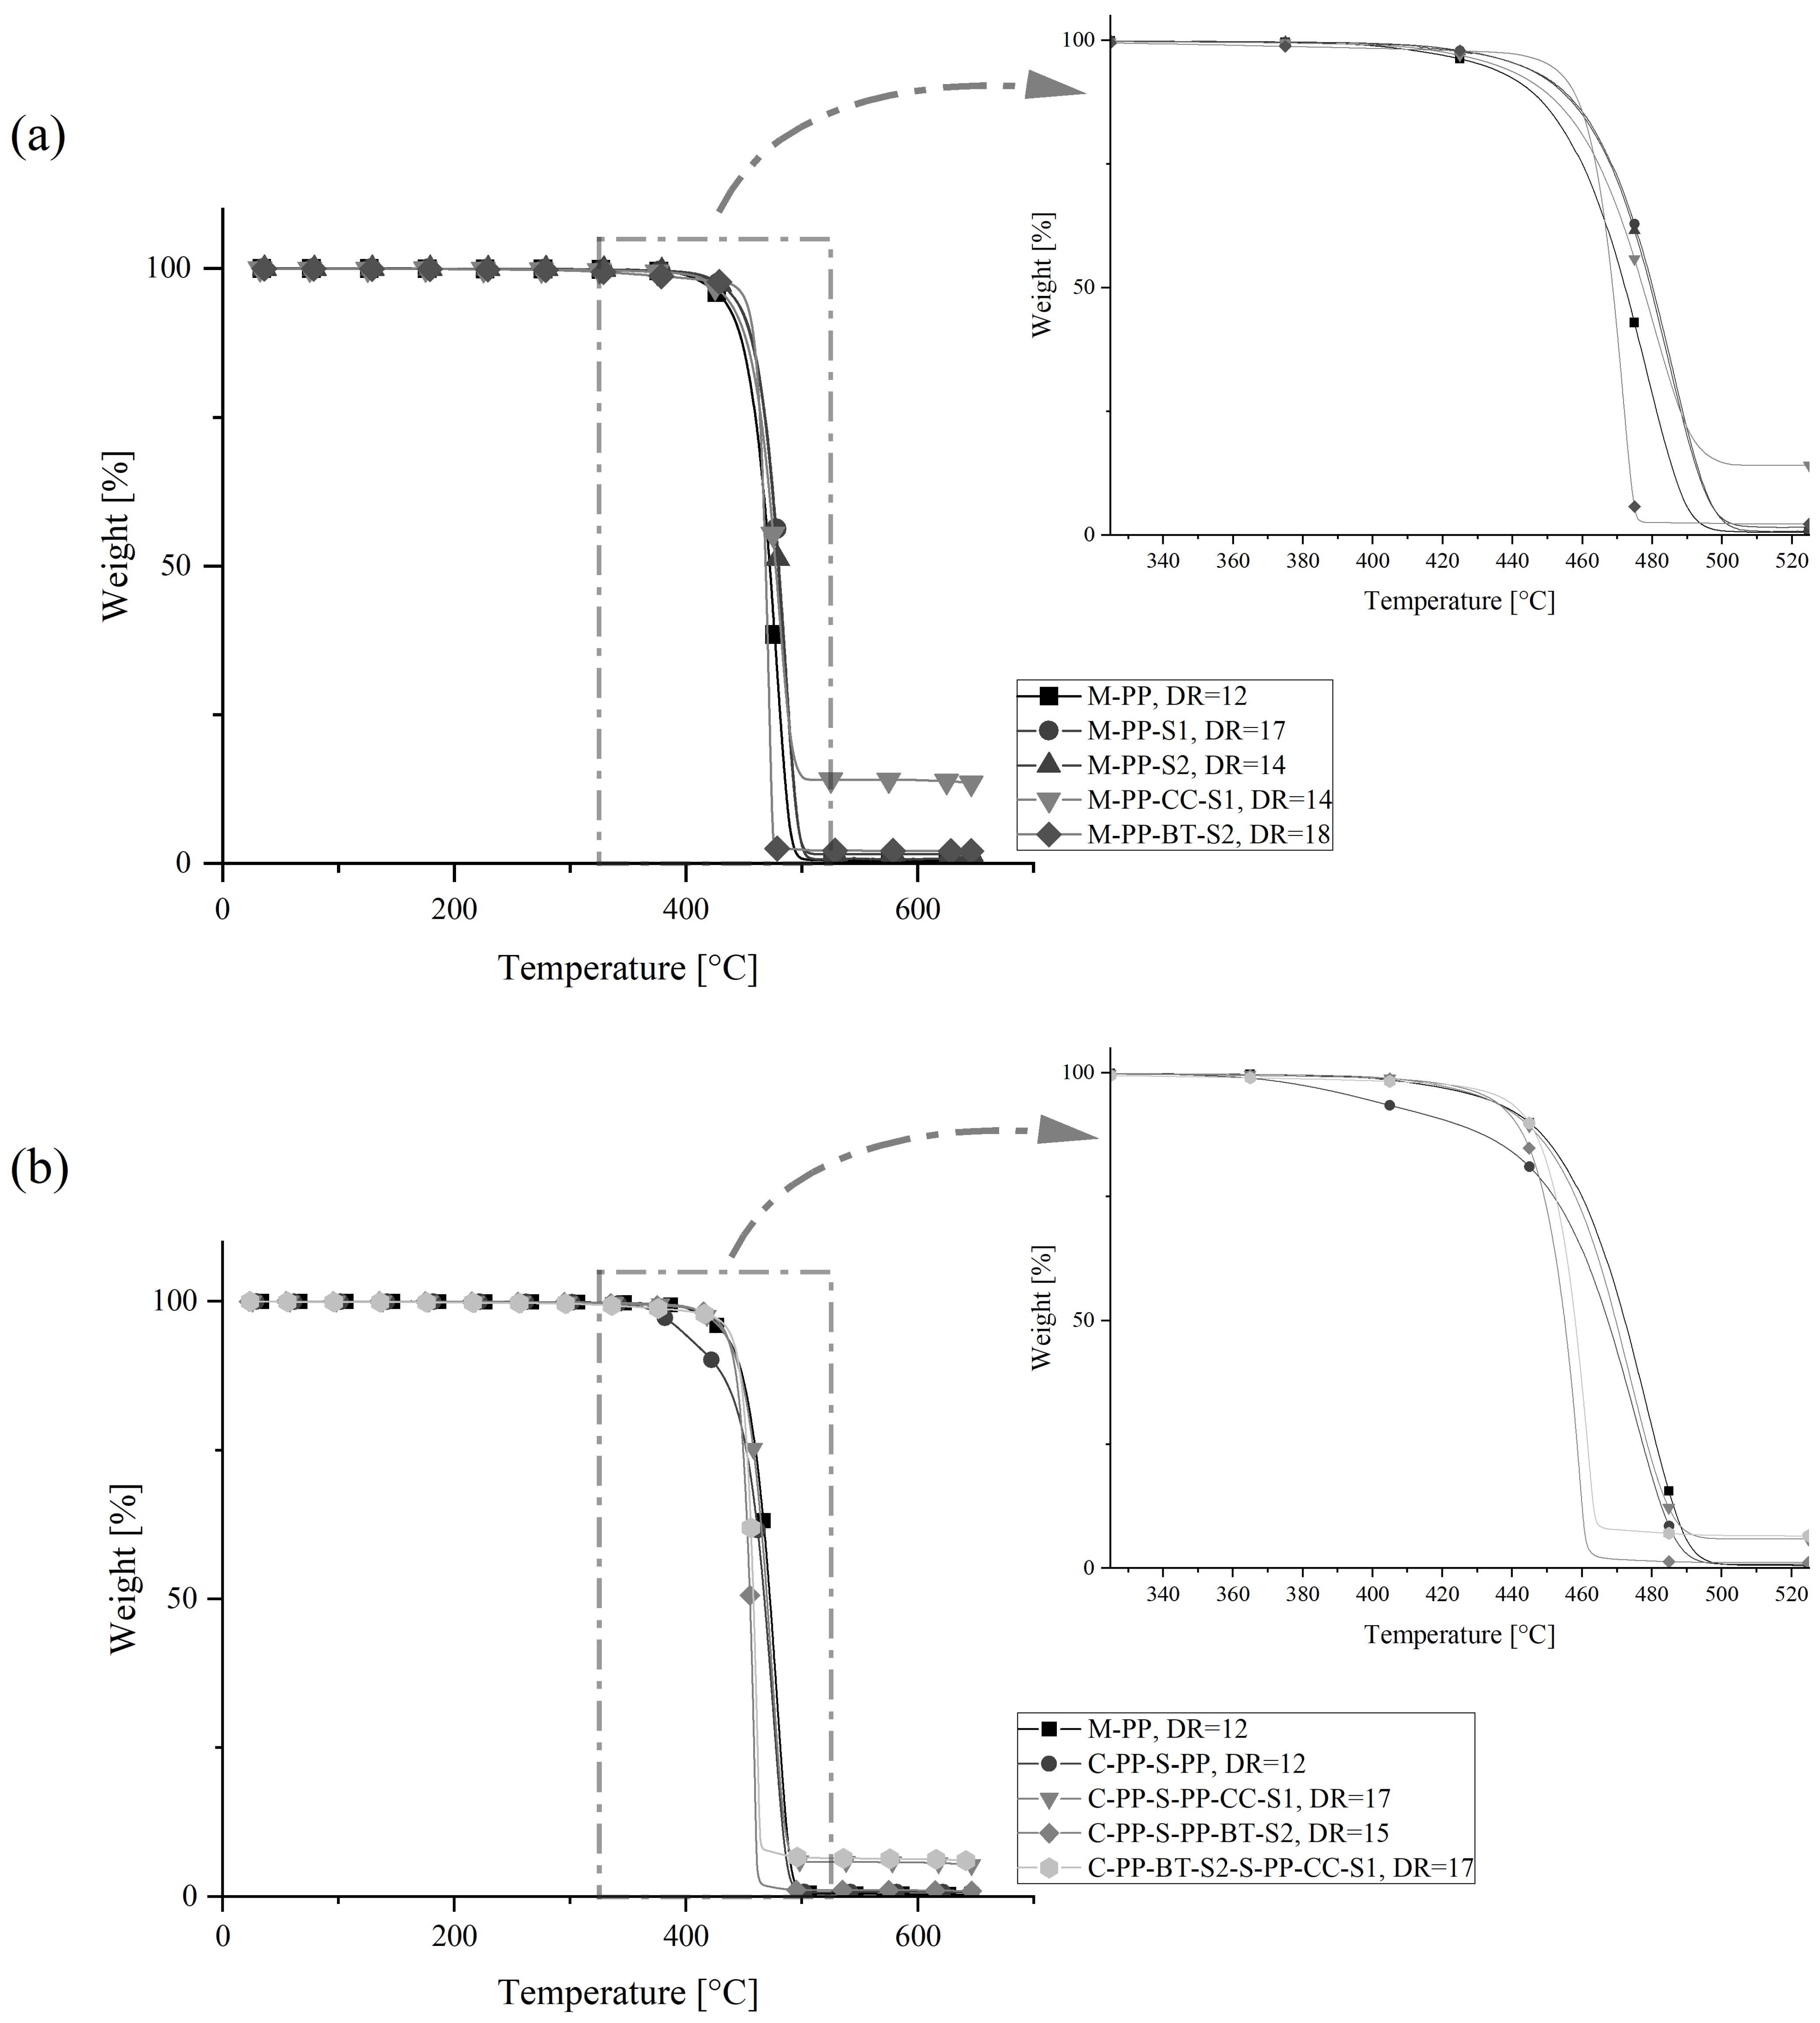
3.7. Thermograviemtric Analysis
4. Conclusions
Author Contributions
Funding
Institutional Review Board Statement
Informed Consent Statement
Data Availability Statement
Acknowledgments
Conflicts of Interest
Abbreviations
| BT | Bentonite |
| C | Core |
| c-s | core-shell |
| CLSM | Convocal Laser Scanning Microskopy |
| DR | Draw Ratio |
| DSC | Differential Scanning Calorimetry |
| IFSS | Interfacial shear strength |
| m-m | mono-material |
| PP | Polypropylene |
| S | Shell |
| SFPT | Single Fiber Pull-out Test |
| TGA | Thermogravimetric Analysis |
| vol.% | Volume Percent |
| wt.% | Weight Percent |
References
- Afroughsabet, V.; Biolzi, L.; Ozbakkaloglu, T. High-performance fiber-reinforced concrete: A review. J. Mater. Sci. 2016, 51, 6517–6551. [Google Scholar] [CrossRef]
- Al-Shamiri, A.K.; Kim, J.H.; Yuan, T.F.; Yoon, Y.S. Modeling the compressive strength of high-strength concrete: An extreme learning approach. Constr. Build. Mater. 2019, 208, 204–219. [Google Scholar] [CrossRef]
- Assi, L.N.; Carter, K.; Deaver, E.; Ziehl, P. Review of availability of source materials for geopolymer/sustainable concrete. J. Clean. Prod. 2020, 263, 121477. [Google Scholar] [CrossRef]
- Menna, C.; Mata-Falcón, J.; Bos, F.P.; Vantyghem, G.; Ferrara, L.; Asprone, D.; Salet, T.; Kaufmann, W. Opportunities and challenges for structural engineering of digitally fabricated concrete. Cem. Concr. Res. 2020, 133, 106079. [Google Scholar] [CrossRef]
- Achamyeleh, T.; Çamur, H.; Savaş, M.A.; Evcil, A. Mechanical strength variability of deformed reinforcing steel bars for concrete structures in Ethiopia. Sci. Rep. 2022, 12, 2600. [Google Scholar] [CrossRef]
- Fuhaid, A.F.A.; Niaz, A. Carbonation and Corrosion Problems in Reinforced Concrete Structures. Buildings 2022, 12, 586. [Google Scholar] [CrossRef]
- Polónyi, S. Zuviel Stahl im Beton? Beton- Stahlbetonbau 2014, 109, 628–636. [Google Scholar] [CrossRef]
- Balafas, I.; Burgoyne, C.J. Modeling the Structural Effects of Rust in Concrete Cover. J. Eng. Mech. 2011, 137, 175–185. [Google Scholar] [CrossRef]
- Kim, C.Y.; Kim, J.K. Numerical analysis of localized steel corrosion in concrete. Constr. Build. Mater. 2008, 22, 1129–1136. [Google Scholar] [CrossRef]
- Cui, Z.; Alipour, A. Concrete cover cracking and service life prediction of reinforced concrete structures in corrosive environments. Constr. Build. Mater. 2018, 159, 652–671. [Google Scholar] [CrossRef]
- Adam, M.A.; Said, M.; Mahmoud, A.A.; Shanour, A.S. Analytical and experimental flexural behavior of concrete beams reinforced with glass fiber reinforced polymers bars. Constr. Build. Mater. 2015, 84, 354–366. [Google Scholar] [CrossRef]
- Khodadadi, N.; Roghani, H.; Harati, E.; Mirdarsoltany, M.; de Caso, F.; Nanni, A. Fiber-reinforced polymer (FRP) in concrete: A comprehensive survey. Constr. Build. Mater. 2024, 432, 136634. [Google Scholar] [CrossRef]
- Paul, S.; Gettu, R.; Naidu Arnepalli, D.; Samanthula, R. Experimental evaluation of the durability of glass Textile-Reinforced concrete. Constr. Build. Mater. 2023, 406, 133390. [Google Scholar] [CrossRef]
- Zhu, D.; Bai, X.; Yao, Q.; Rahman, M.Z.; Li, X.; Yang, T.; Guo, S. Effects of volume fraction and surface coating of textile yarns on the tensile performance of AR-glass textile reinforced concrete. J. Build. Eng. 2023, 71, 106420. [Google Scholar] [CrossRef]
- Zhang, M.; Deng, M. Tensile behavior of textile-reinforced composites made of highly ductile fiber-reinforced concrete and carbon textiles. J. Build. Eng. 2022, 57, 104824. [Google Scholar] [CrossRef]
- Zhang, Q.; Wei, Z.Y.; Gu, X.L.; Yang, Q.C.; Li, S.Y.; Zhao, Y.S. Confinement behavior and stress–strain response of square concrete columns strengthened with carbon textile reinforced concrete (CTRC) composites. Eng. Struct. 2022, 266, 114592. [Google Scholar] [CrossRef]
- Wang, H.; Shi, F.; Shen, J.; Zhang, A.; Zhang, L.; Huang, H.; Liu, J.; Jin, K.; Feng, L.; Tang, Z. Research on the self-sensing and mechanical properties of aligned stainless steel fiber-reinforced reactive powder concrete. Cem. Concr. Compos. 2021, 119, 104001. [Google Scholar] [CrossRef]
- Abdalla, J.A.; Thomas, B.S.; Hawileh, R.A. Use of hemp, kenaf and bamboo natural fiber in cement-based concrete. Mater. Today Proc. 2022, 65, 2070–2072. [Google Scholar] [CrossRef]
- Jamshaid, H.; Mishra, R.K.; Raza, A.; Hussain, U.; Rahman, M.L.; Nazari, S.; Chandan, V.; Muller, M.; Choteborsky, R. Natural Cellulosic Fiber Reinforced Concrete: Influence of Fiber Type and Loading Percentage on Mechanical and Water Absorption Performance. Materials 2022, 15, 874. [Google Scholar] [CrossRef]
- Yuan, Z.; Jia, Y. Mechanical properties and microstructure of glass fiber and polypropylene fiber reinforced concrete: An experimental study. Constr. Build. Mater. 2021, 266, 121048. [Google Scholar] [CrossRef]
- Mechtcherine, V.; Slowik, V.; Kabele, P. (Eds.) Strain-Hardening Cement-Based Composites; RILEM Bookseries; Springer: Dordrecht, The Netherlands, 2018; Volume 15. [Google Scholar] [CrossRef]
- Khan, M.B.; Waqar, A.; Bheel, N.; Shafiq, N.; Hamah Sor, N.; Radu, D.; Benjeddou, O. Optimization of Fresh and Mechanical Characteristics of Carbon Fiber-Reinforced Concrete Composites Using Response Surface Technique. Buildings 2023, 13, 852. [Google Scholar] [CrossRef]
- Sigrüner, M.; Hüsken, G.; Pirskawetz, S.; Herz, J.; Muscat, D.; Strübbe, N. Pull–out behavior of polymer fibers in concrete. J. Polym. Sci. 2023, 61, 2708–2720. [Google Scholar] [CrossRef]
- Naaman, A.E. Engineered Steel Fibers with Optimal Properties for Reinforcement of Cement Composites. J. Adv. Concr. Technol. 2003, 1, 241–252. [Google Scholar] [CrossRef]
- Wölfel, E.; Brünig, H.; Curosu, I.; Mechtcherine, V.; Scheffler, C. Dynamic Single-Fiber Pull-Out of Polypropylene Fibers Produced with Different Mechanical and Surface Properties for Concrete Reinforcement. Materials 2021, 14, 722. [Google Scholar] [CrossRef] [PubMed]
- Silva, D.A.; Betioli, A.M.; Gleize, P.; Roman, H.R.; Gómez, L.A.; Ribeiro, J. Degradation of recycled PET fibers in Portland cement-based materials. Cem. Concr. Res. 2005, 35, 1741–1746. [Google Scholar] [CrossRef]
- Osswald, T.A.; Menges, G. Material Science of Polymers for Engineers, 3rd ed.; Hanser Publishers: Munich, Germany; Cincinnati, OH, USA, 2012. [Google Scholar]
- Carothers, W.H.; Hill, J.W. Studies of polymerization and ring formation. XV. Artificial fibers from synthetic linear condensation superpolymers. J. Am. Chem. Soc. 1932, 54, 1579–1587. [Google Scholar] [CrossRef]
- Jäckel, K. Ein Beitrag zur Kaltverstreckung der Hochpolymeren. Colloid Polym. Sci. 1954, 137, 130–162. [Google Scholar] [CrossRef]
- Wills, A.J.; Capaccio, G.; Ward, I.M. Plastic deformation of polypropylene: Effect of molecular weight on drawing behavior and structural characteristics of ultra–high–modulus products. J. Polym. Sci. Polym. Phys. Ed. 1980, 18, 493–509. [Google Scholar] [CrossRef]
- Coppola, B.; Scarfato, P.; Incarnato, L. Morphology Development and Mechanical Properties Variation during Cold-Drawing of Polyethylene-Clay Nanocomposite Fibers. Polymers 2017, 9, 235. [Google Scholar] [CrossRef]
- Sigrüner, M.; Muscat, D.; Strübbe, N. Investigation on pull–out behavior and interface critical parameters of polymer fibers embedded in concrete and their correlation with particular fiber properties. J. Appl. Polym. Sci. 2021, 138, 50745. [Google Scholar] [CrossRef]
- Flood, J.E.; Nulf, S.A. How molecular weight distribution and drawing temperature affect polypropylene physical properties and morphology. Polym. Eng. Sci. 1990, 30, 1504–1512. [Google Scholar] [CrossRef]
- Alonso, Y.; Martini, R.E.; Iannoni, A.; Terenzi, A.; Kenny, J.M.; Barbosa, S.E. Polyethylene/sepiolite fibers. Influence of drawing and nanofiller content on the crystal morphology and mechanical properties. Polym. Eng. Sci. 2015, 55, 1096–1103. [Google Scholar] [CrossRef]
- Herz, J.; Schusser, V.; Muscat, D.; Strübbe, N. Cold-Drawn Wood-Filled Polybutylene Succinate Macro-Fibers as a Reinforcing Material for Concrete. Polymers 2025, 17, 403. [Google Scholar] [CrossRef]
- Chantrasakul, S.; Amornsakchai, T. High strength polyethylene fibers from high density polyethylene/organoclay composites. Polym. Eng. Sci. 2007, 47, 943–950. [Google Scholar] [CrossRef]
- Li, W. PET/PP-Based Polymer Composites: Effects of Compatibilizer and Nanofillers on the Processing-Structure-Property Relationships. Ph.D. Thesis, Technische Universität Kaiserslautern, Kaiserslautern, Germany, 2009. [Google Scholar]
- Li, X.; Meng, L.; Zhang, Y.; Qin, Z.; Meng, L.; Li, C.; Liu, M. Research and Application of Polypropylene Carbonate Composite Materials: A Review. Polymers 2022, 14, 2159. [Google Scholar] [CrossRef]
- Marosi, G.; Tohl, A.; Bertalan, G.; Anna, P.; Maatoug, M.A.; Ravadits, I.; Bertóti, I.; Tóth, A. Modified interfaces in multicomponent polypropylene fibers. Compos. Part A Appl. Sci. Manuf. 1998, 29, 1305–1311. [Google Scholar] [CrossRef]
- Salaün, F.; Creach, G.; Rault, F.; Almeras, X. Thermo–physical properties of polypropylene fibers containing a microencapsulated flame retardant. Polym. Adv. Technol. 2013, 24, 236–248. [Google Scholar] [CrossRef]
- Michler, G.H. Atlas of Polymer Structures: Morphology, Deformation and Fracture Structures; Hanser eLibrary, Hanser: Munich, Germany; Cincinnati, OH, USA, 2016. [Google Scholar] [CrossRef]
- Techawinyutham, L.; Frick, A.; Siengchin, S. Polypropylene/Maleic Anhydride Grafted Polypropylene (MAgPP)/Coconut Fiber Composites. Adv. Mech. Eng. 2016, 8, 1687814016645446. [Google Scholar] [CrossRef]
- Sigrüner, M.A. Entwicklung von Verstreckten Polypropylenfasern als Bewehrungsalternative für Beton. Ph.D. Thesis, Technische Universität Berlin, Berlin, Germany, 2023. [Google Scholar] [CrossRef]
- Babafemi, A.J.; Boshoff, W.P. Pull-out response of macro synthetic fibre from concrete matrix: Effect of loading rate and embedment length. Constr. Build. Mater. 2017, 135, 590–599. [Google Scholar] [CrossRef]
- Won, J.P.; Park, C.G.; Lee, S.J.; Kang, J.W. Bonding characteristics of recycled polyethylene terephthalate (PET) fibers coated with maleic anhydride grafted polypropylene in cement-based composites. J. Appl. Polym. Sci. 2011, 121, 1908–1915. [Google Scholar] [CrossRef]
- Fraternali, F.; Ciancia, V.; Chechile, R.; Rizzano, G.; Feo, L.; Incarnato, L. Experimental study of the thermo-mechanical properties of recycled PET fiber-reinforced concrete. Compos. Struct. 2011, 93, 2368–2374. [Google Scholar] [CrossRef]
- Alberti, M.G.; Enfedaque, A.; Gálvez, J.C.; Ferreras, A. Pull-out behaviour and interface critical parameters of polyolefin fibres embedded in mortar and self-compacting concrete matrixes. Constr. Build. Mater. 2016, 112, 607–622. [Google Scholar] [CrossRef]
- Oh, B.H.; Kim, J.C.; Choi, Y.C. Fracture behavior of concrete members reinforced with structural synthetic fibers. Eng. Fract. Mech. 2007, 74, 243–257. [Google Scholar] [CrossRef]
- Wang, J.; Dai, Q.; Si, R.; Guo, S. Mechanical, durability, and microstructural properties of macro synthetic polypropylene (PP) fiber-reinforced rubber concrete. J. Clean. Prod. 2019, 234, 1351–1364. [Google Scholar] [CrossRef]
- Wietek, B. Fiber Concrete: In Construction, 1st ed.; Springer: Wiesbaden, Germany, 2021. [Google Scholar] [CrossRef]
- Zhao, X.; Cai, L.; Ji, X.; Zeng, W.; Liu, J. Mechanical Properties of Polyethylene Fiber Reinforced Ultra High Performance Concrete (UHPC). Materials 2022, 15, 8734. [Google Scholar] [CrossRef]
- Abousnina, R.; Premasiri, S.; Anise, V.; Lokuge, W.; Vimonsatit, V.; Ferdous, W.; Alajarmeh, O. Mechanical Properties of Macro Polypropylene Fibre-Reinforced Concrete. Polymers 2021, 13, 4112. [Google Scholar] [CrossRef]
- Guler, S. The effect of polyamide fibers on the strength and toughness properties of structural lightweight aggregate concrete. Constr. Build. Mater. 2018, 173, 394–402. [Google Scholar] [CrossRef]
- Koo, B.M.; Kim, J.H.J.; Kim, S.B.; Mun, S. Material and Structural Performance Evaluations of Hwangtoh Admixtures and Recycled PET Fiber-Added Eco-Friendly Concrete for CO2 Emission Reduction. Materials 2014, 7, 5959–5981. [Google Scholar] [CrossRef]
- Silva, F.A.; Peled, A.; Zukowski, B.; Toledo Filho, R.D. Fiber Durability. In A Framework for Durability Design with Strain-Hardening Cement-Based Composites (SHCC); van Zijl, G.P., Slowik, V., Eds.; RILEM State-of-the-Art Reports; Springer: Dordrecht, The Netherlands, 2017; Volume 22, pp. 59–78. [Google Scholar] [CrossRef]
- Guerini, V.; Conforti, A.; Plizzari, G.; Kawashima, S. Influence of Steel and Macro-Synthetic Fibers on Concrete Properties. Fibers 2018, 6, 47. [Google Scholar] [CrossRef]
- Hilles, M.M.; Ziara, M.M. Mechanical behavior of high strength concrete reinforced with glass fiber. Eng. Sci. Technol. Int. J. 2019, 22, 920–928. [Google Scholar] [CrossRef]
- Rittner, S.; Schladitz, F.; Schütze, E. Bewehrung. In Handbuch Carbonbeton; Curbach, M., Hegger, J., Lieboldt, M., Schladitz, F., Tietze, M., Eds.; Ernst Sohn: Berlin, Germany, 2023; pp. 21–54. [Google Scholar]
- Popa, M.M.; Brünig, H.; Curosu, I.; Mechtcherine, V.; Scheffler, C. Spinability and Characteristics of Particle-Shell PP-bicomponent Fibers for Crack Bridging in Mineral-Bonded Composites. In Fibre Reinforced Concrete: Improvements and Innovations II; Serna, P., Llano-Torre, A., Martí-Vargas, J.R., Navarro-Gregori, J., Eds.; RILEM Bookseries; Springer International Publishing: Cham, Switzerland, 2022; Volume 36, pp. 255–264. [Google Scholar] [CrossRef]
- Herz, J.; Lorenz, K.; Muscat, D.; Strübbe, N. Polymeric core-shell and mono-material fibers for concrete reinforcement. AIP Conf. Proc. 2024, 3158, 040004. [Google Scholar] [CrossRef]
- Popa, M.M.; Leuteritz, A.; Stommel, M.; Kühnert, I.; Mechtcherine, V.; Scheffler, C. Micromechanical study on polypropylene-bicomponent fibers to improve mechanical interlocking for application in strain-hardening cement-based composites. Cem. Concr. Compos. 2023, 142, 105181. [Google Scholar] [CrossRef]
- Herz, J.; Hefenbrock, S.; Lorenz, K.; Muscat, D.; Strübbe, N. Polyketone-polypropylene core-shell fibers for concrete reinforcement. In Proceedings of the 39th International Conference of the Polymer Processing Society (PPS-39), Cartagena de Indias, Colombia, 19–23 May 2024; Ediciones Uniandes: Bogotá, Colombia, 2024; pp. 167–177. [Google Scholar] [CrossRef]
- Herz, J.; Sigrüner, M.; Muscat, D.; Strübbe, N. Co-extruded polymer fibers for concrete reinforcement. AIP Conf. Proc. 2023, 2884, 080002. [Google Scholar] [CrossRef]
- REPSOL. REPSOL ISPLEN PP020G3E; Technical Datasheet; REPSOL: Madrid, Spain, 2021. [Google Scholar]
- Omya International AG. Omyafiber 800—AV; Technical Datasheet; Omya International AG: Oftringen, Switzerland, 2021. [Google Scholar]
- BYK-Chemie GmbH. CLOISITE-20 A; Technical Datasheet; BYK-Chemie GmbH: Wesel, Germany, 2018. [Google Scholar]
- Mitsui Chemicals Europe GmbH. ADMER™ RA206E; Technical Datasheet; Mitsui Chemicals Europe GmbH: Düsseldorf, Germany, 2022. [Google Scholar]
- DIN EN 196-1:2016-11; Prüfverfahren für Zement—Teil 1: Bestimmung der Festigkeit; Deutsche Fassung. Deutsches Institut für Normung e.V.: Berlin, Germany, 2016. [CrossRef]
- Dahlmann, R.; Haberstroh, E.; Menges, G. Menges Werkstoffkunde Kunststoffe, 7, vollständig neu bearbeitete auflage ed.; Hanser: München, Germany, 2022. [Google Scholar]
- DIN EN ISO 527-1:2019-12; Kunststoffe—Bestimmung der Zugeigenschaften—Teil 1: Allgemeine Grundsätze (ISO 527-1:2019); Deutsche Fassung EN ISO 527-1:2019. Deutsches Institut für Normung e.V.: Berlin, Germany, 2019. [CrossRef]
- DIN EN 14889-2:2006-11; Fasern für Beton—Teil 2: Polymerfasern—Begriffe, Festlegungen und Konformität; Deutsche Fassung. Deutsches Institut für Normung e.V.: Berlin, Germany, 2006. [CrossRef]
- Gieck, K.; Gieck, R. Technische Formelsammlung, 34, bearbeitete und erweiterte auflage ed.; Hanser: München, Germany, 2019. [Google Scholar]
- Zhandarov, S.; Mäder, E.; Scheffler, C.; Kalinka, G.; Poitzsch, C.; Fliescher, S. Investigation of interfacial strength parameters in polymer matrix composites: Compatibility and reproducibility. Adv. Ind. Eng. Polym. Res. 2018, 1, 82–92. [Google Scholar] [CrossRef]
- Hampe, A.; Kalinka, G.; Meretz, S.; Schulz, E. An advanced equipment for single-fibre pull-out test designed to monitor the fracture process. Composites 1995, 26, 40–46. [Google Scholar] [CrossRef]
- Owens, D.K.; Wendt, R.C. Estimation of the surface free energy of polymers. J. Appl. Polym. Sci. 1969, 13, 1741–1747. [Google Scholar] [CrossRef]
- Rabel, W. Einige Aspekte der Benetzungstheorie und ihre Anwendung auf die Untersuchung und Veränderung der Oberflächeneigenschaften von Polymeren. Farbe Lack 1971, 77, 997–1005. [Google Scholar]
- Kamezawa, M.; Yamada, K.; Takayanagi, M. Preparation of ultrahigh modulus isotactic polypropylene by means of zone drawing. J. Appl. Polym. Sci. 1979, 24, 1227–1236. [Google Scholar] [CrossRef]
- van Erp, T.B.; Reynolds, C.T.; Bilotti, E.; Peijs, T. Nanoclay assisted ultra-drawing of polypropylene tapes. Nanocomposites 2019, 5, 114–123. [Google Scholar] [CrossRef]
- Adfil nv. Durus® S500 48 mm; Adfil nv: Zele, Belgium; Available online: https://www.adfil.com/uploads/Durus-S500-48mm-TDS-English.pdf (accessed on 16 June 2025).
- Adfil nv. Durus® EasyFinish; Adfil nv: Zele, Belgium; Available online: https://www.adfil.com/uploads/Durus%C2%AE-EasyFinish-TDS-English.pdf (accessed on 16 June 2025).
- BarChip Inc. BarChip 48; BarChip Inc.: Dublin, Ireland; Available online: https://barchip.com/wp-content/uploads/2017/11/EPC_PDS_BarChip48_2017_email.pdf (accessed on 16 June 2025).
- BarChip Inc. BarChip 60; BarChip Inc.: Dublin, Ireland; Available online: https://barchip.com/wp-content/uploads/2021/07/PDS_BarChip60_web.pdf (accessed on 16 June 2025).
- Contec Fiber AG. Concrix M507; Contec Fiber AG: Domat/Ems, Switzerland; Available online: https://contecfiber.com/wp-content/uploads/2024/09/Concrix-M507_Datenblatt-DE_neu.pdf (accessed on 16 June 2025).
- Contec Fiber AG. Concrix SA; Contec Fiber AG: Domat/Ems, Switzerland; Available online: https://contecfiber.com/wp-content/uploads/2024/09/Concrix_SA_Datenblatt-EN_neu.pdf (accessed on 16 June 2025).
- Kordsa Teknik Tekstil A.Ş. Kratos Macro PP 48; Kordsa Teknik Tekstil A.Ş.: Izmit, Turkey; Available online: https://kratosreinforcement.com/wp-content/uploads/2022/03/KraTos_Macro_PP-48-TDS_ING.pdf (accessed on 16 June 2025).
- Kordsa Teknik Tekstil A.Ş. Kratos Macro PP 54; Kordsa Teknik Tekstil A.Ş.: Izmit, Turkey; Available online: https://kratosreinforcement.com/wp-content/uploads/2022/03/KraTos_Macro_PP-54-TDS_ING-2.pdf (accessed on 16 June 2025).
- MAPEI®. MAPEFIBRE ST 42; MAPEI®: Milan, Italy; Available online: https://cdnmedia.mapei.com/docs/librariesprovider6/products-documents/1_06944_mapefibre-st30-_de-ch_346d04f8b1dd48c696d68d15e798b2ca.pdf?sfvrsn=a638fe22_0 (accessed on 16 June 2025).
- MAPEI®. MAPEFIBRE ST 30; MAPEI®: Milan, Italy; Available online: https://cdnmedia.mapei.com/docs/librariesprovider17/products-documents/1_mapefibre-st-30-tds-engl-2015-06_e60fae528abb41c28ecc5262da8ac43a.pdf?sfvrsn=2615f6a7_0 (accessed on 16 June 2025).
- Master Builders Solutions GmbH. Master Fiber 255 SPA; Master Builders Solutions GmbH: Mannheim, Germany; Available online: https://assets.ctfassets.net/ctspkgm1yw3s/DMSY-1685695220-116489/8c1145e222831d2d08ede99f39db3a56/mbs-masterfiber_255_spa-tdb.pdf (accessed on 16 June 2025).
- Master Builders Solutions Schweiz AG. MasterFiber® 245 SPA; Master Builders Solutions GmbH: Mannheim, Germany; Available online: https://assets.ctfassets.net/ctspkgm1yw3s/DMSY-739242322-6393/7990176f11ffea26fef322ad869a9693/masterfiber-245-spa-tdb.pdf (accessed on 16 June 2025).
- Sika Deutschland GmbH. SikaFiber® Force-50; Sika Deutschland GmbH: Stuttgart, Germany; Available online: https://deu.sika.com/dam/dms/deaddconst01/d/sikafiber_force-50.pdf (accessed on 16 June 2025).
- Sika Deutschland GmbH. SikaFiber®-40 Force; Sika Deutschland GmbH: Stuttgart, Germany; Available online: https://deu.sika.com/dam/dms/deaddconst01/y/sikafiber-40-force.pdf (accessed on 16 June 2025).
- Geyssant, J. Geologie des Calciumcarbonats. In Calciumcarbonat; Tegethoff, F.W., Ed.; Birkhäuser: Basel, Switzerland, 2001; pp. 1–51. [Google Scholar]
- Kim, G.M.; Michler, G. Micromechanical deformation processes in toughened and particle-filled semicrystalline polymers: Part 1. Characterization of deformation processes in dependence on phase morphology. Polymer 1998, 39, 5689–5697. [Google Scholar] [CrossRef]
- Rattanawijan, W.; Amornsakchai, T. Polyethylene composite fibers. I. Composite fibers of high-density polyethylene. J. Appl. Polym. Sci. 2012, 124, 501–509. [Google Scholar] [CrossRef]
- Qiu, Y.; Batchelor, S.D.; Jack, P.R.; McCord, M.G. Estimation of the axial tensile modulus of a particle-reinforced composite fiber with variable radius. Compos. Sci. Technol. 2000, 60, 2731–2737. [Google Scholar] [CrossRef]
- Gregor-Svetec, D. High modulus polypropylene fibers. II. Influence of fiber preparation upon structure and morphology. J. Appl. Polym. Sci. 2006, 100, 1067–1082. [Google Scholar] [CrossRef]
- Amornsakchai, T.; Olley, R.H.; Bassett, C.C.; Al-Hussein, M.O.M.; Unwin, A.P.; Ward, I.M. On the influence of initial morphology on the internal structure of highly drawn polyethylene. Polymer 2000, 41, 8291–8298. [Google Scholar] [CrossRef]
- Baltá-Calleja, F.J.; Peterlin, A. Plastic deformation of polypropylene. VI. mechanism and properties. J. Macromol. Sci. Part B 1970, 4, 519–540. [Google Scholar] [CrossRef]
- Sokkar, T.Z.N.; El-Bakary, M.A.; Ali, A.M. The influence of mechanical cold drawing and drawing velocity on the molecular structure of isotactic polypropylene fiber. J. Appl. Polym. Sci. 2013, 127, 1105–1113. [Google Scholar] [CrossRef]
- Salih, W.K. Fire retardancy assessment of polypropylene composite filed with nano clay prepared from Iraqi bentonite. J. Physics Conf. Ser. 2018, 1003, 012019. [Google Scholar] [CrossRef]
- Westphal, E.; Geertz, G.; Großhauser, M.; Metzsch-Zilligen, E.; Pfaendner, R. Strategies to Cope with Inferior Long-Term Photostability of Bentonite Polyolefin Nanocomposites. Polymers 2024, 16, 535. [Google Scholar] [CrossRef]
- Prahsarn, C.; Roungpaisan, N.; Klinsukhon, W.; Suwannamek, N.; Padee, S. Thermal and Flame Retardant Properties of Shaped Polypropylene Fibers Containing Modified-Thai Bentonite. AUTEX Res. J. 2018, 18, 13–19. [Google Scholar] [CrossRef]
- Du, B.; Guo, Z.; Song, P.; Liu, H.; Fang, Z.; Wu, Y. Flame retardant mechanism of organo-bentonite in polypropylene. Appl. Clay Sci. 2009, 45, 178–184. [Google Scholar] [CrossRef]
- Wietek, B. Faserbeton: Im Bauwesen, 3rd ed.; Springer Vieweg: Wiesbaden, Germany, 2020. [Google Scholar] [CrossRef]

| Material | Sand | Portland Cement | Limestone Powder | Water | Superplasticizer | ||
|---|---|---|---|---|---|---|---|
| 1 | 2 | ||||||
| Amount | [g] | 1350 | 450 | 75 | 220 | 6.2 | 3.0 |
| [wt.%] | 64.15 | 21.38 | 3.56 | 10.45 | 0.29 | 0.15 | |
| Material Denotations | Amount of PP | Amount of Filler | Amount of MAH | Screw Configuration | |
|---|---|---|---|---|---|
| CC | BT | ||||
| [wt.%] | [wt.%] | [wt.%] | [-] | ||
| PP-S1 | 100 | - | - | - | S1 |
| PP-CC-S1 | 79.58 | 13.61 | - | 6.81 | S1 |
| PP-S2 | 100 | - | - | - | S2 |
| PP-BT-S2 | 95.15 | - | 4.85 | - | S2 |
| Material | Extruder | Melt Pump | ||||
|---|---|---|---|---|---|---|
| Screw Speed [rpm] | Mass Temperature [°C] | Pressure [bar] | Throughput [kg/h] | Mass Temperature [°C] | Pressure [bar] | |
| M-PP | 44 | 199 | 47 | 1.5 | 209 | 45 |
| M-PP-S1 | 50 | 199 | 48 | 1.5 | 209 | 44 |
| M-PP-CC-S1 | 38 | 198 | 47 | 1.5 | 205 | 41 |
| M-PP-S2 | 65 | 200 | 48 | 1.5 | 210 | 45 |
| M-PP-BT-S2 | 53 | 197 | 48 | 1.5 | 209 | 43 |
| Material | Extruder 1 | Extruder 2 | |||||
|---|---|---|---|---|---|---|---|
| Screw Speed | Throughput |
Mass Temperature | Pressure | Screw Speed |
Mass Temperature | Pressure | |
| [rpm] | [kg/h] | [°C] | [bar] | [rpm] | [°C] | [bar] | |
| C-PP-S-PP | 120 | 1.5 | 217 | 121 | 20 | 207 | 124 |
| C-PP-S-PP-CC-S1 | 120 | 1.5 | 218 | 99 | 20 | 210 | 116 |
| C-PP-S-PP-BT-S2 | 120 | 1.5 | 218 | 99 | 20 | 212 | 110 |
| C-PP-BT-S2-S-PP-CC-S1 | 120 | 1.5 | 217 | 90 | 20 | 211 | 110 |
| Material | Draw Ratio | Equivalent Fiber Diameter | Aspect Ratio 1 | Young’s Modulus | Tensile Strength |
|---|---|---|---|---|---|
| [1] | [mm] | [1] | [GPa] | [MPa] | |
| M-PP | 12 | 0.58 ± 0.02 | 85.9 | 8.03 ± 0.85 | 401.10 ± 54.31 |
| M-PP-S1 | 17 | 0.51 ± 0.01 | 97.5 | 12.74 ± 0.52 | 475.04 ± 19.32 |
| M-PP-S2 | 14 | 0.57 ± 0.11 | 87.3 | 10.17 ± 4.60 | 434.52 ± 139.10 |
| M-PP-CC-S1 | 14 | 0.49 ± 0.00 | 102.7 | 9.04 ± 0.22 | 484.21 ± 17.49 |
| M-PP-BT-S2 | 18 | 0.46 ± 0.02 | 108.4 | 13.88 ± 1.28 | 613.40 ± 12.88 |
| C-PP-S-PP | 12 | 0.60 ± 0.04 | 83.1 | 6.87 ± 0.96 | 424.77 ± 69.84 |
| C-PP-S-PP-CC-S1 | 17 | 0.49 ± 0.02 | 101.9 | 13.38 ± 0.73 | 497.41 ± 19.15 |
| C-PP-S-PP-BT-S2 | 15 | 0.49 ± 0.01 | 101.4 | 12.84 ± 0.52 | 567.42 ± 46.73 |
| C-PP-BT-S2-S-PP-CC-S1 | 17 | 0.50 ± 0.01 | 100.4 | 13.38 ± 0.88 | 493.71 ± 23.50 |
| Material | Draw Ratio | Equivalent Fiber Diameter | Aspect Ratio 1 | Young’s Modulus | Tensile Strength |
|---|---|---|---|---|---|
| [1] | [mm] | [1] | [GPa] | [MPa] | |
| M-PP | 12 | 0.58 ± 0.02 | 85.9 | 8.03 ± 0.85 | 401.10 ± 54.31 |
| M-PP-S1 | 16 | 0.50 ± 0.01 | 100.5 | 13.23 ± 0.60 | 514.88 ± 21.65 |
| M-PP-S2 | 13 | 0.52 ± 0.01 | 96.4 | 11.94 ± 1.04 | 491.72 ± 38.68 |
| M-PP-CC-S1 | 14 | 0.49 ± 0.00 | 102.7 | 9.04 ± 0.22 | 484.21 ± 17.49 |
| M-PP-BT-S2 | 17 | 0.47 ± 0.01 | 107.1 | 14.94 ± 0.35 | 620.72 ± 18.46 |
| C-PP-S-PP | 11 | 0.54 ± 0.04 | 92.3 | 9.22 ± 2.01 | 464.61 ± 61.18 |
| C-PP-S-PP-CC-S1 | 17 | 0.49 ± 0.02 | 101.9 | 13.38 ± 0.73 | 497.41 ± 19.15 |
| C-PP-S-PP-BT-S2 | 14 | 0.50 ± 0.02 | 99.3 | 11.91 ± 0.41 | 571.01 ± 65.78 |
| C-PP-BT-S2-S-PP-CC-S1 | 16 | 0.51 ± 0.00 | 98.3 | 13.11 ± 0.55 | 502.24 ± 17.00 |
| Manufacturer | Fiber Name | Equivalent Fiber Diameter | Length | Aspect Ratio | Young’s Modulus | Tenisle Strength | Source |
|---|---|---|---|---|---|---|---|
| [mm] | [mm] | [-] | [GPa] | [MPa] | |||
| Advil | Durus® S500 48 mm | 0.7 | 48 | 69 | 6 | 500 | [79] |
| Durus® EasyFinish | 0.7 | 40 | 57 | 6 | 500 | [80] | |
| BarChip Inc. | BarChip 48 | - 1 | 48 | - 1 | 12 | 640 | [81] |
| BarChip 60 | - 1 | 60 | - 1 | 12 | 640 | [82] | |
| Contec Fiber AG | Concrix M507 | 0.75 | 50 | 67 2 | 6 | 450 | [83] |
| Concrix SA | 0.5 | 25 | 50 2 | 11 | 620 | [84] | |
| Kordsa Teknik Tekstil A.Ş. | Kratos Macro PP 48 | 0.72 | 48 | 67 | 8.5 | 550 | [85] |
| Kratos Macro PP 54 | 0.72 | 57 | 75 | 8.5 | 550 | [86] | |
| MAPEI® | MAPEFIBRE ST 42 | 0.8 | 42 | 53 2 | 3.9 | 450 | [87] |
| MAPEFIBRE ST30 | 0.8 | 30 | 38 2 | 3.8 | 450 | [88] | |
| Master Builders Solutions | Master Fiber 255 SPA | 0.7 | 55 | 79 | >8 | 500 | [89] |
| MasterFiber® 245 SPA | 0.7 | 48 | 69 | ≥8 | 500 | [90] | |
| Sika Deutschland GmbH | SikaFiber® Force-50 | ≈0.73 | ≈50 | 68 2 | 7.5 | 450 | [91] |
| SikaFiber®-40 Force | ≈0.75 | ≈40 | 53 2 | 8 | 480 | [92] |
| Material | Draw Ratio [-] | Onset Point [°C] | Tempreature at | Maximum | ||
|---|---|---|---|---|---|---|
| 1% Weight Loss [°C] | 2% Weight Loss [°C] | 5% Weight Loss [°C] | Degradation Rate [%/°C] | |||
| M-PP | 12 | 454.71 | 398.25 | 411.07 | 431.41 | −3.24 |
| M-PP-S1 | 17 | 463.60 | 411.27 | 424.17 | 442.00 | −3.65 |
| M-PP-S2 | 14 | 462.60 | 408.71 | 423.25 | 441.87 | −3.28 |
| M-PP-CC-S1 | 14 | 457.07 | 401.33 | 416.84 | 435.23 | −2.77 |
| M-PP-BT-S2 | 18 | 462.57 | 359.75 | 419.10 | 450.59 | −8.06 |
| C-PP-S-PP | 12 | 448.49 | 363.56 | 375.51 | 396.21 | −2.73 |
| C-PP-S-PP-95-CC-S1 | 17 | 485.39 | 403.05 | 414.96 | 431.86 | −3.11 |
| C-PP-S-PP-BT-S2 | 15 | 449.85 | 398.37 | 417.80 | 433.27 | −9.12 |
| C-PP-BT-S2-S-PP-CC-S1 | 17 | 451.88 | 363.71 | 413.37 | 436.91 | −7.98 |
Disclaimer/Publisher’s Note: The statements, opinions and data contained in all publications are solely those of the individual author(s) and contributor(s) and not of MDPI and/or the editor(s). MDPI and/or the editor(s) disclaim responsibility for any injury to people or property resulting from any ideas, methods, instructions or products referred to in the content. |
© 2025 by the authors. Licensee MDPI, Basel, Switzerland. This article is an open access article distributed under the terms and conditions of the Creative Commons Attribution (CC BY) license (https://creativecommons.org/licenses/by/4.0/).
Share and Cite
Herz, J.; Muscat, D.; Strübbe, N. The Influence of Fillers on the Reinforcement Capabilities of Polypropylene Based Mono-Material and Core-Shell Fibers in Concrete, a Comparison. Polymers 2025, 17, 1781. https://doi.org/10.3390/polym17131781
Herz J, Muscat D, Strübbe N. The Influence of Fillers on the Reinforcement Capabilities of Polypropylene Based Mono-Material and Core-Shell Fibers in Concrete, a Comparison. Polymers. 2025; 17(13):1781. https://doi.org/10.3390/polym17131781
Chicago/Turabian StyleHerz, Jonas, Dirk Muscat, and Nicole Strübbe. 2025. "The Influence of Fillers on the Reinforcement Capabilities of Polypropylene Based Mono-Material and Core-Shell Fibers in Concrete, a Comparison" Polymers 17, no. 13: 1781. https://doi.org/10.3390/polym17131781
APA StyleHerz, J., Muscat, D., & Strübbe, N. (2025). The Influence of Fillers on the Reinforcement Capabilities of Polypropylene Based Mono-Material and Core-Shell Fibers in Concrete, a Comparison. Polymers, 17(13), 1781. https://doi.org/10.3390/polym17131781