Abstract
Stone powder is an inevitable by-product generated during the processing of manufactured sand and gravel. Waste stone powder has been proven to affect concrete properties and has been applied in the transportation and hydropower fields. This study aims to convert waste granite stone powder (GP) to nuclear power concrete by replacing manufactured sand, investigating its effect on the workability, compressive strength, splitting tensile strength, impermeability, and freezing resistance of nuclear power concrete. The mechanism was further elucidated through thermogravimetric (TG), scanning electron microscopy (SEM), and mercury intrusion porosimetry (MIP) techniques. The results show that with the increase in GP content, the slump, compressive strength, and splitting tensile strength of concrete increase first and then decrease, and the seepage height under pressure water decreases first and then increases. The workability, strength, and impermeability of concrete are optimal when GP content is 11.0%. Reasonable GP content improves the compactness of concrete by filling pores and optimizing aggregate gradation, resulting in decreases in porosity, with the size being the most probable and average pore size.
1. Introduction
As the second most consumed material globally after water, concrete is one of the most widely used building materials in the world. In total, 30 billion tonnes of concrete have been used annually [1], of which aggregates account for 65~75% by volume. The demand for concrete aggregates has been increasing over the past 30 years. Considering the non-renewability of natural aggregates in the short term and the necessity of environmental protection, manufactured sand has been promoted as an environmental-friendly alternative in concrete as a substitute for natural sand. Compared with natural sand, manufactured sand has the characteristics of irregular grain shape, rough surfaces, and high stone powder content up to 10–20% [2]. Stone powder refers to particles with sizes less than 75 μm in manufactured sand which are generated from the production of manufactured sand and gravel, which is limited within a certain range according to the MB value of manufactured sand in China’s national standards, industry standards, and local standards. For example, in GB/T 14684-2022 [3], the stone powder content of I-manufactured sand is specified to be within 15% when MB ≤ 0.5, while it must be within 1.0% when MB > 1.4. Of course, the stone powder content of manufactured sand can be controlled within the required range through strict production processing. However, the accumulation or landfill of waste stone powder will occupy land, affect soil permeability, and even cause air, soil, and water pollution. The reuse of limestone powder holds significant environmental importance.
At present, many scholars have studied the effect of stone powder on the performance of concrete in China and abroad [4,5,6,7,8,9,10,11]. Fu et al. [4] studied the effect of stone powder content (0~15%) on the cube compressive strength, axial compressive strength, splitting tensile strength, and modulus of elasticity of concrete. Alyousef et al. [5] investigated compressive strength, homogeneity, and quality in terms of ultrasonic pulse velocity and durability against the carbonation and water penetration of self-compacting concrete. Wu et al. [6] used stone powder in manufactured sand C80 concrete and studied its effect on mechanical properties with stone powder contents from 3% to 15%. Furthermore, Huajian Li [7] and Feng et al. [8] discussed the effects of limestone, granite, tuff, and other powders on the performance of cement-based materials. There are still controversial opinions on the influence of stone powder and its content. Some researchers reported that the mechanical properties of concrete decreased with an increase in the stone powder content [12,13,14,15], while others found that this was not the case. Aliabdo et al. [16] found that concrete compressive strength increases with the increase in marble dust as a sand replacement up to 15.0% by weight, and a significant improvement in tensile strength was recorded either using marble dust as a cement replacement or as a sand replacement. Wu et al. [6] found that with increases in stone powder, the elastic modulus obviously decreased, while the axial compressive and split tensile strength first increased and then decreased. Feng et al. [8] pointed out that the synergistic effects of filler action and nucleation sites from stone powders significantly enhanced cement hydration at 10–15% replacement levels, while exceeding a 15% replacement level caused performance degradation due to excessive unreacted particles. Fu et al. [4] found that the slump and expansion, compressive strength, and splitting tensile strength of concrete all showed the change law of increasing first and then decreasing, and the optimum amount of stone powder for slump and expansibility at 7 d and 28 d in terms of compressive and splitting tensile strength was 9% and 12%, respectively. Wu et al. [17] worked with a range of 3–10% stone powder content, and the cubic strength of concrete increased with increased stone powder. Shi et al. [18] and Guan et al. [19] also believe that the stone powder content within a certain range can promote the workability and compressive strength of manufactured sand concrete.
It is widely recognized that stone powder has an influence on the performance of concrete, whether as a replacement of cement or as a replacement of sand. Scholars have attempted to explain its influence mechanism. Poppe et al. [20] and Bonavetti et al. [21] believe that stone powder is not completely inert and can react with cement in the hydration process to produce new products. Feng et al. [8] found that the mechanism of different lithologic stone powders on the hydration process of cement varied. For example, limestone powder enhanced the early-age strength of mortar due to the abundance of CaCO3 facilitating the early formation of hydration products. Meanwhile, basalt and tuff powder exhibited pronounced pozzolanic activity and improved the long-term compressive strength due to amorphous SiO2 and Al2O3, which participated in secondary hydration with Ca(OH)2. In a review by Wang et al. [22], it is believed that using limestone to replace fine aggregate improves the properties of concrete, while using limestone to replace cement reduces the properties of concrete. Though scholars have conducted extensive research on the relationship between stone powder and concrete performance, there is no unified understanding regarding the application of stone powder and its reasonable dosage. Furthermore, stone powder has already been used in many projects such as the transportation and hydropower fields. However, there is still relatively little research on its application in nuclear power concrete because higher requirements have been proposed for concrete workability, strength reliability, and long-term durability in nuclear power plant engineering, and stricter restrictions on the manufactured sand used in nuclear power concrete have also been established. For example, stone powder content is limited within 7% and 5% when MB ≤ 1.4 for C35~C45 and ≥C50, respectively, in NB/T 20549-2019 [23], while it is within 3% and 2% when MB > 1.4.
In order to expand the green application of stone powder in nuclear power, we must provide a basis for the formulation/revision of standards and production of manufactured sand for nuclear power projects and assist in achieving the “dual carbon” goals of China’s concrete industry. This study takes the raft foundation concrete of the Taipingling Nuclear Power Project and examines the influence of stone powder on the workability, mechanical properties, and durability of manufactured sand concrete. The objective is to obtain a control range of stone powder content that meets construction and design requirements and provide a reference for the quality control of manufactured sand and the application of stone powder in nuclear power projects. Therefore, in this paper, cubic compressive strength, splitting tensile strength, and water penetration tests were conducted on nuclear power-manufactured sand concrete. Microstructural characterizations using thermogravimetric (TG), scanning electron microscopy (SEM), and mercury intrusion porosimetry (MIP) were also studied.
2. Materials and Methods
2.1. Materials
The cement used in this study was P·N42.5 Portland cement (PC) produced by Huarun (Zhangping) Cement Co., Ltd. (Zhangping, China), with a density of 3.08 g/cm3, specific surface area of 322 m2/kg, and an initial and final setting time of 154 min and 208 min, respectively. Its strengths are complying with GB/T 31545-2015 [24]. The fly ash used in this study was F-class I grade fly ash (FA) produced by the Chaozhou power plant, with a density of 2.36 g/cm3, fineness of 9.7%, water demand ratio of 88%, and strength activity coefficient of 83%. The stone powder used was granite powder (GP), washed out from the production of manufactured sand, with 6.9% of 80 μm square sieve residue. The chemical compound of cement, fly ash, and stone powder is provided in Table 1, and their SEM images are illustrated in Figure 1.

Table 1.
Chemical composition of cement, fly ash, and stone powder %.
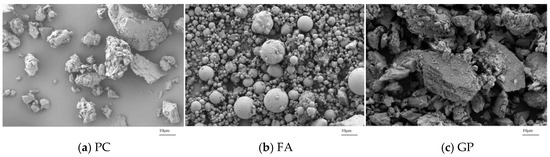
Figure 1.
SEM images of cement. FA and GP: (a) PC; (b) FA; and (c) GP.
The aggregates used in this study were granite-manufactured sand and granite-crushed stones. Their technical indicators comply with GB/T 14684-2022 [3] and GB/T 14685-2022 [25], respectively. The stone powder content of the manufactured sand was 3.2% and the fineness modulus was 2.8. The main technical indicators of aggregates are shown in Table 2. Polycarboxylate superplasticizer produced by Jiangsu Sopot New Material Co., Ltd. (Nanjing, China), was used in this study, with a water reducing rate of 28% and solid content of 18%. Its recommended dosage was 0.9~1.4%.
Table 2.
Physical properties of aggregates.
2.2. Mixture Proportion and Testing Method
2.2.1. Mixture Proportion
The ordinary concrete used for the bottom plate of the foundation in the Taipingling nuclear power project building was prepared, with a design strength grade of C40P8, which has high requirements for impermeability. The concrete mixture design was executed according to JGJ 55-2011 [26] and NB/T 20378-2016 [27], and the reference mix proportion was designed as shown in Table 3, in which the GP content is 3.2%. The reference mixture was named R-3.2.
Table 3.
Reference mix proportion.
As known, the stone powder content of I-manufactured sand is specified to be within 15% in GB/T 14684-2022 [3]. In addition, the optimal stone powder content is often found in the range of 10–15% in many reported studies [2,4,5,16,17]. In this study, the performance of manufactured sand concrete GP content within 20% will be investigated. By replacing sand with GP, manufactured sand with GP contents of 6.0%, 11.0%, 16.0%, and 20.0% can be achieved, which can then be used to form nuclear power concrete; these were named GP-6.0, GP-11.0, GP-16.0, and GP-20.0, respectively.
2.2.2. Macro Testing
The workability and apparent density of fresh concrete, as well as the compressive strength and splitting tensile strength at 7 d, 28 d, and 90 d and impermeability at 28 d, were tested. Six cubic specimens of 150 mm × 150 mm × 150 mm were prepared, of which 3 were tested for compressive strength and 3 for splitting tensile strength. The average value of the 3 specimens was taken as the test result. Six cone-like specimens with a top diameter of 175 mm, bottom diameter of 185 mm, and height of 150 mm were cast for the impermeability experiment. The concrete specimens used in the experiments are shown in Figure 2. After 1 d of curing at room temperature, specimens were demolded and then cured at (20 ± 2) °C and relative humidity (RH) ≥ 95% for the specified ages. Mixing, molding, curing, and testing of specimens were conducted in accordance with the “Standard for Performance Testing Methods of Ordinary Concrete Mixtures” GB/T 50080-2016 [28] and “Standard for Physical and Mechanical Performance Testing Methods of Concrete” GB/T 50081-2019 [29]. Figure 2 shows the concrete specimens.
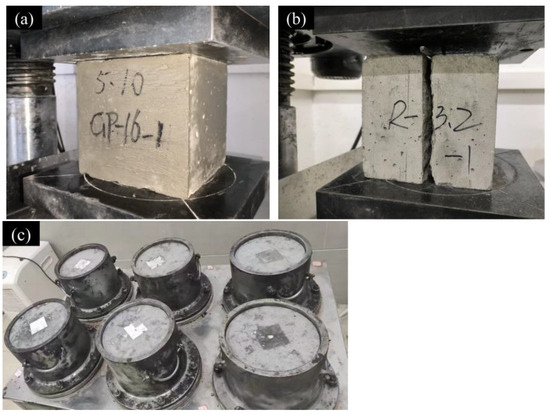
Figure 2.
Concrete specimens in experiments for (a) compressive strength, (b) splitting tensile strength, and (c) impermeability test.
2.2.3. Microstructural Analysis
Thermogravimetric (TG) analysis was carried out to monitor the thermal effects and investigate the kinetics of the drying process of the hardened cement pastes containing GP. Approximate 20 mg samples with the aggregates removed were ground into powder and heated at a constant rate of 10 °C/min from 25 °C to 800 °C. Two blank tests were conducted to eliminate testing errors. A Sigma 360 scanning electron microscope (SEM) and energy-dispersive X-ray spectroscopy (EDS), produced by Zeiss in Oberkochen of Germany were used to analyze the microstructure of concrete. An AutoPore IV 9620 mercury intrusion porosimeter (MIP), produced by Micromeritics in Novoross, Georgia of USA was used to investigate the pore structure of concrete, in which surface tension was 0.48 N/m and the contact angle was 130°. The maximum mercury intrusion pressure was 4.45 psia and the range of measurable pore sizes was 3.2 nm~360 µm. When concrete specimens reached the specified age, core samples without coarse aggregates were drilled from the specimen center and immediately immersed into anhydrous ethanol to terminate cement hydration for 72 h. Subsequently, samples were vacuum-dried for 24 h before testing. Samples for the SEM sample were about 10 mm × 10 mm × 5 mm, while samples for MIP were approximately φ10 mm × 20 mm.
3. Results and Discussions
3.1. Workability
The workability of fresh concrete was measured by the flow table test. It can be seen from Figure 3 that the slump of concrete was significantly affected by GP content, which first increased and then decreased with increasing GP, accompanied by clear changes in the cohesion and water retention of fresh concrete, which is consistent with the experimental results of other researchers [4,30]. GP-6.0 had the best fluidity, with a slump value 15 mm higher than that of R-3.2. But this slump value exceeds the designed range of (160 ± 30) mm. When GP content reached 11.0%, although the slump of fresh concrete decreased compared to GP-6.0, it was almost equal to that of R-3.2, and it had better cohesiveness and water retention. When GP content further increased to 16.0%, the slump of fresh concrete decreased by 12.2% compared to R-3.2. When GP content reached 20.0% and superplasticizer content was 1.2%, the mixture had already exhibited excessive viscosity, which would make construction difficult, although it satisfied construction requirements.
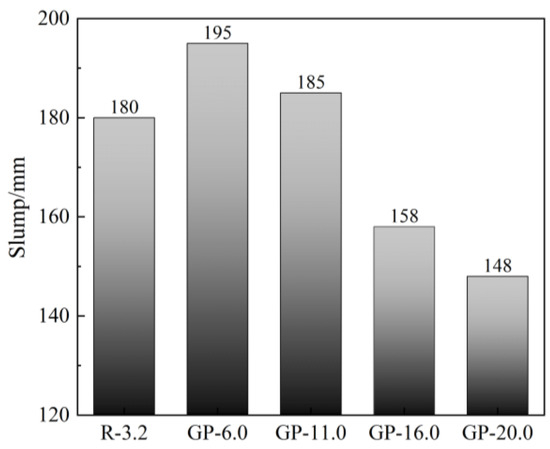
Figure 3.
Slump of fresh concrete with GP content.
Figure 3 shows that the addition of GP within a certain range can improve the workability of manufactured sand concrete, at which point GP effectively played its role as a “micro aggregate”. On the one hand, GP particles dispersing in the concrete system filled the voids between aggregate particles, improving the bulk density of fresh concrete. On the other hand, the addition of GP finer than cement was equivalent to increasing the paste–aggregate ratio, which allowed the paste to better encapsulate aggregate particles and then increase the fluidity of concrete [5]. As the GP content continued to increase, the water requirement of manufactured sand concrete increased, resulting in a continuous decrease in the slump of concrete [21], as well as an increase in viscosity. Therefore, in this study, the GP content should not exceed 16.0% from the perspective of satisfying design fluidity. Nuclear power concrete can achieve better workability when GP content is within 11%, which is similar to the experimental phenomenon found by Feng et al. [8]. If the best fluidity is desired for nuclear power concrete, a GP content of 6% is optimal.
3.2. Compressive and Splitting Tensile Strength
Figure 4 shows the stress–strain curves of nuclear power concrete under compression at 28 d. It can be seen that with GP content increasing from 3.2% to 11.0%, the peak strain of concrete gradually increased, indicating an improved plastic deformation capacity and a decrease in the elastic modulus. However, it decreased when GP content increased from 11.0% to 20.0%, which may be related to the deterioration of the concrete microstructure caused by excessive GP content. For GP-6.0 and GP-11.0, the stress–strain curves of GP6 and GP11 are very similar, with comparable peak strains. From the perspective of saving aggregates and fully utilizing GP resources, it was reasonable to believe that GP-11.0 had better compressive deformation capacity.
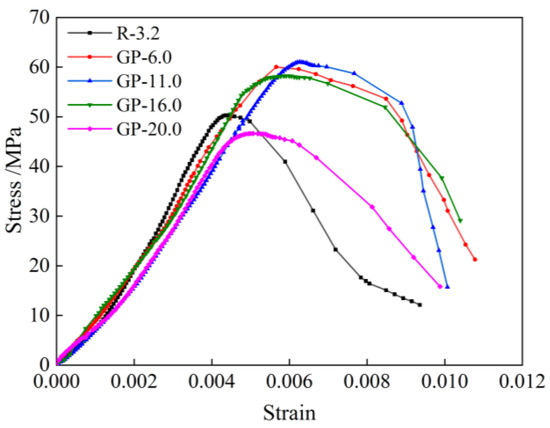
Figure 4.
Stress–strain curves of nuclear power concrete under compression.
Figure 5 illustrates the effect of GP content on the compressive strength and splitting tensile strength of nuclear power-manufactured sand concrete. It can be seen that the compressive strength and splitting tensile strength of nuclear power concrete both generally increased first and then decreased with the increase in GP content. Figure 5a showed that when GP content was 11.0%, the 7 d, 28 d, and 90 d compressive strength values reached their maximums, which were 26.7%, 24.1%, and 22.2% higher than that of R-3.2, respectively. When GP content was 20.0%, the 7 d, 28 d, and 90 d compressive strength values decreased by 8.0%, 7.4%, and 6.5% compared to that of R-3.2, indicating that GP had a significant effect on the compressive strength of nuclear power concrete, especially at early ages. In addition, the compressive strengths of GP-6.0 and GP-11.0 at three ages showed no significant difference, despite the evident difference in slump as shown in Figure 3. So, it was reasonable to believe that GP-11.0 had better compressive capacity.
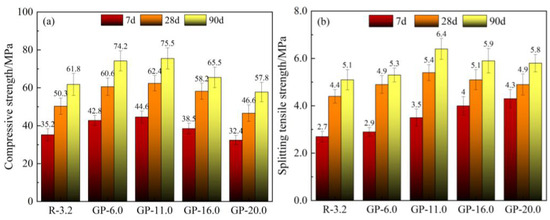
Figure 5.
Compressive and splitting tensile strength of concrete with GP content: (a) compressive strength; (b) splitting tensile strength.
Figure 5b shows that the 7-day splitting tensile strength increased with increasing GP content. When GP content was 20.0%, the splitting tensile strength reached its maximum, which was 59.3% higher than that of R-3.2. However, the splitting tensile strengths at 28 d and 90 d both first increased and then decreased with GP content increasing and reached their maximum values when GP content was 11.0%, which were 22.7% and 25.5% higher than that of R-3.2, respectively. Even when GP content reached 20.0%, 28-day and 90-day splitting tensile strengths were still 11.4% and 13.7% higher than that of R-3.2, respectively, which is consistent with Zhang et al.’s [30] experimental results. Compared with compressive strength, it can be found that GP had a greater effect on early-age splitting tensile strength, and its impact on splitting tensile strength was more significant than that on compressive strength. Taking strength at 90 d as an example, when GP content increased from 3.2% to 11.0% and then to 20.0%, the compressive–tensile ratio (compressive strength/splitting tensile strength) of concrete decreased from 17 to 13 and then to 11, respectively, indicating that the brittleness of concrete decreased. Moreover, the splitting tensile strengths of GP-11.0 at three ages were higher than that of GP-6.0, which was distinctly different from their performance in compressive strength. So, it was reasonable to believe that GP-11.0 had better tensile capacity.
Wang et al. [22] believed that finer stone powder mainly shows a filler effect when its amount is less than the optimum content, while it mainly shows a dilution effect when its amount surpasses the optimum content. This is because the addition of stone powder within a certain range can enhance the ITZ properties, optimize the particle gradation, and improve the compactness of concrete [31], but excessive GP content can actually deteriorate concrete due to increases in the water demand of concrete. So, the compressive strength of nuclear power concrete has an optimum GP content, which is about 11%. As for the splitting tensile strength, because the tensile strength of aggregates is higher than that of matrixes, the main damage occurs from the matrix and the ITZ between the matrix and aggregate particles when concrete is subjected to split tensile stress, so the splitting tensile strength increases with increasing GP content due to its enhancement on the matrix, especially for early-age concrete. But as age increases, the matrix becomes stronger and the main damage occurs from the ITZ when concrete is subjected to split tensile stress. As a result, the growth rate of splitting tensile strength slowed down with increasing GP content. It is believed that there should be an optimal value of GP content for splitting tensile strength according to the trend shown in Figure 5b, which should be greater than or equal to 20%. Considering the strength satisfying the design requirements, it was suggested that the GP content of nuclear power concrete should not exceed 11%.
3.3. Impermeability
According to GB/T 50082-2024 [32], the impermeability of nuclear power-manufactured sand concrete was measured using the “Test method for gradual pressure loading”. That is, water pressure is applied from 0.1 MPa and increases by 0.1 MPa every 8 h until either (1) three out of six test specimens exhibit water leakage or (2) the specified water pressure is reached and the number of leaking specimens does not exceed three. In this study, when GP content varied between 3.2% and 20.0%, nuclear power-manufactured sand concrete always met the P8 requirement. Concrete specimens were split (shown in Figure 6a) after water pressure was maintained at 0.9 MPa for 8 h and then the seepage heights of 4~6 specimens without water infiltration were measured, as shown in Figure 6c, where each point represents the average value of 24~36 points because six points are taken from each specimen.
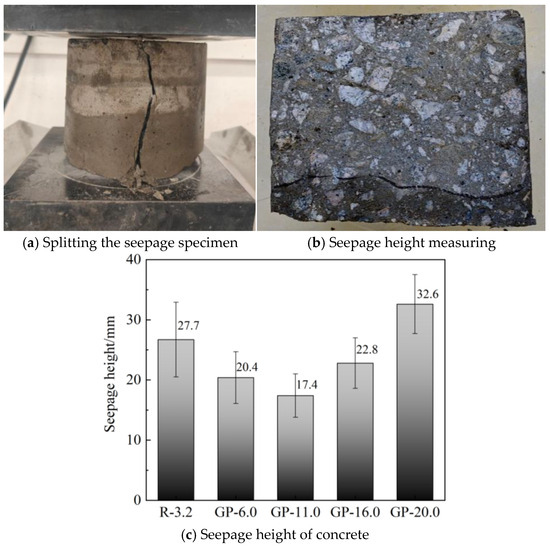
Figure 6.
Seepage height of concrete with GP content.
It can be seen from Figure 6c that the seepage height of nuclear power concrete decreased first and then increased with increasing GP content. The seepage height was the smallest when GP content was 11.0%, which was only 12% of the specimen height (150 mm), and it decreased by 31.1% compared to R-3.2. This indicated that the addition of a certain amount of GP improved the impermeability of nuclear power concrete. As the GP content continued to increase, the average seepage height increased. The water penetration height at a stone powder content of 20% was 22.5% higher than that of R-3.2, but it was only 22% of the specimen height, indicating that when GP content reached 20.0%, the water penetration resistance of nuclear power concrete was still good. In addition, it was found that the distribution of water seepage height on the cross-section of the specimens was more uniform when GP was added.
The reason for this phenomenon may be that GP has good particle gradation and complex particle morphology, which can exert good filling and microcrystalline nucleation effects [21], making the hardened cement paste and the interfacial transition zone denser, effectively resisting the intrusion of pressure water. However, excessive GP can affect the hydration of cement and weaken the bond between the paste and aggregate particles, leading to a decrease in the impermeability of concrete.
3.4. Microstructural Analysis
3.4.1. Thermal Analysis
Hydration products of cementitious systems will decompose and cause weight loss at a certain temperature. It is feasible to determine the substances and their contents through thermal analysis. Figure 7 shows the thermogravimetric (TG) curves of concrete for 28 d. It can be seen that the dehydration of the C-S-H gel and AFt occurs at 40~200 °C, and the dehydration of Ca(OH)2 occurs at 390~530 °C. When GP content is 3.2%, 11.0%, and 20.0%, the mass losses are 3.24%, 5.41%, and 4.12% at 40~200 °C, and the mass losses are 1.63%, 1.72%, and 1.67% at 390~530 °C, respectively. The maximum mass loss of two types of dehydration occurred when the GP content was 11%. That is, with the addition of GP, the hydration products C-S-H and AFt obviously increased, but there was little change in CH. Perhaps this was because SiO2 in GP can react with CH to generate more C-S-H, and then the reduction of CH promoted the hydration reaction continuously. However, due to its low activity, GP can only consume some CH, resulting in little change in CH in the cementitious system.
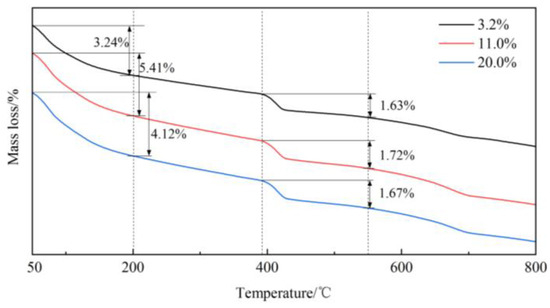
Figure 7.
TG curves of concrete.
3.4.2. SEM Analysis
To study the microstructure of nuclear power concrete after adding GP, a SEM test was conducted and is illustrated in Figure 8a–f. It was observed that hydration products such as C-S-H, CH, and AFt could be seen over the matrix, and FA particles, GP particles, and pores also could be observed. The C-S-H gel was present in large quantities in a flocculent and fibrous form, which was responsible for the strength and durability of concrete. The aggregated CH appeared layer upon layer, as shown in Figure 8a, and hexagonal plate-like CH crystals were found in some bubbles, as shown in Figure 8b. When GP content increases to 11%, it is obvious that the amount of CH decreases, as shown in Figure 8c, and a large number of elongated needle-like AFt with different sizes appear, forming an intertwined frame structure with the C-S-H gel; thus, the hydration products look densely packed and evenly distributed, as shown in Figure 8d. Furthermore, when GP content reaches 20%, the reduced fluidity of fresh concrete leads to an increase in pores and microcracks. More granular C-S-H appeared, as shown in Figure 8e,f.
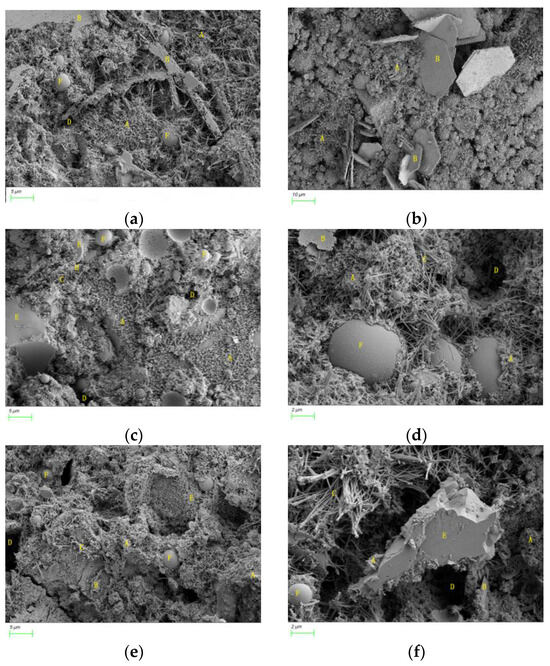
Figure 8.
SEM images of concrete: (a,b) R-3.2; (c,d) GP-11.0; (e,f) GP-20.0 (where A: C-S-H; B: CH; C: AFt; D: pore; E: GP particle; F: FA particle).
In concrete systems prepared with manufactured sand, the specific surface area of GP is large, and its micro-aggregate filling effect can improve the microstructure of hardened cement paste. It may even react with CH to generate more C-S-H, enhance the compactness of concrete, improve its compressive strength and splitting tensile strength, and improve the brittleness of concrete. When the GP content of manufactured sand was low (3.2%), cement hydration was relatively sufficient, and CH crystals were larger because of the higher actual water–binder ratio, so concrete had good fluidity in this case. Conversely, when GP content was 11.0%, SiO2 in GP participated in hydration reactions, consuming CH to produce more of and stronger C-S-H gels; then, more hydration products had a stronger entrainment effect on aggregates, which led to a dense microstructure, better fluidity, higher strength, and good impermeability, as shown in Figure 3, Figure 4, Figure 5 and Figure 6. However, when GP content exceeded a certain value (reaching 20.0%), on the one hand, the fine particles of stone powder absorbed water, reducing the actual water–cement ratio of the slurry and slowing down the hydration reaction [10]. At the same time, the viscosity of concrete increased and the workability deteriorated, which may lead to an increase in microcracks caused by hardening and drying shrinkage. On the other hand, excessive GP particles could also destroy the compact packing structure of the powder material, leading to an increase in pores and a decrease in strength [13].
3.4.3. Pore Structure
In order to study the effect of GP on the pore structure of nuclear power-manufactured sand concrete, an MIP test for concrete specimens with different GP contents aged for 28 days was analyzed. Table 4 and Figure 9 showed that the porosity of concrete first increased and then decreased with the increase in GP content, exhibiting a similar trend in slump, compressive strength, and splitting tensile strength, as shown in Figure 3, Figure 4, Figure 5 and Figure 6. When GP content increased from 3.2% to 11.0%, the porosity decreased by 13.50%, the median pore size decreased by 19.0%, the most probable pore size decreased by 21.0%, and the average pore size decreased by 38.53%. That is, when the GP content of manufactured sand was 11%, the pore structure of nuclear power concrete was significantly refined. When GP content reached 20.0%, the porosity increased by 26.7%, but the median pore size, average pore size, and the most probable pore size slightly decreased compared to those at 3.2%. In addition, when the GP content was 20%, the volume of capillary pores larger than 200 nm significantly increased compared to when GP content was 3.2% and 11.0%. As shown in Figure 9a,b, GP-16.0 and GP-20.0 have more pores in 1000~10,000 nm. GP-11.0 has a smaller cumulative pore volume and a smaller most probable pore size compared to GP-6.0, indicating that GP-11.0 has a finer pore structure.
Table 4.
MIP results of concrete.
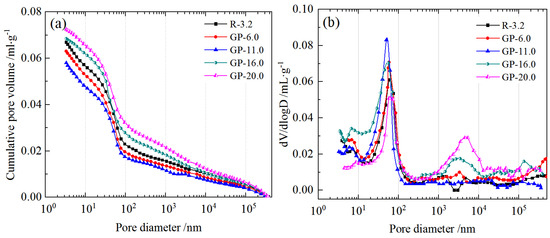
Figure 9.
MIP results of concrete: (a) the cumulative pore volume; (b) pore size distribution.
Therefore, it can be seen from the MIP results that an appropriate amount of GP can optimize the pore structure of nuclear power concrete, while excessive stone powder can lead to an increase in capillary pores in the concrete, which will inevitably lead to a decrease in strength and a deterioration in impermeability. This was attributed to the GP’s pore-filling effect, as well as the reaction between SiO2 in GP and cement hydration products resulting in more products, which together produced a dense matrix and the refined pore structure.
4. Conclusions
- (1)
- With the increase in GP content, the compressive strength of nuclear power concrete both increased first and then decreased. The 7 d, 28 d, and 90 d compressive strength all reached maximum values when GP content was 11%, which is 26.7%, 24.1%, and 22.2% higher than that with a GP content of 3.2%, respectively. The splitting tensile strengths at 28 d and 90 d both first increased and then decreased with increasing GP content and reached the maximum when GP content was 11%, while 7-day splitting tensile strength increased with increasing GP content.
- (2)
- With the increase in GP content, the slump of manufactured sand nuclear power concrete increases first and then decreases. The impermeability of nuclear power concrete first improves and then weakens.
- (3)
- The effect of GP on the performance of nuclear power concrete is attributed to its micro-aggregate-filling effect and microcrystalline nucleation effects. With the addition of GP, the hydration products C-S-H and AFt increase, the microstructure becomes denser, and the pore structure of concrete is refined. When GP content is 11%, the porosity, the median pore size, the most probable pore size, and the average pore size decrease by 13.50%, 19.0%, 21.0%, and 38.53%, respectively.
- (4)
- For manufactured sand nuclear power concrete, GP content should be controlled within 11% to ensure good construction performance, high strength, and good impermeability.
Author Contributions
Conceptualization, X.D.; methodology, X.D. and Z.L.; validation, Z.L. and X.P.; formal analysis, R.C. and H.W.; investigation, Z.L. and X.H.; data curation, Z.Z.; writing—original draft preparation, X.D. and Z.L.; writing—R.C. and Z.Z.; visualization, X.P. and H.W.; funding acquisition, X.D. and X.H. All authors have read and agreed to the published version of the manuscript.
Funding
This research was funded by the Guizhou Provincial Basic Research Program (Natural Science) (no. QKHJC-ZK [2023] YB261) and the China Electric Power Construction Group Technology Research and Development Project (no. ZSGN-KW2404-004).
Data Availability Statement
The original contributions presented in this study are included in the article. Further inquiries can be directed to the corresponding author.
Conflicts of Interest
Author Xiaobo Hao, Xiaofan Peng and Hongmei Wu were employed by the company Sinhydro Bureau 9 Co., Ltd. The remaining authors declare that the research was conducted in the absence of any commercial or financial relationships that could be construed as a potential conflict of interest.
References
- Xiao, J.; Zou, S.; Poon, S.C.; Sham, M.L.; Li, Z.; Shah, S.P. We use 30 billion tonnes of concrete each year—Here’s how to make it sustainable. Nature 2025, 638, 888–890. [Google Scholar] [CrossRef] [PubMed]
- Zheng, S.; Liang, J.; Hu, Y.; Wei, D.; Lan, Y.; Du, H.; Rong, H. An experimental study on compressive properties of concrete with manufactured sand using different stone powder content. Ferroelectrics 2021, 579, 189–198. [Google Scholar] [CrossRef]
- GB/T 14684-2022; Sand for Constructions. Standard Press of China: Beijing, China, 2022.
- Fu, T.; Liang, J.; Lan, Y.; Xiao, Y.; Wei, J. Effect of Stone Powder Content on Mechanical Properties of Manufactured Sand Concrete. Iran. J. Sci. Technol. Trans. Civil. Eng. 2022, 46, 4255–4264. [Google Scholar] [CrossRef]
- Alyousef, A.; Benjeddou, O.; Soussi, C.; Khadimallah, M.A.; Mustafa Mohamed, A. Effects of incorporation of marble powder obtained by recycling waste sludge and limestone powder on rheology, compressive strength, and durability of self-compacting concrete. Adv. Mater. Sci. Eng. 2019, 2019, 4609353. [Google Scholar] [CrossRef]
- Wu, H.; Shen, B.; Ma, K.; Xuan, D. Assessment of mechanical properties of C80 concrete prepared with different stone powder contents by a statistical analysis. J. Build. Eng. 2022, 56, 104754. [Google Scholar] [CrossRef]
- Li, H.; Wang, Z.; Sun, R.; Huang, F.; Yi, Z.; Yuan, Z.; Wen, J.; Lu, L.; Yang, Z. Effect of different lithological stone powders on properties of cementitious materials. J. Clean. Prod. 2021, 289, 125820. [Google Scholar] [CrossRef]
- Feng, Q.; Yuan, C.; Tian, H.; Qiao, H.; Wang, P.; Gou, C. Study on the mechanism of multi-lithologic manufactured sand powder on the properties of cement-based materials. Mater. Rep. 2026, 40, 25050029. (In Chinese) [Google Scholar]
- Jalil, A.K.; Liaqat, Q.A.; Ayaz, N.M.K.; Gul, A.; Umar, M.; Manan, A.; Badrashi, Y.I.; Abbas, A.; Javed, U.; Farooq, R. Axial Compressive Behavior of Reinforced Concrete (RC) Columns Incorporating Multi-Walled Carbon Nanotubes and Marble Powder. Crystals 2021, 11, 247. [Google Scholar] [CrossRef]
- Ersoy, O.; Köse, H.; Güler, K.D. Time-Dependent Rheological Behavior of Surface-Coated Calcite Powder: Implications for Industrial Applications. Crystals 2025, 15, 568. [Google Scholar] [CrossRef]
- Wang, T.; Wang, H.; Li, C. Experimental study on the influence of waste stone powder on the properties of alkali-activated slag/metakaolin cementitious materials. Crystals 2025, 15, 1039. [Google Scholar] [CrossRef]
- Rodrigues, R.; Brito, J.; Sardinha, M. Mechanical properties of structural concrete containing very fine aggregates from marble cutting sludge. Constr. Build. Mater. 2015, 77, 349–356. [Google Scholar] [CrossRef]
- Zheng, J.; Zhu, Y.; Zhao, Z. Utilization of limestone powder and water-reducing admixture in cemented paste backfill of coarse copper mine tailings. Constr. Build. Mater. 2016, 124, 31–36. [Google Scholar] [CrossRef]
- Dhir, R.K.; Limbachiya, M.C.; McCarthy, M.J.; Chaipanich, A. Evaluation of portland limestone cements for use in concrete construction. Mater. Struct. 2007, 40, 459–473. [Google Scholar] [CrossRef]
- Hyun, H.J.; Lee, Y.B.; Kim, Y.Y. Composite Properties and micromechanical analysis of highly ductile cement composite incorporating limestone powder. Appl. Sci. 2018, 8, 151. [Google Scholar] [CrossRef]
- Aliabdo, A.A.; Elmoaty, A.E.M.A.; Auda, E.M. Re-use of waste marble dust in the production of cement and concrete. Constr. Build. Mater. 2014, 50, 28–41. [Google Scholar] [CrossRef]
- Wu, H.M.; Liu, K.; Yang, F.; Shen, B.; Ma, K.; Zhang, J.; Liu, B. Experimental mechanical properties and numerical simulation of c80 concrete with different contents of stone powder. Materials 2022, 15, 3282. [Google Scholar] [CrossRef]
- Shi, L.; Ma, H. Experimental Study on Effect of limestone powder on concrete properties in mechanism sand. Integr. Ferroelectr. 2021, 215, 38–46. [Google Scholar] [CrossRef]
- Guan, M.; Wei, C.; Wang, Y.; Lai, Z.; Xiao, Q.; Du, H. Experimental investigation of axial loaded circular steel tube short columns filled with manufactured sand concrete. Eng. Struct. 2020, 11, 10–33. [Google Scholar] [CrossRef]
- Poppe, A.; De Schutter, G. Cement hydration in the presence of high filler contents. Cem. Concr. Res. 2005, 35, 2290–2299. [Google Scholar] [CrossRef]
- Bonavetti, V.; Donza, H.; Menéndez, G.; Cabrera, O.; Irassar, E. Limestone filler cement in low w/c concrete: A rational use of energy. Cem. Concr. Res. 2003, 33, 865–871. [Google Scholar] [CrossRef]
- Wang, D.; Shi, C.; Farzadnia, N.; Shi, Z.; Jia, H. A review on use of limestone powder on the properties of concrete. Constr. Build. Mater. 2018, 181, 153–166. [Google Scholar] [CrossRef]
- NB/T 20549-2019; Code for Durability Design of Nuclear Safety Related Concrete Structure. Atomic Energy Press of China: Beijing, China, 2022.
- GB/T 31545-2015; Portland Cement for Nuclear Power Engineering. Standard Press of China: Beijing, China, 2015.
- GB/T 14685-2022; Pebble and Crushed Stone for Construction. Standard Press of China: Beijing, China, 2022.
- JGJ 55-2011; Specification for Mix Proportion Design of Ordinary Concrete. China Architecture & Building Press: Beijing, China, 2011.
- NB/T 20378-2016; Design Specification for Mix Design of Shielding Concrete Used in Nuclear Power Plant. Atomic Energy Press of China: Beijing, China, 2016.
- GB/T 50080-2016; Standard for Test Method of Performance on Ordinary Fresh Concrete. China Architecture & Building Press: Beijing, China, 2016.
- GB/T 50081-2019; Standard for Test Methods of Concrete Physical and Mechanical Properties. China Architecture & Building Press: Beijing, China, 2019.
- Zhang, M.; Xu, J.; Li, M.; Yuan, X. Influence of stone powder content from manufactured sand concrete on shrinkage, cracking, compressive strength, and penetration. Buildings 2023, 13, 1833. [Google Scholar] [CrossRef]
- Nikbin, I.M.; Beygi, M.H.A.; Kazemi, M.T.; Amiri, J.V.; Rabbanifar, S.; Rahmani, E.; Rahimi, S. A comprehensive investigation into the effect of water to cement ratio and powder content on mechanical properties of self-compacting concrete. Constr. Build. Mater. 2014, 57, 69–80. [Google Scholar] [CrossRef]
- GB/T 50082-2024; Standard for Test Methods of Long-Term Performance and Durability of Concrete. Standard press of China: Beijing, China, 2022.


Disclaimer/Publisher’s Note: The statements, opinions and data contained in all publications are solely those of the individual author(s) and contributor(s) and not of MDPI and/or the editor(s). MDPI and/or the editor(s) disclaim responsibility for any injury to people or property resulting from any ideas, methods, instructions or products referred to in the content. |
© 2026 by the authors. Licensee MDPI, Basel, Switzerland. This article is an open access article distributed under the terms and conditions of the Creative Commons Attribution (CC BY) license.