Abstract
High iron stores have been reported to be associated with type 2 diabetes mellitus (T2DM). However, evidence for the associations of iron metabolism with T2DM is inconsistent, and whether there is a threshold effect remains controversial. In the present study, we aimed to examine the associations between various iron biomarkers and the risk of T2DM as well as impaired glucose metabolism (IGM) and hyperglycemia in Chinese women of childbearing age. A total of 1145 women were divided into three groups (normal blood glucose metabolism group; IGM group; T2DM group). Biomarkers of iron metabolism (serum ferritin (SF), transferrin, soluble transferrin receptor (sTfR), transferrin saturation, serum iron, total body iron, and sTfR-to-lgferritin index) were measured. After adjusting for various confounding risk factors, SF and sTfR were positively associated with the risk of IGM (fourth vs. first quartile: SF odds ratio (OR) = 1.93 (95% CI 1.17–3.20) and sTfR OR = 3.08 (95% CI 1.84–5.14)) and T2DM (SF OR = 2.39 (95% CI 1.40–4.06) and sTfR OR = 3.84 (95% CI 2.53–5.83)). There was a nonlinear relationship between SF and risk of T2DM and hyperglycemia (p for nonlinearity < 0.01). Our findings suggested that SF and sTfR could be independent predictors of T2DM risk.
1. Introduction
According to the International Diabetes Federation, the global diabetes prevalence in 2019 was 9.3% (463 million people), estimated to rise to 10.2% (578 million) by 2030 and 10.9% (700 million) by 2045 [1]. Type 2 diabetes (T2DM) has become a global pandemic and a threat to human health and global economies. The etiology of T2DM is multi-factorial and not fully demonstrated yet.
Iron is an essential trace element for humans to regulate metabolic processes such as DNA synthesis and oxygen transport. It is involved in the production of reactive oxygen species. Thereby, elevated body iron stores have been reported to cause high levels of oxidative stress and decreased insulin secretory capacity [2]. Iron overload has also been described as a possible cause of T2DM and its comorbidities [3].
Serum ferritin (SF), the most commonly used marker of the body’s iron storage, has been widely reported to be associated with an increased risk of T2DM [4,5]. However, epidemiologic evidence is not consistent, as several studies reported a null association either in the whole population [6] or in women [7]. Furthermore, though some researchers have explored a dose–response relationship between SF and T2DM risk [8,9,10,11], no clear-cut range within which the SF should be maintained was established.
As SF is affected by many factors, such as inflammation and liver disease and injury [12], other biomarkers of iron metabolism are needed to provide additional information on the role of iron in the pathogenesis of T2DM. Common indicators include transferrin, transferrin saturation (TSAT), soluble transferrin receptor (sTfR), serum iron (SI), etc. For instance, a large prospective European case-cohort study explored the associations of multiple iron biomarkers such as SF, transferrin, TSAT, and SI with incident of T2DM [9]. However, most prior studies were carried out among Western populations [13,14,15], and the results were highly heterogeneous. Moreover, the conclusive evidence for Asian, especially Chinese, populations is limited [16,17]. The role played by iron stores in T2DM in Asian populations has remained poorly understood. Therefore, it is necessary to analyze the relationship between iron stores and T2DM in the Chinese population.
Pregnant women are more sensitive to iron malnutrition and abnormal glucose metabolism, which could lead to an increased risk of adverse pregnancy outcomes. Although previous studies reported that excessive iron was linked to T2DM risk, Li et al. reported that insufficient iron intake could also increase the risk of T2DM in Chinese women [18]. The evidence so far has been inconsistent. Therefore, in the present research, we aimed to assess the associations of multiple biomarkers of iron metabolism, including SF, transferrin, sTfR, SI, TSAT, total body iron (TBI), and sTfR-to-lgferritin (sTfR-F) index, with IGM and T2DM risk in Chinese women of childbearing age, to provide strong evidence to fully clarify the role of iron metabolism in the development of T2DM and better guide iron reference intake in these populations.
2. Materials and Methods
2.1. Subjects
The present study was based on the data obtained from the database of the China Adult Chronic Disease and Nutrition Surveillance (2015), a nationally representative cross-sectional survey. The study was designed as a case-control study of T2DM patients. A total of 1145 women of childbearing age (18–44 years) with a complete physical examination were selected for the study. Pregnant and lactating women were excluded.
Subjects were classified into three groups (I, II, III) based on their glycemic states according to the WHO criteria [19] (NGM group, FBG < 6.1 mmol/L, N = 381; IGM group, FBG ≥ 6.1 mmol/L but <7.0 mmol/L, N = 353; T2DM group, FBG ≥ 7 mmol/L, or glycated hemoglobin (HbA1c) > 6.5%, N = 411). The sample selection was performed randomly to minimize any bias.
All of the subjects gave their informed consent for inclusion before they participated in the study. The study was conducted in accordance with the Declaration of Helsinki, and the protocol was approved by the Ethics Committee of the National Institute of Nutrition and Health, Chinese Center for Disease Control and Prevention (file number 201519-B).
2.2. Data Collection and Variable Classifications
Physical examinations were performed by trained medical staff following standardized procedures. Height and weight were measured while subjects were wearing light clothing without shoes. BMI was calculated as weight (kg) divided by square of height (m2). Waist circumference (WC, cm) was measured by a tape measure with a precision of 0.1 cm. Systolic blood pressure (SBP; mmHg) and diastolic blood pressure (DBP; mmHg) were measured three times, and the average was used in the analysis.
2.3. Laboratory Measurements
Fasting venous blood was collected from each participant and divided into an anticoagulation tube and a serum separator tube, separately. The blood samples in the serum separator tube were promptly centrifuged at 3000× g for 15 min after blood collection, divided into an aliquot of serum, and frozen at −80 °C for subsequent assays. FBG, high-density lipoprotein cholesterol (HDL-C), low-density lipoprotein cholesterol (LDL-C), total cholesterol (TC), triglyceride (TG), and C-reactive protein (hsCRP) levels were measured by enzymatic methods using an automatic biochemical analyzer (Hitachi 7600, Tokyo, Japan). The SF concentrations were measured by an enzymatic method using the Roche Cobac e601 automatic electrochemiluminescence immunoassay system. Transferrin, sTfR, and α-acid glycoprotein (AAG) concentrations were measured by the Roche Cobac C601 automatic biochemical analyzer (Switzerland). SI concentrations were detected by inductively coupled plasma mass spectrometry (ICP-MS, PerkinElmer, NexION 350, Waltham, MA, USA). In addition, TSAT, TBI, and sTfR-F index were calculated as follows: TSAT = SI (μmol/L)/(transferrin (g/L) × 25.2) [20], TBI = −[log(sTfR/SF)-2.8229]/0.1207 [21], and sTfR-F index = sTfR (mg/L)/lgferritin (ng/mL).
2.4. Statistical Analysis
Data management and statistical analyses were performed with IBM SPSS version 23 (SPSS Inc., Chicago, IL, USA) and R version 4.0.3 statistical software, with the smoothHR, survival, rms, Hmisc, and SparseM packages (The Comprehensive R Archive Network: http://cran.rproject.org (accessed on 2 September 2022)). Data are presented as mean with standard deviation (SD) for normally distributed variables, or median with first and third quartiles (P25 and P75) for non-normally distributed variables. Categorical variables are presented as percentages and compared by using the chi-squared test.
Partial Pearson coefficients adjusted for age, education, physical activity, district, and city type between markers of iron metabolism and risk factors of T2DM were calculated in the overall study sample.
Multivariate logistic regression was applied to analyze the relationship between iron biomarkers and risk of IGM, T2DM, and hyperglycemia. The levels of SF, sTfR, transferrin, SI, TSAT, TBI, and sTfR-F index were categorized into quartiles. The odds ratios (ORs) and the 95% confidence intervals (95% CIs) were estimated using the lowest quartile as the reference. The crude model was not adjusted. The model was adjusted for age, education, race, smoke, drink, exercise, BMI, WC, SBP, DBP, TC, TG, HDL-C, LDL-C, UA, hemoglobin, and inflammatory markers such as hsCRP and AAG. A p-trend analysis was performed by treating the quartiles as continuous variables in the regression analyses. All of the statistical tests were two-sided, and statistical significance was determined as p < 0.05.
The possible nonlinear relation between iron markers and IGM, T2DM, and hyperglycemia risks was analyzed using restricted cubic spline regression with knots at the 25th, 50th, and 75th percentiles of these markers.
3. Results
3.1. Characteristics of the Study Population
Demographic and clinical data of the participants for women of childbearing age are shown in Table 1. Compared with the normal NGM group (32.6 (25.8–40.4) years), subjects of IGM and T2DM groups had higher median ages (39.9 (34.6–43.1) years and 39.4 (34.0–42.8) years, respectively). In addition, subjects in IGM and T2DM groups had higher levels of body mass index (BMI), waist circumference (WC), systolic blood pressure (SBP), diastolic blood pressure (DBP), triglyceride (TG), total cholesterol (TC), low-density lipoprotein cholesterol (LDL-C), and uric acid (UA), but lower levels of high-density lipoprotein cholesterol (HDL-C) compared to those in the NGM group (p < 0.001). Inflammatory indicators such as α-acid glycoprotein (AAG) and high-sensitivity C-reactive protein (hsCRP) increased significantly across the spectrum of NGM, IGM, and T2DM. However, no significant differences were observed in the hemoglobin levels between the three different groups (p > 0.05).

Table 1.
General characteristics of the study population (n = 1145, medians and interquartile ranges (P25–P75)).
3.2. Characteristics of the Iron Status
Distribution data of biomarkers of iron metabolism such as SF, transferrin, sTfR, TSAT, SI, TBI, and sTfR-F-index for women of childbearing age are listed in Table 2. SF levels were the highest in the T2DM group, followed by IGM and NGM groups, in order. There were significant statistical differences among the three groups (p < 0.01). Similarly, the sTfR levels in IGM and T2DM groups were significantly higher compared with those in the NGM group (p < 0.01). On the contrary, TSAT and SI levels in the NGM group were higher than those in IGM and T2DM groups. Among the three groups, TBI levels were the highest in the T2DM group. The concentrations of transferrin in these three groups had no significant difference.
Table 2.
Characteristics of the iron status of the studied population (medians and interquartile ranges (P25–P75)).
Table 3 summarizes the partial correlation coefficients between biomarkers of iron metabolism and several T2DM risk factors in the overall study sample, adjusted for age, education, physical activity, district, city type, and T2DM status. All investigated iron markers showed strong correlations with each other (p < 0.01). Among them, SF levels were positively correlated with SI, TBI, and TSAT, and inversely correlated with sTfR, transferrin, and sTfR-F-index. In addition, components including BMI, WC, and TG were moderately correlated with SF, transferrin, and TBI levels, while none of them correlated with sTfR, SI, and TSAT. Inflammatory biomarkers such as hsCRP and AGG were positively correlated with SF only. Furthermore, FBG was observed to be moderately correlated with SF and sTfR, and HbA1c levels were correlated with transferrin only.
Table 3.
Partial Pearson coefficients (adjusted for age, education, physical activity, district, and city type) between markers of iron metabolism and risk factors of T2DM in the overall study sample (n = 1145).
3.3. Odds Ratios for IGM, T2DM, and Hyperglycemia in Quartiles of Markers of Iron Storage
To evaluate the associations between levels of iron biomarkers and the risk of IGM, T2DM, and hyperglycemia, multivariate logistic analysis was applied. The results are summarized in Table 4.
Table 4.
Association between markers of iron metabolism and IGM, T2DM, or hyperglycemia.
Compared with the lowest SF quartile, the ORs for IGM and T2DM in the highest quartile were 2.09 (95% confidence interval (CI), 1.38–3.17) and 3.60 (2.37–5.48), respectively. The ORs were attenuated but remained significant after adjustment for age, education, race, smoke, drink, exercise, BMI, WC, SBP, DBP, TC, TG, HDL-C, LDL-C, UA, hemoglobin, and inflammatory markers such as hsCRP and AAG (the adjusted OR for IGM and T2DM in the fourth quartile of SF levels were 1.93 (1.17–3.20) and 2.39 (1.40–4.06), respectively).
High levels of sTfR also showed a significant trend towards increased risk of IGM and T2DM. In the adjusted model for sTfR, the ORs for IGM and T2DM in the fourth quartile of sTfR were 3.08 (1.84–5.14) and 2.47 (1.50–4.07), respectively. Finally, in the adjusted model for sTfR-F-index, the ORs for IGM and T2DM were 1.85 (1.12–3.05) and 1.16 (0.70–1.92), respectively.
The same models were employed in evaluating the relationship between the other iron biomarkers and the risk of IGM and T2DM. There were no significant associations between transferrin, SI, TBI, and TSAT levels and the risk of IGM, even after adjusting for confounding factors. However, the fourth quartile of TBI increased the risk of incident of T2DM (OR = 2.36 (1.57–3.53)) and the lower quartiles of SI and TSAT were associated with higher ORs of T2DM (p < 0.05). No significant associations between IGM, T2DM, and transferrin were observed in our study.
In addition, the RCS analysis revealed a nonlinear relationship between SF and risk of T2DM and hyperglycemia (p < 0.01 for nonlinearity), but not with IGM risk (p = 0.06 for nonlinearity) (Figure 1). This indicated that there was a possible threshold effect for the SF on T2DM and hyperglycemia risk. There was no strong evidence of a nonlinear relationship between SF and risk of IGM.
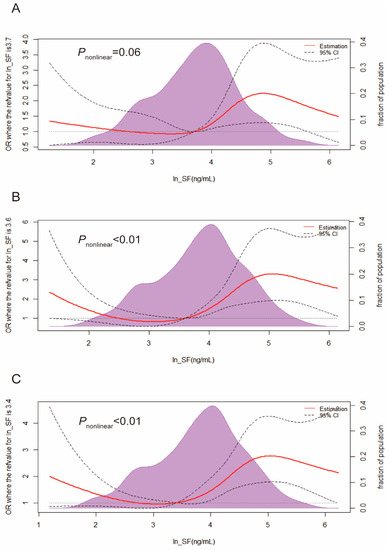
Figure 1.
Restricted cubic spline regression analysis for the association between SF and IGM (A), T2DM (B), and hyperglycemia (C). The analysis was adjusted for age, education, race, smoke, drink, exercise, BMI, WC, SBP, DBP, TC, TG, HDL-C, LDL-C, UA, hemoglobin, hsCRP, and AAG. Abbreviation: CI, confidence interval; IGM, impaired glucose metabolism; T2DM, type 2 diabetes mellitus.
4. Discussion
In the present study, the associations of multiple iron metabolism biomarkers, including SF, transferrin, sTfR, TSAT, SI, TBI, and sTfR-F-index, with IGM, T2DM, and hyperglycemia were investigated. We found that higher SF levels were significantly associated with an increased risk of IGM, T2DM, and hyperglycemia in this research. These associations were slightly attenuated but still significant after adjustment for various confounding risk factors. This finding suggests that SF plays a significant role in T2DM development.
SF regulates iron homeostasis and is a widely used marker for body iron stores [22]. The association between SF and T2DM risk has been extensively studied. With the exception of a few studies that found no association between SF and T2DM risk [6], most cross-sectional and prospective studies have demonstrated a positive association between SF levels and T2DM in different populations [10,23,24,25,26]. It is well known that SF, in addition to reflecting body iron stores, is also influenced by systemic inflammation, which is thought to be involved in the pathophysiological mechanisms underlying diabetes [27]. In the present study, the adjustment of inflammatory markers such as hsCRP and AAG did not materially change the association between SF and IGM, T2DM, and hyperglycemia. Similar results were obtained in a nested case-control study in Japanese individuals [23] and in a French prospective cohort [13] with adjustment for inflammatory markers. These findings showed that the associations between SF with IGM, T2DM, and hyperglycemia were independent of inflammation. Furthermore, metabolic syndrome and obesity were also risk factors for T2DM and cardiovascular diseases [28]. In our study, the positive associations remained significant even after adjustment for components of metabolic syndrome (including SBP, DBP, TG, LDL-C, and HDL-C), BMI, and WC, which excluded confounding factors of metabolic syndrome and obesity. Similar results were also reported in previous studies [10]. Therefore, SF is considered to be an independent risk factor for IGM, T2DM, and hyperglycemia. It should be noted that SF was significantly increased in subjects with IGM compared with NGM subjects, which was consistent with previous reports [29,30]. Therefore, SF could be a useful biomarker in the early monitoring and prevention of T2DM in Chinese women of childbearing age, similar to Western populations [8,13].
Although the relationship between SF and T2DM has been well clarified, the dose–response of SF is still controversial. In a European cohort research, a significant linear dose–response relationship was observed between SF levels and T2DM risk (hazard ratio [95%] in men and women: 1.07 [1.01–1.12] and 1.12 [1.05–1.19] per 100 ng/mL higher SF level, respectively) [9]. Furthermore, the linear dose–response relationship was also observed in a meta-analysis including 10 prospective studies [11]. Different from the above-mentioned results, other studies have reported a nonlinear association only in the highest category. For example, the result of a 4-year cohort study in South Korea showed that T2DM risk increased in healthy men with SF above 200.6 ng/mL at baseline, suggesting a possible threshold effect between SF and T2DM risk [10]. Another cohort study of European men showed a threshold of about 300 ng/mL [31]. In the present study, we observed that T2DM risk increased significantly when the SF levels were higher than 101.4 ng/mL. Given the different results of the studies, the threshold value cannot be determined at present, and more research relying on larger population samples is needed to fully analyze the dose–effect relationship between SF and T2DM.
Given that the essential role of SF in the organism is the storage of iron, the potential mechanism linking elevated SF with T2DM may be described as follows. Iron is a catalyst for reactive oxygen species, such as hydroxyl radicals, leading to oxidative stress. Iron-induced oxidative stress mediates the apoptosis of pancreatic islets with a resulting decrease in insulin secretory capacity [32]. Alternatively, iron-induced oxidative damage in the liver, pancreas, and the muscle may be the main mechanism of insulin resistance [33]. Furthermore, iron accumulation in hepatocytes may cause impaired hepatic insulin extraction and metabolism [34]. Iron may enhance fatty acid oxidation and suppress glucose oxidation in muscle tissue [35] as well as influence insulin function and glucose uptake in adipose tissue [36].
Furthermore, we measured transferrin, sTfR, TSAT, serum iron, TBI, and sTfR-F-index to provide additional information on the role of iron in the pathogenesis of T2DM. sTfR is the truncated form of the transferrin receptor. Since it is closely related to cellular iron uptake [37] and unaffected by the acute-phase response, it has been proposed to be a novel marker of iron status. Low iron stores result in increased sTfR levels [38]. As expected, we observed an inverse correlation between sTfR and SF in our study. However, the sTfR levels in IGM and T2DM groups were significantly higher than those in the NGM group. Elevated sTfR levels were associated with a higher risk of IGM, T2DM, and hyperglycemia, even after adjustment for possible confounding risk factors. Accordingly, TBI, calculated by SF and sTfR, was also found to be positively correlated with T2DM risk. Similar findings have been reported in some, but not all, studies. The Diabetes Prevention Program cohort study observed that high levels of sTfR increased the risk of T2DM among overweight and obese persons with impaired glucose tolerance [14]. In the nested case-control study among Caucasian individuals [39], sTfR was directly associated with the risk of T2DM in obese individuals and inversely associated in non-obese individuals. These studies speculated that sTfR may reflect a chronic pathological state such as obesity that is causally related to the development of T2DM, possibly unrelated to iron stores [14]. Alternatively, experiments in animal models indicated that acute insulin administration could lead to an increase in sTfR concentration [40]. That is, sTfR levels may be affected by mechanisms other than those related to Fe metabolism (such as insulin sensitivity and obesity), and they could be causally linked to T2DM [37]. However, inconsistent research has also been reported. In a cohort study of the Potsdam European Prospective Investigation into Cancer and Nutrition [8] and cohorts of the Cooperative Health Research in the Region of Augsburg [30], sTfR levels were not related to the risk of T2DM. Taken together, the relationship between sTfR and T2DM is complex and not well understood.
Transferrin is the main iron transport protein in blood. If body iron stores are low, circulating transferrin levels increase. Although transferrin is inversely correlated with SF, transferrin is also positively associated with T2DM risk among French and German populations in previous studies [13,30]. The mechanism may be partially explained by the fact that transferrin has an antagonist effect on insulin in vivo [41] and could induce insulin resistance in adipocytes [42,43]. However, in the present study, no significant associations were observed between transferrin and risk of IGM, T2DM, and hyperglycemia. The reason for this discrepancy may be the different ethnic population and sex.
Elevated TSAT (serum iron expressed as a percentage of the total iron binding capacity) is a useful indicator of iron overload. In previous studies, the relationships between TSAT and the risk of T2DM were mostly heterogeneous. Three population-based studies have indicated a significantly higher risk of T2DM if the TSAT is >50% [15]. A prospective European case-cohort study found that elevated TSAT (≥45% vs. <45%) was associated with a lower risk of T2DM in women only [9]. In two other studies, no significant associations were observed between TSAT and T2DM [44,45], in line with our present results. Some of the representative studies mentioned in the discussion above are summarized in Table 5.
Table 5.
Characteristics of study on the association between iron metabolism and T2DM risk.
Our study has several strengths. First, we used data from a reliable, nationally representative database. This provided us with a unique opportunity to study the association between the markers of iron metabolism and T2DM in the general population. Second, multiple iron biomarkers were comprehensively assessed to better evaluate the iron status in IGM and T2DM populations and their associations with IGM and T2DM risk. Third, we adjusted for a large variety of possible confounding T2DM risk factors such as blood pressure, BMI, WC, and various metabolic and inflammatory markers. Nevertheless, this study has several limitations. First, due to the inherent limitations of the cross-sectional study design, we cannot imply a causal relationship between the iron metabolism biomarkers with IGM and T2DM. Longitudinal studies are needed to establish the role of iron metabolism in T2DM development. Second, we cannot rule out the confounding effects of adiponectin and liver enzymes such as alanine transaminase (ALT) and gamma-glutamyl transpeptidase (GGT). It has been reported that adiponectin or liver disease may mediate the relationship between iron and glucose metabolism [5,46]. These residual confounding factors may have affected our results. In the future, large prospective studies as well as intervention studies with comprehensive consideration of the influence of relevant factors are warranted to determine whether there is a causal relationship and threshold effect between body iron levels and T2DM.
5. Conclusions
In conclusion, we found that SF and sTfR are independently and positively associated with the risk of IGM, T2DM, and hyperglycemia in Chinese women of childbearing age. There is a possible threshold effect for the SF levels on T2DM and hyperglycemia risk. Transferrin and TSAT are not associated with the risk of the IGM, T2DM, and hyperglycemia. These findings have important clinical significance for monitoring iron biomarkers in the development of T2DM and early prevention.
Author Contributions
J.F.: Writing—original draft, investigation, methodology; X.S.: Writing—review, formal analysis, investigation; L.W.: investigation; J.L.: resources; Y.C.: resources; L.Y.: conceptualization, supervision. All authors have read and agreed to the published version of the manuscript.
Funding
This research was funded by the National Financial Projects: Assessment and Application of Nutrients Requirement and Food Environment for Chinese Residents (No. 131031107000210003).
Institutional Review Board Statement
The study was conducted in accordance with the Declaration of Helsinki, and the protocol was approved by the Ethics Committee of the National Institute of Nutrition and Health, Chinese Center for Disease Control and Prevention (file number 201519-B) on 15 June 2015.
Informed Consent Statement
Informed consent was obtained from all subjects involved in the study.
Data Availability Statement
Not applicable.
Acknowledgments
We are grateful to all the participants in our study and all the staff working on the 2015 China Adult Chronic Disease and Nutrition Surveillance.
Conflicts of Interest
The authors declare no conflict of interest.
References
- Saeedi, P.; Petersohn, I.; Salpea, P.; Malanda, B.; Karuranga, S.; Unwin, N.; Colagiuri, S.; Guariguata, L.; Motala, A.A.; Ogurtsova, K.; et al. Global and regional diabetes prevalence estimates for 2019 and projections for 2030 and 2045: Results from the International Diabetes Federation Diabetes Atlas, 9(th) edition. Diabetes Res. Clin. Pract. 2019, 157, 107843. [Google Scholar] [CrossRef] [PubMed]
- Simcox, J.A.; McClain, D.A. Iron and diabetes risk. Cell Metab. 2013, 17, 329–341. [Google Scholar] [CrossRef]
- Wilson, J.G.; Lindquist, J.H.; Grambow, S.C.; Crook, E.D.; Maher, J.F. Potential role of increased iron stores in diabetes. Am. J. Med. Sci. 2003, 325, 332–339. [Google Scholar] [CrossRef]
- Pitchika, A.; Schipf, S.; Nauck, M.; Dörr, M.; Lerch, M.M.; Felix, S.B.; Markus, M.R.P.; Völzke, H.; Ittermann, T. Associations of iron markers with type 2 diabetes mellitus and metabolic syndrome: Results from the prospective SHIP study. Diabetes Res. Clin. Pract. 2020, 163, 108149. [Google Scholar] [CrossRef] [PubMed]
- Yeap, B.B.; Divitini, M.L.; Gunton, J.E.; Olynyk, J.K.; Beilby, J.P.; McQuillan, B.; Hung, J.; Knuiman, M.W. Higher ferritin levels, but not serum iron or transferrin saturation, are associated with Type 2 diabetes mellitus in adult men and women free of genetic haemochromatosis. Clin. Endocrinol. 2015, 82, 525–532. [Google Scholar] [CrossRef]
- Jehn, M.L.; Guallar, E.; Clark, J.M.; Couper, D.; Duncan, B.B.; Ballantyne, C.M.; Hoogeveen, R.C.; Harris, Z.L.; Pankow, J.S. A prospective study of plasma ferritin level and incident diabetes: The Atherosclerosis Risk in Communities (ARIC) Study. Am. J. Epidemiol. 2007, 165, 1047–1054. [Google Scholar] [CrossRef] [PubMed]
- Kim, C.H.; Kim, H.K.; Bae, S.J.; Park, J.Y.; Lee, K.U. Association of elevated serum ferritin concentration with insulin resistance and impaired glucose metabolism in Korean men and women. Metabolism 2011, 60, 414–420. [Google Scholar] [CrossRef]
- Montonen, J.; Boeing, H.; Steffen, A.; Lehmann, R.; Fritsche, A.; Joost, H.G.; Schulze, M.B.; Pischon, T. Body iron stores and risk of type 2 diabetes: Results from the European Prospective Investigation into Cancer and Nutrition (EPIC)-Potsdam study. Diabetologia 2012, 55, 2613–2621. [Google Scholar] [CrossRef]
- Podmore, C.; Meidtner, K.; Schulze, M.B.; Scott, R.A.; Ramond, A.; Butterworth, A.S.; Di Angelantonio, E.; Danesh, J.; Arriola, L.; Barricarte, A.; et al. Association of Multiple Biomarkers of Iron Metabolism and Type 2 Diabetes: The EPIC-InterAct Study. Diabetes Care 2016, 39, 572–581. [Google Scholar] [CrossRef]
- Jung, C.H.; Lee, M.J.; Hwang, J.Y.; Jang, J.E.; Leem, J.; Park, J.Y.; Lee, J.; Kim, H.K.; Lee, W.J. Elevated serum ferritin level is associated with the incident type 2 diabetes in healthy Korean men: A 4 year longitudinal study. PLoS ONE 2013, 8, e75250. [Google Scholar]
- Sun, L.; Zong, G.; Pan, A.; Ye, X.; Li, H.; Yu, Z.; Zhao, Y.; Zou, S.; Yu, D.; Jin, Q.; et al. Elevated plasma ferritin is associated with increased incidence of type 2 diabetes in middle-aged and elderly Chinese adults. J. Nutr. 2013, 143, 1459–1465. [Google Scholar] [CrossRef]
- Ponka, P.; Beaumont, C.; Richardson, D.R. Function and regulation of transferrin and ferritin. Semin. Hematol. 1998, 35, 35–54. [Google Scholar] [PubMed]
- Fumeron, F.; Péan, F.; Driss, F.; Balkau, B.; Tichet, J.; Marre, M.; Grandchamp, B. Ferritin and transferrin are both predictive of the onset of hyperglycemia in men and women over 3 years: The data from an epidemiological study on the Insulin Resistance Syndrome (DESIR) study. Diabetes Care 2006, 29, 2090–2094. [Google Scholar] [CrossRef] [PubMed]
- Rajpathak, S.N.; Wylie-Rosett, J.; Gunter, M.J.; Negassa, A.; Kabat, G.C.; Rohan, T.E.; Crandall, J. Biomarkers of body iron stores and risk of developing type 2 diabetes. Diabetes Obes. Metab. 2009, 11, 472–479. [Google Scholar] [CrossRef] [PubMed]
- Ellervik, C.; Mandrup-Poulsen, T.; Andersen, H.U.; Tybjærg-Hansen, A.; Frandsen, M.; Birgens, H.; Nordestgaard, B.G. Elevated Transferrin Saturation and Risk of Diabetes: Three population-based studies. Diabetes Care 2011, 34, 2256–2258. [Google Scholar] [CrossRef]
- Kim, J.D.; Lim, D.M.; Park, K.Y.; Park, S.E.; Rhee, E.J.; Park, C.Y.; Lee, W.Y.; Oh, K.W. Serum Transferrin Predicts New-Onset Type 2 Diabetes in Koreans: A 4-Year Retrospective Longitudinal Study. Endocrinol. Metab. 2020, 35, 610–617. [Google Scholar] [CrossRef]
- Park, R.J.; Moon, J.D. Low transferrin saturation is associated with impaired fasting glucose and insulin resistance in the South Korean adults: The 2010 Korean National Health and Nutrition Examination Survey. Diabet. Med. 2015, 32, 673–678. [Google Scholar] [CrossRef]
- He, J.; Fang, A.; Yu, S.; Shen, X.; Li, K. Dietary Nonheme, Heme, and Total Iron Intake and the Risk of Diabetes in Adults: Results from the China Health and Nutrition Survey. Diabetes Care 2020, 43, 776–784. [Google Scholar] [CrossRef]
- WHO Guidelines Approved by the Guidelines Review Committee. In Use of Glycated Haemoglobin (HbA1c) in the Diagnosis of Diabetes Mellitus: Abbreviated Report of a WHO Consultation; World Health Organization. Copyright ©; World Health Organization: Geneva, Switzerland, 2011.
- Boshuizen, M.; Binnekade, J.M.; Nota, B.; van de Groep, K.; Cremer, O.L.; Tuinman, P.R.; Horn, J.; Schultz, M.J.; van Bruggen, R.; Juffermans, N.P.; et al. Iron metabolism in critically ill patients developing anemia of inflammation: A case control study. Ann. Intensive Care 2018, 8, 56. [Google Scholar] [CrossRef]
- Cook, J.D.; Flowers, C.H.; Skikne, B.S. The quantitative assessment of body iron. Blood 2003, 101, 3359–3364. [Google Scholar] [CrossRef]
- Beutler, E.; Felitti, V.; Ho, N.J.; Gelbart, T. Relationship of body iron stores to levels of serum ferritin, serum iron, unsaturated iron binding capacity and transferrin saturation in patients with iron storage disease. Acta Haematol. 2002, 107, 145–149. [Google Scholar] [CrossRef] [PubMed]
- Akter, S.; Nanri, A.; Kuwahara, K.; Matsushita, Y.; Nakagawa, T.; Konishi, M.; Honda, T.; Yamamoto, S.; Hayashi, T.; Noda, M.; et al. Circulating ferritin concentrations and risk of type 2 diabetes in Japanese individuals. J. Diabetes Investig. 2017, 8, 462–470. [Google Scholar] [CrossRef] [PubMed]
- Wang, Y.L.; Koh, W.P.; Yuan, J.M.; Pan, A. Plasma ferritin, C-reactive protein, and risk of incident type 2 diabetes in Singapore Chinese men and women. Diabetes Res. Clin. Pract. 2017, 128, 109–118. [Google Scholar] [CrossRef] [PubMed]
- Orban, E.; Schwab, S.; Thorand, B.; Huth, C. Association of iron indices and type 2 diabetes: A meta-analysis of observational studies. Diabetes Metab. Res. Rev. 2014, 30, 372–394. [Google Scholar] [CrossRef]
- Gao, H.; Yang, J.; Pan, W.; Yang, M. Iron Overload and the Risk of Diabetes in the General Population: Results of the Chinese Health and Nutrition Survey Cohort Study. Diabetes Metab. J. 2022, 46, 307–318. [Google Scholar] [CrossRef]
- Esser, N.; Legrand-Poels, S.; Piette, J.; Scheen, A.J.; Paquot, N. Inflammation as a link between obesity, metabolic syndrome and type 2 diabetes. Diabetes Res. Clin. Pract. 2014, 105, 141–150. [Google Scholar] [CrossRef]
- Haffner, S.M. The metabolic syndrome: Inflammation, diabetes mellitus, and cardiovascular disease. Am. J. Cardiol. 2006, 97, 3a–11a. [Google Scholar] [CrossRef]
- Sharifi, F.; Nasab, N.M.; Zadeh, H.J. Elevated serum ferritin concentrations in prediabetic subjects. Diab. Vasc. Dis. Res. 2008, 5, 15–18. [Google Scholar] [CrossRef]
- Huth, C.; Beuerle, S.; Zierer, A.; Heier, M.; Herder, C.; Kaiser, T.; Koenig, W.; Kronenberg, F.; Oexle, K.; Rathmann, W.; et al. Biomarkers of iron metabolism are independently associated with impaired glucose metabolism and type 2 diabetes: The KORA F4 study. Eur. J. Endocrinol. 2015, 173, 643–653. [Google Scholar] [CrossRef]
- Forouhi, N.G.; Harding, A.H.; Allison, M.; Sandhu, M.S.; Welch, A.; Luben, R.; Bingham, S.; Khaw, K.T.; Wareham, N.J. Elevated serum ferritin levels predict new-onset type 2 diabetes: Results from the EPIC-Norfolk prospective study. Diabetologia 2007, 50, 949–956. [Google Scholar] [CrossRef]
- Cooksey, R.C.; Jouihan, H.A.; Ajioka, R.S.; Hazel, M.W.; Jones, D.L.; Kushner, J.P.; McClain, D.A. Oxidative stress, beta-cell apoptosis, and decreased insulin secretory capacity in mouse models of hemochromatosis. Endocrinology 2004, 145, 5305–5312. [Google Scholar] [CrossRef] [PubMed]
- Ferrannini, E. Insulin resistance, iron, and the liver. Lancet 2000, 355, 2181–2182. [Google Scholar] [CrossRef] [PubMed]
- Lee, H.J.; Choi, J.S.; Lee, H.J.; Kim, W.H.; Park, S.I.; Song, J. Effect of excess iron on oxidative stress and gluconeogenesis through hepcidin during mitochondrial dysfunction. J. Nutr. Biochem. 2015, 26, 1414–1423. [Google Scholar] [CrossRef]
- Huang, J.; Jones, D.; Luo, B.; Sanderson, M.; Soto, J.; Abel, E.D.; Cooksey, R.C.; McClain, D.A. Iron overload and diabetes risk: A shift from glucose to Fatty Acid oxidation and increased hepatic glucose production in a mouse model of hereditary hemochromatosis. Diabetes 2011, 60, 80–87. [Google Scholar] [CrossRef]
- Green, A.; Basile, R.; Rumberger, J.M. Transferrin and iron induce insulin resistance of glucose transport in adipocytes. Metabolism 2006, 55, 1042–1045. [Google Scholar] [CrossRef] [PubMed]
- Speeckaert, M.M.; Speeckaert, R.; Delanghe, J.R. Biological and clinical aspects of soluble transferrin receptor. Crit. Rev. Clin. Lab. Sci. 2010, 47, 213–228. [Google Scholar] [CrossRef] [PubMed]
- Chang, J.; Bird, R.; Clague, A.; Carter, A. Clinical utility of serum soluble transferrin receptor levels and comparison with bone marrow iron stores as an index for iron-deficient erythropoiesis in a heterogeneous group of patients. Pathology 2007, 39, 349–353. [Google Scholar] [CrossRef] [PubMed]
- Fernández-Cao, J.C.; Arija, V.; Aranda, N.; Basora, J.; Diez-Espino, J.; Estruch, R.; Fitó, M.; Corella, D.; Salas-Salvadó, J. Soluble transferrin receptor and risk of type 2 diabetes in the obese and nonobese. Eur. J. Clin. Invest. 2017, 47, 221–230. [Google Scholar] [CrossRef]
- Clairmont, K.B.; Czech, M.P. Insulin injection increases the levels of serum receptors for transferrin and insulin-like growth factor-II/mannose-6-phosphate in intact rats. Endocrinology 1990, 127, 1568–1573. [Google Scholar] [CrossRef]
- Vargas, L.; Kawada, M.E.; Bazaes, S.; Karplus, P.A.; Faerman, C.H. Insulin antagonism: A novel role for human serum transferrin. Horm. Metab. Res. 1998, 30, 113–117. [Google Scholar] [CrossRef]
- Rumberger, J.M.; Peters, T., Jr.; Burrington, C.; Green, A. Transferrin and iron contribute to the lipolytic effect of serum in isolated adipocytes. Diabetes 2004, 53, 2535–2541. [Google Scholar] [CrossRef] [PubMed]
- Arner, P. Insulin resistance in type 2 diabetes: Role of fatty acids. Diabetes Metab. Res. Rev. 2002, 18 (Suppl. S2), S5–S9. [Google Scholar] [CrossRef] [PubMed]
- Mainous, A.G., 3rd; King, D.E.; Pearson, W.S.; Garr, D.R. Is an elevated serum transferrin saturation associated with the development of diabetes? J. Fam. Pract. 2002, 51, 933–936. [Google Scholar] [PubMed]
- Freixenet, N.; Vilardell, C.; Llauradó, G.; Giménez-Palop, O.; Berlanga, E.; Gutiérrez, C.; Caixàs, A.; Vendrell, J.; González-Clemente, J.M. Men with hyperferritinemia and diabetes in the Mediterranean area do not have a higher iron overload than those without diabetes. Diabetes Res. Clin. Pract. 2011, 91, e33–e36. [Google Scholar] [CrossRef]
- Gabrielsen, J.S.; Gao, Y.; Simcox, J.A.; Huang, J.; Thorup, D.; Jones, D.; Cooksey, R.C.; Gabrielsen, D.; Adams, T.D.; Hunt, S.C.; et al. Adipocyte iron regulates adiponectin and insulin sensitivity. J. Clin. Investig. 2012, 122, 3529–3540. [Google Scholar] [CrossRef]
Disclaimer/Publisher’s Note: The statements, opinions and data contained in all publications are solely those of the individual author(s) and contributor(s) and not of MDPI and/or the editor(s). MDPI and/or the editor(s) disclaim responsibility for any injury to people or property resulting from any ideas, methods, instructions or products referred to in the content. |
© 2023 by the authors. Licensee MDPI, Basel, Switzerland. This article is an open access article distributed under the terms and conditions of the Creative Commons Attribution (CC BY) license (https://creativecommons.org/licenses/by/4.0/).