Article

Eating Behaviours of Polish and Portuguese Adults—Cross-Sectional Surveys

by
Julia Bober
1,*,
Klaudia Wiśniewska
2 and
Katarzyna Okręglicka
2
1
Student Scientific Association of Hygiene and Prevention, Department of Social Medicine and Public Health, Medical University of Warsaw, 02-007 Warsaw, Poland
2
Department of Social Medicine and Public Health, Medical University of Warsaw, 02-007 Warsaw, Poland
*
Author to whom correspondence should be addressed.
Nutrients 2023, 15(8), 1934; https://doi.org/10.3390/nu15081934
Submission received: 20 March 2023 / Revised: 13 April 2023 / Accepted: 14 April 2023 / Published: 17 April 2023

Abstract

:
Eating behaviours affect energy intake through the types and amounts of foods chosen and decisions about the beginning and ending of the eating process. This study aims to determine and compare the eating behaviours of Polish and Portuguese adults and, in addition, to establish the correlations between daily behaviours, food-approaches and food-avoidance behaviours, and BMI in both populations. The study was conducted between January 2023 and March 2023. Participants from Poland and Portugal responded to the AEBQ questionnaire and questions on eating habits and body-image self-perception. The research tool was a website-based survey questionnaire with single-choice questions. No significant differences related to BMI levels were found between the Polish and Portuguese adults in terms of their eating behaviours. Both groups were characterised by the increased intensity of their food-approach behaviours, which was directly correlated with increases in BMI. Greater snacking intensity and binge drinking were associated with higher BMI. The study revealed an increased prevalence of binge drinking in the Polish sample. The study also confirmed a higher frequency of food-approach behaviours in overweight and/or obese individuals and uncontrolled calorie intake in participants imposing dietary restrictions for weight loss. Nutrition education is needed to improve eating habits and food choices, as well as to prevent overweight and obesity in adults.

1. Introduction

Eating behaviours are essential daily choices, directly affecting the health and mood of individuals. The wide topic of eating behaviours consists of food choices and the motives behind them, feeding practices, dietary culture, and eating-related problems, such as eating disorders and feeding disorders [1].
Unfortunately, developed eating behaviours do not always follow the fundamentals of a healthy lifestyle. Very often, disordered eating behaviours result in health damage and may cause many diseases, including obesity, which is the biggest global public health problem [2]. For this reason, the topic of eating behaviours should be an important focus of research and intervention projects related to the etiology, prevention, and treatment of obesity and eating disorders, as well as the promotion of healthy eating patterns that might help to manage and prevent medical issues [1,3].
Over the years, increasingly concerning trends have been observed in eating behaviours. These are associated with emotional eating, stress overeating, or eating not in response to hunger, but due to a favorable environment (the unlimited sight, smell, and/or taste of palatable food). On the other hand, avoidant eating behaviours, which sometimes also result from a stress response or related to the desire for rapid weight loss, are also observed [4].
Many factors affect eating behaviours. Among the main factors are the eating behaviours of parents and other behaviours to which an individual may be exposed in their childhood. Certainly, in terms of later socioeconomic changes through life, these may be altered, but the fundamentals of the behaviours developed in childhood persist throughout life [5]. Further essential factors are personal, social, cultural, environmental, and economic [1].
The major impact of the COVID-19 pandemic on eating behaviours was observed [6,7]. The main nutrition-related behaviours that were increased were as follows: snacking with higher frequency, reaching for food/meals due to lack of activity and not hunger, and choosing foods that are sugary, highly processed, and rich in fats more often than fruits or vegetables. Furthermore, some studies have shown that the COVID-19 pandemic had a strong impact on the increased frequency and quantity of alcoholic beverage use [6]. For this reason, post-pandemic eating behaviours need special attention and education among all age groups.
With the spread of globalisation and the increased use of social media, especially among young adults, it may be argued that some environmental and cultural factors related to eating behaviours are blurred, which can cause changes in eating behaviours in various (initially dissimilar) groups. This trend can have a dual effect. On one hand, several food-related authors publish content promoting healthy lifestyles and proper nutritional choices. However, on the other hand, social media is loaded with the promotion of highly processed foods and fast foods [8,9]. Furthermore, the ubiquity of food in communication channels can result in an increased desire to procure it, as observed during the COVID-19 pandemic [10,11].

1.1. Body Mass Index as a Health-Related Indicator

The body mass index (BMI) is a widely applicable, fast, and affordable tool, essential for assessing information on excessive body weight. Essentially, although it is calculated for individuals, it does not take age, gender, or ethnicity into consideration, with the effect that the results obtained should be interpreted in general terms. As BMI does not measure excess body-fat mass but focuses on total body weight, certain individuals with high, lean body mass who are not overweight and/or obese may have increased BMI values [12,13].
The current World Health Organisation (WHO) classification of BMI highlights six stages:
  • Underweight, BMI score < 18.5 kg/m2;
  • Normal weight (optimal), 18.5–24.9 kg/m2;
  • Overweight (pre-obese), 25–29.9 kg/m2;
  • Obese type I ≥ 30–34.9 kg/m2;
  • Obese type II 35–39.9 kg/m2;
  • Obese type III ≥ 40 kg/m2 [13].
The use of age-standardised BMI for adults in Poland and Portugal shows an increase in mean BMI results over the years for both sexes in both countries. Higher BMI scores were observed in Poland, equally for both genders and for women and men separately. In the latest data, from 2016, the age-standardised estimates for adults in Poland amounted to 26.7, while in Portugal, the score was 25.6 [14]. It follows that in both countries, adults frequently present abnormal BMI levels, indicating excess body weight. Changes in eating behaviours have exerted a major impact on the increase in average BMI levels over the years.

1.2. Poland and Portugal, Nutritional- and Health-Status Characteristics

The dietary recommendations in Portugal and Poland are based on the latest scientific reports and, despite some differences, they are mostly in line with the WHO recommendations [15,16]. Both countries significantly highlight energy requirements, the intake of protein, carbohydrates, including fiber, and fats, as well as micro- and macro-nutrients. Furthermore, special attention is paid to the intake of dietary sodium, the excessive consumption of which directly affects the prevalence of cardiovascular diseases, which are among the major health-care issues in both countries [17,18]. Despite their completely different cultures, geographic locations, and food industries, Portugal and Poland seem to face comparable problems in terms of proper nutrition and public health.

1.3. Portugal

Although it is considered by some to be a Mediterranean diet, this is not entirely true of the diet of Portuguese adults. Since the late 1990s, a continuous decline in the use of the fundamentals of the Mediterranean diet has been observed among the Portuguese people which, to be clear, was never high [19,20]. Furthermore, a decrease in the energy supplied from products classified as Mediterranean was observed [19,20]. The latest dietary requirements for the Portuguese population are illustrated in the Portuguese Food Wheel Guide. However, the low levels of adherence to these guidelines are concerning. The consumption of food groups labeled as “meat, fish, and eggs,” as well as “dairy,” was higher than the recommended levels, while the consumption of “fruit” and “vegetables” was below the values recommended in the guidelines. Notably, the consumption of seafood and fish by most Portuguese adults matches the guidelines [16].
Inadequate nutrition is one of the causes of chronic non-transmissible diseases, including obesity, oncological diseases, cardiovascular diseases, and type 2 diabetes. In Portugal, in 2019, improper nutrition contributed to 11.4% of the total mortality and overweight and/or obesity, which affect more than half of the Portuguese population, contributing to about 9% of the mortality rate [16].
The major unhealthy food-related behaviours of the Portuguese population include the high consumption of red and processed meat, the low consumption of whole grains, and high sodium intake. Despite the wide availability of vegetables and fruits, their daily consumption is below the recommended levels. All these behaviours reduce lifespan and health quality. Furthermore, the diet of Portuguese people is characterised by an increased percentage, relative to the guidelines, of free sugars, and a high percentage of highly processed foods and snacks, both salty and sweet [17].
More research is still needed to determine the total impact of the COVID-19 pandemic on food consumption and nutritional status of the Portuguese population, but the short-term results show a negative impact on food and nutritional status. The main differences are in the higher snacking intensity and the total number of calories consumed per day [17]. No research investigating eating behaviours of the Portuguese adult population following the COVID-19 pandemic has yet been performed.
Despite the existence of focused nutrition programs for the Portuguese population, slight improvements in healthy eating and decreased overweight prevalence are observed only among children and adolescents [17,21,22]. The reason for this may be the fact that most of the programs are targeted at this age group [17]. This indicates the need to include adults in education programs regarding the prevention of nutrition-related, chronic, non-transmissible diseases.
The average daily calorie supply available for consumption per person is significantly high, between 3.480 (data from 2018) and 4.075 (data from 2016–2020, including first period of the pandemic) calories, which is twice the recommended value of daily energy intake for an adult of average, healthy weight [23,24,25].

1.4. Poland

Poland, considered a developing country, is currently facing major public health and health-care problems, partially associated with excessive body weight [18]. The latest dietary guidelines were intended to help promote healthy eating habits in the community. Unfortunately, despite online and free access, few people are aware of the existence of these guidelines, while an equally large group of people do not know how to use them.
A new report on the eating behaviours of Poles after the COVID-19 pandemic showed a lower adherence to the WHO and Polish guidelines; even before 2019, they were not particularly high. Furthermore, adherence to the Mediterranean diet, which is recommended and whose positive effects on health have been scientifically confirmed, was lower, showing only a slight correlation [18]. An increased intake of calories was observed, as well as the consumption of red meat, processed meat, table salt, fast food, and alcohol [18,26]. On the other hand, a slight increase in the consumption of vegetables and fruit was observed, although the level was still below that recommended by the WHO [15,18].
Due to daily eating behaviours, an increase in the intake of total fat, animal fat, protein, and carbohydrates was observed. The increased calorie and fat intake was especially alarming, since it was already excessive before the pandemic. Furthermore, fiber intake, which usually should be as high as possible (in healthy adults), was significantly lower than the recommended values. Fish consumption in Poland remains at a low level, and most people do not follow the recommendation to consume fish twice per week. This might be one of the causes of the low values of omega-3 fatty acids in the diet of Poles [15].
During recent years, the Polish population began to consume sweets more frequently, which significantly increased calorie intake. Regarding meal frequency, most Poles were observed to increase the number of meals during the pandemic to five or more. Snacking frequency also increased, including the consumption of sweets and salty snacks, but also of fruits. These behaviours also increased caloric intake and, ultimately, led to body-mass changes and increases in BMI levels. Notably, almost half of Poles increased their body weight during the pandemic [18].
Most Poles did not follow a specific dietary pattern, including the Mediterranean diet. A very small percentage declared that they followed a vegetarian or vegan diet. Furthermore, the Polish population were observed to have difficulties with healthy eating, usually due to a lack of interest or the high prices of food products [18]. An alarming problem that could become a concern in the future is the low interest of Poles in healthy eating, along with the impact of nutrition on health. Most of the knowledge cited by the population is derived from the internet, social media, and friends, and not, as it should be, from a specialist [8,18].
In Poland, the average daily calorie supply available for consumption in 2018 (before the COVID-19 pandemic) oscillated around 3.537 calories per day per person. More recent, post-pandemic data are not available, but the value of this figure can be expected to increase based on data from other countries and previous studies [24].

1.5. Similarities in Nutrition and Health Status in Portugal and Poland

Both countries have a similar share of adults who are obese (23.2% in Portugal, 25.6% in Poland). In both, more than 50% of adults are overweight or obese (57.5% in Portugal, 58.3% in Poland), which is an alarming trend that should stimulate action to reduce individuals’ body weights to normal values [27]. Regardless of the differences in terms of food markets and the availability of certain products, the Portuguese and Polish populations seem to make the same errors in terms of food choices and proper nutrition. This results in the widespread prevalence of chronic, non-transmissible diseases and an increase in mortality.
The high calorie intake in both countries, as well as the widespread prevalence of overweight and obesity, may be due not only to improper food choices and the failure to follow the guidelines for the main food groups, but also to an increased incidence of food-approach behaviours, as well as a lower incidence of food-avoidance behaviours.
The aim of this study was to analyse and compare the eating behaviours of Polish and Portuguese adults and, in addition, to establish correlations between daily habits, food-approach, food-avoidance behaviours, and BMI in both groups.

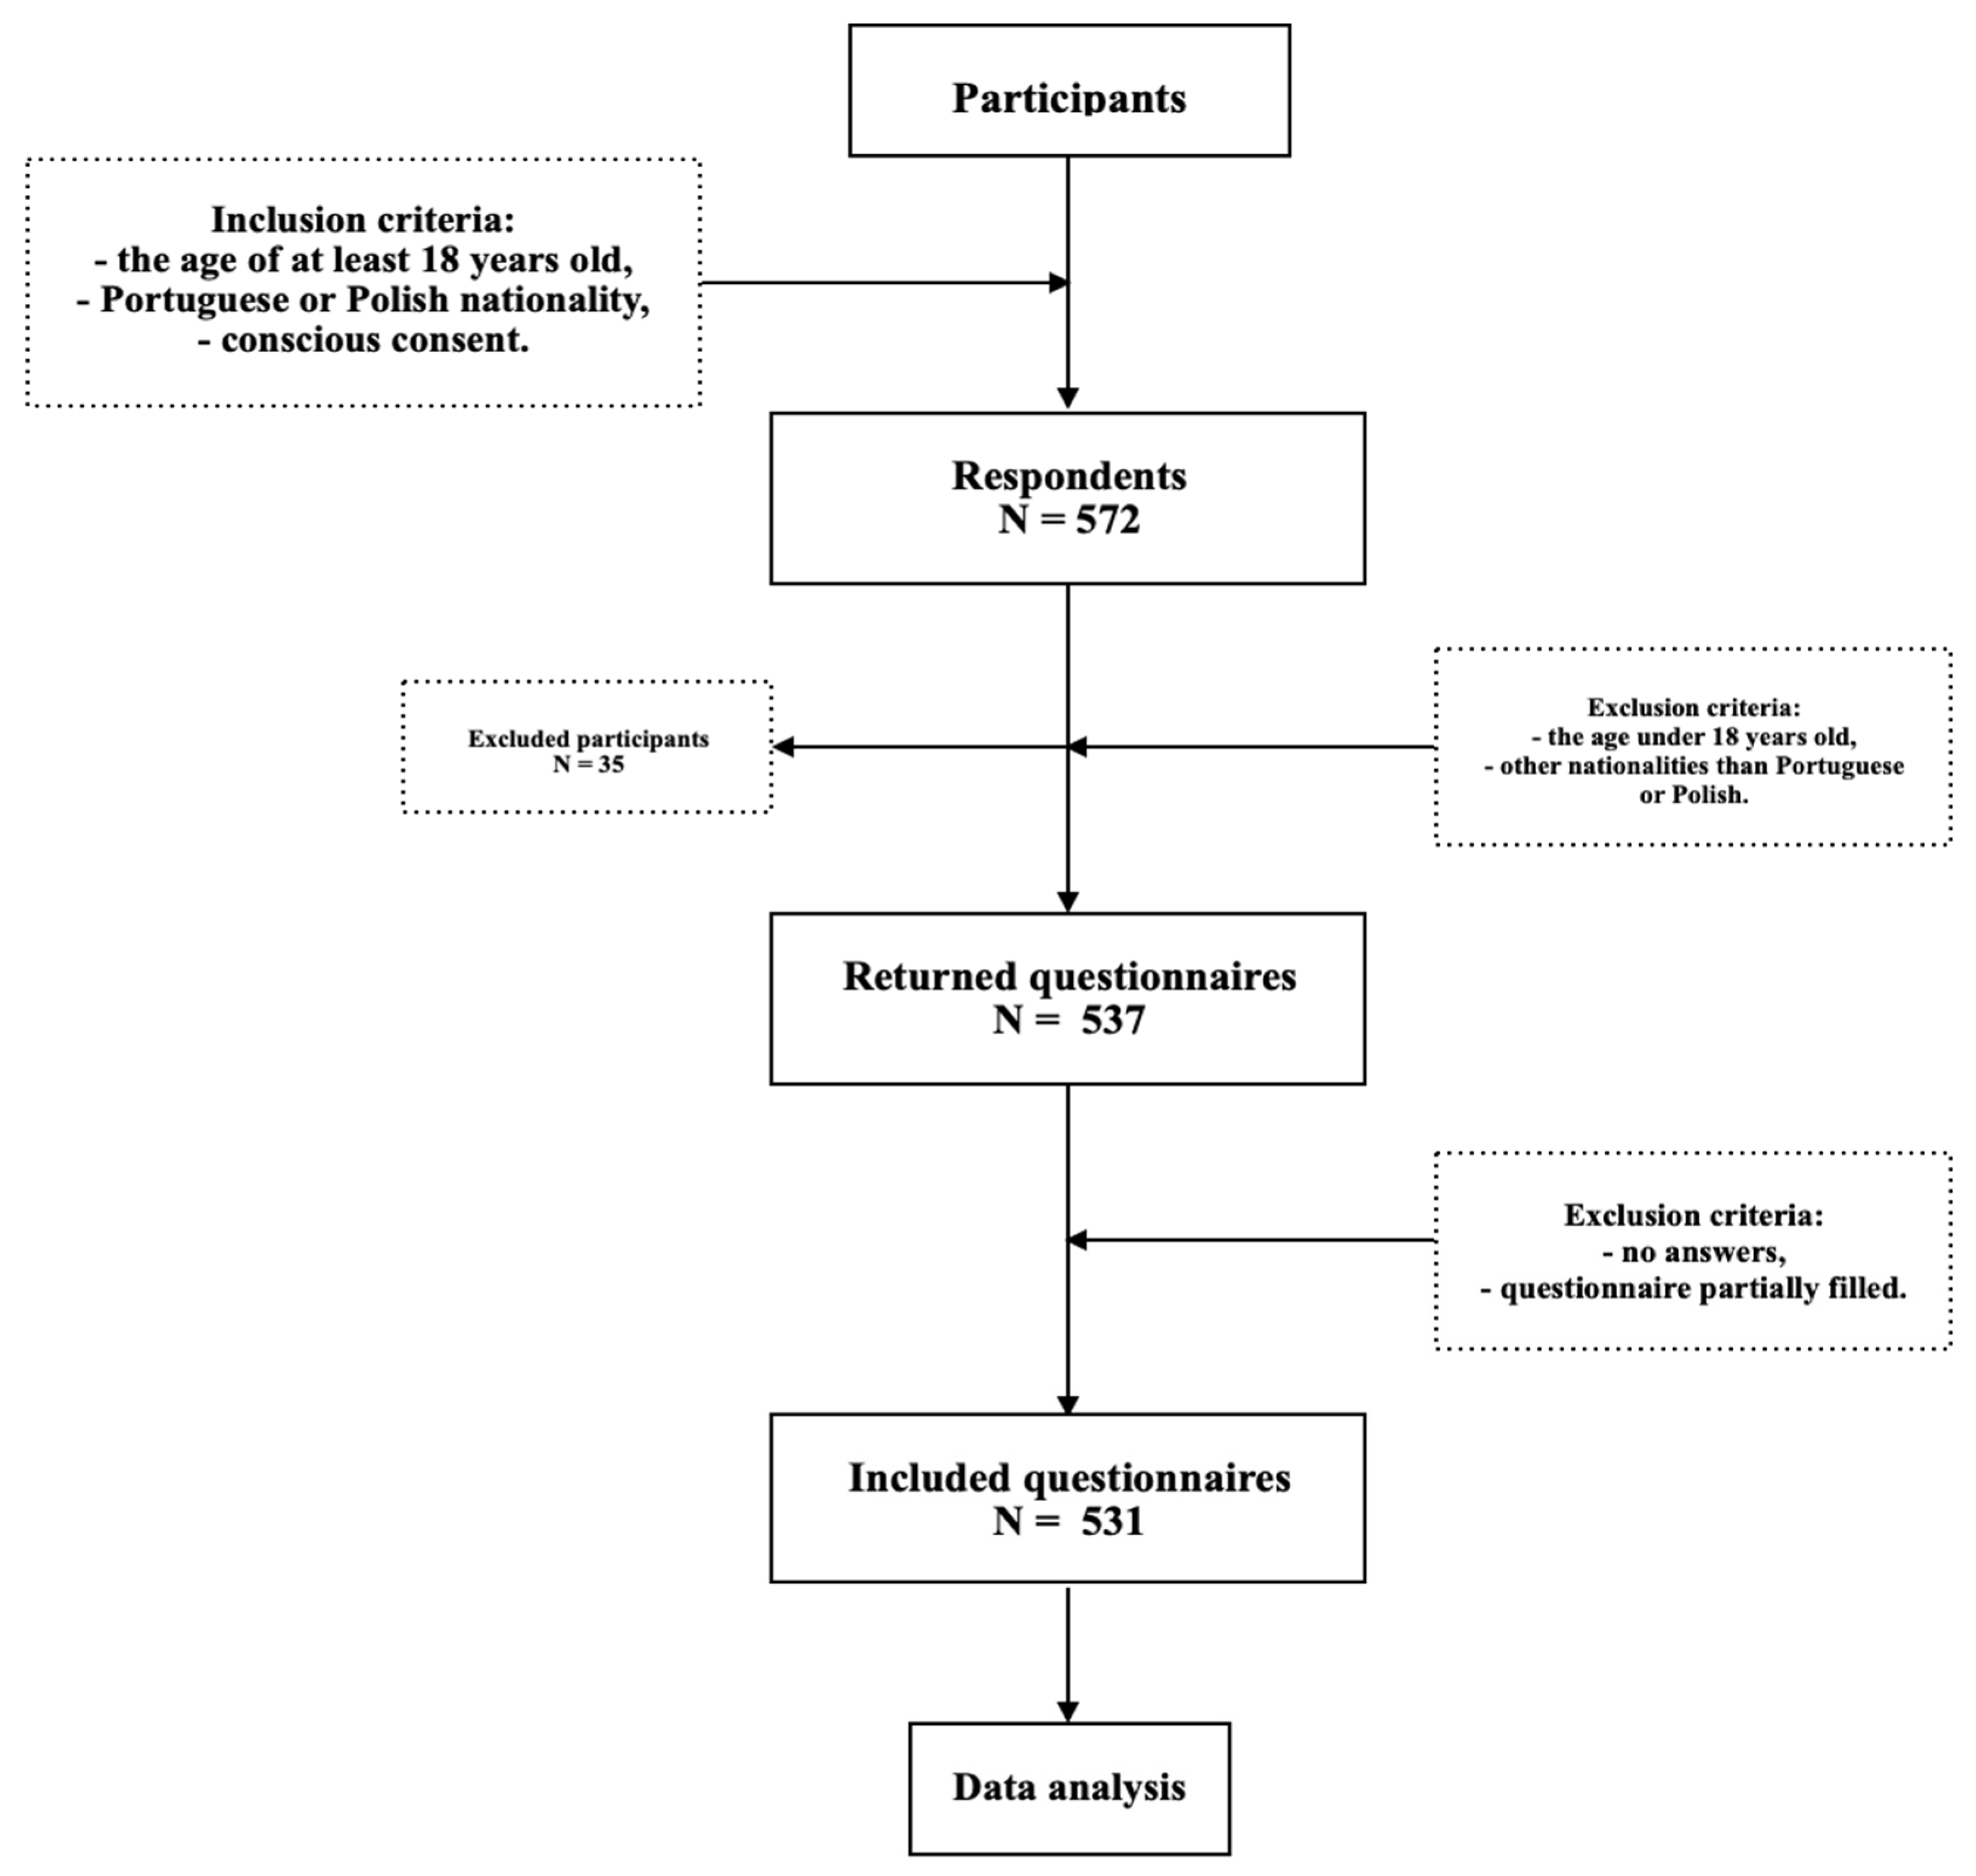
2. Materials and Methods

The participants (N = 531, Npl = 225, Npt = 306), recruited between January 2023 and March 2023 via online social network sites, completed an online version of the AEBQ (Adult Eating Behaviour Questionnaire). Validated AEBQ was performed for specific language versions, both Polish and Portuguese [3,28]. The survey was carried out in Poland and Portugal. In total, 172 women in Polish and 229 in Portuguese sample participated in the study. In terms of men, 53 from Poland and 72 from Portugal completed the survey. In addition to the AEBQ questionnaire, participants self-reported age, gender, anthropometric data, and ethnic background. Individuals also answered questions about perception of current body image and daily behaviours in relation to consumed meals. This part of the questionnaire was based on self-administered questions designed using the Food Frequency Questionnaire (FFQ), which was validated in a previous study on a Portuguese sample [29]. The self-reported questions were next validated with a group of 15 Poles and 15 Portuguese to ensure understanding of the questions. From the reported weight (kg) and height (m), BMI was calculated as weight (kg)/height2 (m2). Two language versions (Polish, Portuguese) of the survey were used to prevent misunderstanding of questions. Questions in both surveys were the same, in the same order.
The exclusion criteria were age under 18 years old and t nationality other than Polish or Portuguese. The inclusion criteria were conscious consent to participate in an anonymous survey, agreement to further use of the results in scientific work, completion of all questions in the survey, Portuguese or Polish nationality, and age over 18 years old. Initially, 572 respondents that fitted the inclusion criteria, and 537 were left after exclusion. In the final analysis, 531 individuals were included, as the rest failed to answer all the required questions in the survey (Figure 1).
The collected data were subjected to statistical analysis. Original, 8-factor AEBQ was conducted due to good reliability in all scales. In order to verify whether the numerical distributions obtained from the respondents’ answers differed from the hypothetical normal distribution, Kolmogorov–Smirnov tests, recommended for situations with relatively large sample sizes, were calculated [30].
The 35-item AEBQ features four food-approach subscales, hunger (5 items), food responsiveness (4 items), emotional overeating (5 items), and enjoyment of food (3 items), and four ‘food avoidance’ subscales, satiety responsiveness (3 items), emotional under-eating (5 items), food fussiness (5 items), and slowness in eating (4 items). Responses from each item were recorded on a 5-point Likert scale ranging from ‘Strongly Disagree’ to ‘Strongly Agree’. Average scores were calculated for each subscale. To determine the level of reliability, understood as the accuracy of the measurement of the questionnaire used, the Cronbach’s alpha statistic was calculated both for the entire study group and by nationality.
The correlation analysis, using quantitative data with significantly different distributions from the normal range, was carried out using Spearman’s nonparametric rho correlation test based on ranks [30,31]. Furthermore, for ordinal variables, Kendall’s nonparametric Tau-b correlation test was used, as it allows the analysis of scales with small ranges [30,31].
Comparisons between the two groups were performed using the Mann–Whitney U test. To assess the strengths of the effects, Glass’ bivariate correlation coefficient (rg = 0.40) was used and presented in the tables. The epsilon square factor (ε2) was used to evaluate the effect size and is presented in the tables. Post hoc tests were calculated using the Bonferroni–Dunn method. To test the influence of individual demographic variables on the dependent variables, an analysis of between-group differences was performed in a two-factor ANOVA with covariates.

3. Results

3.1. Study Group

The study included 531 individuals of Polish and Portuguese nationality, between the ages of 18 and 78, including both men and women. Their body weights were between 40 and 124 kg, and their heights were between 145 and 198 cm (Table 1).
The study’s findings also showed that compared to the Portuguese, the Poles were older, taller, and heavier. Detailed descriptive statistics for the described sample can be found in Table 2.

3.2. Health-Related Measurements

The impact of the demographic variables of gender, age, and nationality on the BMI levels showed a significant effect for gender (p = 0.001) and age (p = 0.026), confirming the presence of higher BMI levels among the men than among the women, as well as higher BMI levels among the older adults. Notably, no significant relationship was found between nationality and BMI. The exact outcomes can be found in Table 3.
The coefficients indicated that BMI increases with age (p = 0.0066) and intensity of binge drinking (p = 0.0074). The study found no significant changes in BMI or in variables such as the number of meals, number of skipped meals, or time (hour) of consuming meals. The results of this analysis are presented in Table 4.
Furthermore, it was found that the vegetarians, vegans, and flexitarians had significantly lower BMI levels than those who consumed all products (p = 0.016). Detailed results of the above analysis can be found in Table 5.

3.3. Daily Behaviours

The analyses showed that the Polish participants were more likely to eat a second breakfast or morning snack over the course of a week, while the Portuguese were more likely to eat lunch, dessert or an afternoon snack, and dinner. In addition, the Poles were more likely to eat a second breakfast or morning snack and lunch later in the day, while the Portuguese were more likely to eat dessert or a snack later in the night. Moreover, the Poles were more likely than the Portuguese to skip meals and over-consume alcohol. Detailed results of this analysis can be found in Table 6.

3.4. Eating Behaviours

The level of reliability for the eight-factor AEBQ questionnaire was good or very good in most of the dimensions of the AEBQ questionnaire, ranging from 0.66, for the hunger subscale, to 0.89, for emotional overeating. The level of reliability of the survey instrument used did not differ when the groups were divided by nationality compared to the entire sample. Detailed results of this analysis can be found in Table 7.
An analysis of the cross-group comparisons of the responses to the AEBQ questionnaire showed that compared to the Portuguese, the Poles had slightly higher scores for the enjoyment of food and emotional undereating. In contrast, the Portuguese had higher scores on the scales of emotional overeating and food fussiness. The remaining results, as well as the scores for the food-approach and food-avoidance scales, showed no significant differences. For this reason, the subsequent analysis considered the group as one, with no nationality distinction. Detailed results of this analysis are provided in Table 8.
Furthermore, as the highest-scoring dimension of the AEBQ questionnaire, food approach, increased, the weekly frequency of eating desserts or late-night snacks, binge drinking, and BMI levels increased, and the number of skipped meals decreased (p = 0.0082, p = 0.0069, p = 0.0073, and p = 0.0079, respectively). Moreover, as the second-highest-scoring dimension of the AEBQ questionnaire, food avoidance, increased, the BMI level decreased, as well as the weekly frequency of eating lunch and binge drinking (p = 0.0059, p = 0.0064, and p = 0.0078, respectively). The results are shown in Table 9.
Another analysis showed statistically significant differences between the groups according to BMI level. Differences were observed in the dimensions of emotional overeating, food avoidance, emotional undereating, and slowness in eating. It was found that the individuals who had an optimal BMI were characterised by significantly lower scores on the food-approach dimension than the overweight individuals. Moreover, those with optimal or low BMI levels had significantly lower scores on emotional overeating than those who were overweight. The overweight individuals had significantly lower scores for food avoidance, emotional undereating, and slowness in eating than the underweight individuals or those with optimal BMI levels. Detailed results of this analysis can be found in Table 10.
Furthermore, an analysis of differences between the AEBQ scores in relation to perceptions of body image and weight showed statistically significant differences for the following variables: food approach (p = 0.001), hunger (p = 0.048), food responsiveness (p = 0.039), emotional overeating (p = 0.001), food avoidance (p = 0.012), emotional undereating (p = 0.003), food fussiness (p = 0.006), and slowness in eating (p = 0.031). It was found that the individuals with neutral perceptions about their weight scored significantly lower than those who rated their own weight as negative on food approach and emotional overeating. In contrast, the individuals with positive perceptions of their body image and weight scored significantly lower on food approach, hunger, food responsiveness, and emotional overeating than those with negative perceptions about their body image and weight.
Moreover, the individuals who had positive perceptions about their body image and weight also tended to have lower food-avoidance and food-fussiness scores than those with negative perceptions. The individuals with negative perceptions about their body image and weight had lower scores on food-avoidance and emotional undereating than those with neutral perceptions, and lower scores on slowness in eating than the individuals with positive perceptions, as shown in Table 11.
A further analysis focused on the desire to change body image and/or weight showed statistically significant differences for the dimensions of food approach (p = 0.006), emotional overeating (p = 0.001), food avoidance (p = 0.001), emotional undereating (p = 0.001), and slowness in eating (p = 0.004).
It was found that the individuals who wanted to change the appearance of their body shape, but did not experience significant weight changes, obtained lower scores on the food approach and emotional overeating scales than those who wanted to reduce their weight, and lower scores on emotional undereating than those who wanted to increase their weight. In contrast, the individuals who wanted to increase their body weight had significantly lower levels of emotional overeating than those wanting to lose weight.
Furthermore, the respondents who wanted to reduce their body weight had significantly lower scores on food avoidance compared to those who wanted to change their body shape without changing their weight, or who wanted to increase their weight. In addition, it was noted that the group of participants who wanted to reduce their weight had lower scores on emotional undereating and slowness in eating than those who wanted to gain weight, as shown in Table 12.
The results of the analysis of the effect of the type of dietary pattern on the various dimensions of the AEBQ questionnaire did not reveal any statistically significant differences. Therefore, the data from this analysis were withdrawn from publication.

4. Discussion

To the best of our knowledge, this is the first study to compare eating behaviours in Poland and Portugal, two countries with completely different food and eating cultures. The present study showed that there are no noticeable differences between the BMI levels of the two nationalities. This supports previous results that overweight is increasing regardless of differences in food culture, in both developing and developed countries [32,33]. Although the study showed normal weights in most of the groups, the problem of overweight and/or obesity was nevertheless present in this sample. One in four individuals were overweight or obese and, considering that most of the sample consisted of young adults, and that BMI increases with age, the number of overweight and/or obese people, over a number of years, may be increasing [12,34,35]. The prevention of overweight and obesity should be a focus of the healthcare systems of both countries [25,36,37].
Differences in eating culture due to geographic location, as well as lifestyle habits, were associated with the more frequent consumption of meals in the first part of the day in Poland, while in Portugal, more meals were consumed in the afternoon and evening. These differences, however, showed no correlation with BMI. Although some sources link the consumption of higher numbers of calories in the second half of the day with excessive weight gain, no confirmation was found in this case [38,39,40,41]. This may have been related to the fact that in both Poland and Portugal, most individuals significantly exceed their caloric requirements each day [17,18,24]. A major concern is binge drinking, which is the frequent consumption of alcohol in large quantities. This occurrence was observed with greater intensity in Poland than in Portugal, which may explain the fact that despite their higher number of skipped meals, the Poles had similar BMI values. This might be linked to the high caloric content of alcohol consumed [42,43,44].
This study confirmed that the participants following plant-based diets and/or limiting their meat intake had lower BMI [45,46,47]. Moreover, the eating behaviours of these individuals, as measured by the AEBQ, did not differ from those of the omnivores, confirming that people on plant-based diets consume fewer calories due to the products they eat, rather than their eating behaviour.
Food-approach behaviours were found to be more frequent than food-avoidance behaviours for both groups. Therefore, no nationality differences were noticed. This was consistent with previous studies on other developed countries [48,49,50,51]. Food-approach behaviours are linked with the consumption of a higher number of meals/snacks during the day, including additional meals, such as late-night snacks. These results were confirmed in this study and in others [38,39]. A higher incidence of binge drinking has also been linked with behaviours that increase food intake. All these factors influenced the increased calorie intake in both countries. Moreover, the BMI levels were significantly higher in the individuals with higher incidences of food-approach behaviours than food-avoidance behaviours, which was also shown in previous studies [48,49,50,52,53,54,55,56].
Nutrition education is needed, especially for individuals with overweight/obesity, as they engage more frequently in behaviours such as the overconsumption of food under the influence of emotions [56,57]. The education provided should not only concern proper nutrition, but also how to manage emotions and stress [57,58]. According to previous research, the use of mindfulness techniques can be found helpful [59,60].
Due to the unrealistic body-shape ideals that are heavily promoted through social media, it is difficult, especially for young adults, to maintain a positive attitude toward body image [9,61,62]. Negative perceptions about body image are often associated with disordered eating behaviours, and may result in eating disorders, which are usually maintained by food-avoidance behaviours [63,64,65]. A higher intensity of these behaviours in individuals with negative perceptions was also observed in this study. Positive and/or neutral perceptions of body image/weight were not related to alarming or extreme eating behaviours, which can lead to the development of eating disorders.
Intriguing results were obtained regarding the desire for weight change and the various dimensions of the AEBQ questionnaire. These results may confirm previous studies’ findings that excessive dietary restrictions, associated with the desire to lose weight, intensify food-approach behaviours that result in snacking, as well as the desire to overeat [66,67,68]. This is another reason for the focus on nutrition-education programs, including proper eating behaviours, in both countries.

5. Conclusions

This study showed no significant differences in eating behaviours that can affect to BMI levels between Polish and Portuguese adults. However, both groups were characterised by the increased intensity of their food-approach behaviours, which were directly correlate with increases in BMI. Other daily behaviours related to the distribution over the day and/or the timing of meals consumed, by country, did not affect the differences between the participants’ BMI levels. Nevertheless, greater snacking intensity, including late-night snacks, as well as binge drinking, were associated with higher BMI.
In conclusion, although some research links the consumption of higher numbers of calories in the second half of the day with excessive weight gain, no confirmation was found in this study, which can be helpful for creating dietary plans for patients with obesity and metabolic disorders with different meal-time preferences.
Overall, we conclude that plant-based diets can result in beneficial body weight in the young population, even without dietary caloric restriction.
In addition, the study revealed an increased prevalence of binge drinking in the Polish sample. The study also confirmed a higher frequency of food-approach behaviours in overweight and/or obese individuals and uncontrolled calorie intake in participants imposing dietary restrictions for weight loss. Health education, focused on proper nutrition and lifestyles, is needed in both Poland and Portugal. This should be a focus for health-care systems in upcoming years to prevent the overweight-and-obesity pandemic not only in children, but also in adult populations. More research is needed to establish correlations between eating behaviours and different daily behaviours in various groups to obtain a wider perspective on this phenomenon.

Author Contributions

Conceptualisation, J.B. and K.W.; methodology, J.B.; software, J.B.; validation, J.B. and K.W.; formal analysis, J.B.; investigation, J.B.; resources, K.W.; data curation, J.B.; writing—original draft preparation, J.B.; writing—review and editing, K.W. and K.O.; visualisation, J.B. and K.W.; supervision, K.O. All authors have read and agreed to the published version of the manuscript.

Funding

This research received no external funding.

Institutional Review Board Statement

The study was conducted in accordance with the Declaration of Helsinki. Ethical review and approval by the Ethic Committee of Medical University of Warsaw were waived for this study due to the characteristics of this specific survey, which was not a medical experiment.

Informed Consent Statement

Informed consent was obtained from all subjects involved in the study.

Data Availability Statement

The data that support the findings of this study are available on request from the corresponding author, J.B.

Acknowledgments

Authors thank all the participants for their contributions. Special thanks to Universidade do Porto and Medical University of Warsaw for support in distributing the survey.

Conflicts of Interest

The authors declare no conflict of interest.

References

  1. La Caille, L. Eating Behavior. In Encyclopedia of Behavioral Medicine; Gellman Marc, D., Turner, J.R., Eds.; Springer: New York, NY, USA, 2013; pp. 641–642. ISBN 978-1-4419-1005-9. [Google Scholar]
  2. Ludwig, D.S.; Aronne, L.J.; Astrup, A.; De Cabo, R.; Cantley, L.C.; Friedman, M.I.; Heymsfield, S.B.; Johnson, J.D.; King, J.C.; Krauss, R.M.; et al. The Carbohydrate-Insulin Model: A Physiological Perspective on the Obesity Pandemic. Am. J. Clin. Nutr. 2021, 114, 1873–1885. [Google Scholar] [CrossRef] [PubMed]
  3. Warkentin, S.; Costa, A.; Oliveira, A. Validity of the Adult Eating Behavior Questionnaire and Its Relationship with Parent-Reported Eating Behaviors among Adolescents in Portugal. Nutrients 2022, 14, 1301. [Google Scholar] [CrossRef] [PubMed]
  4. Braden, A.; Musher-Eizenman, D.; Watford, T.; Emley, E. Eating When Depressed, Anxious, Bored, or Happy: Are Emotional Eating Types Associated with Unique Psychological and Physical Health Correlates? Appetite 2018, 125, 410–417. [Google Scholar] [CrossRef] [PubMed]
  5. Scaglioni, S.; De Cosmi, V.; Ciappolino, V.; Parazzini, F.; Brambilla, P.; Agostoni, C. Factors Influencing Children’s Eating Behaviours. Nutrients 2018, 10, 706. [Google Scholar] [CrossRef] [PubMed]
  6. González-Monroy, C.; Gómez-Gómez, I.; Olarte-Sánchez, C.M.; Motrico, E. Eating Behaviour Changes during the COVID-19 Pandemic: A Systematic Review of Longitudinal Studies. Int. J. Environ. Res. Public Health 2021, 18, 11130. [Google Scholar] [CrossRef]
  7. Ammar, A.; Brach, M.; Trabelsi, K.; Chtourou, H.; Boukhris, O.; Masmoudi, L.; Bouaziz, B.; Bentlage, E.; How, D.; Ahmed, M.; et al. Effects of COVID-19 Home Confinement on Eating Behaviour and Physical Activity: Results of the ECLB-COVID19 International Online Survey. Nutrients 2020, 12, 1583. [Google Scholar] [CrossRef]
  8. Simeone, M.; Scarpato, D. Sustainable Consumption: How Does Social Media Affect Food Choices? J. Clean. Prod. 2020, 277, 124036. [Google Scholar] [CrossRef]
  9. Rounsefell, K.; Gibson, S.; McLean, S.; Blair, M.; Molenaar, A.; Brennan, L.; Truby, H.; McCaffrey, T.A. Social Media, Body Image and Food Choices in Healthy Young Adults: A Mixed Methods Systematic Review. Nutr. Diet. 2020, 77, 19–40. [Google Scholar] [CrossRef]
  10. Fox, A.; Feng, W.; Asal, V. What Is Driving Global Obesity Trends? Globalization or “Modernization”? Glob. Health 2019, 15, 32. [Google Scholar] [CrossRef]
  11. De Andrade, P. Globalization of Consumption, Lifestyles and ‘Viral Society’. Rev. Estud. Intercult. REI 2021, 1–25. [Google Scholar] [CrossRef]
  12. Ng, C.D.; Elliott, M.R.; Riosmena, F.; Cunningham, S.A. Beyond Recent BMI: BMI Exposure Metrics and Their Relationship to Health. SSM-Popul. Health 2020, 11, 100547. [Google Scholar] [CrossRef]
  13. Simkova, S.; Dvorackova, O.; Velemínsky, M. Assessment of Healthy Lifestyles in Relation to BMI. Neuro Endocrinol. Lett. 2022, 43, 393–399. [Google Scholar]
  14. World Health Organization. Body Mass Index among Adults. Available online: https://www.who.int/data/gho/data/themes/topics/indicator-groups/indicator-group-details/GHO/bmi-among-adults (accessed on 11 February 2023).
  15. Jarosz, M.; Rychlik, E.; Stoś, K.; Charzewska, J. Normy Żywienia Dla Populacji Polski i Ich Zastosowanie; National Insitute of Public Health: Warsaw, Poland, 2020. [Google Scholar]
  16. Lopes, C.; Torres, D.; Oliveira, A.; Severo, M.; Guiomar, S.; Alarcão, V.; Ramos, E.; Rodrigues, S.; Vilela, S.; Oliveira, L.; et al. National Food, Nutrition, and Physical Activity Survey of the Portuguese General Population, IAN-AF 2015–2016. JMIR Res. Protoc. 2018, 7, e8990. [Google Scholar]
  17. Gregório, M.J.; Afonso Henriques, A.D.; da Graça Freitas, M.; Mestre, R.; Teixeira, D.; Salvador, C.; Graça, P. Programa Nacional Para a Promoção da Alimentação Saudável 2022–2030; Direção-Geral da Saúde: Lisboa, Portugal, 2023. [Google Scholar]
  18. Wojtyniak, B.; Goryński, P. (Eds.) Health Status of Polish Population and Its Determinants 2022; National Insitute of Public Health: Warsaw, Poland, 2022. [Google Scholar]
  19. Moraes, M.M.; Oliveira, B.; Afonso, C.; Santos, C.; Miranda, R.C.; Rauber, F.; Levy, R.B.; Rodrigues, S. Mediterranean Diet, Sociodemographic Factors and Ultra-Processed Food Consumption in Portugal. Eur. J. Public Health 2020, 30, ckaa165.434. [Google Scholar] [CrossRef]
  20. Real, H.; Dias, R.R.; Graça, P. Mediterranean Diet Conceptual Model and Future Trends of Its Use in Portugal. Health Promot. Int. 2021, 36, 548–560. [Google Scholar] [CrossRef]
  21. Marinho, A.R.; Severo, M.; Correia, D.; Lobato, L.; Vilela, S.; Oliveira, A.; Ramos, E.; Torres, D.; Lopes, C. Total, Added and Free Sugar Intakes, Dietary Sources and Determinants of Consumption in Portugal: The National Food, Nutrition and Physical Activity Survey (IAN-AF 2015–2016). Public Health Nutr. 2020, 23, 869–881. [Google Scholar] [CrossRef]
  22. Poínhos, R.; Oliveira, B.M.P.M.; Correia, F. Eating Behavior in Portuguese Higher Education Students: The Effect of Social Desirability. Nutrition 2015, 31, 310–314. [Google Scholar] [CrossRef]
  23. ISE. Balança Alimentar Portuguesa: 2020; Institute of Education and Sciences: Lisboa, Portugal, 2021. [Google Scholar]
  24. Our World in Data Daily Supply of Calories per Person, 2015 to 2018. Available online: https://ourworldindata.org/food-supply (accessed on 18 February 2023).
  25. Destri, K.; Alves, J.; Gregório, M.J.; Dias, S.S.; Henriques, A.R.; Mendonça, N.; Canhão, H.; Rodrigues, A.M. Obesity- Attributable Costs of Absenteeism among Working Adults in Portugal. BMC Public Health 2022, 22, 978. [Google Scholar] [CrossRef]
  26. Borusiak, B.; Szymkowiak, A.; Kucharska, B.; Gálová, J.; Mravcová, A. Predictors of Intention to Reduce Meat Consumption Due to Environmental Reasons—Results from Poland and Slovakia. Meat Sci. 2022, 184, 108674. [Google Scholar] [CrossRef]
  27. Hannah, R. Roser Max Obesity. Available online: https://ourworldindata.org/obesity (accessed on 18 February 2023).
  28. Guzek, D.; Skolmowska, D.; Głąbska, D. Appetitive Traits in a Population-Based Study of Polish Adolescents within the Place-19 Study: Validation of the Adult Eating Behavior Questionnaire. Nutrients 2020, 12, 3889. [Google Scholar] [CrossRef]
  29. Lopes, C.; Aro, A.; Azevedo, A.; Ramos, E.; Barros, H. Intake and Adipose Tissue Composition of Fatty Acids and Risk of Myocardial Infarction in a Male Portuguese Community Sample. J. Am. Diet. Assoc. 2007, 107, 276–286. [Google Scholar] [CrossRef] [PubMed]
  30. Bedyńska, S.; Książek, M. Statystyczny Drogowskaz: Praktyczny Przewodnik Wykorzystania Modeli Regresji Oraz Równań Strukturalnych; Wydawnictwo Akademickie Sedno: Warsaw, Poland, 2012. [Google Scholar]
  31. Field, A. Discovering Statistics Using SPSS, 3rd ed.; Sage Publications Ltd.: London, UK, 2009. [Google Scholar]
  32. Bhurosy, T.; Jeewon, R. Overweight and Obesity Epidemic in Developing Countries: A Problem with Diet, Physical Activity, or Socioeconomic Status? Sci. World J. 2014, 2014, 964236. [Google Scholar] [CrossRef] [PubMed]
  33. Misra, A.; Khurana, L. Obesity and the Metabolic Syndrome in Developing Countries. J. Clin. Endocrinol. Metab. 2008, 93, s9–s30. [Google Scholar] [CrossRef] [PubMed]
  34. Sardinha, L.B.; Santos, D.A.; Silva, A.M.; Coelho-e-Silva, M.J.; Raimundo, A.M.; Moreira, H.; Santos, R.; Vale, S.; Baptista, F.; Mota, J. Prevalence of Overweight, Obesity, and Abdominal Obesity in a Representative Sample of Portuguese Adults. PLoS ONE 2012, 7, e47883. [Google Scholar] [CrossRef]
  35. Okati-Aliabad, H.; Ansari-Moghaddam, A.; Kargar, S.; Jabbari, N. Prevalence of Obesity and Overweight among Adults in the Middle East Countries from 2000 to 2020: A Systematic Review and Meta-Analysis. J. Obes. 2022, 2022, 8074837. [Google Scholar] [CrossRef]
  36. Albury, C.; Strain, W.D.; Brocq, S.L.; Logue, J.; Lloyd, C.; Tahrani, A. The Importance of Language in Engagement between Health-Care Professionals and People Living with Obesity: A Joint Consensus Statement. Lancet Diabetes Endocrinol. 2020, 8, 447–455. [Google Scholar] [CrossRef]
  37. Dietz, W.H.; Baur, L.A.; Hall, K.; Puhl, R.M.; Taveras, E.M.; Uauy, R.; Kopelman, P. Management of Obesity: Improvement of Health-Care Training and Systems for Prevention and Care. Lancet 2015, 385, 2521–2533. [Google Scholar] [CrossRef]
  38. Kahleova, H.; Lloren, J.I.; Mashchak, A.; Hill, M.; Fraser, G.E. Meal Frequency and Timing Are Associatedwith Changes in Body Mass Index in Adventist Health Study 2. J. Nutr. 2017, 147, 1722–1728. [Google Scholar] [CrossRef]
  39. Barrington, W.E.; Beresford, S.A.A. Eating Occasions, Obesity and Related Behaviors in Working Adults: Does It Matter When You Snack? Nutrients 2019, 11, 2320. [Google Scholar] [CrossRef]
  40. Lopez-Minguez, J.; Gómez-Abellán, P.; Garaulet, M. Timing of Breakfast, Lunch, and Dinner. Effects on Obesity and Metabolic Risk. Nutrients 2019, 11, 2624. [Google Scholar] [CrossRef]
  41. Baron, K.G.; Reid, K.J.; Van Horn, L.; Zee, P.C. Contribution of Evening Macronutrient Intake to Total Caloric Intake and Body Mass Index. Appetite 2013, 60, 246–251. [Google Scholar] [CrossRef]
  42. Kuntsche, E.; Rehm, J.; Gmel, G. Characteristics of Binge Drinkers in Europe. Soc. Sci. Med. 2004, 59, 113–127. [Google Scholar] [CrossRef]
  43. Lannoy, S.; Duka, T.; Carbia, C.; Billieux, J.; Fontesse, S.; Dormal, V.; Gierski, F.; López-Caneda, E.; Sullivan, E.V.; Maurage, P. Emotional Processes in Binge Drinking: A Systematic Review and Perspective. Clin. Psychol. Rev. 2021, 84, 101971. [Google Scholar] [CrossRef]
  44. Shelton, N.J.; Knott, C.S. Association Between Alcohol Calorie Intake and Overweight and Obesity in English Adults. Am. J. Public Health 2014, 104, 629–631. [Google Scholar] [CrossRef]
  45. Tran, E.; Dale, H.F.; Jensen, C.; Lied, G.A. Effects of Plant-Based Diets on Weight Status: A Systematic Review. Diabetes Metab. Syndr. Obes. 2020, 13, 3433–3448. [Google Scholar] [CrossRef]
  46. Hemler, E.C.; Hu, F.B. Plant-Based Diets for Personal, Population, and Planetary Health. Adv. Nutr. 2019, 10, S275–S283. [Google Scholar] [CrossRef]
  47. Pfeiler, T.M.; Egloff, B. Personality and Eating Habits Revisited: Associations between the Big Five, Food Choices, and Body Mass Index in a Representative Australian Sample. Appetite 2020, 149, 104607. [Google Scholar] [CrossRef]
  48. Coakley, K.E.; Lardier, D.T.; Le, H.; Wilks, A. Food Approach and Avoidance Appetitive Traits in University Students: A Latent Profile Analysis. Appetite 2022, 168, 105667. [Google Scholar] [CrossRef]
  49. Hunot, C.; Fildes, A.; Croker, H.; Llewellyn, C.H.; Wardle, J.; Beeken, R.J. Appetitive Traits and Relationships with BMI in Adults: Development of the Adult Eating Behaviour Questionnaire. Appetite 2016, 105, 356–363. [Google Scholar] [CrossRef]
  50. Mallan, K.M.; Fildes, A.; de la Piedad Garcia, X.; Drzezdzon, J.; Sampson, M.; Llewellyn, C. Appetitive Traits Associated with Higher and Lower Body Mass Index: Evaluating the Validity of the Adult Eating Behaviour Questionnaire in an Australian Sample. Int. J. Behav. Nutr. Phys. Act. 2017, 14, 130. [Google Scholar] [CrossRef]
  51. Dorosh, N.; Boyko, O.; Kleszczewska, E.; Łogwiniuk, K.; Andryszczyk, M.; Wyższa Szkoła Zawodowa Suwałkach, P.; Marketingu Przedsiębiorczości, K.; Zarządzania, W.; Białostocka, P. Porównanie Nawyków Żywieniowych Studentów Na Ukrainie i w Polsce. Część I. Badania Ankietowe Comparison of Dietary Habits of Students in Ukraine and Poland. Part I. Survey Data; Uniwersytet Medyczny We Lwowie: Lviv, Ukraine, 2013; Volume 48. [Google Scholar]
  52. Hunot-Alexander, C.; Arellano-Gómez, L.P.; Smith, A.D.; Kaufer-Horwitz, M.; Vásquez-Garibay, E.M.; Romero-Velarde, E.; Fildes, A.; Croker, H.; Llewellyn, C.H.; Beeken, R.J. Examining the Validity and Consistency of the Adult Eating Behaviour Questionnaire-Español (AEBQ-Esp) and Its Relationship to BMI in a Mexican Population. Eat. Weight. Disord. 2022, 27, 651–663. [Google Scholar] [CrossRef] [PubMed]
  53. Viana, V.; Sinde, S.; Saxton, J.C. Children’s Eating Behaviour Questionnaire: Associations with BMI in Portuguese Children. Br. J. Nutr. 2008, 100, 445–450. [Google Scholar] [CrossRef] [PubMed]
  54. Poínhos, R.; Oliveira, B.M.P.M.; Correia, F. Eating Behaviour Patterns and BMI in Portuguese Higher Education Students. Appetite 2013, 71, 314–320. [Google Scholar] [CrossRef]
  55. Zickgraf, H.F.; Rigby, A. The Adult Eating Behaviour Questionnaire in a Bariatric Surgery-Seeking Sample: Factor Structure, Convergent Validity, and Associations with BMI. Eur. Eat. Disord. Rev. 2019, 27, 97–104. [Google Scholar] [CrossRef] [PubMed]
  56. Verzijl, C.L.; Ahlich, E.; Schlauch, R.C.; Rancourt, D. The Role of Craving in Emotional and Uncontrolled Eating. Appetite 2018, 123, 146–151. [Google Scholar] [CrossRef]
  57. van Strien, T. Causes of Emotional Eating and Matched Treatment of Obesity. Curr. Diab. Rep. 2018, 18, 35. [Google Scholar] [CrossRef]
  58. Kaźmierczak-Wojtaś, N.; Niedzielski, A.; Drozd, M. Orthorexic Tendencies and the Structure of Achievement Motivation in Young People in Poland. Nutrition 2022, 103–104, 111795. [Google Scholar] [CrossRef]
  59. Torres, S.J.; Nowson, C.A. Relationship between Stress, Eating Behavior, and Obesity. Nutrition 2007, 23, 887–894. [Google Scholar] [CrossRef]
  60. Yau, Y.H.C.; Potenza, M.N. Stress and Eating Behaviors. Minerva Endocrinol. 2013, 138, 255–267. [Google Scholar]
  61. Robinson, E.; Marty, L.; Higgs, S.; Jones, A. Interoception, Eating Behaviour and Body Weight. Physiol. Behav. 2021, 237, 113434. [Google Scholar] [CrossRef]
  62. Quick, V.M.; Byrd-Bredbenner, C. Disordered Eating, Socio-Cultural Media Influencers, Body Image, and Psychological Factors among a Racially/Ethnically Diverse Population of College Women. Eat. Behav. 2014, 15, 37–41. [Google Scholar] [CrossRef]
  63. Walsh, B.T. The Importance of Eating Behavior in Eating Disorders. Physiol. Behav. 2011, 104, 525–529. [Google Scholar] [CrossRef]
  64. Washburn, J.J.; Soto, D.; Osorio, C.A.; Slesinger, N.C. Eating Disorder Behaviors as a Form of Non-Suicidal Self-Injury. Psychiatry Res. 2023, 319, 115002. [Google Scholar] [CrossRef]
  65. Smink, F.R.E.; Van Hoeken, D.; Hoek, H.W. Epidemiology of Eating Disorders: Incidence, Prevalence and Mortality Rates. Curr. Psychiatry Rep. 2012, 14, 406–414. [Google Scholar] [CrossRef]
  66. Campos, M.B.; Menezes, I.H.C.F.; do Rosário Gondim Peixoto, M.; Schincaglia, R.M. Intuitive Eating in General Aspects of Eating Behaviors in Individuals with Obesity: Randomized Clinical Trial. Clin. Nutr. ESPEN 2022, 50, 24–32. [Google Scholar] [CrossRef]
  67. Lowe, M.R.; Doshi, S.D.; Katterman, S.N.; Feig, E.H. Dieting and Restrained Eating as Prospective Predictors of Weight Gain. Front. Psychol. 2013, 4, 577. [Google Scholar] [CrossRef]
  68. Benton, D.; Young, H.A. Reducing Calorie Intake May Not Help You Lose Body Weight. Perspect. Psychol. Sci. 2017, 12, 703–714. [Google Scholar] [CrossRef] [PubMed]
Figure 1. Flowchart: study design and data collection (N—number of participants).
Nutrients 15 01934 g001
Table 1. Descriptive statistics for demographic variables of the sample (N = 531).
RMSDMdnSkKurtD
total
age18–7825.848.91232.095.130.23 **
weight40–12464.7513.37621.111.870.10 **
height145–198168.398.991680.530.110.09 **
Portuguese
age18–6623.797.40222.517.450.24 **
weight40–11562.7411.84600.860.900.11 **
height145–192166.588.351650.46−0.160.11 **
BMI15.06–34.7222.523.3322.040.911.090.08 **
Polish
age18–7828.629.98241.743.540.21 **
weight43–12467.4914.80641.141.740.11 **
height151–198170.869.261700.540.110.07 **
BMI15.32–41.5222.993.9922.491.524.190.09 **
men
age18.00–78.0027.5610.6323.002.044.800.20 **
weight48.00–121.0077.2913.2077.000.551.040.10 **
height164.00–198.00179.047.13179.000.41−0.070.08
BMI15.32–36.9324.033.3723.910.621.580.07
women
age18.00–71.0025.328.2923.001.994.290.24 **
weight40.00–124.0060.8210.8259.001.525.010.10 **
height145.00–183.00165.076.67164.000.22−0.170.08 **
BMI15.06–41.5222.303.6221.711.614.530.10 **
** p < 0.01. R: range, M: mean, SD: standard deviation, Mdn: median, Sk: skewness of distribution, Kurt: Kurtosis, D: Kolmogorov–Smirnov-test result.
Table 2. Results of analysis using Mann–Whitney U test on demographic variables by nationality.
VariablesPortuguese (n = 306)Polish (n = 225)
MdnMrangMdnMrangUpRg
age22.00220.4924.00327.9020498.00<0.0010.40
weight60.00245.5264.00293.8628157.00<0.0010.18
height165.00235.95170.00306.8625230.50<0.0010.27
BMI22.04259.7822.49274.4632522.500.2760.06
Mdn: median, Mrang: mean rang, U: Mann–Whitney U test, p: p-value, Rg: strength measurement, Glass’ bivariate correlation coefficient.
Table 3. Impact of demographic variables on BMI levels.
Source of VariationFpη2
nationality0.630.4270.00
gender4.960.0260.01
age21.94<0.0010.04
nationality × gender0.050.8180.00
nationality × age1.250.2650.00
gender × age0.640.4230.00
nationality × gender × age0.030.8570.00
F: ANOVA test, p: p-value, η2: strength of the eta2 effect.
Table 4. Kendall’s tau-b correlation scores between variables and BMI levels (N = 531).
VariableBMI
age0.16 **
weekly frequency: breakfast−0.01
weekly frequency: second breakfast/morning snack−0.02
weekly frequency: lunch−0.04
weekly frequency: dessert/afternoon snack−0.05
weekly frequency: dinner−0.01
weekly frequency: dessert/night snack0.00
time (hour): breakfast0.03
time (hour): second breakfast/morning snack0.01
time (hour): lunch−0.01
time (hour): dessert/afternoon snack−0.03
time (hour): dinner0.00
time (hour): dessert/night snack−0.03
number of skipped meals0.02
binge drinking0.14 **
** p < 0.01.
Table 5. Results of intergroup comparison using Kruskal–Wallis H test, according to BMI level and dietary pattern.
GroupMdnMrangH (2)pPost-Hoc
Dietary pattern
I omnivore22.41280.0010.26 *0.016II < I *
II vegetarian/vegan21.10225.51 III < I *
III flexitarian21.84235.38
* p < 0.05. Mdn: median, Mrang: mean rang, H (2): H Kruskal–Wallis test, p: p-value.
Table 6. Results of analysis using Mann–Whitney U test for study indicators by nationality.
VariablesPortuguese
(n = 298)
Polish
(n = 222)
MdnMrangMdnMrangUpRg
weekly frequency: breakfast4255.384267.3731,552.500.2580.05
weekly frequency: second breakfast/morning snack2233.912305.0224,748.00<0.0010.27
weekly frequency: lunch4289.244226.6225,547.00<0.0010.24
Weekly frequency: dessert/afternoon snack3311.932200.1319,628.50<0.0010.42
weekly frequency: dinner4286.334237.2627,958.50<0.0010.19
weekly frequency: dessert/night snack1262.821264.4333,577.000.8980.01
time (hour): breakfast8233.858248.5826,183.500.2370.06
time (hour): second breakfast/morning snack11171.5911203.8414,217.500.0020.17
time (hour): lunch13195.4214335.4913,369.50<0.0010.56
time (hour): dessert/afternoon snack17230.6317224.7123,322.500.6320.03
time (hour): dinner20299.3920210.7122,064.50<0.0010.34
time (hour): dessert/night. snack23181.052189.383582.50<0.0010.64
number of skipped meals1251.611284.4830,020.500.0100.12
binge drinking0253.131278.9430,539.000.0380.10
Mdn: median, Mrang: mean rang, U: Mann–Whitney U test, p: p-value, Rg: strength measure, Glass’ bivariate correlation coefficient.
Table 7. Descriptive statistics for the dimensions of the AEBQ questionnaire, along with Cronbach’s alpha statistics in each group.
PortuguesePolishAll Sample
MSDαMSDαMSDα
food approach2.880.600.842.890.620.862.880.600.84
hunger2.580.710.652.660.760.692.620.730.66
food responsiveness2.660.760.692.680.790.722.670.770.70
emotional overeating2.851.080.892.631.050.882.751.070.89
enjoyment of food3.730.750.753.950.950.923.820.850.78
food avoidance2.520.590.822.550.540.822.530.570.82
satiety responsiveness2.470.740.662.470.750.682.470.740.67
emotional undereating2.561.030.892.821.010.862.671.030.88
food fussiness2.370.980.892.160.860.852.280.940.88
slowness in eating2.701.080.882.781.000.852.731.050.87
M: mean, SD: standard deviation, α: α-Cronbach reliability measure.
Table 8. Results of Mann–Whitney U test on AEBQ-questionnaire dimensions according to nationality.
VariablesPortuguese (n = 306)Polish (n = 225)
MdnMrangMdnMrangUprg
food approach2.88266.142.88265.8134,381.500.9800.00
hunger2.60261.322.60272.3632,994.000.4110.04
food responsiveness2.50264.772.75267.6834,047.500.8280.01
emotional overeating2.80280.652.40246.0829,942.000.0100.13
enjoyment of food3.67242.564.00296.8327,253.50<0.0010.20
food avoidance2.50261.292.56272.4132,983.000.4090.04
satiety responsiveness2.50266.972.50264.6834,129.000.8650.01
emotional undereating2.55249.382.80288.6029,339.000.0040.15
food fussiness2.20279.352.00247.8430,339.000.0190.12
slowness in eating2.50259.982.75274.1932,581.500.2900.05
Mdn: median, Mrang: mean rang, U: Mann–Whitney U test, p: p-value, Rg: strength measure, Glass’ bivariate correlation coefficient.
Table 9. Relationships between variables—Kendall’s tau-b correlation coefficients (N = 531).
VariablesFood ApproachFood Avoidance
age−0.02−0.04
weekly frequency: breakfast0.05−0.03
weekly frequency: second breakfast/morning snack0.02−0.03
weekly frequency: lunch0.02−0.10 **
weekly frequency: dessert/afternoon snack0.03−0.04
weekly frequency: dinner−0.00−0.06
weekly frequency: dessert/night snack0.13 **0.01
time (hour): breakfast0.020.03
time (hour): second breakfast/morning snack0.010.07
time (hour): lunch−0.010.03
time (hour): dessert/afternoon breakfast−0.010.06
time (hour): dinner−0.010.03
time (hour): dessert/night snack−0.050.01
number of skipped meals−0.12 **−0.00
binge drinking0.11 **−0.10 **
BMI0.09 **−0.19 **
** p < 0.01. Kendall’s tau-b correlation coefficient.
Table 10. Results of between-group comparison using Kruskal–Wallis H test, along with post hoc tests on AEBQ-questionnaire dimensions and BMI levels.
I: Underweight
(n = 32)
II: Normal Weight
(n = 303)
III: Overweight
(n = 173)
MdnMrangMdnMrangMdnMrangH (2)pε2Post-Hoc
Afood approach2.76228.002.82236.433.00291.0516.37<0.0010.03A.II < A.III **
Bhunger2.90301.812.60247.282.60258.404.210.1220.01n.i.
Cfood responsiveness2.50229.952.50246.092.75273.774.920.0850.01n.i.
Demotional overeating2.23209.972.40226.483.20311.8140.53<0.0010.08D.I < D.III **
D.II < D.III **
Eenjoyment of food3.67217.914.00262.773.67245.273.710.1570.01n.i.
Ffood avoidance2.81305.562.56265.112.44226.4811.770.0030.02F.III < F.I *
F.III < F.II *
Gsatiety responsiveness2.50262.562.50250.392.50260.200.600.7400.00n.i.
Hemotional undereating3.00307.912.80264.492.20227.1311.720.0030.02H.III < H.I *
H.III < H.II *
Ifood fussiness2.40269.632.00248.322.20262.521.400.4960.00n.i.
Jslowness in eating3.00296.442.75272.142.25215.8519.08<0.0010.04J.III < J.I *
J.III < J.II **
* p < 0.05, ** p < 0.01. Mdn: median, Mrang: mean range, H (2): H Kruskal–Wallis test, p: p-value, ε2: measurement of the strength of the effect by the epsilon2 coefficient.
Table 11. Results of intergroup comparison using Kruskal–Wallis H test, along with post hoc tests on AEBQ-questionnaire dimensions and types of perception of body image and weight.
VariablesI:
Negative (n = 172)
II:
Neutral (n = 183)
III:
Positive (n = 169)
MdnMrangMdnMrangMdnMrangH (2)pε2Post-Hoc
Afood approach3.06306.872.88250.782.71230.0323.65<0.0010.05A.II < A.I **
A.III < A.I **
Bhunger2.60280.032.60266.422.40240.426.070.0480.01B.III < B.I *
Cfood responsiveness2.75285.342.50257.352.50244.836.490.0390.01C.III < C.I *
Demotional overeating3.20323.302.40236.692.40228.5741.72<0.0010.08D.II < D.I **
D.III < D.I **
Eenjoyment of food3.67252.713.67258.024.00275.712.210.3320.00n.i.
Ffood avoidance2.44247.082.61289.202.50249.288.770.0120.02F.I < F.II *
F.III < F.II *
Gsatiety responsiveness2.50276.022.50267.802.25243.004.450.1080.01n.i.
Hemotional undereating2.40236.492.80290.492.60258.6611.500.0030.02H.I < H.II **
Ifood fussiness2.20273.772.20280.052.00232.0310.320.0060.02I.III < I.I *
I.III < I.II **
Jslowness in eating2.50238.402.67269.342.75279.626.930.0310.01J.I < J.III *
* p < 0.05, ** p < 0.01. Mdn: median, Mrang: mean range, H (2): H Kruskal–Wallis test, p: p-value, ε2: measurement of the strength of the effect by the epsilon2 coefficient.
Table 12. Findings of intergroup comparison using Kruskal–Wallis H test along with post hoc tests on AEBQ-questionnaire dimensions and desire to change body image and/or weight.
VariablesI: No
(n = 76)
II: Yes, Reduce Body Weight
(n = 198)
III: Yes, Change the Appearance of the Body Shape, without Significantly Changing the Body Weight
(n = 202)
IV: Yes, Gain Body Weight
(n = 43)
MdnMrangMdnMrangMdnMrangMdnMrangH (3)pε2Post-Hoc
Afood approach2.71236.273.00289.572.82243.392.81243.8412.590.0060.02A.III < A.II *
Bhunger2.60268.332.60250.002.60258.502.60298.363.980.2640.01n.i.
Cfood responsiveness2.50236.252.75273.302.50256.402.50257.663.630.3050.01n.i.
Demotional overeating2.40231.843.20309.542.60233.252.20207.3136.17<0.0010.07D.I < D.II **
D.III < D.II **
D.IV < D.II **
Eenjoyment of food4.00255.404.00263.024.00254.824.00272.620.710.8720.00n.i.
Ffood avoidance2.56273.322.43229.402.61273.972.72311.7115.710.0010.03F.II < F.III *
F.II < F.IV **
Gsatiety responsiveness2.50263.232.50254.492.50270.112.25232.152.740.4340.01n.i.
Hemotional undereating2.45255.092.40235.892.80269.313.20335.9717.110.0010.03H.I < H.IV *
H.II < H.IV **
H.III < H.IV *
Ifood fussiness2.20264.302.00255.342.00262.152.20263.760.320.9550.00n.i.
Jslowness in eating2.88277.132.50232.162.75270.463.00308.7713.410.0040.03J.II < J.IV *
* p < 0.05, ** p < 0.01. Mdn: median, Mrang: mean range, H (3): H Kruskal–Wallis test, p: p-value,ε2: measurement of the strength of the effect by the epsilon2 coefficient.
Disclaimer/Publisher’s Note: The statements, opinions and data contained in all publications are solely those of the individual author(s) and contributor(s) and not of MDPI and/or the editor(s). MDPI and/or the editor(s) disclaim responsibility for any injury to people or property resulting from any ideas, methods, instructions or products referred to in the content.

