
Pilot Study to Estimate Dietary Fiber Intake in Adults Residing in Chile
Abstract
1. Introduction
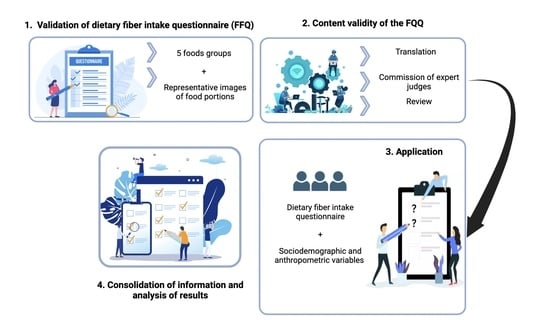
2. Materials and Methods
2.1. Food Frequency Questionnaire to Assess Dietary Fiber and Scoring Sheet
2.2. Content Validity of Food in the DF-FFQ
2.3. Determination of Dietary Fiber Intake Using the FFQ and Ethical Aspects
2.4. Statistical Analysis
3. Results
4. Discussion
5. Conclusions
Supplementary Materials
Author Contributions
Funding
Institutional Review Board Statement
Informed Consent Statement
Data Availability Statement
Acknowledgments
Conflicts of Interest
References
- Institute of Medicine (US). Panel on the Definition of Dietary Fiber and the Standing Committee on the Scientific Evaluation of Dietary Reference Intakes. In Dietary Reference Intakes Proposed Definition of Dietary Fiber, 1st ed.; Institute of Medicine: Washington, DC, USA, 2001; ISBN 0309075645. [Google Scholar]
- Millen, B.E.; Abrams, S.; Adams-campbell, L.; Anderson, C.A.M.; Brenna, J.T.; Campbell, W.W.; Clinton, S.; Hu, F.; Nelson, M.; Neuhouser, M.L.; et al. The 2015 Dietary Guidelines Advisory Committee Scientific Report: Development and Major Conclusions. Adv. Nutr. 2016, 7, 438–444. [Google Scholar] [CrossRef] [PubMed]
- Jones, J.M. Dietary Fiber Future Directions: Integrating New Definitions and Findings to Inform Nutrition Research and Communication. Adv. Nutr. 2013, 4, 8–15. [Google Scholar] [CrossRef]
- Vilcanqui-Pérez, F.; Vílchez-Perales, C. Dietary Fiber: New Definitions, Functional Properties and Health Benefits. Review. Arch. Latinoam. Nutr. 2017, 67, 146–156. [Google Scholar]
- Xue, Y.; Cui, L.; Qi, J.; Ojo, O.; Du, X.; Liu, Y.; Wang, X. The Effect of Dietary Fiber (Oat Bran) Supplement on Blood Pressure in Patients with Essential Hypertension: A Randomized Controlled Trial. Nutr. Metab. Cardiovasc. Dis. 2021, 31, 2458–2470. [Google Scholar] [CrossRef] [PubMed]
- Ionită-Mîndrican, C.-B.; Ziani, K.; Mititelu, M.; Oprea, E.; Neacs, S.M.; Morosan, E.; Dumitrescu, D.-E.; Rosca, A.C.; Drăgănescu, D.; Negrei, C. Therapeutic Benefits and Dietary Restrictions of Fiber Intake: A State of the Art Review. Nutrients 2022, 14, 2641. [Google Scholar] [CrossRef] [PubMed]
- Garcia, I.; Mendez, S.; Aguirre, N.; Sanchez, M.; Matias, D.; Perez, E. Increasing Consumption of Dietary Fiber Complementary to the Treatment of Metabolic Syndrome. Nutr. Hosp. 2018, 35, 582–587. [Google Scholar]
- Reynolds, A.N.; Akerman, A.P.; Mann, J. Dietary Fibre and Whole Grains in Diabetes Management: Systematic Review and Meta-Analyses. PLoS Med. 2020, 17, e1003053. [Google Scholar] [CrossRef]
- Hartley, L.; May, M.; Loveman, E.; Colquitt, J.; Rees, K. Dietary Fibre for the Prevention of Cardiovascular Disease. Ir. Med. J. 2016, 113, CD011472. [Google Scholar] [CrossRef]
- Bae, I.Y.; Jun, Y.; Lee, S.; Lee, H.G. Characterization of Apple Dietary Fibers Influencing the in Vitro Starch Digestibility of Wheat Flour Gel. Food Sci. Technol. 2016, 65, 158–163. [Google Scholar] [CrossRef]
- Frost, G.; Sleeth, M.L.; Sahuri-Arisoylu, M.; Lizarbe, B.; Cerdan, S.; Brody, L.; Anastasovska, J.; Ghourab, S.; Hankir, M.; Zhang, S.; et al. The Short-Chain Fatty Acid Acetate Reduces Appetite via a Central Homeostatic Mechanism. Nat. Commun. 2014, 5, 1–11. [Google Scholar] [CrossRef]
- Song, Y.; Liu, M.; Yang, F.G.; Cui, L.H.; Lu, X.Y.; Chen, C. Dietary Fibre and the Risk of Colorectal Cancer: A Case-Control Study. Asian Pac. J. Cancer Prev. 2015, 16, 3747–3752. [Google Scholar] [CrossRef] [PubMed]
- Fu, L.; Zhang, G.; Qian, S.; Zhang, Q.; Tan, M. Associations between Dietary Fiber Intake and Cardiovascular Risk Factors: An Umbrella Review of Meta-Analyses of Randomized Controlled Trials. Front. Nutr. 2022, 9, 972399. [Google Scholar] [CrossRef] [PubMed]
- Barber, T.M.; Kabisch, S.; Pfei, A.F.H.; Weickert, M.O. The Health Benefits of Dietary Fibre. Nutrients 2020, 12, 3209. [Google Scholar] [CrossRef] [PubMed]
- Lattimer, J.M.; Haub, M.D. Effects of Dietary Fiber and Its Components on Metabolic Health. Nutrients 2010, 2, 1266–1289. [Google Scholar] [CrossRef] [PubMed]
- Gill, S.K.; Rossi, M.; Bajka, B.; Whelan, K. Dietary Fibre in Gastrointestinal Health and Disease. Nat. Rev. Gastroenterol. Hepatol. 2021, 18, 101–116. [Google Scholar] [CrossRef] [PubMed]
- Ma, Y.; Olendzki, B.C.; Wang, J.; Persuitte, G.M.; Li, W.; Fang, H.; Merriam, P.A.; Wedick, N.M.; Ockene, I.S.; Culver, A.L.; et al. Single-Component versus Multicomponent Dietary Goals for the Metabolic Syndrome: A Randomized Trial. Ann. Intern. Med. 2015, 162, 248–257. [Google Scholar] [CrossRef]
- Abreu y Abreu, A.T.; Milke-García, M.P.; Argüello-Arévalo, G.A.; Calderón-de la Barca, A.M.; Carmona-Sánchez, R.I.; Consuelo-Sánchez, A.; Coss-Adame, E.; García-Cedillo, M.F.; Hernández-Rosiles, V.; Icaza-Chávez, M.E.; et al. Dietary Fiber and the Microbiota: A Narrative Review by a Group of Experts from the Asociación Mexicana de Gastroenterología. Rev. Gastroenterol. Mex. 2021, 86, 287–304. [Google Scholar] [CrossRef]
- Reicks, M.; Jonnalagadda, S.; Albertson, A.M.; Joshi, N. Total Dietary Fiber Intakes in the US Population Are Related to Whole Grain Consumption: Results from the National Health and Nutrition Examination Survey 2009 to 2010. Nutr. Res. 2014, 34, 226–234. [Google Scholar] [CrossRef]
- Reynolds, A.; Mann, J.; Cummings, J.; Winter, N.; Mete, E.; Te Morenga, L. Carbohydrate Quality and Human Health: A Series of Systematic Reviews and Meta-Analyses. Lancet 2019, 393, 434–445. [Google Scholar] [CrossRef]
- Department of Nutrition, School of Nutrition, School of Public Health and Microdata Center U of C. National Survey of Food Consumption—Final Report. 2014. Available online: http://www.minsal.cl (accessed on 5 August 2022).
- Healey, G.; Brough, L.; Murphy, R.; Hedderley, D.; Butts, C.; Coad, J. Validity and Reproducibility of a Habitual Dietary Fibre Intake Short Food Frequency Questionnaire. Nutrients 2016, 8, 558. [Google Scholar] [CrossRef]
- Beasley, J.M.; Davis, A.; Riley, W.T. Evaluation of a Web-Based, Pictorial Diet History Questionnaire. Public Health Nutr. 2009, 12, 651–659. [Google Scholar] [CrossRef] [PubMed]
- Cerda, R.; Barrero, C.; Arena, M.; Bascuñán, K.; Jiménez, C. Photographic Atlas of Typical Chilean Foods and Preparations. University of Chile: Santiago, Chile, 2010; Available online: http://www.repositoriodigital.minsal.cl (accessed on 5 August 2022).
- Gattás, V. Guide to the Nutritional Composition of Natural Foods, Industry and Typical Chilean Preparations, 2nd ed.; International Trademark Association, Ed.; University of Chile: Santiago, Chile, , 2011. [Google Scholar]
- Beaton, D.; Bombardier, C.; Guillemin, F.; Bosi, M. Guidelines for the Process of Cross-Cultural Adaptation of Self-Report Measures. Acta Odontol. Scand. 2000, 24, 3186–3191. [Google Scholar] [CrossRef] [PubMed]
- Shanteau, J.; Weiss, D.J.; Thomas, R.P.; Pounds, J.C. Performance-Based Assessment of Expertise: How to Decide If Someone Is an Expert or Not. Eur. J. Oper. Res. 2002, 136, 253–263. [Google Scholar] [CrossRef]
- Goni, L.; Gil, M.; de la O, V.; Martínez-González, M.Á.; Eisenberg, D.M.; Pueyo-Garrigues, M.; Vasilj, M.; Gayoso, L.; Etxeberria, U.; Ruiz-Canela, M. Development and Validation of a New Home Cooking Frequency Questionnaire: A Pilot Study. Nutrients 2022, 14, 1136. [Google Scholar] [CrossRef] [PubMed]
- Yusoff, M.S.B. ABC of Content Validation and Content Validity Index Calculation. Educ. Med. J. 2019, 11, 49–54. [Google Scholar] [CrossRef]
- Hernández Nieto, R. Contributions to Statistical Analysis. Rev. Venez. Cienc. Política 2002, 23, 132–134. [Google Scholar]
- World Medical Association. World Medical Association Declaration of Helsinki: Ethical Principles for Medical Research Involving Human Subjects. JAMA 2013, 310, 2191–2194. [Google Scholar] [CrossRef] [PubMed]
- Council for International Organizations of Medical Sciences. International Ethical Guidelines for Health-related Research Involving Humans, 4th ed.; Council for International Organizations of Medical Sciences (CIOMS): Geneva, Switzerland, 2016. [Google Scholar]
- Terwee, C.B.; Bot, S.D.M.; de Boer, M.R.; van der Windt, D.A.W.M.; Knol, D.L.; Dekker, J.; Bouter, L.M.; de Vet, H.C.W. Quality Criteria Were Proposed for Measurement Properties of Health Status Questionnaires. J. Clin. Epidemiol. 2007, 60, 34–42. [Google Scholar] [CrossRef]
- Arzahan, I.S.N.; Ismail, Z.; Yasin, S.M. Content Validity Of A Self-Reported Instrument For Safety And Health (S&H) Culture Practice In Paramedic Training Institute Using A Heterogeneous Expert Panel. Turkish J. Comput. Math. Educ. 2021, 12, 2464–2472. [Google Scholar]
- Thabane, L.; Ma, J.; Chu, R.; Cheng, J.; Ismaila, A.; Rios, L.P.; Robson, R.; Thabane, M.; Giangregorio, L.; Goldsmith, C.H. A tutorial on pilot studies: The what, why and how. BMC Med. Res. Methodol. 2010, 10, 1. [Google Scholar] [CrossRef]
- Pearson, N.; Naylor, P.J.; Ashe, M.C.; Fernandez, M.; Yoong, S.L.; Wolfenden, L. Guidance for Conducting Feasibility and Pilot Studies for Implementation Trials. Pilot Feasibility Stud. 2020, 6, 1–12. [Google Scholar] [CrossRef] [PubMed]
- National Institute of Statistics of Chile (NIS). Annual Environment Report. 2021. Available online: https://www.ine.gob.cl/ (accessed on 3 October 2022).
- Soto-Equihua, E.R.; Ramírez-Silva, C.I.; Elton-Puente, J.E.; Chávez-Servín, J.L.; Gutiérrez-Lara, P.; Chávez-Alabat, E.F.; Caamaño, M.d.C.; de la Torre-Carbot, K. Design and Validation of a Food Frequency Questionnaire to Evaluate the Consumption of Trans Fatty Acids in the Adult Population (FFQ-TFA). Int. J. Environ. Res. Public Health 2022, 19, 13097. [Google Scholar] [CrossRef] [PubMed]
- Nirmala Prasadi, V.P.; Joye, I.J. Dietary Fibre from Whole Grains and Their Benefits on Metabolic Health. Nutrients 2020, 12, 3045. [Google Scholar]
- Tremblay, A.; Clinchamps, M.; Pereira, B.; Courteix, D.; Lesourd, B.; Chapier, R.; Obert, P.; Vinet, A.; Walther, G.; Chaplais, E.; et al. Dietary Fibres and the Management of Obesity and Metabolic Syndrome: The Resolve Study. Nutrients 2020, 12, 2911. [Google Scholar] [CrossRef]
- Sardinha, A.N.; Canella, D.S.; Martins, A.P.B.; Claro, R.M.; Levy, R.B. Dietary Sources of Fiber Intake in Brazil. Appetite 2014, 79, 134–138. [Google Scholar] [CrossRef]
- National Ministry of Health. National Nutrition and Health Survey. Results Document 2007. Available online: http//www.msal.gob.ar/ (accessed on 5 August 2022).
- Lopez-Salido, S.; Llanes-Canedo, C.; Housni, F.; Gonzalez-Flores, J. Analysis Of Dietary Fiber Awareness, Body Mass Index And Socioeconomic Status In The Mexican Population. Interciencia 2020, 45, 469–474. [Google Scholar]
- Centers for Disease Control and Prevention (CDC); National Center for Health Statistics (NCHS). National Health and Nutrition Examination Survey Data. Hyattsville, MD: U.S. Department of Health and Human Services, Centers for Disease Control and Prevention. Available online: http://www.cdc.gov/nchs/nhanes/ (accessed on 3 October 2022).
- Stephen, A.M.; Champ, M.M.J.; Cloran, S.J.; Fleith, M.; Van Lieshout, L.; Mejborn, H.; Burley, V.J. Dietary Fibre in Europe: Current State of Knowledge on Definitions, Sources, Recommendations, Intakes and Relationships to Health. Nutr. Res. Rev. 2017, 30, 149–190. [Google Scholar] [CrossRef]
- Departament of Health & Social Care. National Diet and Nutrition Survey Results from Years 1, 2, 3 and 4 (Combined) of the Rolling Programme (2008/2009–2011/2012); Results Document 2017. Available online: http//www.gov.uk/ (accessed on 3 October 2022).
- Fernstrand, A.M.; Bury, D.; Garssen, J.; Verster, J.C. Dietary Intake of Fibers: Differential Effects in Men and Women on Perceived General Health and Immune Functioning. Food Nutr. Res. 2017, 61, 1297053. [Google Scholar] [CrossRef]
- Dhingra, D.; Michael, M.; Rajput, H.; Patil, R.T. Dietary Fibre in Foods: A Review. J. Food Sci. Technol. 2012, 49, 255–266. [Google Scholar] [CrossRef]
- Du, H.; Van Der A, D.L.; Boshuizen, H.C.; Forouhi, N.G.; Wareham, N.J.; Halkjær, J.; Tjønneland, A.; Overvad, K.; Jakobsen, M.U.; Boeing, H.; et al. Dietary Fiber and Subsequent Changes in Body Weight and Waist Circumference in European Men and Women. Am. J. Clin. Nutr. 2010, 91, 329–336. [Google Scholar] [CrossRef]
- National Federation of Bakers. Report Bread Consumption in Chile. 2020. Available online: http://www.fechipan.cl (accessed on 5 August 2022).
- Office of Agrarian Studies and Policies. Consumer Perception of Fruit and Vegetable Products, Dairy, Meat and Bread. 2009. Available online: http://www.odepa.gob.cl (accessed on 3 October 2022).


| Variable | Item | Mean | SD | 95% CI | CVC | S-CVI/Ave |
|---|---|---|---|---|---|---|
| Adequacy | 1 | 4.9 | 0.15 | 4.73–5.06 | 0.98 | 1.00 |
| 2 | 5.0 | 0.00 | 5.00–5.00 | 1.00 | 1.00 | |
| 3 | 4.8 | 0.28 | 4.53–5.13 | 0.96 | 1.00 | |
| 4 | 4.9 | 0.20 | 4.70–5.13 | 0.98 | 1.00 | |
| 5 | 4.9 | 0.12 | 4.82–5.07 | 0.98 | 1.00 | |
| 6 - | 4.8 - | 0.40 - | 4.40–5.26 - | 0.96 0.98 | 1.00 1.00 | |
| Pertinence | 1 | 4.7 | 0.44 | 4.14–5.25 | 0.94 | 1.00 |
| 2 | 4.7 | 0.44 | 4.14–5.25 | 0.94 | 1.00 | |
| 3 | 4.5 | 0.86 | 3.42–5.57 | 0.90 | 0.80 | |
| 4 | 5.0 | 0.00 | 5.00–5.00 | 1.00 | 1.00 | |
| 5 | 4.9 | 0.22 | 4.62–5.17 | 0.98 | 1.00 | |
| 6 - | 4.7 - | 0.44 - | 4.14–5.25 - | 0.94 0.95 | 0.80 0.93 |
| Variables | Participants (n) | Percentage (%) | |
|---|---|---|---|
| Age | 15–29 years | 76 | 38.4 |
| ≥30 years | 122 | 61.6 | |
| Sex | Men | 46 | 22.2 |
| Women | 150 | 72.5 | |
| Prefer not to answer | 2 | 1.0 | |
| Region | Antofagasta Region | 1 | 0.5 |
| Valparaiso Region | 30 | 14.5 | |
| O’Higgins Region | 1 | 0.5 | |
| Maule Region | 36 | 17.4 | |
| Biobio Region | 101 | 48.8 | |
| Los Lagos Region | 1 | 0.5 | |
| Magallanes Region | 1 | 0.5 | |
| Metropolitan Region | 23 | 11.1 | |
| Ñuble Region | 3 | 1.4 | |
| Residence | Urban | 176 | 85.0 |
| Rural | 22 | 10.6 | |
| Occupation | Dependent worker | 95 | 45.9 |
| Freelance worker | 21 | 10.1 | |
| Student | 54 | 26.1 | |
| Unemployed | 7 | 3.4 | |
| Housekeeper | 15 | 7.2 | |
| Retired | 6 | 2.9 | |
| BMI | Underweight | 3 | 1.5 |
| Normal | 68 | 34.5 | |
| Overweight | 74 | 37.6 | |
| Obesity | 52 | 26.4 |
| Variable | Mean | SD | Minimum | Maximum |
|---|---|---|---|---|
| Age | ||||
| 15–29 years | 14.8 | 8.8 | 0.2 | 40.3 |
| ≥30 years | 10.8 | 5.0 | 0.6 | 26.3 |
| p value | 0.004 * | |||
| Sex | ||||
| Women | 11.7 | 6.47 | 0.20 | 32.4 |
| Men | 14.4 | 8.33 | 3.00 | 40.3 |
| p value | 0.045 * | |||
| Residence | ||||
| Urban | 12.2 | 7.12 | 0.20 | 40.3 |
| Rural | 13.5 | 6.09 | 3.90 | 28.6 |
| p value | 0.233 | |||
| Occupation | ||||
| Dependent worker | 11.4 | 5.35 | 0.60 | 26.3 |
| Freelance worker | 10.6 | 5.24 | 3.00 | 26.2 |
| Student | 15.6 | 9.65 | 0.20 | 40.3 |
| Unemployed | 12.2 | 6.48 | 3.50 | 21.9 |
| Housekeeper | 9.93 | 4.67 | 0.80 | 17.4 |
| Retired | 10.8 | 4.57 | 5.00 | 18.2 |
| p value | 0.181 | |||
| BMI category | ||||
| Underweight | 24.2 | 5.56 | 17.9 | 28.5 |
| Normal | 13.7 | 8.15 | 3.90 | 40.3 |
| Overweight | 11.4 | 6.53 | 0.60 | 37.4 |
| Obesity | 11.1 | 5.01 | 0.20 | 22.2 |
| p value | 0.037 * | |||
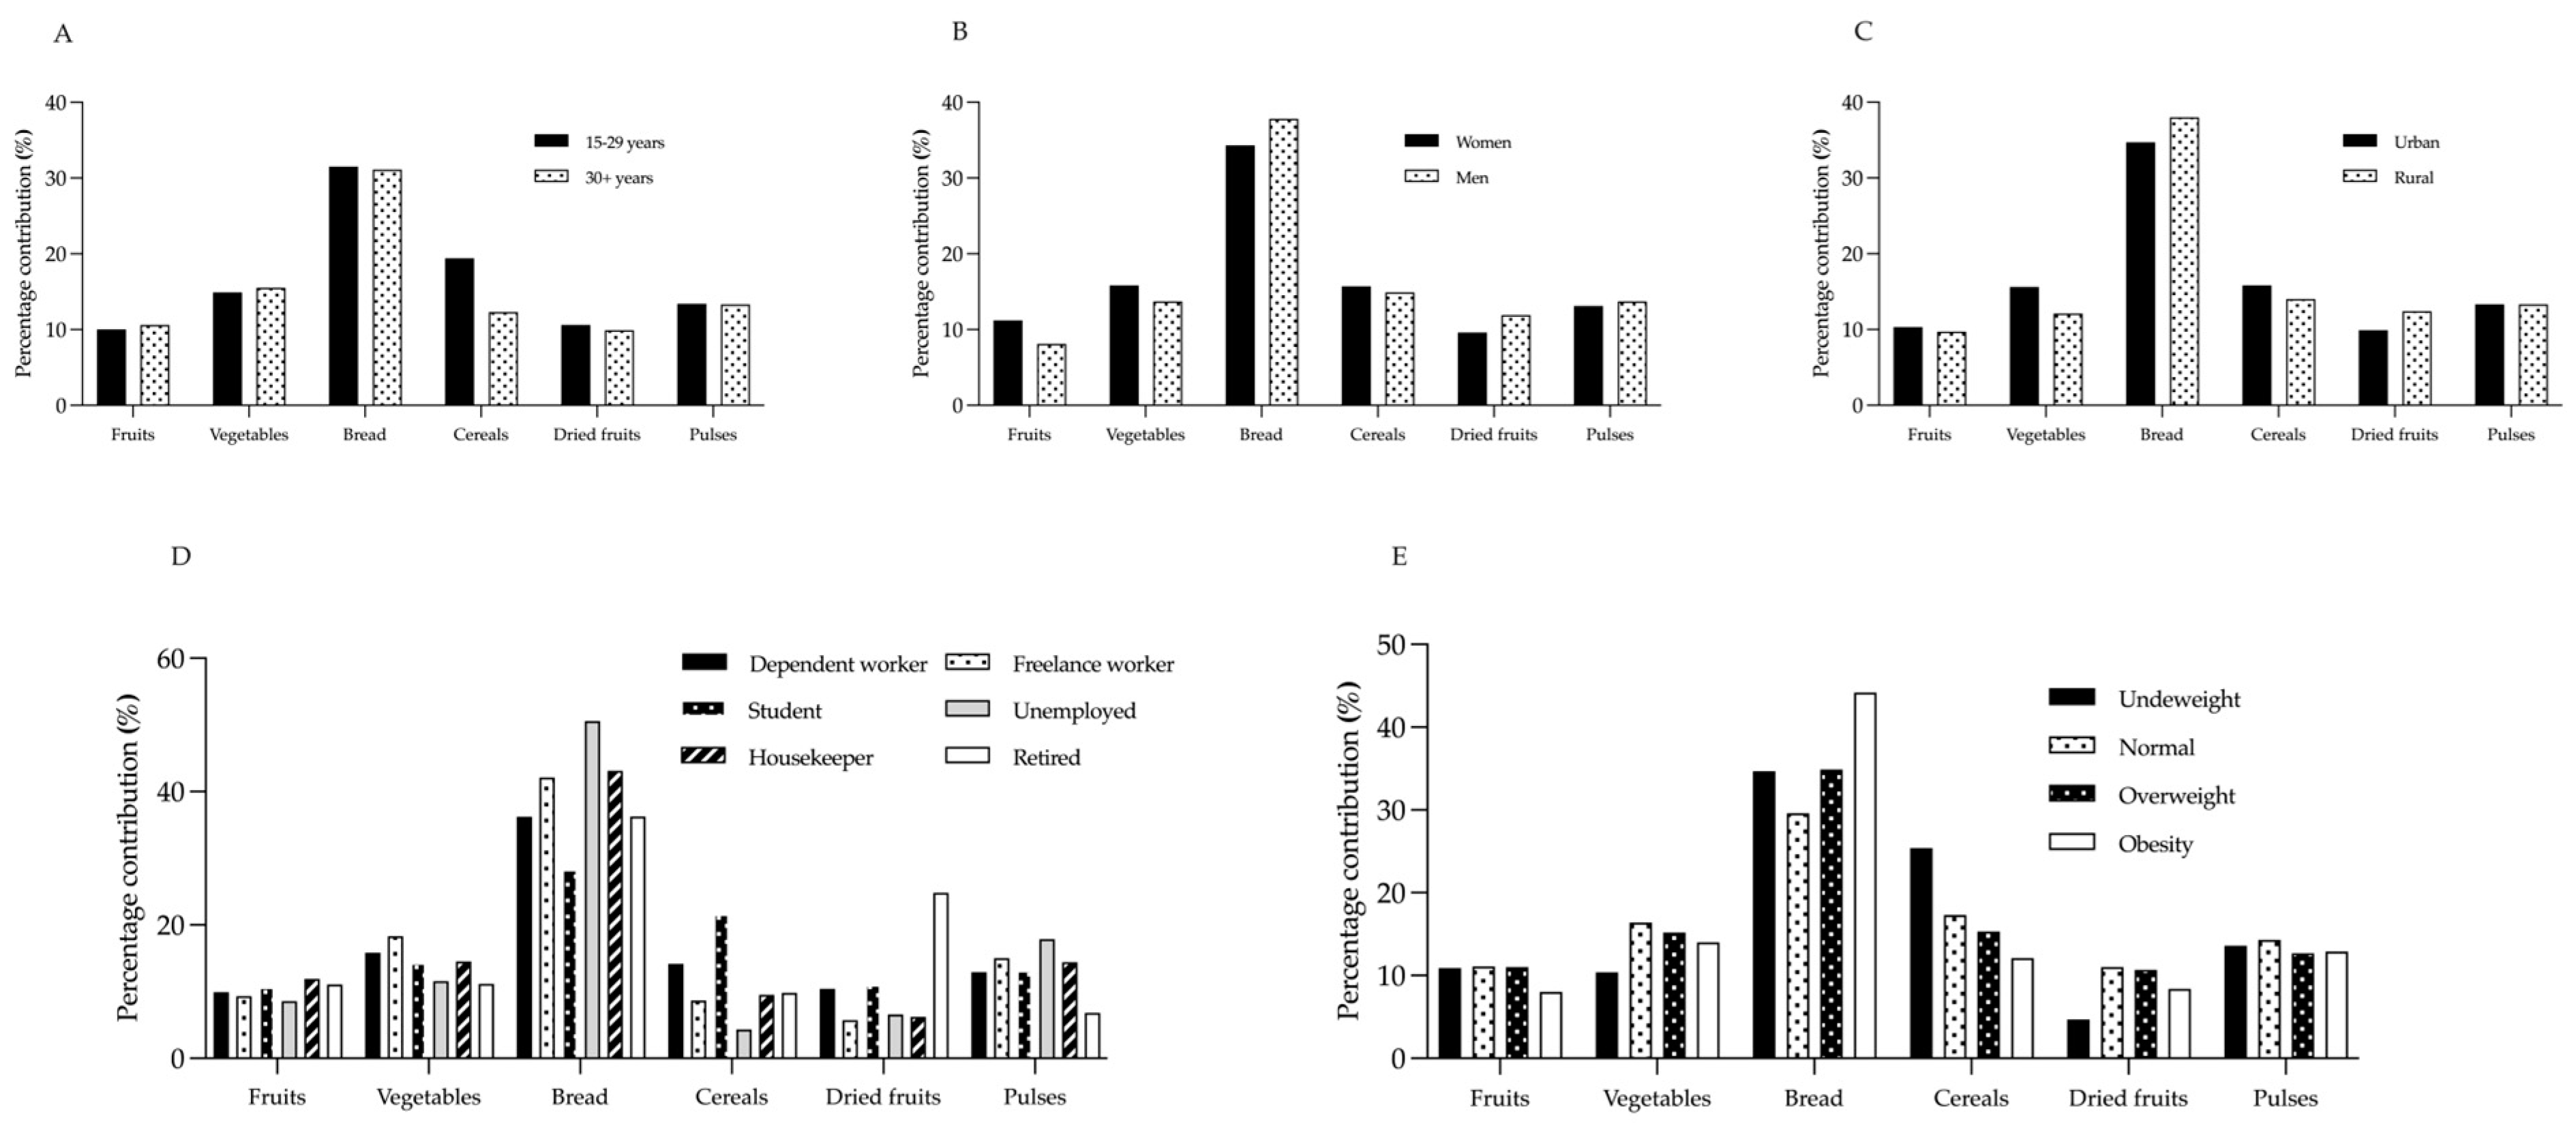
| Fruits | Vegetables | Bread | Cereals | Dried Fruits | Pulses | |||||||||||||
|---|---|---|---|---|---|---|---|---|---|---|---|---|---|---|---|---|---|---|
| Mean | SD | Range | Mean | SD | Range | Mean | SD | Range | Mean | SD | Range | Mean | SD | Range | Mean | SD | Range | |
| Age | ||||||||||||||||||
| 15–29 years | 1.48 | 1.43 | 0–5.2 | 2.21 | 1.83 | 0–8.4 | 4.66 | 2.87 | 0–11.2 | 2.87 | 3.28 | 0–17.0 | 1.57 | 2.86 | 0–18.0 | 1.98 | 2.66 | 0–18.9 |
| ≥30 years | 1.15 | 1.19 | 0–5.2 | 1.67 | 1.47 | 0–7.0 | 4.12 | 2.81 | 0–11.2 | 1.33 | 2.04 | 0–17.0 | 1.07 | 1.43 | 0–9.0 | 1.44 | 1.59 | 0–12.6 |
| p value | 0.153 | 0.06 | 0.173 | <0.001 * | 0.951 | 0.197 | ||||||||||||
| Sex | ||||||||||||||||||
| Women | 1.31 | 1.32 | 0–5.2 | 1.85 | 1.66 | 0–8.4 | 4.01 | 2.59 | 0–11.2 | 1.84 | 2.63 | 0–17.0 | 1.13 | 1.58 | 0–9.0 | 1.53 | 2.04 | 0–18.9 |
| Men | 1.16 | 1.23 | 0–5.2 | 1.97 | 1.58 | 0–7.0 | 5.45 | 3.31 | 0–11.2 | 2.15 | 2.93 | 0–17.0 | 1.71 | 3.28 | 0–18.0 | 1.97 | 2.10 | 0–12.6 |
| p value | 0.628 | 0.484 | 0.013 * | 0.332 | 0.442 | 0.054 | ||||||||||||
| Residence | ||||||||||||||||||
| Urban | 1.26 | 1.30 | 0–5.2 | 1.90 | 1.68 | 0–8.4 | 4.23 | 2.84 | 0–11.2 | 1.93 | 2.67 | 0–17.0 | 1.21 | 2.07 | 0–18.0 | 1.63 | 2.15 | 0–18.9 |
| Rural | 1.31 | 1.27 | 0–5.2 | 1.64 | 1.23 | 0.1–4.2 | 5.14 | 2.72 | 1.2–11.2 | 1.90 | 2.91 | 0–13.6 | 1.67 | 2.39 | 0–9.0 | 1.80 | 1.41 | 0–6.3 |
| p value | 0.593 | 0.877 | 0.118 | 0.846 | 0.431 | 0.152 | ||||||||||||
| Occupation | ||||||||||||||||||
| Dependent worker | 1.13 | 1.13 | 0–5.2 | 1.80 | 1.58 | 0.1–8.4 | 4.13 | 2.76 | 0–11.2 | 1.62 | 2.39 | 0–17.0 | 1.18 | 1.54 | 0–9.0 | 1.48 | 1.65 | 0–12.6 |
| Freelance worker | 0.99 | 1.47 | 0.1–5.2 | 1.94 | 1.79 | 0.1–7.0 | 4.47 | 3.01 | 0–11.2 | 0.92 | 1.01 | 0–3.4 | 0.61 | 0.75 | 0–2.4 | 1.60 | 1.47 | 0–6.3 |
| Student | 1.68 | 1.56 | 0–5.2 | 2.24 | 1.91 | 0–8.4 | 4.43 | 2.86 | 0–11.2 | 3.38 | 3.51 | 0–17.0 | 1.73 | 3.16 | 0–18.0 | 2.06 | 3.10 | 0–18.9 |
| Unemployed | 1.04 | 0.82 | 0–2.6 | 1.41 | 1.03 | 0.1–2.8 | 6.17 | 4.14 | 1.2–11.2 | 0.53 | 0.68 | 0–1.5 | 0.80 | 0.89 | 0–2.4 | 2.18 | 0.87 | 0.9–2.7 |
| Housekeeper | 1.19 | 1.10 | 0–3.9 | 1.44 | 0.96 | 0–2.8 | 4.28 | 2.31 | 0.4–8.4 | 0.95 | 1.31 | 0–3.4 | 0.62 | 0.80 | 0–3.0 | 1.43 | 1.10 | 0–2.7 |
| Retired | 1.20 | 0.82 | 0.2–2.6 | 1.21 | 0.32 | 0.6–1.4 | 3.93 | 3.15 | 0–8.4 | 1.06 | 1.35 | 0–3.4 | 2.68 | 3.22 | 0.2–9.0 | 0.74 | 0.24 | 0.4–0.9 |
| p value | 0.207 | 0.923 | 0.803 | <0.001 * | 0.284 | 0.331 | ||||||||||||
| BMI | ||||||||||||||||||
| Underweight | 2.66 | 2.50 | 0.2–5.2 | 2.53 | 2.68 | 0.6–5.6 | 8.40 | 2.80 | 5.6–11.2 | 6.16 | 4.38 | 1.5–10.2 | 1.14 | 1.62 | 0–3.0 | 3.30 | 2.74 | 0.9–6.3 |
| Normal | 1.53 | 1.38 | 0–5.2 | 2.25 | 1.91 | 0.2–8.4 | 4.06 | 2.27 | 0–11.2 | 2.38 | 2.87 | 0–17.0 | 1.52 | 2.67 | 0–18.0 | 1.96 | 3.04 | 0–18.9 |
| Overweight | 1.26 | 1.31 | 0.1–5.2 | 1.74 | 1.46 | 0.1–7.0 | 3.98 | 2.72 | 0–11.2 | 1.75 | 2.90 | 0–17.0 | 1.22 | 1.77 | 0–9.0 | 1.45 | 1.39 | 0–6.3 |
| Obesity | 0.89 | 0.93 | 0–3.9 | 1.56 | 1.33 | 0–7.0 | 4.91 | 3.44 | 0–11.2 | 1.35 | 1.58 | 0–6.8 | 0.94 | 1.70 | 0–9.0 | 1.44 | 1.03 | 0–2.7 |
| p value | 0.041 * | 0.245 | 0.069 | 0.021 * | 0.181 | 0.459 | ||||||||||||
Disclaimer/Publisher’s Note: The statements, opinions and data contained in all publications are solely those of the individual author(s) and contributor(s) and not of MDPI and/or the editor(s). MDPI and/or the editor(s) disclaim responsibility for any injury to people or property resulting from any ideas, methods, instructions or products referred to in the content. |
© 2023 by the authors. Licensee MDPI, Basel, Switzerland. This article is an open access article distributed under the terms and conditions of the Creative Commons Attribution (CC BY) license (https://creativecommons.org/licenses/by/4.0/).
Share and Cite
Guzmán, C.; Espinoza, J.; Fuentealba, F. Pilot Study to Estimate Dietary Fiber Intake in Adults Residing in Chile. Nutrients 2023, 15, 900. https://doi.org/10.3390/nu15040900
Guzmán C, Espinoza J, Fuentealba F. Pilot Study to Estimate Dietary Fiber Intake in Adults Residing in Chile. Nutrients. 2023; 15(4):900. https://doi.org/10.3390/nu15040900
Chicago/Turabian StyleGuzmán, Carla, Jonathan Espinoza, and Fabiola Fuentealba. 2023. "Pilot Study to Estimate Dietary Fiber Intake in Adults Residing in Chile" Nutrients 15, no. 4: 900. https://doi.org/10.3390/nu15040900
APA StyleGuzmán, C., Espinoza, J., & Fuentealba, F. (2023). Pilot Study to Estimate Dietary Fiber Intake in Adults Residing in Chile. Nutrients, 15(4), 900. https://doi.org/10.3390/nu15040900