Abstract
Levodopa (L-dopa) and catechol-O-methyltransferase (COMT) inhibition are widely used therapeutics in Parkinson’s disease (PD). Despite their therapeutic effects, it was raised that nutrients involved in one-carbon metabolism can be deteriorated by PD therapies. The aim of this meta-analysis was to investigate the impact of L-dopa and COMT inhibitors on levels of homocysteine (Hcy), vitamin B12 and folate in patients with PD. A total of 35 case-control studies from 14 different countries were selected through PubMed, MEDLINE and Google Scholar and were meta-analyzed. In the L-dopa group, the Hcy level was higher compared to the PD without L-dopa group (SMD: 5.11 μmol/L, 95% CI: 3.56 to 6.66). Moreover, vitamin B12 and folate levels in the L-dopa group were lower compared to the healthy control (SMD: −62.67 pg/mL, 95% CI: −86.53 to −38.81; SMD: −0.89 ng/mL, 95% CI: −1.44 to −0.33, respectively). The COMT inhibitor group showed lower levels of Hcy (SMD: −3.78 μmol/L, 95% CI: −5.27 to −2.29) and vitamin B12 (SMD: −51.01 pg/mL, 95% CI: −91.45 to −10.57), but higher folate levels (SMD: 1.78 ng/mL, 95% CI: −0.59 to 4.15) compared to the L-dopa group. COMT inhibitors may ameliorate L-dopa-induced hyper-homocysteine and folate deficiency but exacerbate vitamin B12 deficiency.
Keywords:
meta-analysis; Parkinson’s disease; one-carbon metabolism; levodopa; homocysteine; vitamin B; folate 1. Introduction
Parkinson’s disease (PD) is a typical neurodegenerative disease characterized by motor dysfunction, such as tremors, rigidity and slow movements, resulting from the loss of dopaminergic neurons [1]. It is mainly caused by environmental factors. Its incidence is approximately 1% among people over the age of 60 worldwide and steadily increasing [2].
For patients with PD, dopamine replacement is the treatment of choice, and the most commonly used drug is levodopa (L-dopa), a dopamine precursor [1]. Because dopamine itself cannot cross the blood-brain barrier (BBB) owing to its large molecular weight, L-dopa is administered [3]. However, L-dopa can easily convert to other structures, such as 3-O-methyldopa catalyzed by the enzyme catechol-O-methyl transferase (COMT) before it crosses the BBB or reaches the brain. [4]. To prevent this undesirable conversion, L-dopa is often prescribed along with COMT inhibitors, such as entacapone [5]. Moreover, it can cause serious side effects, such as dyskinesia [6]. It accelerates PD progression by inducing neuronal cell death through self-oxidation [7].
Furthermore, L-dopa can exacerbate elevated homocysteine (Hcy) levels in patients with PD [8]. Hcy is a thiol-containing amino acid and an intermediate product in the folate-methionine cycle [9]. Under healthy conditions, Hcy reverts to methionine in the presence of B vitamins, such as folate and vitamin B12 [10]. When folate enters the folate cycle in the form of tetrahydrofolate (THF), it converts into 5-methyl-THF. Together with vitamin B12, 5-methyl-THF can provide its methyl group to Hcy, catalyzed by methionine synthase, to produce methionine and, consequently, maintain a lower Hcy level [10]. However, Hcy conversion is not appropriately facilitated in PD, resulting in elevated circulating Hcy levels, which leads to cellular damage through oxidative stress and inflammation [11]. L-dopa aggravates Hcy metabolism by directly involving the folate-methionine cycle or one-carbon metabolism [12]. Briefly, in the presence of COMT, S-adenosylmethionine provides its methyl group to L-dopa to produce S-adenosylhomocysteine (SAH) [13]. SAH is rapidly hydrolyzed to Hcy, which is elevated in patients with PD [14]. Therefore, the side effects of L-dopa in patients with PD might be closely related to the dysregulation of Hcy, vitamin B12 and folate.
To optimize nutritional approaches for patients with PD, a comprehensive meta-analysis of various studies worldwide should be performed comparing the circulating levels of Hcy, vitamin B12 and folate in patients with PD taking L-dopa. The aim of the present study was to assess the impact of L-dopa administration on the folate-methionine cycle based on circulating levels of Hcy, vitamin B12 and folate. The effect of the COMT inhibitor on L-dopa-induced dysregulation of the folate-methionine cycle was also investigated, as COMT inhibitors are often combined with the L-dopa treatment.
2. Materials and Methods
2.1. Literature Search
A literature search for the current meta-analysis was performed using PubMed, MEDLINE and Google Scholar for articles published until 25 August 2022. The literature was searched using the following keywords: “Parkinson’s disease (PD),” “Levodopa,” “L-dopa,” “Homocysteine (Hcy),” “Vitamin B12,” “Folate” and “COMT inhibitor.” In addition, Chinese literature was searched using the China Knowledge Resource-Integrated Database. In addition, this study was conducted based on the PRISMA 2020 Checklist.
2.2. Inclusion and Exclusion Criteria
Inclusion criteria were: (1) full-text articles of randomized or non-randomized clinical trials involving humans; (2) studies on the relationship between L-dopa use and Hcy, vitamin B12 or folate in patients with PD; (3) studies comparing L-dopa with a healthy control or COMT inhibitor group; (4) articles containing data expressed as mean ± standard deviation and complete information. Exclusion criteria were: (1) reviews or articles without data, (2) studies involving patients on vitamin B supplementation and (3) duplicate publications. Study selection was conducted according to the Preferred Reporting Items for Systematic Reviews and Meta-Analyses flow diagram.
2.3. Data Extraction
Data were tabulated in a spreadsheet under the following headings: first author, publication year, title and parameters analyzed. “Healthy control” was defined as a group with participants without PD. “Without L-dopa” was defined as a group of patients with L-dopa-naïve PD. “L-dopa” was defined as a group of patients with PD taking only L-dopa. “COMT inhibitor” was defined as a group of patients with PD taking both L-dopa and the COMT inhibitor together. Data are available within the selected studies and/or their Supplementary Materials as well as upon request from the authors.
2.4. Statistical Analyses
Statistical analyses were performed using Review Manager (RevMan) 5.2. The degree of inconsistency within studies, or heterogeneity (I2), was interpreted based on the following reference points and their p-values: 0%, 25%, 50% and 75%, representing no, low, moderate and high heterogeneity, respectively [15]. When heterogeneity was low, a random-effects model was used; otherwise, a fixed-effects model was used. The standardized mean difference (SMD) was used as the effect size for Hcy, vitamin B12 and folate comparisons. Statistical significance was set at a p-value < 0.05. Each analysis was presented as a forest plot. The green squares represent the weighted mean difference in each study, and the black diamonds represent the summary of the weighted mean difference in the forest plots. Funnel plots were constructed using RevMan to assess the publication bias. When the plot showed symmetrical and equal scattering, the results indicated no publication bias.
3. Results
3.1. Search Results
In the literature search, 341 clinical trials were initially screened, and duplicate articles were removed. After applying the exclusion criteria, a total of 35 clinical trials were included in the meta-analysis (Figure 1), with blood/serum Hcy, vitamin B12 and folate levels as measured biomarkers in the selected studies. Figure 1 shows the details of the selection procedure.
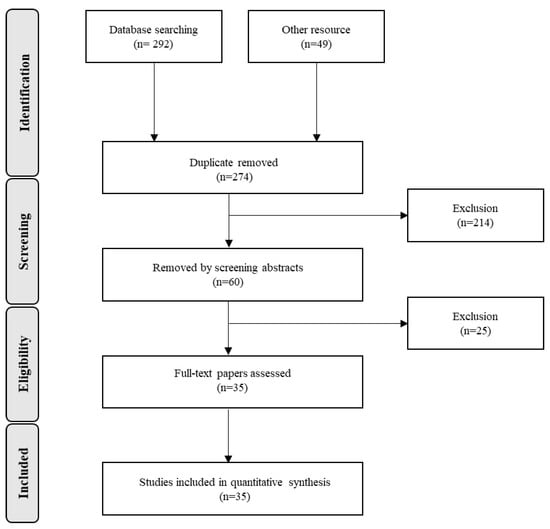
Figure 1.
Flow diagram of study selection process.
3.2. Study Characteristics in the Meta-Analysis
Table 1 summarizes the characteristics of the included clinical trials. Among the 35 clinical trials, 12 were carried out in China and Taiwan, while 7 were in Italy, 4 in Germany, 2 in Greece and 1 each in Australia, Poland, the Republic of Korea, Japan, Thailand, Czechia, Turkey, the United States, Slovakia and Canada. The number of participants enrolled in the selected studies ranged from 12 to 212, and participants were generally over the age of 60 years. The L-dopa dose was ≥300 mg/day in the L-dopa group. Treatment duration ranged from 3.0 to 12.4 years for L-dopa and 4.3 to 13.5 years for the COMT inhibitor.

Table 1.
Characteristics of included clinical trials in the current meta-analysis. When the reports do not indicate standard deviation (SD), only mean values were written (mean ± SD). L-dopa: levodopa; COMT: catechol-O-methyltransferase; NA: not assessed; -: undescribed.
3.3. Comparison of Hcy Levels in Blood
The effect of the L-dopa treatment on blood Hcy levels was examined in 26 studies (Figure 2A). Blood Hcy levels were significantly higher in the L-dopa group than in the healthy control group (Figure 2). The overall SMD of the 26 studies was 6.43 μmol/L (95% confidence interval [CI]: 5.60 to 7.25; p < 0.00001) in random-effects models with high significant heterogeneity (I2 = 76%, p < 0.000001). Subsequently, the impact of the L-dopa treatment on blood Hcy levels in patients with PD was examined (Figure 2B). Hcy levels were significantly higher in the L-dopa group than in the without L-dopa group. The overall SMD of the 17 studies was 5.11 μmol/L (95% CI: 3.56 to 6.66; p < 0.00001) in random-effects models with high significant heterogeneity (I2 = 81%, p < 0.00001). Moreover, the influence of the COMT inhibitor on high blood Hcy levels induced by the L-dopa treatment in patients with PD was investigated (Figure 2C). The group treated with both L-dopa and the COMT inhibitor had lower levels of Hcy in the blood compared to the group taking L-dopa alone. The overall SMD of the seven studies was −3.78 μmol/L (95% CI: −5.27, −2.29; p < 0.00001) in the random-effects models with no significant heterogeneity (I2 = 25%, p = 0.24). Finally, the blood level of Hcy in the L-dopa plus COMT inhibitor treatment group was compared with that in the healthy control group (Figure 2D). Hcy levels were significantly higher in the COMT inhibitor group than in the healthy control group. The overall SMD of the six studies was 2.40 μmol/L (95% CI: 0.28 to 4.51; p = 0.03) in random-effects models with modest substantial heterogeneity (I2 = 74%, p = 0.002).
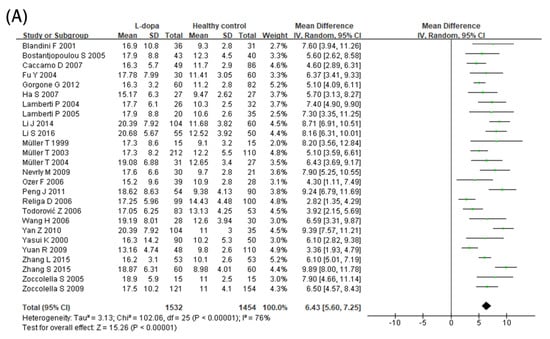
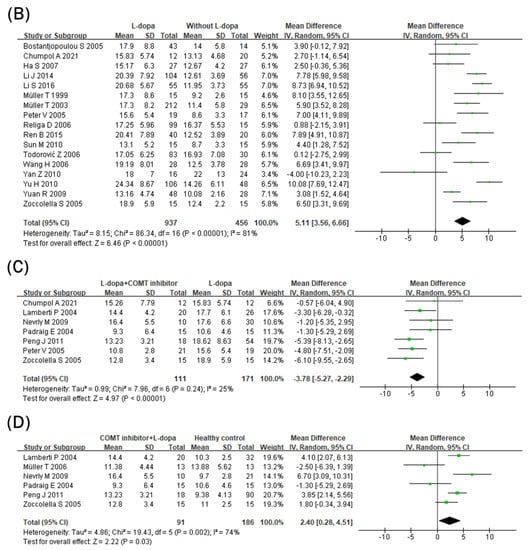
Figure 2.
Forest plot of the blood Hcy levels comparing (A) L-dopa group and healthy controls, (B) L-dopa group and without L-dopa group, (C) COMT inhibitor group and L-dopa group and (D) COMT inhibitor group and healthy control.
3.4. Comparison of Vitamin B12 Levels in Blood
Blood vitamin B12 levels were lower in the L-dopa group than in the healthy control group (Figure 3A). The overall SMD of the 18 studies was −62.67 pg/mL (95% CI: −86.53 to −38.81; p < 0.00001) in random-effects models with modest and significant heterogeneity (I2 = 58%, p = 0.001). In addition, blood vitamin B12 levels were even lower in the COMT inhibitor group (Figure 3B). The overall SMD of the five studies was −51.01 pg/mL (95% CI: −91.45 to −10.57; p = 0.01) in fixed-effects models with no heterogeneity (I2 = 0%, p = 0.55). Moreover, blood vitamin B12 levels were still lower in the COMT inhibitor group than in the healthy control group (Figure 3C). The overall SMD of the three studies was −86.60 pg/mL (95% CI: −171.09 to −2.10; p = 0.04) in random-effects models with no significant heterogeneity (I2 = 57%, p = 0.10) and larger than the overall SMD of the 18 studies comparing the L-dopa and healthy control groups (−62.67 pg/mL).
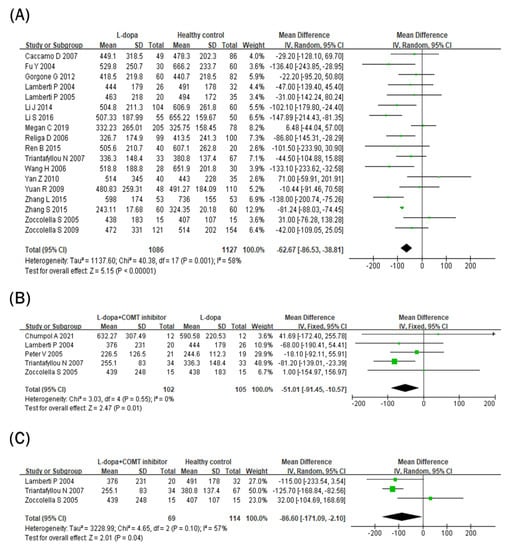
Figure 3.
Forest plot of the blood vitamin B12 levels comparing (A) L-dopa group and healthy control, (B) COMT inhibitor group and L-dopa group and (C) COMT inhibitor group and healthy control.
3.5. Comparison of Folate Levels in Blood
Blood folate levels were compared between the L-dopa and healthy control groups (Figure 4A). Blood folate levels were significantly lower in the L-dopa group than in the healthy control group. The overall SMD of the 18 studies was −0.89 ng/mL (95% CI: −1.44 to −0.33; p = 0.002) in random-effects models with modest heterogeneity (I2 = 62%, p = 0.00003). Subsequently, the impact of the COMT inhibitor on circulating folate levels in the L-dopa group was examined (Figure 4B). Blood folate levels did not differ significantly between the COMT inhibitor and L-dopa groups (SMD = 1.78 ng/mL, 95% CI: −0.59 to 4.15; p = 0.14) in random-effects models with no heterogeneity (I2 = 52%, p = 0.08). Furthermore, blood folate levels were compared between the COMT inhibitor and healthy control groups (Figure 4C). Blood folate levels did not differ significantly between the COMT inhibitor and healthy control groups (SMD = 1.20 ng/mL, 95% CI: −0.78, 3.18; p = 0.24) in random-effects models with no heterogeneity (I2 = 65%, p = 0.06).
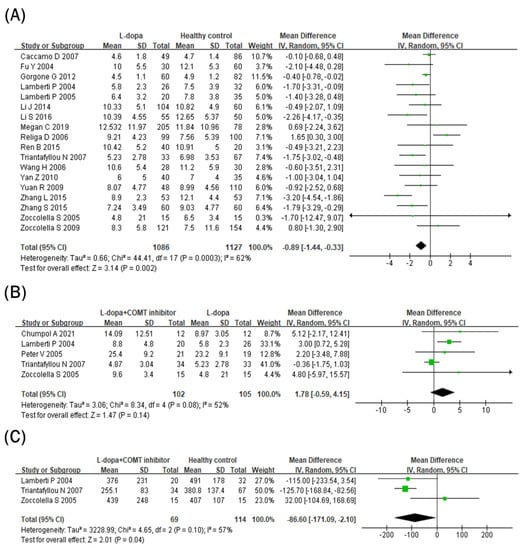
Figure 4.
Forest plot of the blood folate levels comparing (A) L-dopa group and healthy control, (B) COMT inhibitor group and L-dopa group and (C) COMT inhibitor group and healthy control.
3.6. Publication Bias
Publication bias was assessed using funnel plots (Supplementary Figures S2–S4). There was no evidence of publication bias with funnel plots of circulating Hcy, vitamin B12 or folate for the healthy control or COMT inhibitor group.
4. Discussion
In the current meta-analysis, the impact of L-dopa and the COMT inhibitor on the folate–methionine cycle in PD was evaluated based on the blood levels of Hcy, vitamin B12 and folate. Two previous meta-analyses investigated if there is any correlation between the ratio of Hcy/vitamin B12/folate and PD incidence [48,49]. However, one of them was confined to studies in China and did not consider the impact of L-dopa or COMT inhibitor therapy [48]. The other included a small number of studies and did not evaluate vitamin B12 or folate levels, which should be considered in terms of the folate–methionine cycle [49]. To the best of our knowledge, the current study would be the first report on the effects of L-dopa and its concomitant COMT inhibitor on the folate–methionine cycle based on the blood levels of Hcy, vitamin B12 and folate and integrating numerous reports worldwide.
Hcy is closely associated with the promotion of PD pathologies, and its elevation should be considered as a main risk factor for PD [50]. In this meta-analysis, the circulating Hcy concentrations in various subgroups of patients with PD were investigated (Figure 2). The blood Hcy level was elevated in the L-dopa group compared to both the healthy control and without L-dopa groups. These results are similar to those of previous meta-analyses, showing that the same results were obtained even when the number of studies increased [48]. In addition, the normal range of blood Hcy levels is 5–15 μmol/L, and circulating Hcy concentrations ≥15 μmol/L are considered to indicate hyper-homocysteinemia [10]. In this study, 25 of 26 included studies showed that the mean blood Hcy concentration in the L-dopa group was >15 μmol/L (Figure 2A), while the mean blood Hcy levels in the without L-dopa group in 15 of 17 included studies were below the borderline (Figure 2B). High Hcy causes various pathogenic outcomes, such as oxidative stress and inflammation which can accelerate neuronal cell death [10]. In addition, many studies reported that Hcy has a high correlation with the cardiovascular system by causing pathological problems in cardiovascular endothelium and smooth muscle cells [51,52,53]. For these reasons, the current results imply that various side effects reported in PD patients with prolonged L-dopa intervention might be related to the elevation of circulating Hcy and its pathogenic responses. In contrast, the COMT inhibitor group showed significantly lower Hcy levels compared to the L-dopa group (Figure 2C). This might result from the fact that the COMT inhibitor suppressed the overproduction of SAH by COMT after taking L-dopa in one-carbon metabolism [12]. Therefore, the current study suggests that COMT inhibitors can not only involve in the secure delivery of L-dopa but reduce potential side effects such as hyperhomocysteinemia caused by L-dopa intervention.
In addition to Hcy, vitamin B12 or folate can be found as methyl donors in one-carbon metabolism or the folate–methionine cycle [14]. Thus, deficiencies in folate and vitamin B12 can interfere with DNA synthesis or replication, subsequently contributing to cell death or the development of diseases such as cancer [54,55,56]. In a previous study, folic acid deficiency with transformed Hcy inhibited DNA repair in the hippocampal neurons [57]. Similarly, low serum vitamin B12 concentrations are related to brain damage [58]. Thus, folate and vitamin B12 are important nutrients facilitating the proper folate–methionine cycle and inhibiting neuronal damage. In this meta-analysis, both blood vitamin B12 and folate levels were significantly reduced in the L-dopa group compared to the healthy control group. In particular, circulating vitamin B12 levels were further reduced in the COMT inhibitor group compared to the L-dopa group (Figure 3B), but blood folate concentrations did not change in the COMT inhibitor group and rather showed an increasing tendency (Figure 4B). A previous meta-analysis showed that patients with PD had lower circulating vitamin B12 and folate levels than healthy controls [48]. Therefore, the current data imply that L-dopa and/or COMT inhibitor therapy might deteriorate vitamin B imbalance in patients with PD.
To understand the dual effect of the COMT inhibitor on the folate–methionine cycle, the normal range of each factor examined in this study should be reviewed. The normal range of blood concentration is 5–15 μmol/L for Hcy [10], 200–900 pg/mL for vitamin B12 [59] and 3.0 ng/mL or greater for folate (sufficient concentration of folate controversial) [60]. Accordingly, the levels of vitamin B12 and folate were within the normal range, even in the COMT inhibitor group. However, in the case of Hcy, the risk of hyperhomocysteinemia exceeded the borderline of 15 μmol/L in the L-dopa group. Thus, the current data suggest that the COMT inhibitor reduces the side effects of L-dopa related to hyperhomocysteinemia.
In addition to the normal range of each factor, the organs involved in the folate–methionine cycle should be considered. The main organ involved in one-carbon metabolism is the liver Vitamin B12 is mostly stored in the liver until the body requires it. Half of the folate concentration is stored in the liver, and the rest is stored in blood and tissues. Therefore, alterations in the blood folate concentration might not indicate metabolic processes, unlike those in vitamin B12 levels. Therefore, alterations in circulating vitamin B12 and folate showed different patterns after the drug treatment.
Finally, the disease duration of each group should be considered. In this analysis, the COMT inhibitor group had a longer disease duration than the L-dopa group (Supplementary Figure S1). This may be because, in general, the longer the disease duration, the greater the chance of taking a combination of L-dopa and the COMT inhibitor. In addition, patients with a longer disease duration might undergo further PD progression, which may affect the status of vitamin B12 and folate, as they play roles in the folate–methionine cycle, erythropoiesis and iron homeostasis [61]. Therefore, the difference in disease duration would also affect the results showing the dual nature of the COMT inhibitor. Nevertheless, the current data provide evidence that L-dopa or COMT administration can affect vitamin B12, folate and Hcy levels to a certain degree.
Collectively, this study demonstrated hyperhomocysteinemia and lower blood levels of vitamin B12 and folate in PD patients with L-dopa administration. An increase in blood Hcy levels induces neuronal cell death, and vitamin B12 and folate deficiencies suppress their neuroprotective effects [11]. These results are in line with previous reports showing that L-dopa can damage dopaminergic neurons, thereby accelerating PD progression [7]. Thus, possible causes of disease exacerbation from L-dopa therapy would be an elevation in Hcy but a reduction in vitamin B12 and folate. Moreover, this meta-analysis elucidated that COMT inhibitors might be beneficial in ameliorating hyperhomocysteinemia and folate deficiency induced by the L-dopa treatment. However, COMT inhibitors can exacerbate vitamin B12 deficiency in patients with PD on L-dopa. In conclusion, the current data suggest that a COMT inhibitor with vitamin B supplementation could reduce L-dopa-induced PD deterioration.
The present study had the strengths of integrating global data and considering concomitant L-dopa therapy. However, this study had some limitations. First, the clinical trials included both randomized and non-randomized ones, such as cross-sectional studies. Second, no quality assessment was performed. Third, the studies showed heterogeneity (Figure 2A,B,D, Figure 3A and Figure 4A). The observed heterogeneity disappeared when studies were stratified by the geographic region, as previously described [62]. The North American region showed a markedly higher incidence compared to other regions, whereas some countries, such as Italy, showed decreasing trends in the estimated annual percentage change in PD from 1990 to 2019 [63]. Fourth, the group taking vitamin B supplements was not considered in the current study. Most of the studies excluded participants taking vitamin B supplements, which may strengthen or contradict the main conclusion of the current meta-analysis. Lastly, as the analysis of vitamin B12 or folate was not conducted as much as that of Hcy, the difference between the without L-dopa and L-dopa groups was not determined, and the sample sizes of other studies on vitamin B12 and folate were small as well. Therefore, more clinical studies are required to clarify the impact of L-dopa and the COMT inhibitor on the folate–methionine cycle based on various factors, such as geographical regions and biodiversity.
Supplementary Materials
The following supporting information can be downloaded at https://www.mdpi.com/article/10.3390/nu15040901/s1: Figure S1: The difference in mean of disease duration between L-dopa group and COMT inhibitor group; Figure S2: Funnel plot of Hcy-related studies; Figure S3: Funnel plot of Vit B12-related studies; Figure S4: Funnel plot of folate-related studies; Figure S5: PRISMA 2020 Checklist.
Author Contributions
Conceptualization, J.H.K., M.S.O. and Y.L.; methodology, J.H.K. and Y.L.; investigation, J.H.K. and S.J.; writing—original draft preparation, J.H.K. and H.E.; writing—review and editing, J.H.K., H.E., M.S.O. and Y.L.; supervision, M.S.O. and Y.L.; funding acquisition, M.S.O. All authors have read and agreed to the published version of the manuscript.
Funding
This research was supported by grants from the National Research Foundation of Korea, funded by the Korean government (2022M3A9B6017813). This research was supported by the Medical Research Center Program through the National Research Foundation of Korea, funded by the Ministry of Science and ICT (NRF-2017R1A5A2014768).
Institutional Review Board Statement
Not applicable.
Informed Consent Statement
Not applicable.
Data Availability Statement
The data that support the findings of this study are available from the corresponding author upon reasonable request.
Conflicts of Interest
The authors declare no conflict of interest.
References
- Charvin, D.; Medori, R.; Hauser, R.A.; Rascol, O. Therapeutic strategies for Parkinson disease: Beyond dopaminergic drugs. Nat. Rev. Drug Discov. 2018, 17, 804–822. [Google Scholar] [CrossRef] [PubMed]
- GBD 2016 Parkinson’s Disease Collaborators. Global, regional, and national burden of Parkinson’s disease, 1990–2016: A systematic analysis for the Global Burden of Disease Study 2016. Lancet Neurol. 2018, 17, 939–953. [Google Scholar] [CrossRef] [PubMed]
- Haddad, F.; Sawalha, M.; Khawaja, Y.; Najjar, A.; Karaman, R. Dopamine and Levodopa Prodrugs for the Treatment of Parkinson’s Disease. Molecules 2017, 23, 40. [Google Scholar] [CrossRef] [PubMed]
- Oechsner, M.; Buhmann, C.; Strauss, J.; Stuerenburg, H.J. COMT-inhibition increases serum levels of dihydroxyphenylacetic acid (DOPAC) in patients with advanced Parkinson’s disease. J. Neural Transm. 2002, 109, 69–75. [Google Scholar] [CrossRef] [PubMed]
- Song, Z.; Zhang, J.; Xue, T.; Yang, Y.; Wu, D.; Chen, Z.; You, W.; Wang, Z. Different Catechol-O-Methyl Transferase Inhibitors in Parkinson’s Disease: A Bayesian Network Meta-Analysis. Front. Neurol. 2021, 12, 707723. [Google Scholar] [CrossRef]
- Bandopadhyay, R.; Mishra, N.; Rana, R.; Kaur, G.; Ghoneim, M.M.; Alshehri, S.; Mustafa, G.; Ahmad, J.; Alhakamy, N.A.; Mishra, A. Molecular Mechanisms and Therapeutic Strategies for Levodopa-Induced Dyskinesia in Parkinson’s Disease: A Perspective Through Preclinical and Clinical Evidence. Front. Pharmacol. 2022, 13, 805388. [Google Scholar] [CrossRef]
- Hormann, P.; Delcambre, S.; Hanke, J.; Geffers, R.; Leist, M.; Hiller, K. Impairment of neuronal mitochondrial function by L-DOPA in the absence of oxygen-dependent auto-oxidation and oxidative cell damage. Cell Death Discov. 2021, 7, 151. [Google Scholar] [CrossRef]
- Bostantjopoulou, S.; Katsarou, Z.; Frangia, T.; Hatzizisi, O.; Papazisis, K.; Kyriazis, G.; Kiosseoglou, G.; Kazis, A. Endothelial function markers in parkinsonian patients with hyperhomocysteinemia. J. Clin. Neurosci. 2005, 12, 669–672. [Google Scholar] [CrossRef]
- Kennedy, D.O. B Vitamins and the Brain: Mechanisms, Dose and Efficacy—A Review. Nutrients 2016, 8, 68. [Google Scholar] [CrossRef]
- Kumar, A.; Palfrey, H.A.; Pathak, R.; Kadowitz, P.J.; Gettys, T.W.; Murthy, S.N. The metabolism and significance of homocysteine in nutrition and health. Nutr. Metab. 2017, 14, 78. [Google Scholar] [CrossRef]
- Bhatia, P.; Singh, N. Homocysteine excess: Delineating the possible mechanism of neurotoxicity and depression. Fundam. Clin. Pharmacol. 2015, 29, 522–528. [Google Scholar] [CrossRef] [PubMed]
- Murray, L.K.; Jadavji, N.M. The role of one-carbon metabolism and homocysteine in Parkinson’s disease onset, pathology and mechanisms. Nutr. Res. Rev. 2019, 32, 218–230. [Google Scholar] [CrossRef] [PubMed]
- Valkovic, P.; Benetin, J.; Blazicek, P.; Valkovicova, L.; Gmitterova, K.; Kukumberg, P. Reduced plasma homocysteine levels in levodopa/entacapone treated Parkinson patients. Parkinsonism. Relat. Disord. 2005, 11, 253–256. [Google Scholar] [CrossRef] [PubMed]
- Anamnart, C.; Kitjarak, R. Effects of vitamin B12, folate, and entacapone on homocysteine levels in levodopa-treated Parkinson’s disease patients: A randomized controlled study. J. Clin. Neurosci. 2021, 88, 226–231. [Google Scholar] [CrossRef]
- Higgins, J.P.; Thompson, S.G.; Deeks, J.J.; Altman, D.G. Measuring inconsistency in meta-analyses. BMJ 2003, 327, 557–560. [Google Scholar] [CrossRef] [PubMed]
- Blandini, F.; Fancellu, R.; Martignoni, E.; Mangiagalli, A.; Pacchetti, C.; Samuele, A.; Nappi, G. Plasma homocysteine and l-dopa metabolism in patients with Parkinson disease. Clin. Chem. 2001, 47, 1102–1104. [Google Scholar] [CrossRef]
- Caccamo, D.; Gorgone, G.; Curro, M.; Parisi, G.; Di Iorio, W.; Menichetti, C.; Belcastro, V.; Parnetti, L.; Rossi, A.; Pisani, F.; et al. Effect of MTHFR polymorphisms on hyperhomocysteinemia in levodopa-treated Parkinsonian patients. Neuromol. Med. 2007, 9, 249–254. [Google Scholar] [CrossRef]
- Yi, F.; Sheng-di, C.; Jian-rong, L.; Pei-hua, N.; Un, Y.Y. Correlation analysis between plasma homocysteine level and polymorphism of homocysteine metabolism related enzymes in Parkinson disease. Chin. J. Neurol. 2004, 20, 450–455. [Google Scholar]
- Gorgone, G.; Curro, M.; Ferlazzo, N.; Parisi, G.; Parnetti, L.; Belcastro, V.; Tambasco, N.; Rossi, A.; Pisani, F.; Calabresi, P.; et al. Coenzyme Q10, hyperhomocysteinemia and MTHFR C677T polymorphism in levodopa-treated Parkinson’s disease patients. Neuromol. Med. 2012, 14, 84–90. [Google Scholar] [CrossRef]
- Ha, S.-W.; Kim, J.-M.; Cho, J.-S.; Cho, E.-K. 2.269 Plasma homocysteine levels in idiopathic Parkinson’s disease: Role of idiopathic Parkinson’s disease and levodopa treatment. Parkinsonism. Relat. Disord. 2007, 13, S116. [Google Scholar] [CrossRef]
- Lamberti, P.; Zoccolella, S.; Iliceto, G.; Armenise, E.; Fraddosio, A.; de Mari, M.; Livrea, P. Effects of levodopa and COMT inhibitors on plasma homocysteine in Parkinson’s disease patients. Mov. Disord. 2005, 20, 69–72. [Google Scholar] [CrossRef]
- Lamberti, P.; Zoccolella, S.; Armenise, E.; Lamberti, S.V.; Fraddosio, A.; de Mari, M.; Iliceto, G.; Livrea, P. Hyperhomocysteinemia in L-dopa treated Parkinson’s disease patients: Effect of cobalamin and folate administration. Eur. J. Neurol. 2005, 12, 365–368. [Google Scholar] [CrossRef] [PubMed]
- Li, J.; Chen, K.; Gao, Y.; Shi, F. Effect of levodopa on plasma homocysteine level in patients with parkinsons disease. J. Clin. Neurol. 2014, 24, 399–400. [Google Scholar]
- Li, S.C. Effect of levodopa on plasma homocysteine level in elderly patients with Parkinson’s disease. Chin. J. Pract. Nerv. Dis. 2016, 19, 109–110. [Google Scholar]
- Bakeberg, M.C.; Jefferson, A.; Riley, M.; Byrnes, M.; Ghosh, S.; Mastaglia, F.L.; Horne, M.K.; McGregor, S.; Stell, R.; Kenna, J.; et al. Elevated Serum Homocysteine Levels Have Differential Gender-Specific Associations with Motor and Cognitive States in Parkinson’s Disease. Park. Dis. 2019, 2019, 3124295. [Google Scholar] [CrossRef] [PubMed]
- Muller, T.; Werne, B.; Fowler, B.; Kuhn, W. Nigral endothelial dysfunction, homocysteine, and Parkinson’s disease. Lancet 1999, 354, 126–127. [Google Scholar] [CrossRef]
- Muller, T.; Woitalla, D.; Kuhn, W. Benefit of folic acid supplementation in parkinsonian patients treated with levodopa. J. Neurol. Neurosurg. Psychiatry 2003, 74, 549. [Google Scholar] [CrossRef]
- Muller, T.; Renger, K.; Kuhn, W. Levodopa-associated increase of homocysteine levels and sural axonal neurodegeneration. Arch. Neurol. 2004, 61, 657–660. [Google Scholar] [CrossRef]
- Muller, T.; Kuhn, W. Tolcapone decreases plasma levels of S-adenosyl-L-homocysteine and homocysteine in treated Parkinson’s disease patients. Eur. J. Clin. Pharmacol. 2006, 62, 447–450. [Google Scholar] [CrossRef]
- Nevrly, M.; Kanovsky, P.; Vranova, H.; Langova, K.; Hlustik, P. Effect of levodopa and entacapone treatment on plasma homocysteine levels in Parkinson’s disease patients. Parkinsonism. Relat. Disord. 2009, 15, 477–478. [Google Scholar] [CrossRef]
- Ozer, F.; Meral, H.; Hanoglu, L.; Aydemir, T.; Yilsen, M.; Cetin, S.; Ozturk, O.; Seval, H.; Koldas, M. Plasma homocysteine levels in patients treated with levodopa: Motor and cognitive associations. Neurol. Res. 2006, 28, 853–858. [Google Scholar] [CrossRef] [PubMed]
- O’Suilleabhain, P.E.; Bottiglieri, T.; Dewey, R.B., Jr.; Sharma, S.; Diaz-Arrastia, R. Modest increase in plasma homocysteine follows levodopa initiation in Parkinson’s disease. Mov. Disord. 2004, 19, 1403–1408. [Google Scholar] [CrossRef] [PubMed]
- Peng, J.H.; Wang, H.B.; Ouyang, J.; Gao, X.X. Correlational studies of serum homocysteine level and Parkinson’s disease. Intern. Med. China 2011, 6, 545–548. [Google Scholar] [CrossRef]
- Religa, D.; Czyzewski, K.; Styczynska, M.; Peplonska, B.; Lokk, J.; Chodakowska-Zebrowska, M.; Stepien, K.; Winblad, B.; Barcikowska, M. Hyperhomocysteinemia and methylenetetrahydrofolate reductase polymorphism in patients with Parkinson’s disease. Neurosci. Lett. 2006, 404, 56–60. [Google Scholar] [CrossRef] [PubMed]
- Ren, B.L.; Zhang, Z.S.; Zhao, X.Y.; Chen, D.Z.; Zhou, X.; Yang, X.P.; Mai, X.Q.; Wang, J.F. Discussion on the side-effect of levodopa on Parkinson’s disease. Health Vocat. Educ. 2015, 153–154. [Google Scholar]
- Guo, G.; Xu, S.; Cao, L.D.; Wu, Q.Y. Effect of Madopar on homocysteine in patients with Parkinson’s disease. Chin. J. Integr. Med. Cardio/Cerebrovasc. Dis. 2010, 8, 1188–1189. [Google Scholar]
- Todorovic, Z.; Dzoljic, E.; Novakovic, I.; Mirkovic, D.; Stojanovic, R.; Nesic, Z.; Krajinovic, M.; Prostran, M.; Kostic, V. Homocysteine serum levels and MTHFR C677T genotype in patients with Parkinson’s disease, with and without levodopa therapy. J Neurol. Sci. 2006, 248, 56–61. [Google Scholar] [CrossRef]
- Triantafyllou, N.I.; Kararizou, E.; Angelopoulos, E.; Tsounis, S.; Boufidou, F.; Evangelopoulos, M.E.; Nikolaou, C.; Vassilopoulos, D. The influence of levodopa and the COMT inhibitor on serum vitamin B12 and folate levels in Parkinson’s disease patients. Eur. Neurol. 2007, 58, 96–99. [Google Scholar] [CrossRef]
- Wang, H.; Ge, X.; Zhou, L.; Geng, D. Effect of L-dopa on plasma homocysteine in elderly patients with Parkinson’s disease. Chin. J. Neurol. 2006, 39, 609–611. [Google Scholar]
- Fen, Y.Z.; Hua, G.J.; Zhuo, L. A study of plasma homocysteine in patients with Parkinson’s disease and its clinical significance. Chin. J. Stroke 2010, 5, 735–740. [Google Scholar]
- Yasui, K.; Kowa, H.; Nakaso, K.; Takeshima, T.; Nakashima, K. Plasma homocysteine and MTHFR C677T genotype in levodopa-treated patients with PD. Neurology 2000, 55, 437–440. [Google Scholar] [CrossRef] [PubMed]
- Huiyan, Y.; Bin, Q.; Xiangyu, Z. Analysis on influence factors of hyperhomocysteinemia in patients with Parkinson’s disease. Stroke Nerv. Dis. 2010, 17, 83–85. [Google Scholar]
- Yuan, R.Y.; Sheu, J.J.; Yu, J.M.; Hu, C.J.; Tseng, I.J.; Ho, C.S.; Yeh, C.Y.; Hung, Y.L.; Chiang, T.R. Methylenetetrahydrofolate reductase polymorphisms and plasma homocysteine in levodopa-treated and non-treated Parkinson’s disease patients. J. Neurol. Sci. 2009, 287, 64–68. [Google Scholar] [CrossRef] [PubMed]
- Li, Z.; Ping, S.; Li, G.Y.; Lina, L.; Tuan, C.T. Study of serum homocysteine level and Parkinson’s disease. Prog. Mod. Biomed. 2015, 15, 3660–3663. [Google Scholar]
- Zhang, S.A. Clinical significance of determination of plasma homocysteine in the treatment of Parkinson’s disease with levodopa. J. Bethune Med. Sci. 2015, 13, 622–623. [Google Scholar]
- Zoccolella, S.; Lamberti, P.; Armenise, E.; de Mari, M.; Lamberti, S.V.; Mastronardi, R.; Fraddosio, A.; Iliceto, G.; Livrea, P. Plasma homocysteine levels in Parkinson’s disease: Role of antiparkinsonian medications. Park. Relat. Disord. 2005, 11, 131–133. [Google Scholar] [CrossRef]
- Zoccolella, S.; dell’Aquila, C.; Abruzzese, G.; Antonini, A.; Bonuccelli, U.; Canesi, M.; Cristina, S.; Marchese, R.; Pacchetti, C.; Zagaglia, R.; et al. Hyperhomocysteinemia in levodopa-treated patients with Parkinson’s disease dementia. Mov. Disord. 2009, 24, 1028–1033. [Google Scholar] [CrossRef]
- Dong, B.; Wu, R. Plasma homocysteine, folate and vitamin B12 levels in Parkinson’s disease in China: A meta-analysis. Clin. Neurol. Neurosurg. 2020, 188, 105587. [Google Scholar] [CrossRef]
- Hu, X.W.; Qin, S.M.; Li, D.; Hu, L.F.; Liu, C.F. Elevated homocysteine levels in levodopa-treated idiopathic Parkinson’s disease: A meta-analysis. Acta Neurol. Scand. 2013, 128, 73–82. [Google Scholar] [CrossRef]
- Fan, X.; Zhang, L.; Li, H.; Chen, G.; Qi, G.; Ma, X.; Jin, Y. Role of homocysteine in the development and progression of Parkinson’s disease. Ann. Clin. Transl. Neurol. 2020, 7, 2332–2338. [Google Scholar] [CrossRef]
- Wald, D.S.; Law, M.; Morris, J.K. Homocysteine and cardiovascular disease: Evidence on causality from a meta-analysis. BMJ 2002, 325, 1202. [Google Scholar] [CrossRef] [PubMed]
- Ganguly, P.; Alam, S.F. Role of homocysteine in the development of cardiovascular disease. Nutr. J. 2015, 14, 6. [Google Scholar] [CrossRef] [PubMed]
- Jin, N.; Huang, L.; Hong, J.; Zhao, X.; Chen, Y.; Hu, J.; Cong, X.; Xie, Y.; Pu, J. Elevated homocysteine levels in patients with heart failure: A systematic review and meta-analysis. Medicine 2021, 100, e26875. [Google Scholar] [CrossRef]
- Pieroth, R.; Paver, S.; Day, S.; Lammersfeld, C. Folate and Its Impact on Cancer Risk. Curr. Nutr. Rep. 2018, 7, 70–84. [Google Scholar] [CrossRef] [PubMed]
- Wei, D.H.; Mao, Q.Q. Vitamin B6, vitamin B12 and methionine and risk of pancreatic cancer: A meta-analysis. Nutr. J. 2020, 19, 111. [Google Scholar] [CrossRef] [PubMed]
- Pak, K.J.; Chan, S.L.; Mattson, M.P. Homocysteine and folate deficiency sensitize oligodendrocytes to the cell death-promoting effects of a presenilin-1 mutation and amyloid beta-peptide. Neuromol. Med. 2003, 3, 119–128. [Google Scholar] [CrossRef]
- Kruman, I.I.; Kumaravel, T.S.; Lohani, A.; Pedersen, W.A.; Cutler, R.G.; Kruman, Y.; Haughey, N.; Lee, J.; Evans, M.; Mattson, M.P. Folic Acid Deficiency and Homocysteine Impair DNA Repair in Hippocampal Neurons and Sensitize Them to Amyloid Toxicity in Experimental Models of Alzheimer’s Disease. J. Neurosci. 2002, 22, 1752–1762. [Google Scholar] [CrossRef]
- Lee, C.C.; Hsu, S.W.; Huang, C.W.; Chang, W.N.; Chen, S.F.; Wu, M.K.; Chang, C.C.; Hwang, L.C.; Chen, P.C. Effects of Homocysteine on white matter diffusion parameters in Alzheimer’s disease. BMC Neurol. 2017, 17, 192. [Google Scholar] [CrossRef]
- Kim, J.H.; Kim, G.T.; Yoon, S.; Lee, H.I.; Ko, K.R.; Lee, S.C.; Kim, D.K.; Shin, J.; Lee, S.Y.; Lee, S. Low serum vitamin B12 levels are associated with degenerative rotator cuff tear. BMC Musculoskelet. Disord. 2021, 22, 364. [Google Scholar] [CrossRef]
- Singh, G.; Hamdan, H.; Singh, V. Clinical utility of serum folate measurement in tertiary care patients: Argument for revising reference range for serum folate from 3.0 ng/mL to 13.0 ng/mL. Pract. Lab. Med. 2015, 1, 35–41. [Google Scholar] [CrossRef]
- Moll, R.; Davis, B. Iron, vitamin B12 and folate. Medicine 2017, 45, 198–203. [Google Scholar] [CrossRef]
- Allouche, O.; Kalyuzhny, M.; Moreno-Rueda, G.; Pizarro, M.; Kadmon, R. Area-heterogeneity tradeoff and the diversity of ecological communities. Proc. Natl. Acad. Sci. USA 2012, 109, 17495–17500. [Google Scholar] [CrossRef] [PubMed]
- Ou, Z.; Pan, J.; Tang, S.; Duan, D.; Yu, D.; Nong, H.; Wang, Z. Global Trends in the Incidence, Prevalence, and Years Lived with Disability of Parkinson’s Disease in 204 Countries/Territories From 1990 to 2019. Front. Public Health 2021, 9, 776847. [Google Scholar] [CrossRef] [PubMed]
Disclaimer/Publisher’s Note: The statements, opinions and data contained in all publications are solely those of the individual author(s) and contributor(s) and not of MDPI and/or the editor(s). MDPI and/or the editor(s) disclaim responsibility for any injury to people or property resulting from any ideas, methods, instructions or products referred to in the content. |
© 2023 by the authors. Licensee MDPI, Basel, Switzerland. This article is an open access article distributed under the terms and conditions of the Creative Commons Attribution (CC BY) license (https://creativecommons.org/licenses/by/4.0/).