Associations of Social Jetlag with Dietary Behavior, Physical Activity and Obesity among Chinese Adolescents


 and
and 
Abstract
:1. Introduction
2. Methods
2.1. Ethics Statement
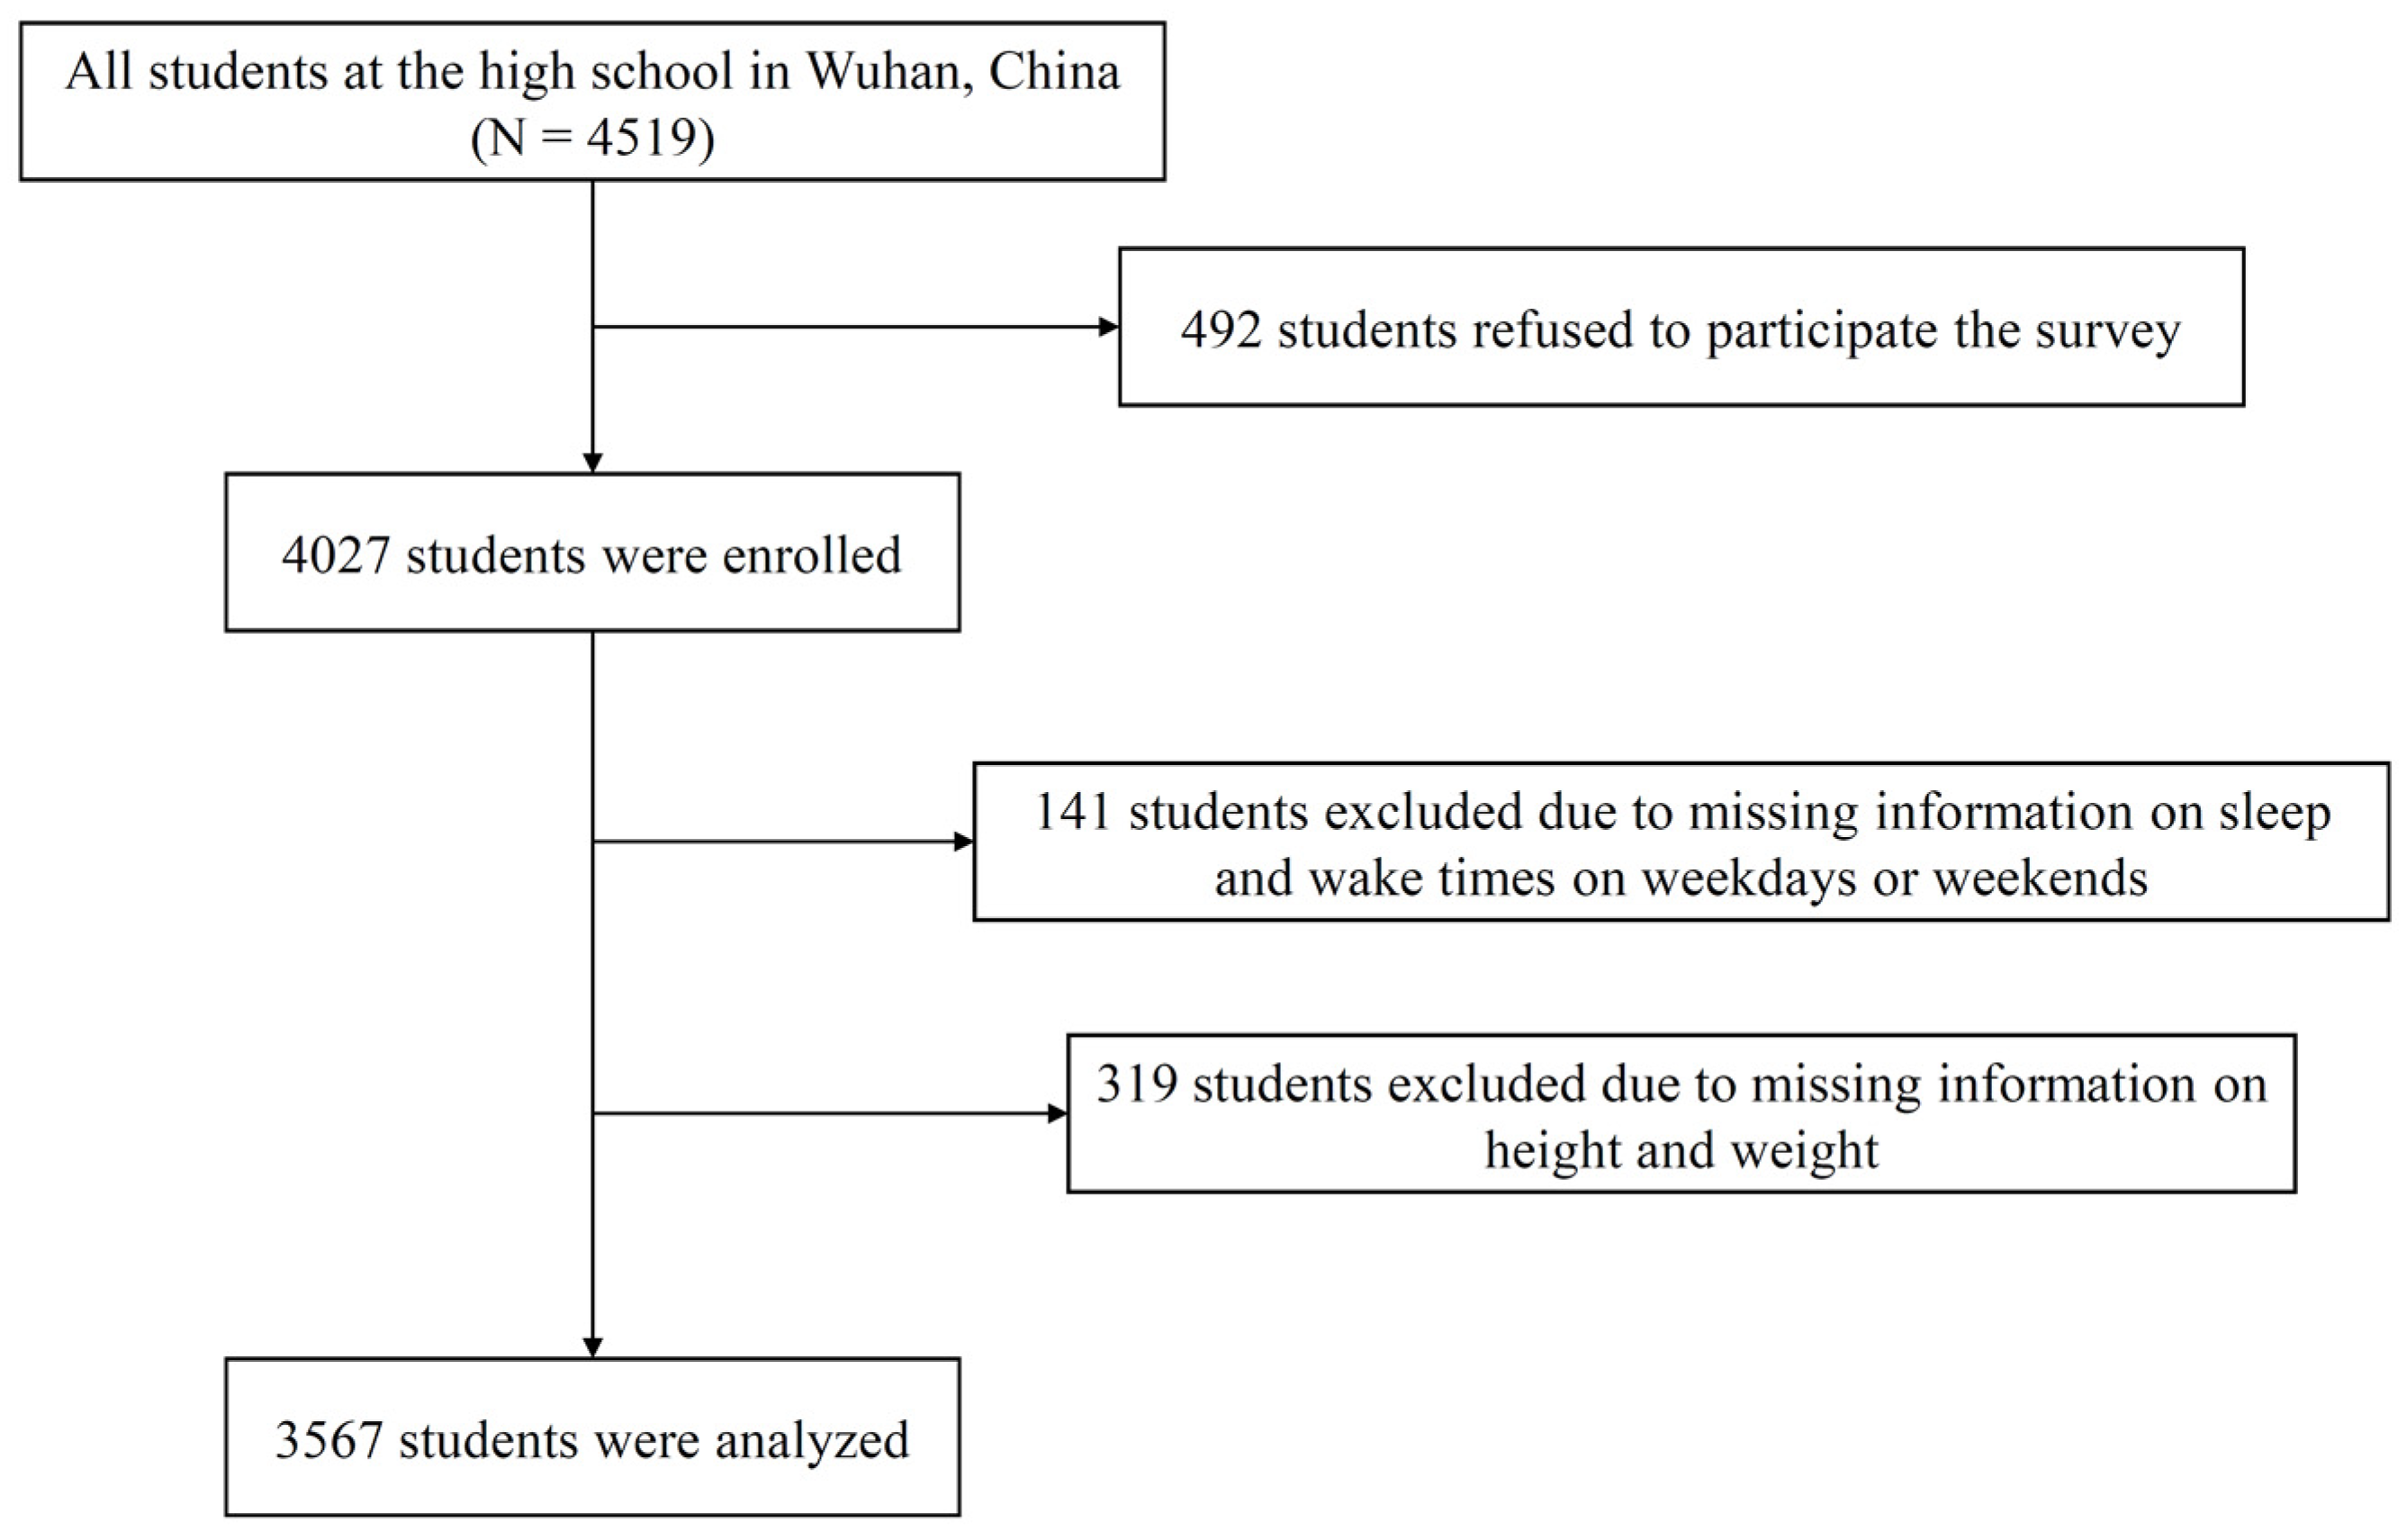
2.2. Participants
2.3. Measures
2.3.1. Social Jetlag
2.3.2. Frequency of Foods and Beverages Consumption
2.3.3. Physical Activity
2.3.4. Anthropometric Measurements
2.3.5. Covariates
2.4. Statistical Analysis
3. Results
4. Discussion
5. Conclusions
Supplementary Materials
Author Contributions
Funding
Institutional Review Board Statement
Informed Consent Statement
Data Availability Statement
Acknowledgments
Conflicts of Interest
References
- Ezzati, M.; Bentham, J.; Di Cesare, M.; Bilano, V.; Bixby, H.; Zhou, B.; Stevens, G.A.; Riley, L.M.; Taddei, C.; Hajifathalian, K.; et al. Worldwide trends in body-mass index, underweight, overweight, and obesity from 1975 to 2016: A pooled analysis of 2416 population-based measurement studies in 128.9 million children, adolescents, and adults. Lancet 2017, 390, 2627–2642. [Google Scholar] [CrossRef] [Green Version]
- Templin, T.; Hashiguchi, T.C.O.; Thomson, B.; Dieleman, J.; Bendavid, E. The overweight and obesity transition from the wealthy to the poor in low- and middle-income countries: A survey of household data from 103 countries. PLoS Med. 2019, 16, e1002968. [Google Scholar] [CrossRef] [PubMed] [Green Version]
- Ng, M.; Fleming, T.; Robinson, M.; Thomson, B.; Graetz, N.; Margono, C.; Mullany, E.C.; Biryukov, S.; Abbafati, C.; Abera, S.F.; et al. Global, regional, and national prevalence of overweight and obesity in children and adults during 1980–2013: A systematic analysis for the Global Burden of Disease Study 2013. Lancet 2014, 384, 766–781. [Google Scholar] [CrossRef] [Green Version]
- Ma, G. Report on Childhood Obesity; People’s Medical Publishing House Co., Ltd.: Beijing, China, 2017. (In Chinese) [Google Scholar]
- World Health Organization. Global Health Risks: Mortality and Burden of Disease Attributable to Selected Major Risks; WHO: Geneva, Switzerland, 2009. [Google Scholar]
- Institue for Health Metrics and Evaluation (IHME). Findings from the Global Burden of Disease Study 2017; IHME: Seattle, WA, USA, 2018. [Google Scholar]
- Wittmann, M.; Dinich, J.; Merrow, M.; Roenneberg, T. Social jetlag: Misalignment of biological and social time. Chronobiol. Int. 2006, 23, 497–509. [Google Scholar] [CrossRef]
- Roenneberg, T.; Kuehnle, T.; Juda, M.; Kantermann, T.; Allebrandt, K.; Gordijn, M.; Merrow, M. Epidemiology of the human circadian clock. Sleep Med. Rev. 2007, 11, 429–438. [Google Scholar] [CrossRef] [Green Version]
- Roenneberg, T.; Kuehnle, T.; Pramstaller, P.P.; Ricken, J.; Havel, M.; Guth, A.; Merrow, M. A marker for the end of adolescence. Curr. Biol. 2004, 14, R1038–R1039. [Google Scholar] [CrossRef] [Green Version]
- Wheaton, A.G.; Ferro, G.A.; Croft, J.B. School Start Times for Middle School and High School Students—United States, 2011–2012 School Year. Morb. Mortal. Wkly. Rep. 2015, 64, 809–813. [Google Scholar] [CrossRef] [PubMed] [Green Version]
- Uslu, E.; Ozsaban, A.; Cagan, O. Social Jetlag in adolescents: From a nursing perspective. J. Child. Adolesc. Psychiatry Nurs. 2021, 34, 276–282. [Google Scholar] [CrossRef] [PubMed]
- Feliciano, E.M.C.; Rifas-Shiman, S.L.; Quante, M.; Redline, S.; Oken, E.; Taveras, E.M. Chronotype, Social Jet Lag, and Cardiometabolic Risk Factors in Early Adolescence. JAMA Pediatr. 2019, 173, 1049–1057. [Google Scholar] [CrossRef]
- Cetiner, O.; Yildirim, G.; Kalyoncu, Z.B. Social Jetlag Is Associated with the Frequency of Consumption of Sugar-Sweetened Beverages and a High BMI Percentile in Adolescents: Results of the Cross-Sectional Family Life, Activity, Sun, Health, and Eating (FLASHE) Study. J. Acad. Nutr. Diet. 2021, 121, 1721–1731.e1. [Google Scholar] [CrossRef]
- Roenneberg, T.; Allebrandt, K.V.; Merrow, M.; Vetter, C. Social Jetlag and Obesity. Curr. Biol. 2012, 22, 939–943. [Google Scholar] [CrossRef] [PubMed] [Green Version]
- Malone, S.K.; Zemel, B.; Compher, C.; Souders, M.; Chittams, J.; Thompson, A.L.; Lipman, T.H. Characteristics Associated with Sleep Duration, Chronotype, and Social Jet Lag in Adolescents. J. Sch. Nurs. 2016, 32, 120–131. [Google Scholar] [CrossRef] [PubMed]
- Malone, S.K.; Zemel, B.; Compher, C.; Souders, M.; Chittams, J.; Thompson, A.L.; Pack, A.; Lipman, T.H. Social jet lag, chronotype and body mass index in 14–17-year-old adolescents. Chronobiol. Int. 2016, 33, 1255–1266. [Google Scholar] [CrossRef] [PubMed]
- De Zwart, B.J.; Beulens, J.W.J.; Elders, P.; Rutters, F. Pilot data on the association between social jetlag and obesity-related characteristics in Dutch adolescents over one year. Sleep Med. 2018, 47, 32–35. [Google Scholar] [CrossRef] [PubMed]
- Mathew, G.M.; Hale, L.; Chang, A.M. Social jetlag, eating behaviours and BMI among adolescents in the USA. Br. J. Nutr. 2020, 124, 979–987. [Google Scholar] [CrossRef]
- Johnson, D.A.; Reid, M.; Vu, T.H.T.; Gallo, L.C.; Daviglus, M.L.; Isasi, C.R.; Redline, S.; Carnethon, M. Associations of sleep duration and social jetlag with cardiometabolic risk factors in the study of Latino youth. Sleep Health 2020, 6, 563–569. [Google Scholar] [CrossRef]
- Zhang, Z.X.; Cajochen, C.; Khatami, R. Social Jetlag and Chronotypes in the Chinese Population: Analysis of Data Recorded by Wearable Devices. J. Med. Internet Res. 2019, 21, 14. [Google Scholar] [CrossRef]
- Islam, Z.; Hu, H.H.; Akter, S.; Kuwahara, K.; Kochi, T.; Eguchi, M.; Kurotani, K.; Nanri, A.; Kabe, I.; Mizoue, T. Social jetlag is associated with an increased likelihood of having depressive symptoms among the Japanese working population: The Furukawa Nutrition and Health Study. Sleep 2020, 43, 7. [Google Scholar] [CrossRef]
- Nebeling, L.C.; Hennessy, E.; Oh, A.Y.; Dwyer, L.A.; Patrick, H.; Blanck, H.M.; Perna, F.M.; Ferrer, R.A.; Yaroch, A.L. The FLASHE Study: Survey Development, Dyadic Perspectives, and Participant Characteristics. Am. J. Prev. Med. 2017, 52, 839–848. [Google Scholar] [CrossRef]
- Smith, T.M.; Calloway, E.E.; Pinard, C.A.; Hennessy, E.; Oh, A.Y.; Nebeling, L.C.; Yaroch, A.L. Using Secondary 24-Hour Dietary Recall Data to Estimate Daily Dietary Factor Intake From the FLASHE Study Dietary Screener. Am. J. Prev. Med. 2017, 52, 856–862. [Google Scholar] [CrossRef]
- Thompson, F.E.; Midthune, D.; Kahle, L.; Dodd, K.W. Development and Evaluation of the National Cancer Institute’s Dietary Screener Questionnaire Scoring Algorithms. J. Nutr. 2017, 147, 1226–1233. [Google Scholar] [CrossRef] [PubMed] [Green Version]
- Fu, J.L.; Liang, F.; Wang, Y.C.; Qiu, N.; Ding, K.; Zeng, J.; Moore, J.B.; Li, R. Modeling Parental Influence on Food Consumption among Chinese Adolescents through Self-Efficacy: A Path Analysis. Nutrients 2021, 13, 4454. [Google Scholar] [CrossRef] [PubMed]
- Qiu, N.; Moore, J.B.; Wang, Y.C.; Fu, J.L.; Ding, K.; Li, R. Perceived Parental Attitudes Are Indirectly Associated with Consumption of Junk Foods and Sugar-Sweetened Beverages among Chinese Adolescents through Home Food Environment and Autonomous Motivation: A Path Analysis. Nutrients 2021, 13, 3403. [Google Scholar] [CrossRef] [PubMed]
- 2014 Family Life, Activity, Sun, Health and Eating (FLASHE) Survey Data. National Cancer Institute. 2017. Available online: http://cancercontrol.cancer.gov/brp/hbrb/flashe.html (accessed on 29 November 2021).
- Saint-Maurice, P.F.; Welk, G.J. Validity and Calibration of the Youth Activity Profile. PLoS ONE 2015, 10, e0143949. [Google Scholar] [CrossRef] [PubMed] [Green Version]
- Saint-Maurice, P.F.; Kim, Y.; Hibbing, P.; Oh, A.Y.; Perna, F.M.; Welk, G.J. Calibration and Validation of the Youth Activity Profile: The FLASHE Study. Am. J. Prev. Med. 2017, 52, 880–887. [Google Scholar] [CrossRef]
- World Health Organization; Multicentre Growth Reference Study Group. WHO Child. Growth Standards: Length/Height-for-Age, Weight-for-Age, Weight-for-Length, Weight-for-Height and Body Mass Index-for-Age: Methods and Development; WHO: Geneva, Switzerland, 2006. [Google Scholar]
- Ji, C.Y. Report on childhood obesity in China (1)—Body mass index reference for screening overweight and obesity in Chinese school-age children. Biomed. Environ. Sci. 2005, 18, 390–400. [Google Scholar]
- Lee, D.H.; Keum, N.; Hu, F.B.; Orav, E.J.; Rimm, E.B.; Willett, W.C.; Giovannucci, E.L. Predicted lean body mass, fat mass, and all cause and cause specific mortality in men: Prospective US cohort study. BMJ 2018, 362, 10. [Google Scholar] [CrossRef] [Green Version]
- Spiegel, K.; Tasali, E.; Penev, P.; Van Cauter, E. Brief communication: Sleep curtailment in healthy young men is associated with decreased leptin levels, elevated ghrelin levels, and increased hunger and appetite. Ann. Intern. Med. 2004, 141, 846–850. [Google Scholar] [CrossRef]
- Nedeltcheva, A.V.; Kilkus, J.M.; Imperial, J.; Kasza, K.; Schoeller, D.A.; Penev, P.D. Sleep curtailment is accompanied by increased intake of calories from snacks. Am. J. Clin. Nutr. 2009, 89, 126–133. [Google Scholar] [CrossRef]
- Miller, A.L.; Miller, S.E.; LeBourgeois, M.K.; Sturza, J.; Rosenblum, K.L.; Lumeng, J.C. Sleep duration and quality are associated with eating behavior in low-income toddlers. Appetite 2019, 135, 100–107. [Google Scholar] [CrossRef]
- Chaput, J.P. Sleep patterns, diet quality and energy balance. Physiol. Behav. 2014, 134, 86–91. [Google Scholar] [CrossRef] [PubMed]
- Rutters, F.; Lemmens, S.G.; Adam, T.C.; Bremmer, M.A.; Elders, P.J.; Nijpels, G.; Dekker, J.M. Is Social Jetlag Associated with an Adverse Endocrine, Behavioral, and Cardiovascular Risk Profile? J. Biol. Rhythms 2014, 29, 377–383. [Google Scholar] [CrossRef] [PubMed]
- Rooney, L.; McKee, D. Contribution of Physical Education and Recess towards the overall Physical Activity of 8–11 year old children. J. Sport Health Res. 2018, 10, 303–316. [Google Scholar]
- Scheer, F.; Hilton, M.F.; Mantzoros, C.S.; Shea, S.A. Adverse metabolic and cardiovascular consequences of circadian misalignment. Proc. Natl. Acad. Sci. USA 2009, 106, 4453–4458. [Google Scholar] [CrossRef] [Green Version]
- Zhao, S.G.; Zhu, Y.; Schultz, R.D.; Li, N.; He, Z.Y.; Zhang, Z.Z.; Caron, A.; Zhu, Q.Z.; Sun, K.; Xiong, W.; et al. Partial Leptin Reduction as an Insulin Sensitization and Weight Loss Strategy. Cell Metab. 2019, 30, 706–719. [Google Scholar] [CrossRef]
- Qian, J.Y.; Dalla Man, C.; Morris, C.J.; Cobelli, C.; Scheer, F. Differential effects of the circadian system and circadian misalignment on insulin sensitivity and insulin secretion in humans. Diabetes Obes. Metab. 2018, 20, 2481–2485. [Google Scholar] [CrossRef]
- Marcinkevage, J.A.; Alverson, C.J.; Narayan, K.M.V.; Kahn, H.S.; Ruben, J.; Correa, A. Race/Ethnicity Disparities in Dysglycemia among US Women of Childbearing Age Found Mainly in the Nonoverweight/Nonobese. Diabetes Care 2013, 36, 3033–3039. [Google Scholar] [CrossRef] [Green Version]
- Catalano, P.M.; Huston, L.; Amini, S.B.; Kalhan, S.C. Longitudinal changes in glucose metabolism during pregnancy in obese women with normal glucose tolerance and gestational diabetes mellitus. Am. J. Obstet. Gynecol. 1999, 180, 903–914. [Google Scholar] [CrossRef]
- Sivan, E.; Chen, X.H.; Homko, C.J.; Reece, E.A.; Boden, G. Longitudinal study of carbohydrate metabolism in healthy obese pregnant women. Diabetes Care 1997, 20, 1470–1475. [Google Scholar] [CrossRef]


| Characteristic 1 | Social Jetlag | Total (N = 3567) | ||
|---|---|---|---|---|
| No (<1 h) (N = 1618) | Mild (1–2 h) (N = 1340) | Severe (>2 h) (N = 609) | ||
| Age, years | 14.65 (1.69) | 14.65 (1.76) | 14.73 (1.74) | 14.67 (1.72) |
| Gender 2 | ||||
| Male | 881 (54.45%) | 669 (49.93%) | 292 (47.95%) | 1842 (51.64%) |
| Female | 721 (44.56%) | 661 (49.33%) | 309 (50.74%) | 1691 (47.41%) |
| Missing | 16 (0.99%) | 10 (0.74%) | 8 (1.31%) | 34 (0.95%) |
| Monthly household income, RMB 2 | ||||
| ≤5000 | 211 (13.04%) | 181 (13.51%) | 75 (12.32%) | 467 (13.09%) |
| 5000–10,000 | 758 (46.85%) | 622 (46.42%) | 262 (43.02%) | 1642 (46.03%) |
| 10,000–20,000 | 389 (24.04%) | 326 (24.33%) | 151 (24.79%) | 866 (24.28%) |
| 2000–40,000 | 88 (5.44%) | 80 (5.97%) | 43 (7.06%) | 211 (5.92%) |
| ≥40,000 | 46 (2.84%) | 31 (2.31%) | 34 (5.58%) | 111 (3.11%) |
| Missing | 126 (7.79%) | 100 (7.46%) | 44 (7.22%) | 270 (7.57%) |
| Overweight or obesity 2 | 290 (17.92%) | 226 (16.87%) | 133 (21.84%) | 649 (18.20%) |
| Total sleep time, h | 9.03 (3.45) | 9.84 (3.90) | 10.05 (3.82) | 9.51 (3.72) |
| Social jetlag, h | 0.47 (0.29) | 1.41 (0.31) | 2.83 (0.78) | 1.23 (0.94) |
| Food and Beverage Groups | No SJL (<1 h) | Mild SJL (1–2 h) | Severe SJL (>2 h) | p Value | |||
|---|---|---|---|---|---|---|---|
| Median (IQR) | Mean Rank | Median (IQR) | Mean Rank | Median (IQR) | Mean Rank | ||
| Junk foods 1 | 1.13 (1.00) | 1720.00 | 1.13 (1.00) | 1764.01 | 1.42 (1.29) | 1998.01 | <0.001 |
| SSBs 2 | 1.00 (0.58) | 1688.21 | 1.00 (0.58) | 1777.95 | 1.42 (1.00) | 2051.80 | <0.001 |
| Fast foods 3 | 1.00 (0.87) | 1726.62 | 1.13 (0.87) | 1764.43 | 1.16 (1.00) | 1979.51 | <0.001 |
| Fruits and vegetables 4 | 2.87 (2.42) | 1832.45 | 2.71 (2.58) | 1772.02 | 2.71 (2.58) | 1681.64 | 0.008 |
| All detrimental foods 5 | 3.03 (2.87) | 1695.27 | 3.16 (3.13) | 1765.09 | 4.00 (4.00) | 2061.35 | <0.001 |
| All beneficial foods 6 | 4.58 (3.00) | 1843.32 | 4.45 (3.13) | 1768.47 | 4.16 (3.42) | 1660.57 | 0.001 |
| MVPA Per Week (min) | No SJL (<1 h) | Mild SJL (1–2 h) | Severe SJL (>2 h) | p Value |
|---|---|---|---|---|
| Total weekly | 817.03 (169.36) | 807.83 (181.23) | 788.33 (203.39) | 0.004 |
| School-time | 338.62 (80.90) | 337.80 (85.65) | 328.80 (92.43) | 0.059 |
| Weekday out-of-school | 307.12 (66.81) | 302.61 (71.36) | 294.89 (80.19) | 0.001 |
| Weekend | 171.31 (39.09) | 167.78 (42.61) | 164.65 (46.95) | 0.002 |
| Variable | No SJL (<1 h) | Mild SJL (1–2 h) | Severe SJL (>2 h) | p Value | |||
|---|---|---|---|---|---|---|---|
| Median (IQR) | Mean Rank | Median (IQR) | Mean Rank | Median (IQR) | Mean Rank | ||
| BMI | 19.71 (4.19) | 1587.71 | 19.49 (4.15) | 1563.21 | 20.02 (4.89) | 1710.58 | 0.007 |
| BMI Z score | 0 (1.38) | 1779.53 | 0 (1.52) | 1797.47 | 0 (1.49) | 1757.46 | 0.719 |
| Unadjusted Model | Adjusted Model 1 a | Adjusted Model 2 b | ||||
|---|---|---|---|---|---|---|
| OR (95% CI) | p Value | OR (95% CI) | p Value | OR (95% CI) | p Value | |
| No SJL (<1 h) | 1.00 (ref.) | 1.00 (ref.) | 1.00 (ref.) | |||
| Mild SJL (1–2 h) | 0.92 (0.75–1.13) | 0.431 | 0.96 (0.78–1.18) | 0.680 | 0.97 (0.79–1.20) | 0.787 |
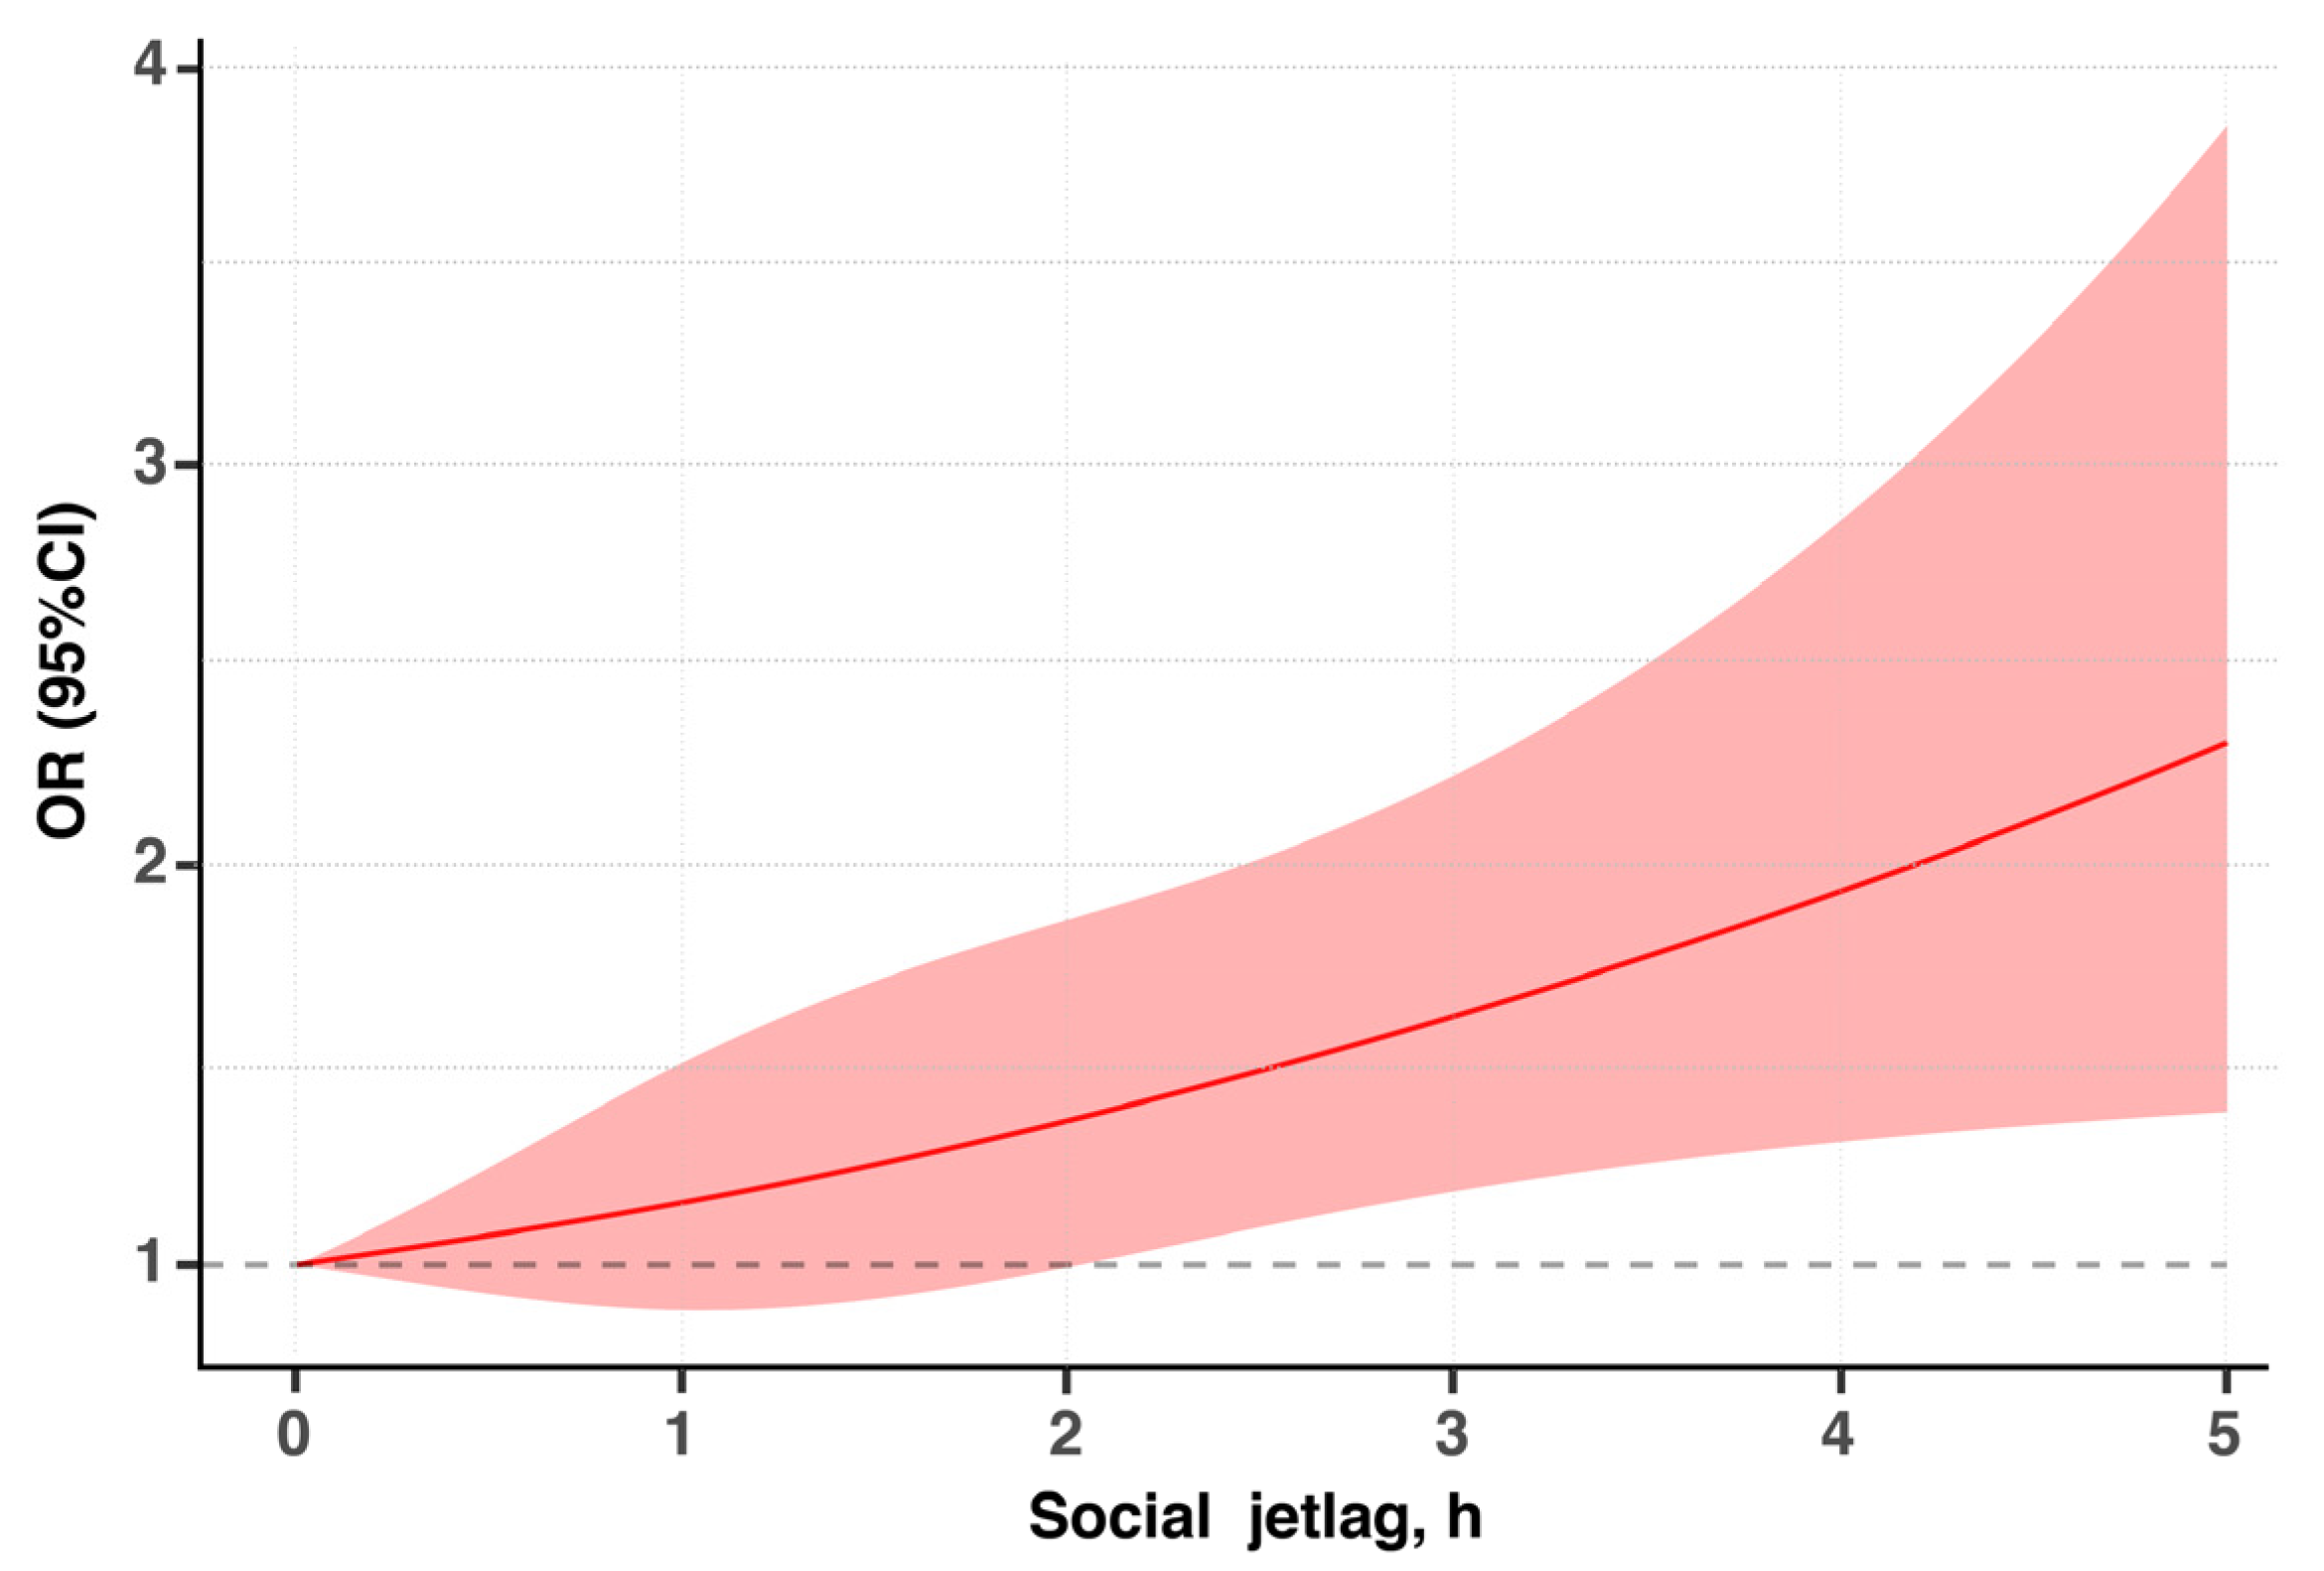
| Severe SJL (>2 h) | 1.32 (1.04–1.70) | 0.025 | 1.41 (1.10–1.81) | 0.007 | 1.47 (1.14–1.91) | 0.004 |
Publisher’s Note: MDPI stays neutral with regard to jurisdictional claims in published maps and institutional affiliations. |
© 2022 by the authors. Licensee MDPI, Basel, Switzerland. This article is an open access article distributed under the terms and conditions of the Creative Commons Attribution (CC BY) license (https://creativecommons.org/licenses/by/4.0/).
Share and Cite
Liang, F.; Fu, J.; Xu, Y.; Wang, Y.; Qiu, N.; Ding, K.; Zeng, J.; Moore, J.B.; Li, R. Associations of Social Jetlag with Dietary Behavior, Physical Activity and Obesity among Chinese Adolescents. Nutrients 2022, 14, 510. https://doi.org/10.3390/nu14030510
Liang F, Fu J, Xu Y, Wang Y, Qiu N, Ding K, Zeng J, Moore JB, Li R. Associations of Social Jetlag with Dietary Behavior, Physical Activity and Obesity among Chinese Adolescents. Nutrients. 2022; 14(3):510. https://doi.org/10.3390/nu14030510
Chicago/Turabian StyleLiang, Fang, Jialin Fu, Yijia Xu, Yechuang Wang, Nan Qiu, Kai Ding, Jing Zeng, Justin B. Moore, and Rui Li. 2022. "Associations of Social Jetlag with Dietary Behavior, Physical Activity and Obesity among Chinese Adolescents" Nutrients 14, no. 3: 510. https://doi.org/10.3390/nu14030510
APA StyleLiang, F., Fu, J., Xu, Y., Wang, Y., Qiu, N., Ding, K., Zeng, J., Moore, J. B., & Li, R. (2022). Associations of Social Jetlag with Dietary Behavior, Physical Activity and Obesity among Chinese Adolescents. Nutrients, 14(3), 510. https://doi.org/10.3390/nu14030510