
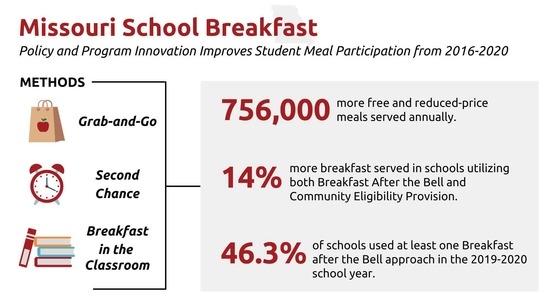
Increased School Breakfast Participation from Policy and Program Innovation: The Community Eligibility Provision and Breakfast after the Bell


Abstract
:
1. Introduction
2. Materials and Methods
2.1. Data and Measures
2.2. Analysis and Estimation Models
3. Results
4. Discussion
5. Conclusions
Author Contributions
Funding
Data Availability Statement
Acknowledgments
Conflicts of Interest
References
- Coleman-Jensen, A.; Rabbitt, M.P.; Gregory, C.A.; Singh, A. Household Food Security in the United States in 2020. 2021. Available online: https://www.ers.usda.gov/publications/pub-details/?pubid=102075 (accessed on 1 October 2021).
- Gundersen, C.; Ziliak, J.P. Food Insecurity and Health Outcomes. Health Aff. 2015, 34, 1830–1839. [Google Scholar] [CrossRef] [PubMed] [Green Version]
- Jyoti, D.F.; Frongillo, E.A.; Jones, S.J.; Al, J.E.T. Food Insecurity Affects School Children’s Academic Performance, Weight Gain, and Social Skills. J. Nutr. 2005, 135, 2831–2839. [Google Scholar] [CrossRef] [PubMed]
- Ashiabi, G. Household Food Insecurity and Children’s School Engagement. J. Child. Poverty 2007, 11, 3–17. [Google Scholar] [CrossRef]
- Bhattacharya, J.; Currie, J.; Haider, S. Poverty, Food Insecurity, and Nutritional Outcomes in Children and Adults. J. Health Econ. 2004, 23, 839–862. [Google Scholar] [CrossRef] [Green Version]
- Drennen, C.R.; Coleman, S.M.; De Cuba, S.E.; Frank, D.A.; Chilton, M.; Cook, J.T.; Cutts, D.B.; Heeren, T.; Casey, P.H.; Black, M.M. Food Insecurity, Health, and Development in Children under Age Four Years. Pediatrics 2019, 144, e20190824. [Google Scholar] [CrossRef] [Green Version]
- Bartfeld, J.S.; Ahn, H.M. The School Breakfast Program Strengthens Household Food Security among Low-Income Households with Elementary School Children. J. Nutr. 2011, 141, 470–475. [Google Scholar] [CrossRef] [Green Version]
- Huang, J.; Barnidge, E. Low-Income Children’s Participation in the National School Lunch Program and Household Food Insufficiency. Soc. Sci. Med. 2016, 150, 8–14. [Google Scholar] [CrossRef] [Green Version]
- Davis, W.; Musaddiq, T. Estimating the Effects of Universal Free School Meal Enrollment on Child Health: Evidence from the Community Eligibility Provision in Georgia Schools. SSRN Electron. J. 2019. [Google Scholar] [CrossRef]
- Cohen, J.F.W.; Hecht, A.A.; Mcloughlin, G.M.; Turner, L.; Schwartz, M.B.; Varela-Moreiras, G. Universal School Meals and Associations with Student Participation, Attendance, Academic Performance, Diet Quality, Food Security, and Body Mass Index: A Systematic Review. Nutrients 2021, 13, 911. [Google Scholar] [CrossRef]
- Gordon, N.; Ruffini, K. Schoolwide Free Meals and Student Discipline: Effects of the Community Eligibility Provision. Educ. Financ. Policy 2021, 16, 418–442. [Google Scholar] [CrossRef]
- Gordanier, J.; Ozturk, O.; Williams, B.; Zhan, C. Free Lunch for All! The Effect of the Community Eligibility Provision on Academic Outcomes. Econ. Educ. Rev. 2020, 77, 101999. [Google Scholar] [CrossRef]
- Clark, M.A.; Fox, M.K. Nutritional Quality of the Diets of US Public School Children and the Role of the School Meal Programs. J. Am. Diet. Assoc. 2009, 109, S44–S56. [Google Scholar] [CrossRef] [PubMed]
- Caruso, M.L.; Cullen, K.W. Quality and Cost of Student Lunches Brought from Home. JAMA Pediatr. 2015, 169. [Google Scholar] [CrossRef] [PubMed] [Green Version]
- Farris, A.R.; Misyak, S.; Duffey, K.J.; Davis, G.C.; Hosig, K.; Atzaba-Poria, N.; McFerren, M.M.; Serrano, E.L. Nutritional Comparison of Packed and School Lunches in Pre-Kindergarten and Kindergarten Children Following the Implementation of the 2012–2013 National School Lunch Program Standards. J. Nutr. Educ. Behav. 2014, 46, 621–626. [Google Scholar] [CrossRef]
- Cullen, K.W.; Chen, T.A. The Contribution of the USDA School Breakfast and Lunch Program Meals to Student Daily Dietary Intake. Prev. Med. Rep. 2017, 5, 82–85. [Google Scholar] [CrossRef] [PubMed]
- Briefel, R.R.; Crepinsek, M.K.; Cabili, C.; Wilson, A.; Gleason, P.M. School Food Environments and Practices Affect Dietary Behaviors of US Public School Children. J. Am. Diet. Assoc. 2009, 109, S91–S107. [Google Scholar] [CrossRef]
- Wechsler, H.; Devereaux, R.S.; Davis, M.; Collins, J. Using the School Environment to Promote Physical Activity and Healthy Eating. Prev. Med. 2000, 31, S121–S137. [Google Scholar] [CrossRef] [Green Version]
- Crepinsek, M.K.; Singh, A.; Bernstein, L.S.; McLaughlin, J.E. Dietary Effects of Universal-Free School Breakfast: Findings from the Evaluation of the School Breakfast Program Pilot Project. J. Am. Diet. Assoc. 2006, 106, 1796–1803. [Google Scholar] [CrossRef]
- Seligman, H.K.; Schillinger, D. Hunger and Socioeconomic Disparities in Chronic Disease. N. Engl. J. Med. 2010, 363, 6–9. [Google Scholar] [CrossRef]
- Hayes, C.; FitzSimons, C. School Breakfast Scorecard, 2019–2020 School Year. 2021. Available online: https://frac.org/wp-content/uploads/FRAC_BreakfastScorecard_2021.pdfLINK (accessed on 15 November 2021).
- USDA Economic Research Service. Child Nutrition Programs. Available online: https://www.ers.usda.gov/topics/food-nutrition-assistance/child-nutrition-programs/ (accessed on 14 January 2022).
- Forrestal, S.; Potamites, E.; Guthrie, J.; Paxton, N. Associations among Food Security, School Meal Participation, and Students’ Diet Quality in the First School Nutrition and Meal Cost Study. Nutrients 2021, 13, 307. [Google Scholar] [CrossRef]
- Poppendieck, J. Free for All: Fixing School Food in America; University of California Press: Berkeley, CA, USA, 2010. [Google Scholar] [CrossRef]
- Mirtcheva, D.M.; Powell, L.M. Participation in the National School Lunch Program: Importance of School-Level and Neighborhood Contextual Factors. J. Sch. Health 2009, 79, 485–494. [Google Scholar] [CrossRef] [PubMed]
- Fleischhacker, S.; Campbell, E. Ensuring Equitable Access to School Meals. J. Acad. Nutr. Diet. 2020, 120, 893–897. [Google Scholar] [CrossRef] [PubMed]
- Reddan, J.; Wahlstrom, K.; Reicks, M. Children’s Perceived Benefits and Barriers in Relation to Eating Breakfast in Schools with or without Universal School Breakfast. J. Nutr. Educ. Behav. 2002, 34, 47–52. [Google Scholar] [CrossRef]
- Hearst, M.O.; Shanafelt, A.; Wang, Q.; Leduc, R.; Nanney, M.S. Barriers, Benefits, and Behaviors Related to Breakfast Consumption Among Rural Adolescents. J. Sch. Health 2016, 86, 187–194. [Google Scholar] [CrossRef] [Green Version]
- Dykstra, H.; Davey, A.; Fisher, J.O.; Polonsky, H.; Sherman, S.; Abel, M.L.; Dale, L.C.; Foster, G.D.; Bauer, K.W. Breakfast-Skipping and Selecting Low-Nutritional-Quality Foods for Breakfast Are Common among Low-Income Urban Children, Regardless of Food Security Status. J. Nutr. 2016, 146, 630–636. [Google Scholar] [CrossRef] [Green Version]
- Mcdonnell, E.; Probart, C.; Weirich, J.E.; Hartman, T.; Birkenshaw, P. School Breakfast Programs: Perceptions and Barriers. J. Child Nutr. Manag. 2004, 2, 57–66. Available online: https://schoolnutrition.org/uploadedFiles/5_News_-and_Publications/4_The_Journal_of_Child_Nutrition_and_Management/Fall_2004/4-mcdonnell.pdf (accessed on 14 January 2022).
- Moeltner, K.; Spears, K.; Yu, L. Breakfast at School: A First Look at the Role of Time and Location for Participation and Nutritional Intake. Am. J. Agric. Econ. 2019, 101, 39–57. [Google Scholar] [CrossRef]
- Centers for Disease Control and Prevention. Results from the School Health Policies and Practices Study 2016. Available online: https://www.cdc.gov/healthyyouth/data/shpps/pdf/shpps-results_2016.pdf (accessed on 4 October 2021).
- Cohen, J.F.W.; Hecht, A.A.; Hager, E.R.; Turner, L.; Burkholder, K.; Schwartz, M.B. Strategies to Improve School Meal Consumption: A Systematic Review. Nutrients 2021, 13, 3520. [Google Scholar] [CrossRef]
- Vaudrin, N.; Lloyd, K.; Yedidia, M.J.; Todd, M.; Ohri-Vachaspati, P. Impact of the 2010 US Healthy, Hunger-Free Kids Act on School Breakfast and Lunch Participation Rates Between 2008 and 2015. Am. J. Public Health 2017, 108, 84–86. [Google Scholar] [CrossRef]
- Gearan, E.C.; Fox, M.K. Updated Nutrition Standards Have Significantly Improved the Nutritional Quality of School Lunches and Breakfasts. J. Acad. Nutr. Diet. 2020, 120, 363–370. [Google Scholar] [CrossRef] [Green Version]
- Imberman, S.A.; Kugler, A.D. The Effect of Providing Breakfast in Class on Student Performance. J. Policy Anal. Manag. 2014, 33, 669–699. [Google Scholar] [CrossRef]
- Corcoran, S.P.; Elbel, B.; Schwartz, A.E. The Effect of Breakfast in the Classroom on Obesity and Academic Performance: Evidence from New York City. J. Policy Anal. Manag. 2016, 35, 509–532. [Google Scholar] [CrossRef] [Green Version]
- Grannon, K.Y.; Nanney, M.S.; Wang, Q.; Larson, N.; Hearst, M.O.; Berge, J.; Caspi, C.E. Do High School Students Participate in Second Chance Breakfast Programs? J. Sch. Health 2020, 90, 119–126. [Google Scholar] [CrossRef] [PubMed]
- Larson, N.; Wang, Q.; Grannon, K.; Wei, S.; Nanney, M.S.; Caspi, C.A. Low-Cost, Grab-and-Go Breakfast Intervention for Rural High School Students: Changes in School Breakfast Program Participation Among At-Risk Students in Minnesota. J. Nutr. Educ. Behav. 2018, 50, 125–132.e1. [Google Scholar] [CrossRef] [PubMed]
- Conklin, M.T.; Bordi, P.L.; Schaper, M.A. Grab “n” Go Breakfast Increases Participation in the School Breakfast Program. J. Child Nutr. Manag. 2004, 28. Available online: https://schoolnutrition.org/uploadedFiles/5_News_and_Publications/-4_The_Journal_of_Child_Nutrition_and_Management/Spring_2004/7-conklin.pdf (accessed on 14 January 2022).
- Cuadros-Meñaca, A.; Thomsen, M.R.; Nayga, R.M. The Effect of School Breakfast on Student Behavior: An Evaluation of Breakfast After the Bell. SSRN Electron. J. 2021. [Google Scholar] [CrossRef]
- Kirksey, J.J.; Gottfried, M.A. The Effect of Serving “Breakfast After-the-Bell” Meals on School Absenteeism: Comparing Results From Regression Discontinuity Designs. Educ. Eval. Policy Anal. 2021, 43, 305–328. [Google Scholar] [CrossRef]
- Meijering, E. A Chronology of Interpolation: From Ancient Astronomy to Modern Signal and Image Processing. Proc. IEEE 2002, 90, 319–342. [Google Scholar] [CrossRef] [Green Version]
- Dettmann, E. Flexpaneldid: A Stata Toolbox for Causal Analysis with Varying Treatment Time and Duration. SSRN Electron. J. 2020. [Google Scholar] [CrossRef]
- USDA Economic Research Service. Food Access Research Atlas Documentation. Available online: https://www.ers.usda.gov/data-products/food-access-research-atlas/documentation/#definitions (accessed on 1 September 2021).
- Hearst, M.O.; Shanafelt, A.; Wang, Q.; Leduc, R.; Nanney, M.S. Altering the School Breakfast Environment Reduces Barriers to School Breakfast Participation Among Diverse Rural Youth. J. Sch. Health 2018, 88, 3–8. [Google Scholar] [CrossRef] [Green Version]
- Koedel, C.; Parsons, E. The Effect of the Community Eligibility Provision on the Ability of Free and Reduced-Price Meal Data to Identify Disadvantaged Students. Educ. Eval. Policy Anal. 2021, 43, 3–31. [Google Scholar] [CrossRef]
- Soldavini, J.; Ammerman, A.S. Serving Breakfast Free to All Students and Type of Breakfast Serving Model Are Associated with Participation in the School Breakfast Program. J. Acad. Nutr. Diet. 2019, 119, 1142–1149. [Google Scholar] [CrossRef] [PubMed]
- Andreyeva, T.; Sun, X. Universal School Meals in the Us: What Can We Learn from the Community Eligibility Provision? Nutrients 2021, 13, 2634. [Google Scholar] [CrossRef] [PubMed]
- Gross, S.M.; Kelley, T.L.; Augustyn, M.; Wilson, M.J.; Bassarab, K.; Palmer, A. Household Food Security Status of Families with Children Attending Schools That Participate in the Community Eligibility Provision (CEP) and Those with Children Attending Schools That Are CEP-Eligible, but Not Participating. J. Hunger Environ. Nutr. 2021, 16, 281–296. [Google Scholar] [CrossRef]
- Capogrossi, K.; You, W. The Influence of School Nutrition Programs on the Weight of Low-Income Children: A Treatment Effect Analysis. Health Econ. 2017, 26, 980–1000. [Google Scholar] [CrossRef]


| Percent/Mean | |
|---|---|
| School Community Eligibility Provision (CEP) Participation (%) 1 | |
| 2016–2017 | 27.4% (42.3%) |
| 2017–2018 | 30.0% (51.9%) |
| 2018–2019 | 37.0% (56.8%) |
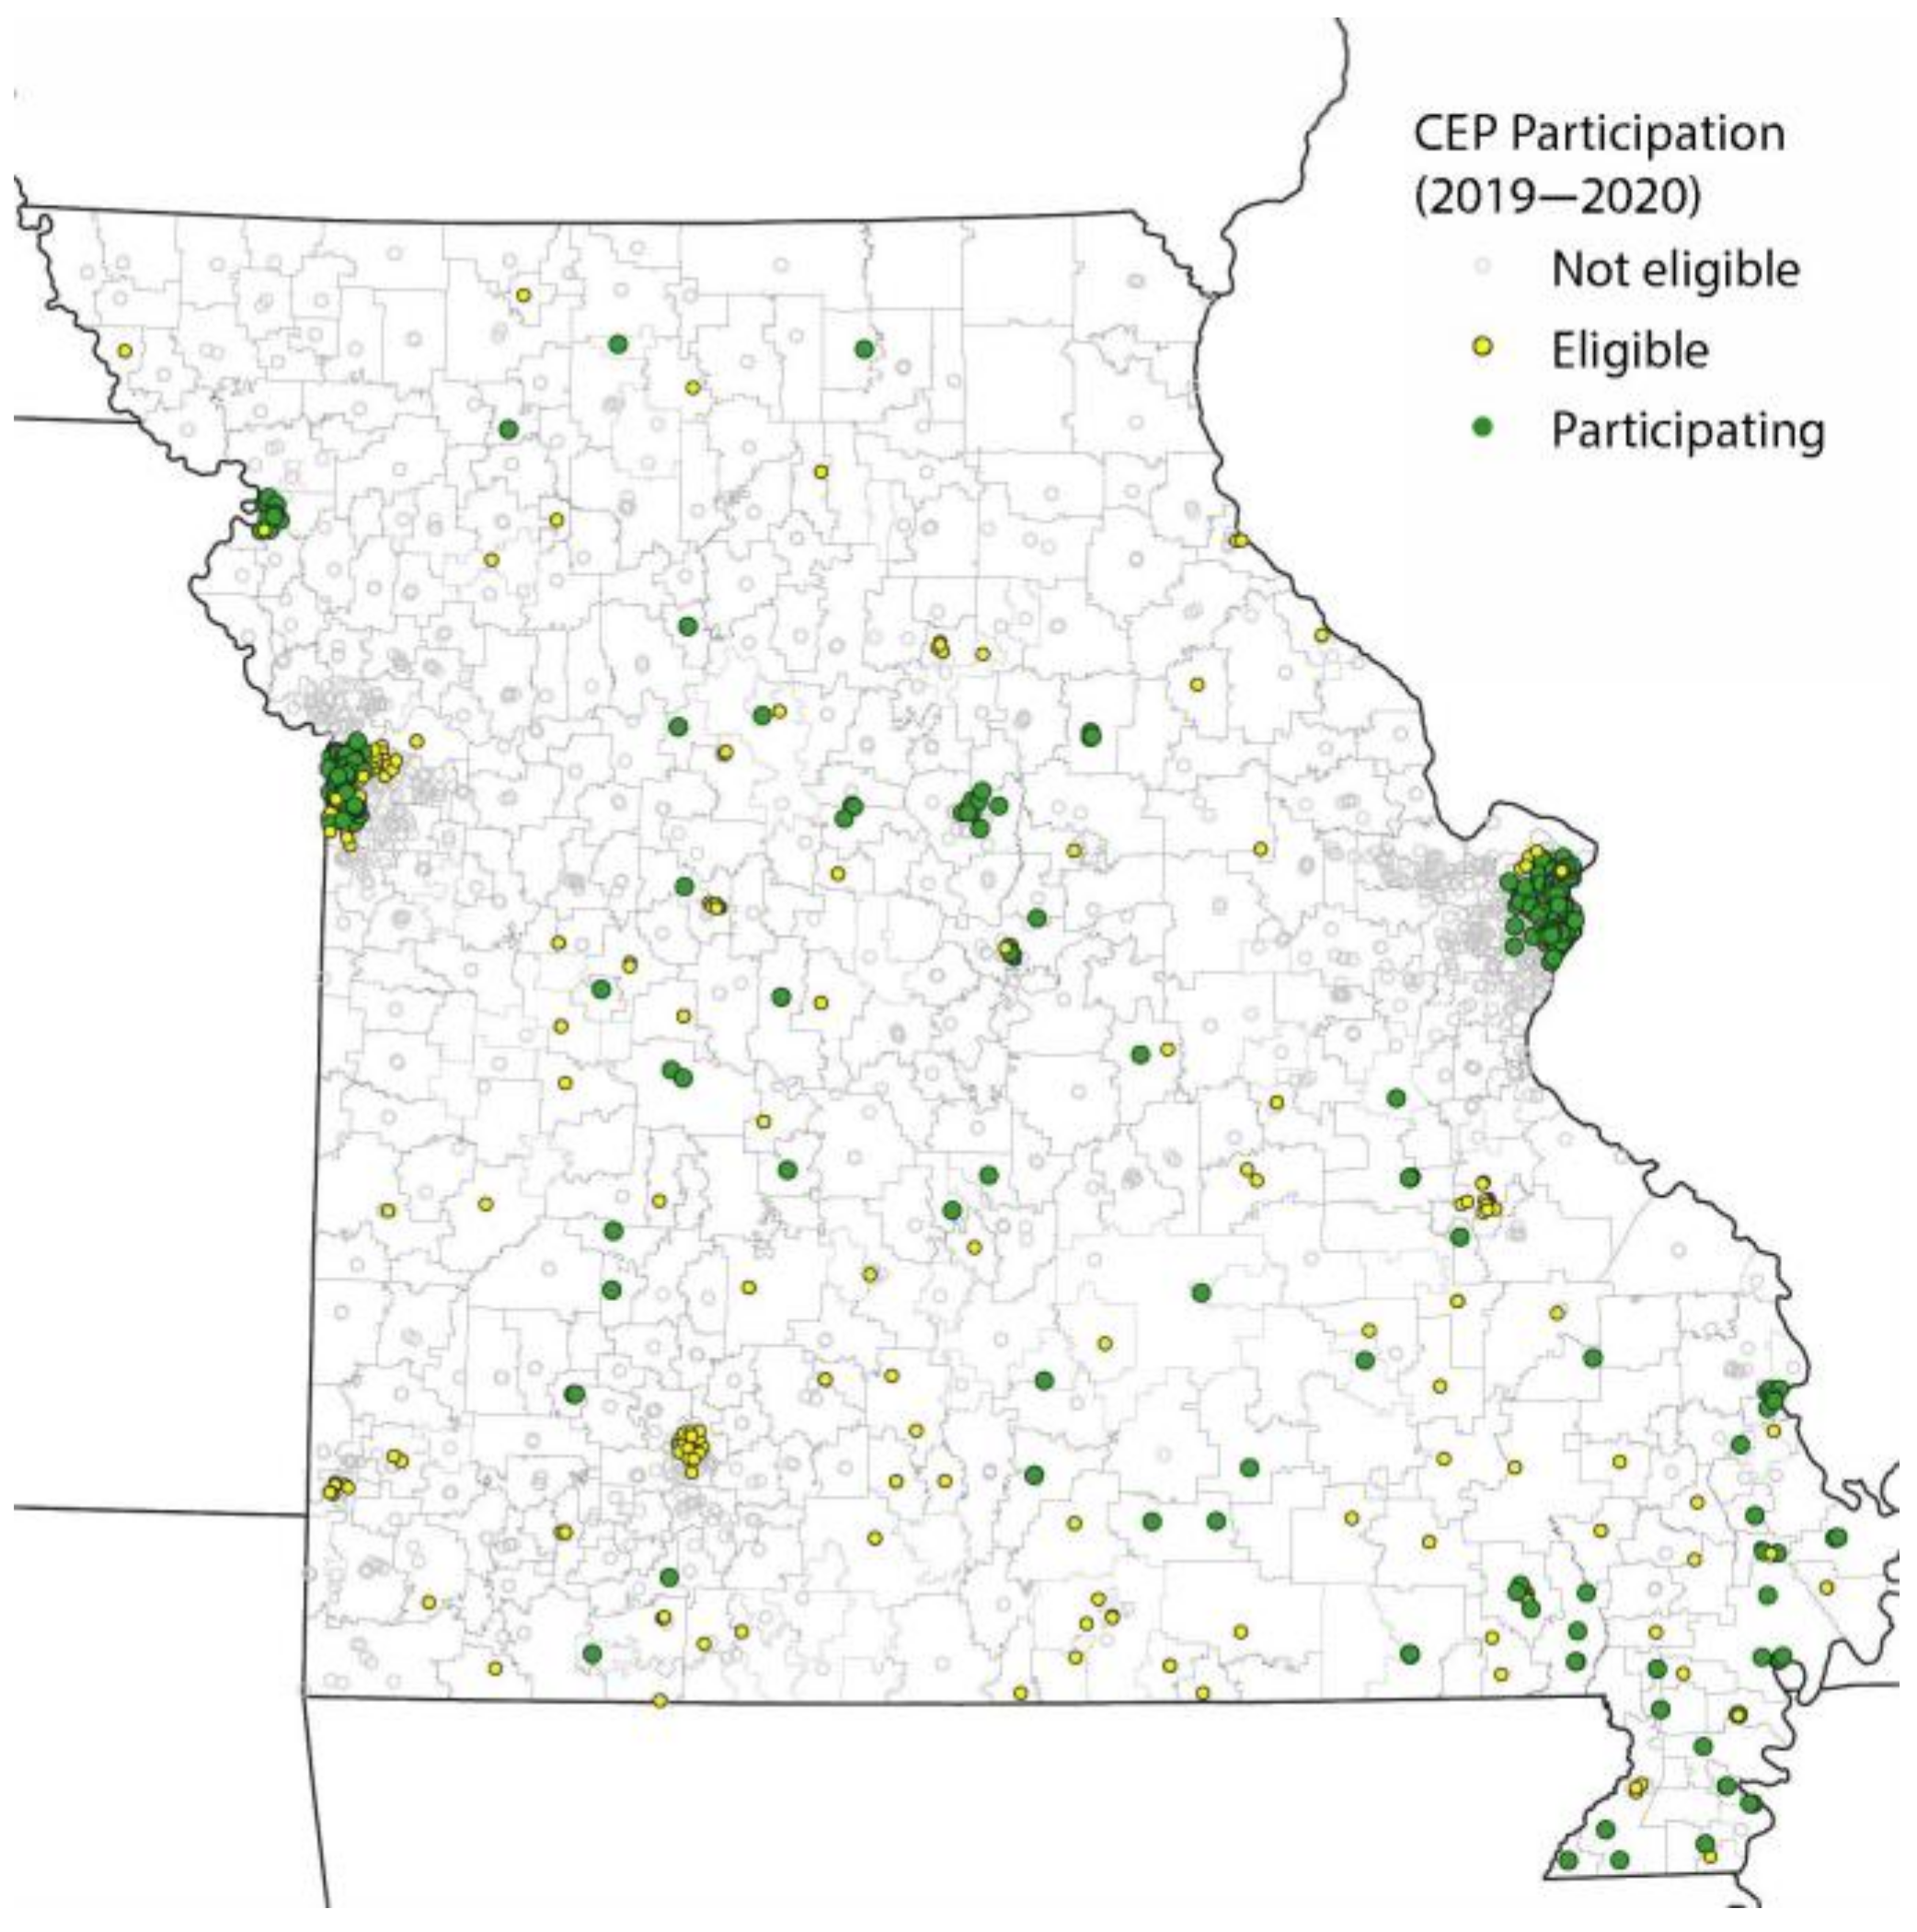
| 2019–2020 | 38.1% (60.4%) |
| School Breakfast after the Bell (BATB Utilization (%) | |
| 2016–2017 | |
| 2017–2018 | 36.3% |
| 2018–2019 | 44.4% |
| 2019–2020 | 46.3% |
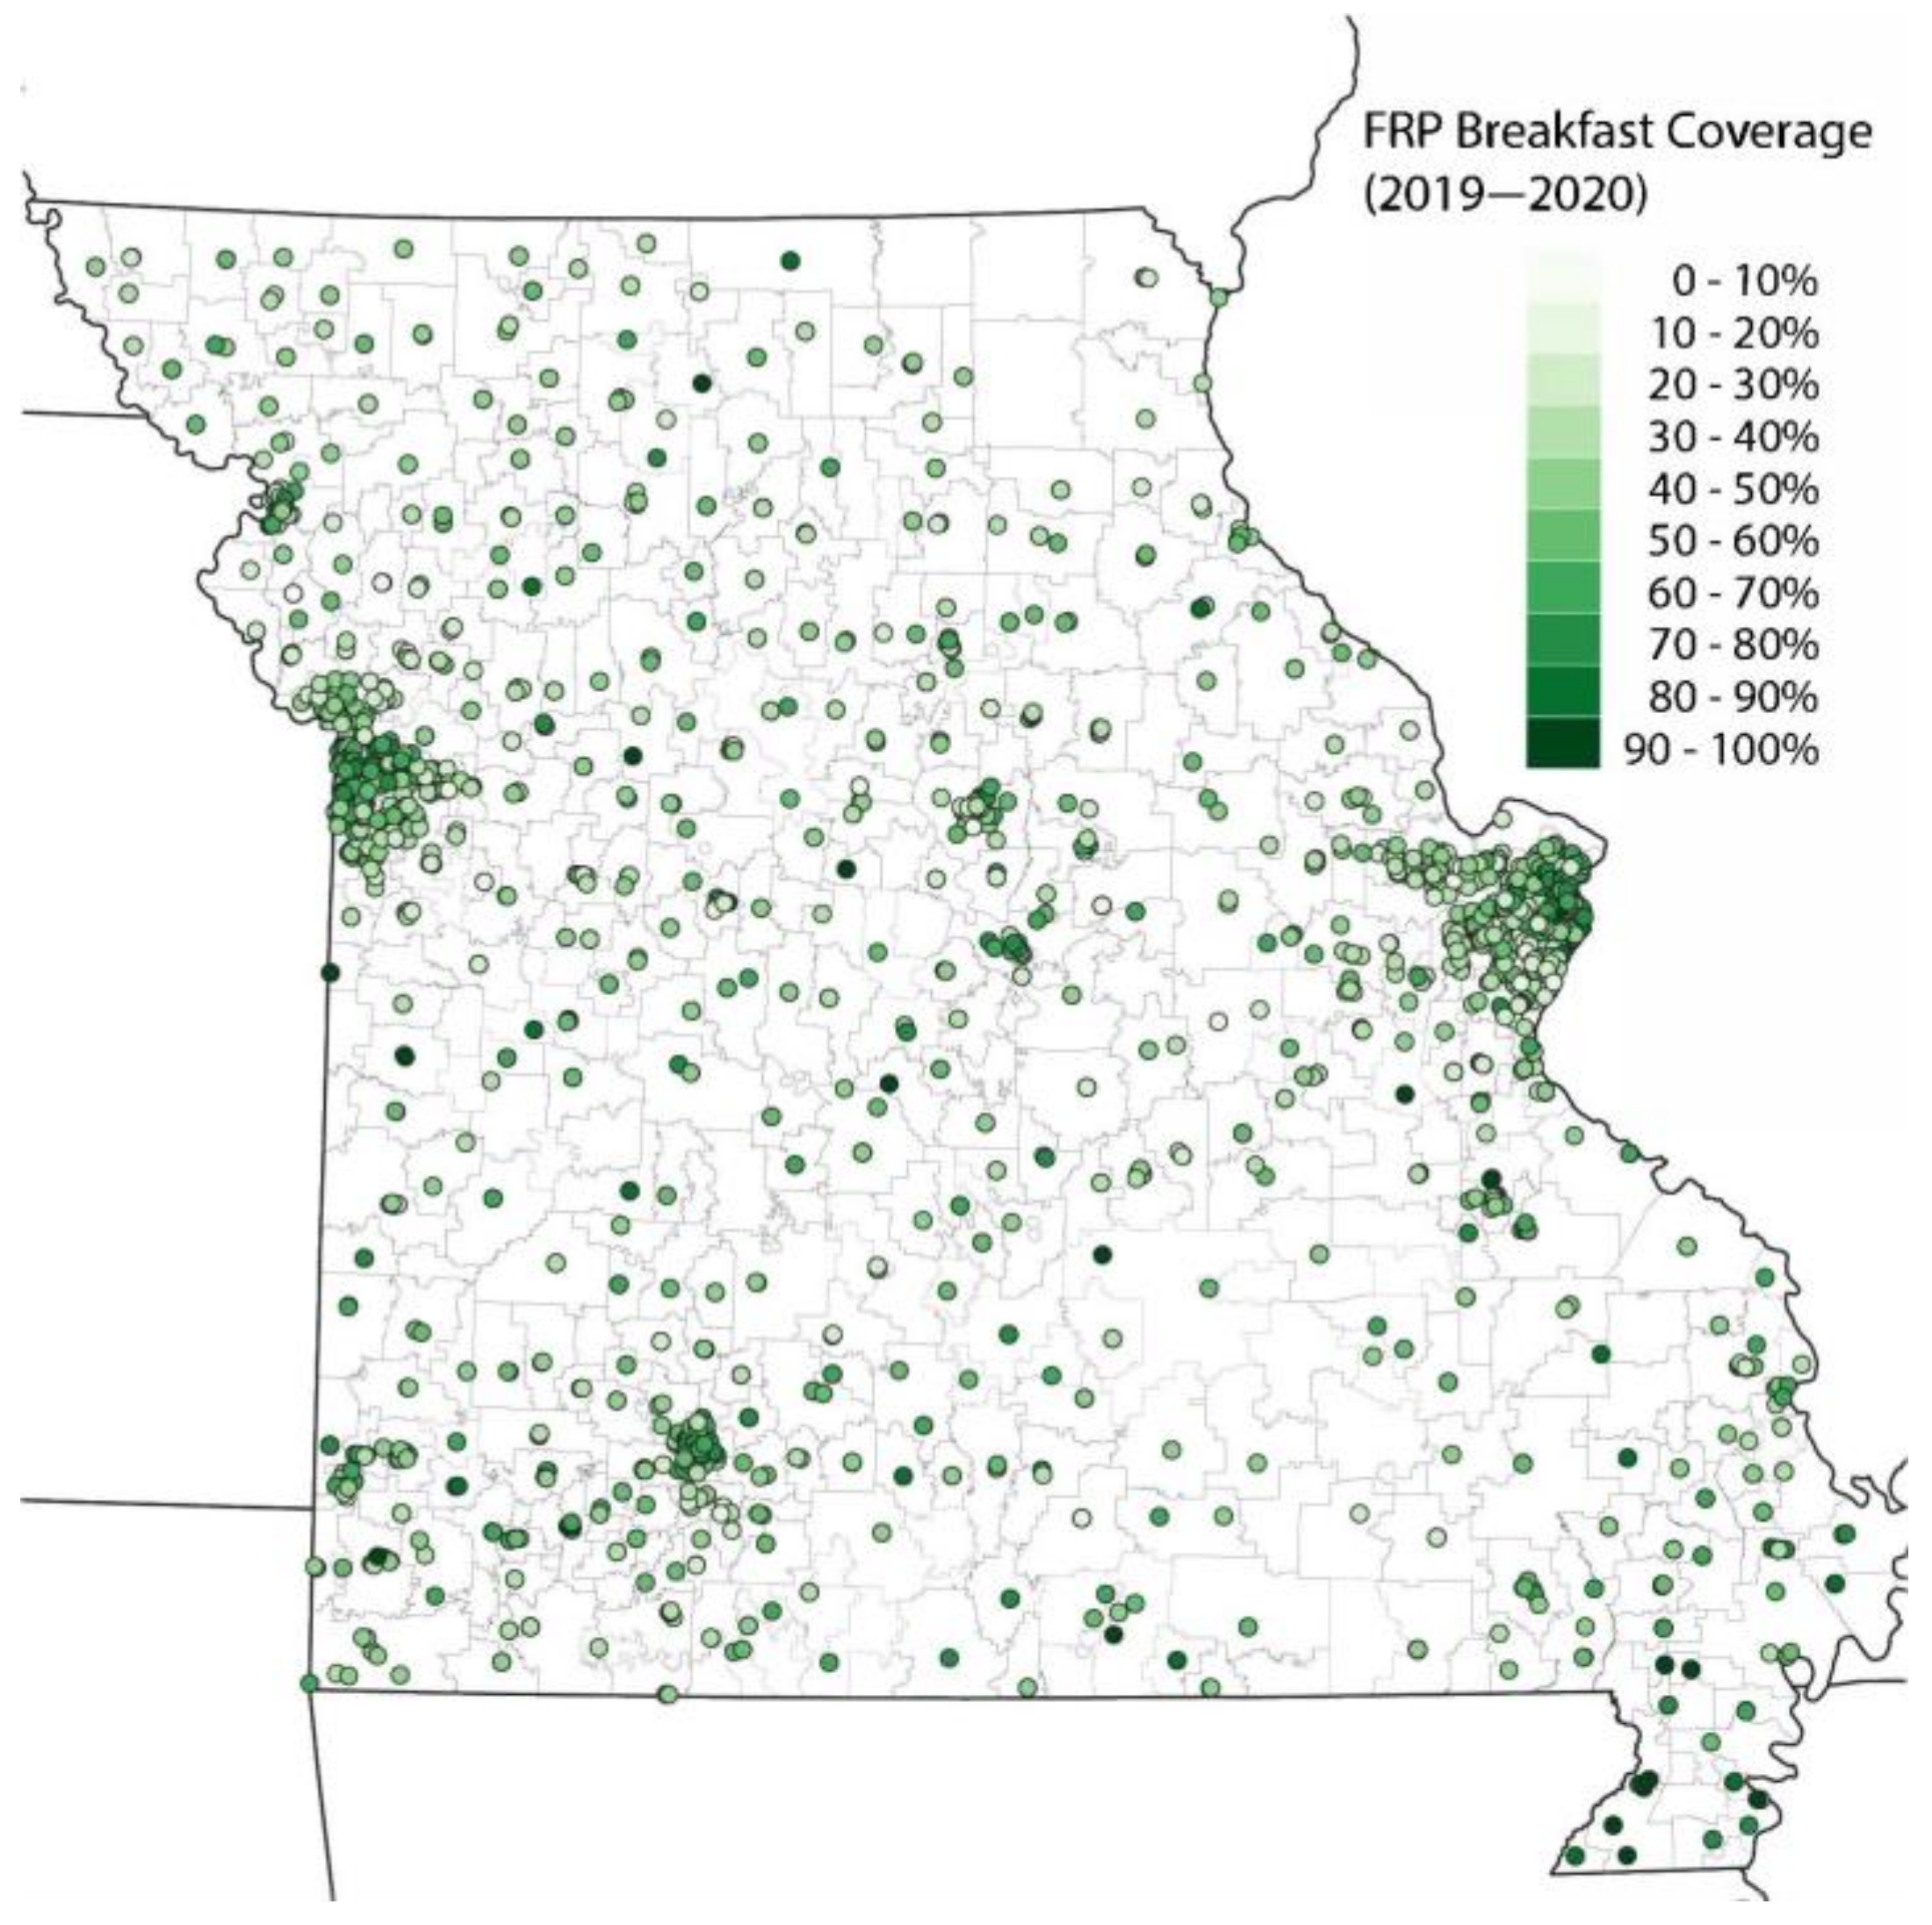
| Student Free and Reduced-Price (FRP) Breakfast Participation (% of eligible students) | |
| 2016–2017 | 48.8% |
| 2017–2018 | 49.0% |
| 2018–2019 | 49.4% |
| 2019–2020 | 51.1% |
| Control Variables | |
| Students (K to 12, # 2) | 413.5 |
| White, non-Hispanic (%) | 72.6% |
| Rural | 62.0% |
| Low access to food | 41.8% |
| School type | |
| Public | 96.1% |
| Public charter | 3.2% |
| Non-public | 0.7% |
| BATB | |
|---|---|
| Temporal Mean Difference | |
| Treatment | 0.008 |
| Controls | −0.006 |
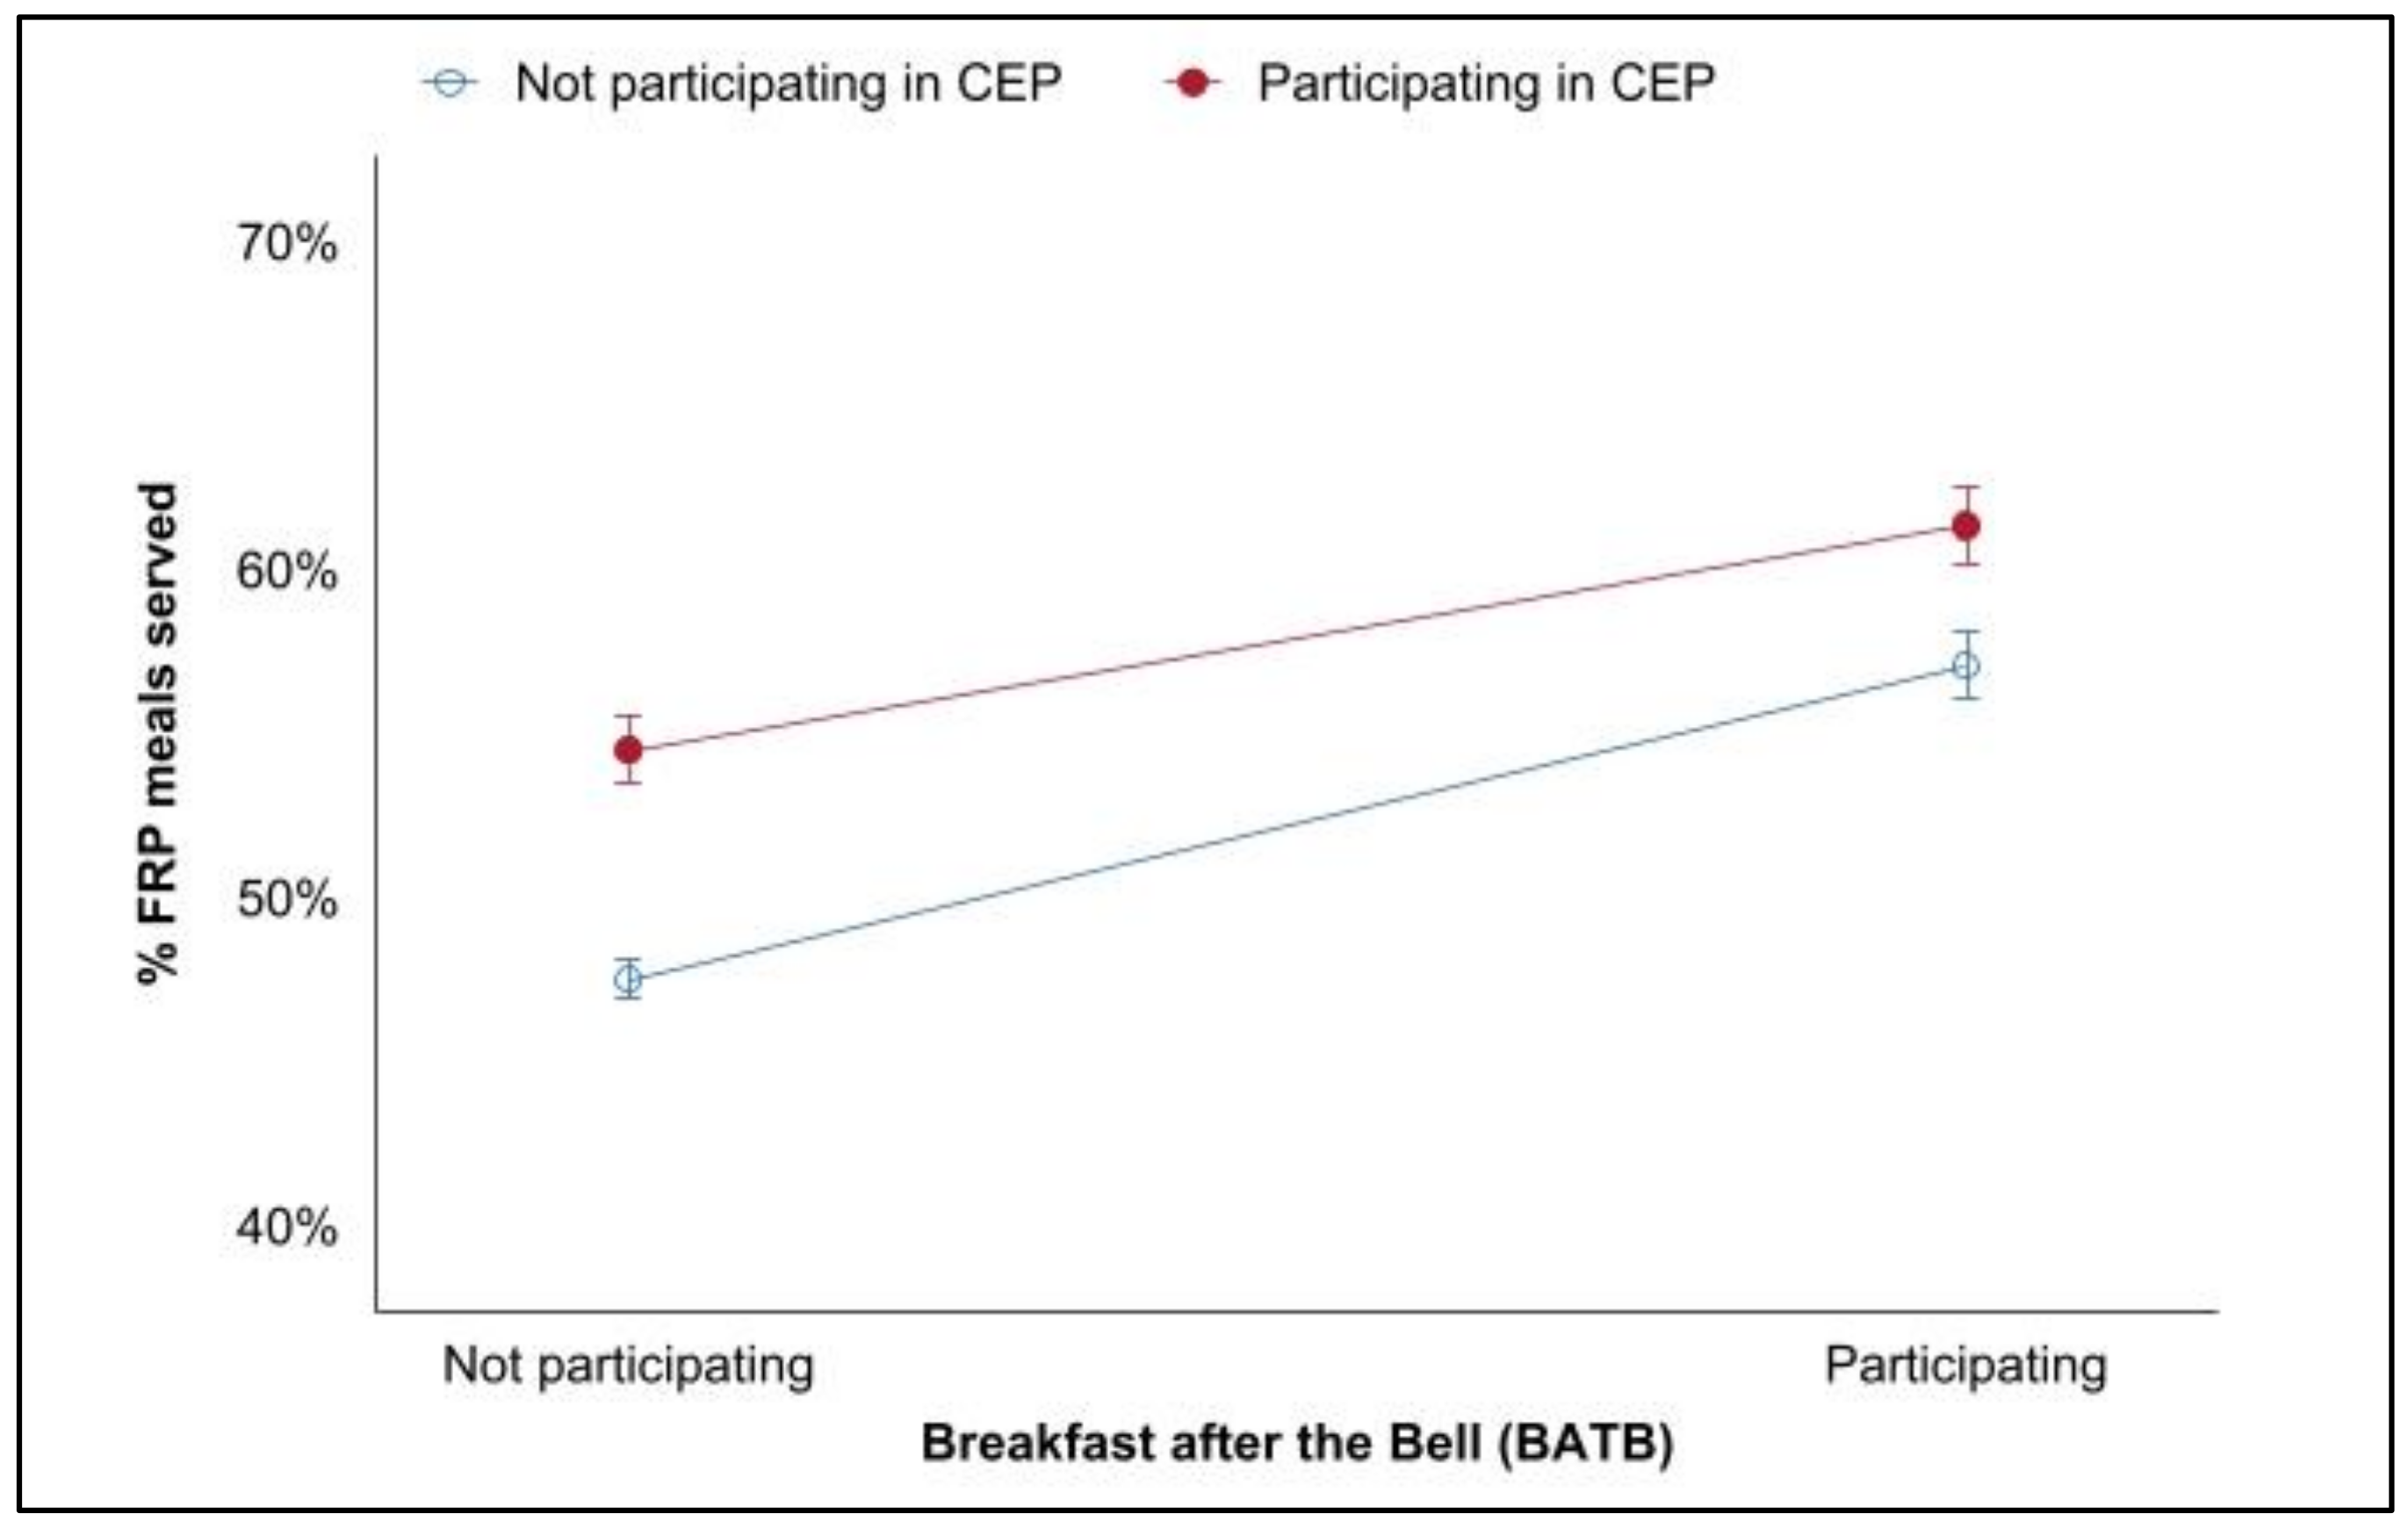
| Diff-in-Diff | 0.014 * (0.006) |
| Observations | |
| Treatment | 753 |
| Comparison | 373 |
| BATB | |
|---|---|
| Treated | - |
| Post | −0.035 *** (0.006) |
| Treated × Post | 0.015 ** (0.005) |
| School year | |
| 2017–2018 | −0.000 (0.002) |
| 2018–2019 | 0.029 *** (0.005) |
| 2019–2020 | 0.068 *** (0.002) |
| Cons. | 0.472 *** (0.002) |
| Observations | 4165 |
| sigma u | 0.159 |
| sigma e | 0.063 |
| rho | 0.866 |
Publisher’s Note: MDPI stays neutral with regard to jurisdictional claims in published maps and institutional affiliations. |
© 2022 by the authors. Licensee MDPI, Basel, Switzerland. This article is an open access article distributed under the terms and conditions of the Creative Commons Attribution (CC BY) license (https://creativecommons.org/licenses/by/4.0/).
Share and Cite
Ferris, D.; Jabbari, J.; Chun, Y.; Sándoval, J.S.O. Increased School Breakfast Participation from Policy and Program Innovation: The Community Eligibility Provision and Breakfast after the Bell. Nutrients 2022, 14, 511. https://doi.org/10.3390/nu14030511
Ferris D, Jabbari J, Chun Y, Sándoval JSO. Increased School Breakfast Participation from Policy and Program Innovation: The Community Eligibility Provision and Breakfast after the Bell. Nutrients. 2022; 14(3):511. https://doi.org/10.3390/nu14030511
Chicago/Turabian StyleFerris, Dan, Jason Jabbari, Yung Chun, and J.S. Onésimo Sándoval. 2022. "Increased School Breakfast Participation from Policy and Program Innovation: The Community Eligibility Provision and Breakfast after the Bell" Nutrients 14, no. 3: 511. https://doi.org/10.3390/nu14030511
APA StyleFerris, D., Jabbari, J., Chun, Y., & Sándoval, J. S. O. (2022). Increased School Breakfast Participation from Policy and Program Innovation: The Community Eligibility Provision and Breakfast after the Bell. Nutrients, 14(3), 511. https://doi.org/10.3390/nu14030511