Abstract
The change in physiological parameters and subjective feelings according to the speed of drinking alcohol has not been reported to date. The aim of this randomized crossover pilot study was to investigate the objective and subjective effects of different speeds of alcohol ingestion in healthy volunteers. Accordingly, 11 male and 7 female healthy Japanese adults were asked to consume 480 mL of beer at three different drinking speeds (80, 40, and 20 mL/5 min). According to the objective measurement, the transient increase in blood alcohol and serum uric acid concentrations was most inhibited at a drinking speed of 20 mL/5 min. Acetate, lactate, pyruvate, and lactate/pyruvate ratios did not differ between the three drinking speeds. Stimulant feelings measured by the subjective scores of the Brief Biphasic Alcohol Effects Scale did not differ between the three speeds. However, the sedative feeling score obtained at a drinking speed of 20 mL/5 min (the slowest speed of alcohol consumption) was significantly weakened in comparison with those obtained at drinking speeds of 40 and 80 mL/5 min. Therefore, a slower consumption of alcohol mitigated the subjective sedative feeling. The effects of slower alcohol consumption may be caused by the slower slope of the increasing trend of blood alcohol concentration.
1. Introduction
Alcohol consumption causes various physiological and pharmacological effects in the human body that can lead to many health problems [1,2,3]. Additionally, daily alcohol consumption affects subjective response [4,5,6]. A dose–effect relationship exists between these effects and blood alcohol concentration (BAC), as reflected by behavioral changes, reduced cognition, and impaired psychomotor performance [7]. Therefore, BAC regulation is important to attenuate the harmful effects of alcohol drinking on the body. BAC is influenced by the amount of alcohol consumed. In addition, some exogenous drinking conditions, such as the type of beverage (concentration of alcohol content) [8] and drinking with or without food [9,10,11], influence BAC, despite consuming the same amount of alcohol. The mechanisms involved are mainly related to the absorption process of alcohol. Drinking a more concentrated beverage, such as vodka/tonic, produces a higher peak BAC than drinking a less concentrated beverage, such as wine or beer, regardless of the total amount consumed [8]. Therefore, less concentrated alcohol is absorbed more slowly than more concentrated alcohol. Alcohol is also absorbed more slowly in individuals who have eaten than in those who have fasted, owing to the delay of the gastric emptying rate of alcohol [12]. Thus, BAC is lower in the fed state than in the fasting state after alcohol consumption [9,10,11]. Moreover, alcohol significantly impairs dual task performance, although the impairment is significantly reduced in individuals who had eaten before alcohol consumption [13].
Considering the acute harmful effects of alcohol, drinking slowly is recommended. Under conditions of slow drinking, alcohol is absorbed more slowly, possibly reducing the BAC [14]. However, the effects of slow alcohol consumption on BAC or physiological parameters remain unreported. Therefore, the aim of this this randomized, nonblind, crossover pilot study was to evaluate the effects of the speed of alcohol ingestion on physiological responses in healthy volunteers. Specifically, we sought to examine whether differences in the speed of consuming certain amounts of beer affect BAC, the biochemical indices affected by alcohol, and subjective stimulant or sedative feelings. Therefore, the results obtained in this study provide insights regarding slow drinking.
2. Materials and Methods
2.1. Volunteers
This clinical trial conformed to the principles of the Declaration of Helsinki, and the protocol was approved by the Suda Clinic Institutional Review Board (approval number: 2021-032). Volunteers were recruited from employees working at Asahi Group Research and Development Center (Ibaraki, Japan). Written informed consent was obtained from all participants. The inclusion criteria were as follows: healthy Japanese men and women aged 20–64 years and provision of written informed consent prior to participation. Conversely, volunteers who could not drink 480 mL of beer were excluded. Ultimately, 18 participants (men: n = 11, women: n = 7) were enrolled.
2.2. Study Design
In this study, we used a nonblind, single-center, randomized crossover design. The study registered with the University Hospital Medical Information Network (UMIN-CTR ID: UMIN000045190). The 18 participants were randomly allocated to groups 1, 2, and 3, with 6 participants per group. All experiments for three patterns of drinking speed (drinking in 30, 60, and 120 min) were conducted in all groups in a random order in the sequence summarized in Table 1, with more than 1 week of washout period in between. Throughout the three experiments, all participants were instructed to maintain daily eating and drinking habits. Figure 1 presents the time schedule of the experiments.

Table 1.
Study schedule showing the nonblind, single-center, randomized crossover pilot study design.
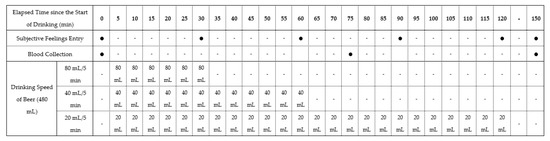
Figure 1.
Time schedule of the experiments. Participants drank 480 mL of beer at three different speeds (80, 40, and 20 mL/5 min).
A commercially available beer (5.0% alcohol content indicated on the product label), containing carbohydrates was used as the test beverage to avoid the induction of hypoglycemia [15] due to alcohol ingestion in a fasting state. Briefly, peripheral blood samples were collected from the cubital vein, and subjective drunkenness feeling was measured using the Brief Biphasic Alcohol Effects Scale (B-BAES) under a fasting state. Thereafter, the participants drank a total of 480 mL of beer at three different speeds (80, 40, and 20 mL/5 min), finishing drinking in 30, 60, and 120 min, respectively. Eating foods and drinking beverages other than the test beer were not allowed. However, participants were permitted to freely consume water after finishing drinking the beer. Blood samples were collected at 75 and 150 min, and B-BAES was recorded every 30 min.
2.3. Blood Analyses and Subjective Sensation Assessments
Following blood collection, we mixed 0.5 mL of blood samples with 0.5 N of perchloric acid (2.5 mL) and prepared supernatants by centrifugation. Subsequently, BAC was measured by headspace gas chromatography according to the procedures described by Okada and Mizoi [16]. We also measured blood acetate, lactate, and pyruvate concentrations by high-performance liquid chromatography (Shimadzu organic acid determination system; Shimadzu, Japan) with an ion-exclusion column and a conductivity detector [17]. Furthermore, serum levels of alanine aminotransferase, aspartic aminotransferase, gamma-glutamyl transferase, lactate dehydrogenase, creatine kinase, alkaline phosphatase, total bilirubin, triglyceride, uric acid, total protein, albumin, and glucose were measured by a Fuji Drychem 7000 system (Fujifilm Co., Tokyo, Japan).
Alcohol produces both stimulant and sedative sensations [18,19,20]. Martin et al. developed the BAES, which is a self-reporting measure of the impact of alcohol [12]. BAES is a reliable and valid 14-item measure of the acute stimulant and sedative effects of alcohol; however, its length may preclude its use in research paradigms with time constraints on assessment. Thus, in the present study, we used the six-item B-BAES [21,22]. The brief stimulation subscale of the B-BAES consists of energized, excited, and up, whereas the brief sedation subscale consists of sedated, slow thoughts, and sluggish. Each participant answered each item as a subjective sensation on a 10 cm visual analog scale. The distance (cm) from the left edge of the line to the mark placed by the participant was measured at each time point. This measurement was then used in subsequent analyses as the sensation score from 0 (not at all) to 10 (extremely) that best described their present feelings. To determine the stimulant or sedative score, we added the score of each of the three items of the stimulation or sedation subscale. The scores are expressed as the changing scores obtained from before drinking beer (0 min). In addition, we used the trapezoidal rule to calculate the area under the curves (AUC0–150) from 0 to 150 min of the score–time curves of subjective stimulant and sedative feelings.
2.4. Statistical Analysis
All statistical data were analyzed using BellCurve for Excel 3.20 (Social Survey Research Information, Tokyo, Japan). Temporal changes from 0 min to 150 min of each blood or serum concentration were analyzed for each variable using repeated-measures ANOVA. Differences among the three drinking speeds of the maximal changes in each blood or serum parameter and B-BAES scores, as well as the AUC0–150 of the scores, were analyzed using one-way ANOVA followed by Bonferroni post hoc test as paired analyses of parametric data; different letters in the figures indicate statistically significant differences. These data are presented as means ± standard deviation. Pearson’s simple linear regression analysis was used to evaluate the correlations of maximal blood alcohol concentration (BAC-max) with each maximal score of subjective feeling. A value of p < 0.05 was considered significant.
3. Results
All participants underwent three experiments for the three drinking speeds. Final analyses were conducted using data from 18 healthy participants aged 36.3 ± 9.9 years. Table 2 lists the characteristics of the participants, and Table 3 summarizes the temporal changes, the maximum amount of change from 0 min, and the AUC0–150 of each blood or serum parameter. All drinking speeds indicated a significant temporal change in all parameters. The maximal change in BAC at the drinking speed of 20 mL/5 min was significantly lower than that at 80 and 40 mL/5 min 75 min after the start of drinking (p < 0.001 and p < 0.001, respectively), although the BAC values 150 min after the start of drinking were similar among the three drinking speeds. The maximal changes in acetate, lactate, pyruvate, and lactate/pyruvate ratios were not significant among the three drinking speeds. The maximal changes in uric acid concentrations at a drinking speed of 20 mL/5 min were significantly lower than at drinking speeds of 40 and 80 mL/5 min (p < 0.001 and p = 0.015, respectively).
Table 2.
Characteristics of the healthy participants (n = 18).
Table 3.
Temporal changes and maximum amount of change from 0 min of each blood or serum parameter concentration in the crossover trial.
Figure 2 illustrates the temporal changes in scores, maximal scores, and the AUC0–150 of the stimulant and sedative feelings. The time that reached the maximal score differed between the three drinking speeds. The stimulant feelings increased until finishing drinking alcohol and decreased thereafter (Figure 2A); however, the maximal and AUC scores were did not significantly differ between the three drinking speeds (Figure 2C,E). Conversely, the scores of sedative feelings showed differences between the three speeds (Figure 2B). The maximal and AUC scores at a drinking speed of 20 mL/5 min were significantly lower than those at a drinking speed of 80 mL/5 min (Figure 2D,F), but those at a drinking speed of 40 mL/5 min did not significantly differ from those at 80 and 20 mL/5 min.

Figure 2.
(A) Temporal changes in the mean sum of the three scores of the stimulation subscale (Energized, Excited, and Up) are indicated as mean values. (B) Temporal changes in the mean sum of the three scores of the sedation subscale (Sedated, Slow thoughts, and Sluggish) are indicated as mean values. The scores of the subjective stimulant or sedative feelings reported by the volunteers after beer ingestion are expressed as means and standard deviation ((C) maximal scores of stimulant feelings, (D) maximal scores of sedative feelings, (E) AUC0–150 of temporal scores of stimulant feelings, (F) AUC0–150 of temporal scores of sedative feelings). Scores with different letters (a,b) are significantly different among the three drinking speeds at p < 0.05 according to the Bonferroni test.
Table 4 illustrates the relationship of maximal blood alcohol concentration (BAC-max) with each maximal score of subjective feeling. There was no relationship between BAC-max and each score of stimulant feelings (energized, excited, up, or stimulant). On the other hand, the scores of sedated, slow thoughts, and sedative had a significant positive relationship with BAC-max (p = 0.003, 0.046, and 0.042, respectively).
Table 4.
Relationship of BAC-max with each maximal score of subjective feeling in the crossover trial.
4. Discussion
We examined whether differences in the speed of consuming 480 mL of beer affected BAC, biochemical indices, and subjective feelings in a crossover pilot trial in 18 healthy subjects. Considering that the objective and subjective effects caused by alcohol consumption vary widely among individuals, a crossover study was employed to ensure that participants’ backgrounds did not differ when comparing the effects of different drinking speeds. Results showed that BAC transition in the consumption of 480 mL of beer for 30 min was almost the same as that for 60 min. At a drinking speed of 20 mL/5 min, although the participants had finished 280 mL after 75 min, the BAC (0.13 mg/mL) was only less than half of that (0.34 mg/mL) at the other drinking speeds. Smith et al. observed increasing maximal BAC and BAC-AUC with increasingly rapid portal-vein infusions of identical alcohol doses in rats [23]. The BAC in portal blood to the liver could be an important determinant of maximum BAC and BAC-AUC, owing to the first-pass metabolism of alcohol in the liver. If the absorption dose of alcohol is sufficiently low to maintain the portal BAC below the Vmax of hepatic alcohol dehydrogenase, some ethanol will escape into the peripheral circulation, resulting in very low BAC and AUC. The drinking speed of 20 mL/5 min also lowered the maximal BAC by causing lower portal BAC resulting from the lower absorption amount per time of alcohol consumption.
Acetate is a metabolite of ethanol, and the lactate/pyruvate ratio, which reflects NADH/NAD+ ratio as a redox state, transiently elevates after alcohol ingestion [24]. Despite differences in BAC values, the blood acetate, lactate and pyruvate concentrations, and lactate/pyruvate ratio did not significantly differ between the three drinking speeds. None of the changes in organic acids that occurred after alcohol consumption were affected by differences in the drinking speed. A small amount of alcohol could sufficiently affect these parameters. After alcohol consumption, the urinary output of uric acid is reduced, thereby transiently increasing serum uric acid concentration [25]. Of the three drinking speeds, 20 mL/5 min resulted in the smallest increase in uric acid concentrations; therefore, drinking alcohol more slowly may have a limited effect on serum uric acid levels with lower BAC. Alcohol is recognized a risk factor for increased uric acid and gout flare [26]. Drinking slowly may be recommended for the prevention of gout.
Alcohol consumption reportedly increases the subjective stimulation scores during the initial increase in BAC and increases subjective sedation scores during the declining phase of BAC values [19,27]. The present study revealed that at a drinking speed of 80 mL/5 min, stimulant feelings were maximal at the end of drinking, and the sedative feelings reached maximum values at 60 min. However, at a slower speed of drinking, both scores tended to decrease as the participants finished drinking, possibly as a result of the suppression of the rapid increase in BAC. Surprisingly, the difference in the maximum stimulant effects between the three drinking speeds was not significant, despite a lower maximal BAC at a drinking speed of 20 mL/min. In contrast, the sedative feeling was significantly lower at a drinking speed of 20 mL/5 min than that at 80 mL/5 min. We confirmed the order effect of the sedative feeling score (maximal score and AUC), which indicated a significant difference among three drinking speeds in the crossover design. As a result, the order effect was not shown in the sedative data. When the correlation between BAC and the scores of stimulant feelings was examined, the stimulant feeling did not show a correlation with the BAC, but the scores of sedative feelings showed a significant positive correlation, proving that the intensity of stimulant feelings did not depend on the degree of BAC elevation. A previous report indicated that stimulant feeling was similar between 0.2 g/kg and 0.4 g/kg of alcohol ingestion, but sedative feeling was significantly stronger with 0.4 g/kg of alcohol than 0.2 g/kg of alcohol when healthy adults ingested moderate amounts of alcohol [28]. The results of the present study are in agreement with that of the abovementioned study. Thus, by drinking slowly, a similar stimulant feeling was obtained as in the case of drinking quickly, but the sedative feeling was less likely to occur. The present study is the first to demonstrate that drinking slowly produces subjective stimulant feelings while suppressing subjective sedative feelings. However, further research is needed because the effect on the subjective drinking sensation may vary depending on individual drinking conditions. Drinking slowly may result in lower total BAC, and the recommendation to do so was considered to be correct in terms of physical and psychological effects. Stafford et al. found that alcoholic beverages were consumed at a slower rate in two health warning conditions compared with the control condition [29]. However, realistically, 480 mL of beer would be unlikely to be consumed over an hour as in this study. Therefore, drinking conditions should be devised. For example, selecting alcoholic beverages with a lower alcohol content instead of changing the drinking speed of alcohol would be practically the same as slowly consuming alcohol. To the best of our knowledge, our study findings are the first to suggest health effects resulting from the difference in speed of consuming the same amount of alcohol.
This study is subject to some limitations. First, a power analysis for calculating the required number of study participants was not performed during the planning phase of the study. The modest sample size (n = 18) might have reduced the statistical power and increased the risk of type II error, particularly regarding the statistical differences in multiple comparisons between the sedative feelings at drinking speeds of 40 and 80 mL/5 min. Evidence of effects caused by the difference in speed of consuming alcohol could be acquired by conducting clinical trials with an appropriate sample size. Furthermore, differences in the amount of alcohol consumed could also affect the results, although a moderate amount of beer (480 mL) was consumed in this study. Additional studies are required to clarify the health effects resulting from the difference in speed of alcohol consumption.
5. Conclusions
We confirmed that drinking slowly moderates the increase in BAC. Drinking slowly did not change the stimulant feeling but weakened the sedative feeling. This practice also suppressed the transient increase in serum uric acid concentration. Results suggest that these changes were caused by the slower slope of the increasing trend of BAC resulting from slow alcohol drinking. Drinking slowly could reduce the objective and subjective acute effects of alcohol; hence, slow drinking is recommended. Further studies are required in the future.
Author Contributions
Study design, statistical analysis, interpretation of results, and manuscript writing, S.O.; contribution to sample analysis, S.S.; supervision, Y.K.; final manuscript approval, S.O., S.S. and Y.K. All authors have read and agreed to the published version of the manuscript.
Funding
This research received no external funding.
Institutional Review Board Statement
This study was conducted in accordance with the Declaration of Helsinki and was approved by the Suda Clinic Institutional Review Board (approval number: 2021-032) on 17 August 2021.
Informed Consent Statement
Informed consent was obtained from all participants involved in the study.
Data Availability Statement
The datasets used in this study are available from the corresponding author upon reasonable request.
Acknowledgments
We would like to thank staff members of IMEQRD Co., Ltd. (Tokyo, Japan) for conducting the study. We also thank Enago (www.enago.jp (accessed on 19 September 2022)) for the English language review.
Conflicts of Interest
All authors are employed by Asahi Quality & Innovations, Ltd.
References
- Iranpour, A.; Nakhaee, N. A review of alcohol-related harms: A recent update. Addict. Health 2019, 11, 129–137. [Google Scholar]
- Shield, K.; Manthey, J.; Rylett, M.; Probst, C.; Wettlaufer, A.; Parry, C.D.H.; Rehm, J. National, regional, and global burdens of disease from 2000 to 2016 attributable to alcohol use: A comparative risk assessment study. Lancet Public Health 2020, 5, e51–e61. [Google Scholar] [CrossRef]
- Chikritzhs, T.; Livingston, M. Alcohol and the risk of injury. Nutrients 2021, 13, 2777. [Google Scholar] [CrossRef]
- Morean, M.E.; Corbin, W.R. Subjective response to alcohol: A critical review of the literature. Alcohol. Clin. Exp. Res. 2010, 34, 385–395. [Google Scholar] [CrossRef] [PubMed]
- Quinn, P.D.; Fromme, K. Subjective response to alcohol challenge: A quantitative review. Alcohol. Clin. Exp. Res. 2011, 35, 1759–1770. [Google Scholar] [CrossRef] [PubMed]
- Bujarski, S.; Hutchison, K.E.; Roche, D.J.; Ray, L.A. Factor structure of subjective responses to alcohol in light and heavy drinkers. Alcohol. Clin. Exp. Res. 2015, 39, 1193–1202. [Google Scholar] [CrossRef]
- Kalant, H. Pharmacokinetics of ethanol: Absorption, distribution, and elimination. In The Pharmacology of Alcohol and Alcohol Dependence; Beglieter, H., Kissin, B., Eds.; Oxford University Press: New York, NY, USA, 1996; pp. 15–58. [Google Scholar]
- Mitchell, M.C., Jr.; Teigen, E.L.; Ramchandani, V.A. Absorption and peak blood alcohol concentration after drinking beer, wine, or spirits. Alcohol. Clin. Exp. Res. 2014, 38, 1200–1204. [Google Scholar] [CrossRef] [PubMed]
- Shultz, J.; Weiner, H.; Westcott, J. Retardation of ethanol absorption by food in the stomach. J. Stud. Alcohol 1980, 41, 861–870. [Google Scholar] [CrossRef]
- Jian, R.; Cortot, A.; Ducrot, F.; Jobin, G.; Chayvialle, J.A.; Modigliani, R. Effect of ethanol ingestion on postprandial gastric emptying and secretion, biliopancreatic secretions, and duodenal absorption in man. Dig. Dis. Sci. 1986, 31, 604–614. [Google Scholar] [CrossRef] [PubMed]
- Horowitz, M.; Maddox, A.; Bochner, M.; Wishart, J.; Bratasiuk, R.; Collins, P.; Shearman, D. Relationships between gastric emptying of solid and caloric liquid meals and alcohol absorption. Am. J. Physiol. 1989, 257, G291–G298. [Google Scholar] [CrossRef] [PubMed]
- Oneta, C.M.; Simanowski, U.A.; Martinez, M.; Allali-Hassani, A.; Parés, X.; Homann, N.; Conradt, C.; Waldherr, R.; Fiehn, W.; Coutelle, C.; et al. First pass metabolism of ethanol is strikingly influenced by the speed of gastric emptying. Gut 1998, 43, 612–619. [Google Scholar] [CrossRef]
- Millar, K.; Hammersley, R.H.; Finnigan, F. Reduction of alcohol-induced performance impairment by prior ingestion of food. Br. J. Psychol. 1992, 83, 261–278. [Google Scholar] [CrossRef]
- Holt, S. Observations on the relation between alcohol absorption and the rate of gastric emptying. Can. Med. Assoc. J. 1981, 124, 267–297. [Google Scholar]
- Kalaria, T.; Ko, Y.L.; Issuree, K.K.J. Literature review: Drug and alcohol-induced hypoglycaemia. J. Lab. Precis. Med. 2021, 6, 1–16. [Google Scholar] [CrossRef]
- Okada, T.; Mizoi, Y. Studies on the problem of blood acetaldehyde determination in man and level after alcohol intake. Jpn. J. Alcohol Drug Depend. 1982, 17, 141–159. [Google Scholar]
- Namihira, T.; Shinzato, N.; Akamine, H.; Maekawa, H.; Matsui, T. Influence of nitrogen fertilization on tropical-grass silage assessed by ensiling process monitoring using chemical and microbial community analyses. J. Appl. Microbiol. 2010, 108, 1954–1965. [Google Scholar] [CrossRef]
- Martin, C.S.; Earleywine, M.; Musty, R.E.; Perrine, M.W.; Swift, R.M. Development and validation of the biphasic alcohol effects scale. Alcohol. Clin. Exp. Res. 1993, 17, 140–146. [Google Scholar] [CrossRef]
- King, A.C.; Houle, T.; Wit, H.; Holdstock, L.; Schuster, A. Biphasic alcohol response differs in heavy versus light drinkers. Alcohol. Clin. Exp. Res. 2002, 26, 827–835. [Google Scholar] [CrossRef]
- Poprawa, R. A subjective assessment of the short-term effects of alcohol consumption. Preliminary studies on the Polish language adaptation of “the biphasic alcohol effects scale”. Alcohol Drug Addic. 2015, 28, 1–21. [Google Scholar] [CrossRef][Green Version]
- Rueger, S.Y.; McNamara, P.J.; King, A.C. Expanding the utility of the biphasic alcohol effects scale (BAES) and initial psychometric support for the Brief-BAES (B-BAES). Alcohol. Clin. Exp. Res. 2009, 33, 916–924. [Google Scholar] [CrossRef]
- Rueger, S.Y.; King, A.C. Validation of the brief biphasic alcohol effects scale (B-BAES). Alcohol. Clin. Exp. Res. 2013, 37, 470–476. [Google Scholar] [CrossRef]
- Smith, T.; DeMaster, E.G.; Furne, J.K.; Springfield, J.; Levitt, M.D. First-pass gastric mucosal metabolism of ethanol is negligible in the rat. J. Clin. Investig. 1992, 89, 1801–1806. [Google Scholar] [CrossRef][Green Version]
- Mascord, D.; Rogers, J.; Smith, J.; Starmer, G.A.; Whitfield, J.B. Effect of diet on [lactate]/[pyruvate] ratios during alcohol metabolism in man. Alcohol Alcohol. 1989, 24, 189–191. [Google Scholar]
- Lieber, C.S.; Jones, D.P.; Losowsky, M.S.; Davidson, C.S. Interrelation of uric acid and ethanol metabolism in man. J. Clin. Investig. 1962, 41, 1863–1870. [Google Scholar] [CrossRef]
- Nieradko-Iwanicka, B. The role of alcohol consumption in pathogenesis of gout. Crit. Rev. Food Sci. Nutr. 2022, 62, 7129–7137. [Google Scholar] [CrossRef]
- Earleywine, M.; Martin, C.S. Anticipated stimulant and sedative effects of alcohol vary with dosage and limb of the blood alcohol curve. Alcohol. Clin. Exp. Res. 1993, 17, 135–139. [Google Scholar] [CrossRef]
- Holdstock, L.; de Wit, H. Individual differences in the biphasic effects of ethanol. Alcohol. Clin. Exp. Res. 1998, 22, 1903–1911. [Google Scholar] [CrossRef]
- Stafford, L.D.; Salmon, J. Alcohol health warnings can influence the speed of consumption. J. Public Health 2017, 25, 147–154. [Google Scholar] [CrossRef]


Publisher’s Note: MDPI stays neutral with regard to jurisdictional claims in published maps and institutional affiliations. |
© 2022 by the authors. Licensee MDPI, Basel, Switzerland. This article is an open access article distributed under the terms and conditions of the Creative Commons Attribution (CC BY) license (https://creativecommons.org/licenses/by/4.0/).