Clinical Utility of LCT Genotyping in Children with Suspected Functional Gastrointestinal Disorder

 ,
, 

Abstract
1. Introduction
2. Materials and Methods
2.1. Study Design and Population
2.2. Anthropometric Measurements
2.3. Analytical Measurements
2.4. Hydrogen Breath Test
2.5. Genetic Study
2.6. Statistical Analysis
3. Results
3.1. Characteristics of the Study Population
3.2. Phenotype
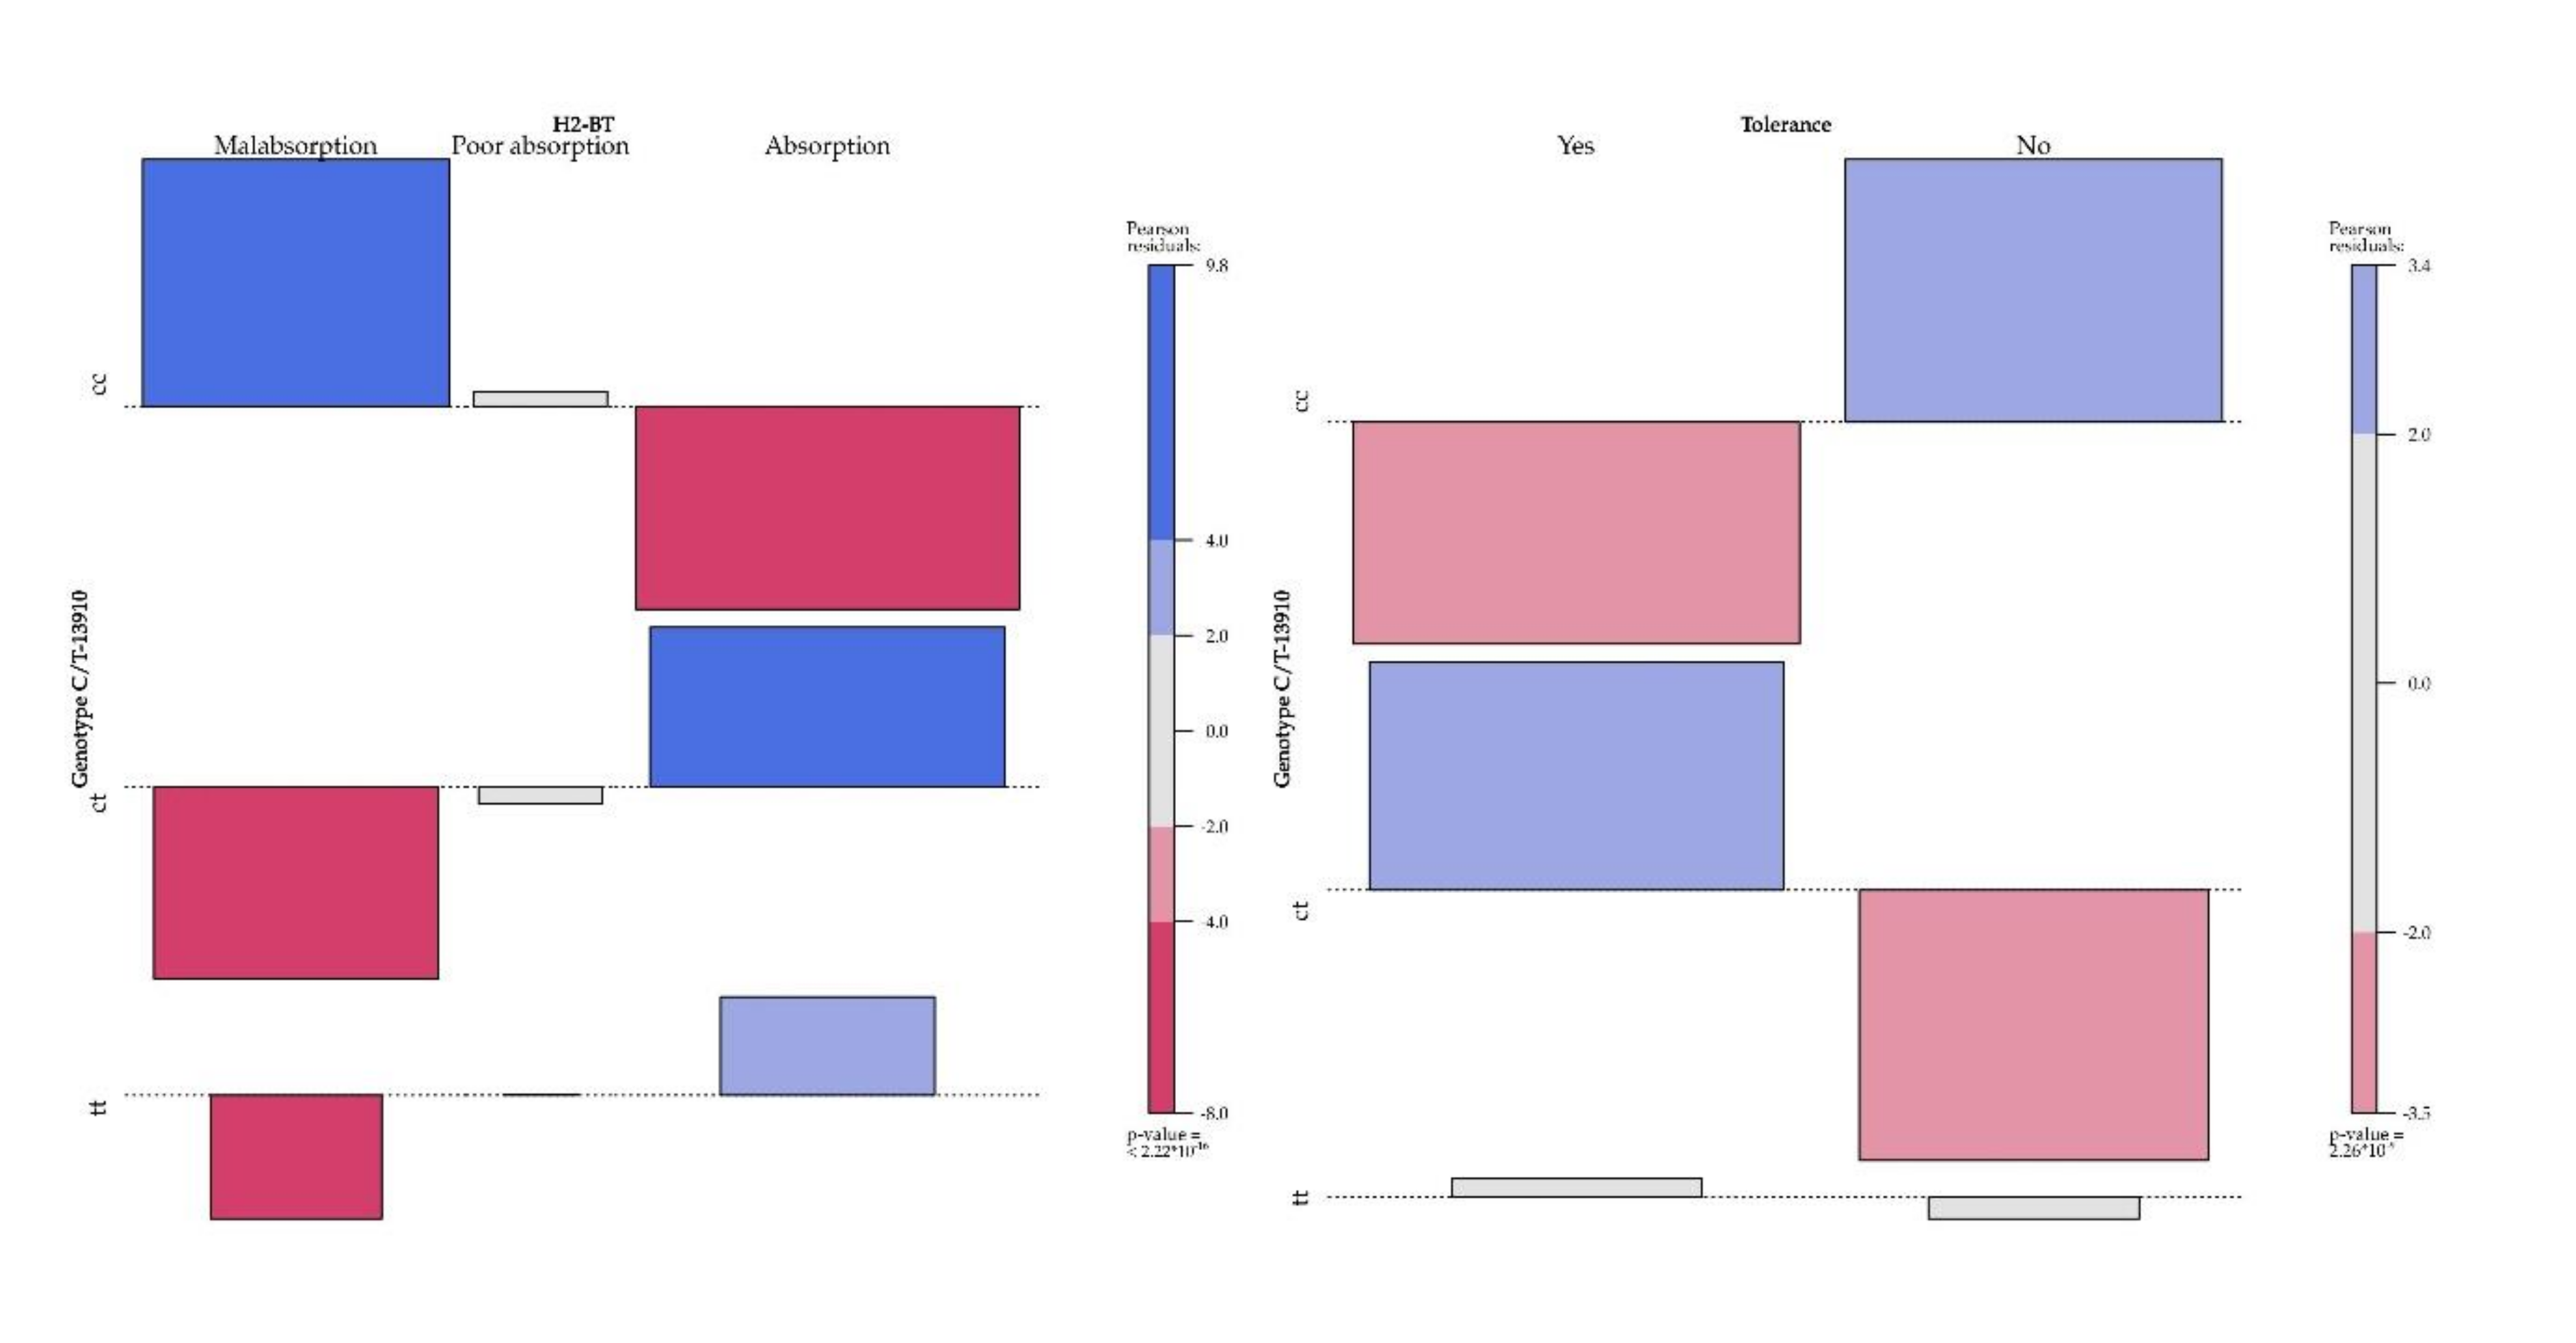
3.3. Phenotype/Genotype Correlation
3.4. Dairy Product Intake and Phosphocalcic Metabolism
4. Discussion
5. Conclusions
Supplementary Materials
Author Contributions
Funding
Conflicts of Interest
References
- Rasinperä, H.; Kuokkanen, M.; Kolho, K.-L.; Lindahl, H.; Enattah, N.S.; Savilahti, E.; Orpana, A.; Jarvela, I. Transcriptional downregulation of the lactase (LCT) gene during childhood. Gut 2005, 54, 1660–1661. [Google Scholar] [CrossRef] [PubMed]
- Misselwitz, B.; Butter, M.; Verbeke, K.; Fox, M. Update on lactose malabsorption and intolerance: Pathogenesis, diagnosis and clinical management. Gut 2019, 68, 2080–2091. [Google Scholar] [CrossRef] [PubMed]
- Simoons, F.J. Primary adult lactose intolerance and the milking habit: A problem in biological and cultural interrelations. II. A culture historical hypothesis. Am. J. Dig. Dis. 1970, 15, 695–710. [Google Scholar] [CrossRef] [PubMed]
- McCracken, R.D. Origins and Implications of the Distribution of Adult Lactase Deficiency in Human Populations. J. Trop. Pediatr. Environ. Child. Health 1971, 17, 7–10. [Google Scholar] [CrossRef]
- Flatz, G.; Rotthauwe, H. Lactose nutrition and natural selection. Lancet 1973, 302, 76–77. [Google Scholar] [CrossRef]
- Enattah, N.S.; Sahi, T.; Savilahti, E.; Terwilliger, J.D.; Peltonen, L.; Jarvela, I. Identification of a variant associated with adult-type hypolactasia. Nat. Genet. 2002, 30, 233–237. [Google Scholar] [CrossRef]
- Labrie, V.; Buske, O.J.; Oh, E.; Jeremian, R.; Ptak, C.; Gasiunas, G.; Maleckas, A.; Petereit, R.; Žvirbliene, A.; Adamonis, K.; et al. Lactase nonpersistence is directed by DNA-variation-dependent epigenetic aging. Nat. Struct. Mol. Biol. 2016, 23, 566–573. [Google Scholar] [CrossRef]
- Swallow, D.M. Genetics of Lactase Persistence and Lactose Intolerance. Annu. Rev. Genet. 2003, 37, 197–219. [Google Scholar] [CrossRef]
- Enattah, N.S.; Trudeau, A.; Pimenoff, V.N.; Maiuri, L.; Auricchio, S.; Greco, L.; Rossi, M.; Lentze, M.; Seo, J.K.; Rahgozar, S.; et al. Evidence of Still-Ongoing Convergence Evolution of the Lactase Persistence T-13910 Alleles in Humans. Am. J. Hum. Genet. 2007, 81, 615–625. [Google Scholar] [CrossRef]
- Almon, R.; Álvarez-León, E.E.; Engfeldt, P.; Serra-Majem, L.; Magnuson, A.; Nilsson, T.K. Associations between lactase persistence and the metabolic syndrome in a cross-sectional study in the Canary Islands. Eur. J. Nutr. 2009, 49, 141–146. [Google Scholar] [CrossRef]
- Corella, D.; Arregui, M.; Coltell, O.; Portolès, O.; Guillem-Saiz, P.; Carrasco, P.; Sorli, J.V.; Ortega-Azorín, C.; González, J.I.; Ordovás, J.M. Association of the LCT-13910C>T polymorphism with obesity and its modulation by dairy products in a Mediterranean population. Obesity 2010, 19, 1707–1714. [Google Scholar] [CrossRef]
- Jiménez, J.L.D.; Suárez, A.F.; Colmenero, A.; Úrsula, M.; Cantillo, D.F.; Pelayo, I.L. Primary hypolactasia diagnosis: Comparison between the gaxilose test, shortened lactose tolerance test, and clinical parameters corresponding to the C/T-13910 polymorphism. Clin. Nutr. 2017, 36, 471–476. [Google Scholar] [CrossRef] [PubMed]
- Comerford, K.B.; Pasin, G. Gene–Dairy Food Interactions and Health Outcomes: A Review of Nutrigenetic Studies. Nutrients 2017, 9, 710. [Google Scholar] [CrossRef] [PubMed]
- Kettunen, J.; Silander, K.; Saarela, O.; Amin, N.; Müller-Nurasyid, M.; Timpson, N.J.; Surakka, I.; Ripatti, S.; Laitinen, J.; Hartikainen, A.-L.; et al. European lactase persistence genotype shows evidence of association with increase in body mass index. Hum. Mol. Genet. 2010, 19, 1129–1136. [Google Scholar] [CrossRef] [PubMed]
- Almon, R.; Álvarez-León, E.E.; Serra-Majem, L. Association of the European Lactase Persistence Variant (LCT-13910 C>T Polymorphism) with Obesity in the Canary Islands. PLoS ONE 2012, 7, e43978. [Google Scholar] [CrossRef]
- Lamri, A.; Poli, A.; Emery, N.; Bellili, N.; Velho, G.; Lantieri, O.; Balkau, B.; Marre, M.; Fumeron, F. The lactase persistence genotype is associated with body mass index and dairy consumption in the D.E.S.I.R. study. Metabolism 2013, 62, 1323–1329. [Google Scholar] [CrossRef]
- Obermayer-Pietsch, B.M.; Bonelli, C.M.; Walter, D.E.; Kuhn, R.J.; Fahrleitner-Pammer, A.; Berghold, A.; Goessler, W.; Stepan, V.; Dobnig, H.; Leb, G.; et al. Genetic Predisposition for Adult Lactose Intolerance and Relation to Diet, Bone Density, and Bone Fractures. J. Bone Miner. Res. 2004, 19, 42–47. [Google Scholar] [CrossRef]
- Enattah, N.; Pekkarinen, T.; Välimäki, M.J.; Löyttyniemi, E.; Jarvela, I. Genetically defined adult-type hypolactasia and self-reported lactose intolerance as risk factors of osteoporosis in Finnish postmenopausal women. Eur. J. Clin. Nutr. 2005, 59, 1105–1111. [Google Scholar] [CrossRef]
- Yang, Q.; Lin, S.L.; Yeung, S.L.R.A.; Kwok, M.K.; Xu, L.; Leung, G.M.; Schooling, C.M. Genetically predicted milk consumption and bone health, ischemic heart disease and type 2 diabetes: A Mendelian randomization study. Eur. J. Clin. Nutr. 2017, 71, 1008–1012. [Google Scholar] [CrossRef]
- Di Stefano, M.; Terulla, V.; Tana, P.; Mazzocchi, S.; Romero, E.; Corazza, G.R. Genetic test for lactase non-persistence and hydrogen breath test: Is genotype better than phenotype to diagnose lactose malabsorption? Dig. Liver Dis. 2009, 41, 474–479. [Google Scholar] [CrossRef]
- Pohl, D.; Savarino, E.V.; Hersberger, M.; Behlis, Z.; Stutz, B.; Goetze, O.; Eckardstein, A.V.; Fried, M.; Tutuian, R. Excellent agreement between genetic and hydrogen breath tests for lactase deficiency and the role of extended symptom assessment. Br. J. Nutr. 2010, 104, 900–907. [Google Scholar] [CrossRef] [PubMed]
- Enko, D.; Rezanka, E.; Stolba, R.; Halwachs-Baumann, G. Lactose Malabsorption Testing in Daily Clinical Practice: A Critical Retrospective Analysis and Comparison of the Hydrogen/Methane Breath Test and Genetic Test (C/T−13910 Polymorphism) Results. Gastroenterol. Res. Pract. 2014, 2014, 464382. [Google Scholar] [CrossRef]
- Santonocito, C.; Scapaticci, M.; Guarino, D.; Annicchiarico, E.B.; Lisci, R.; Penitente, R.; Gasbarrini, A.; Zuppi, C.; Capoluongo, E. Lactose intolerance genetic testing: Is it useful as routine screening? Results on 1426 south–central Italy patients. Clin. Chim. Acta 2015, 439, 14–17. [Google Scholar] [CrossRef] [PubMed]
- Coluccia, E.; Iardino, P.; Pappalardo, D.; Brigida, A.L.; Formicola, V.; De Felice, B.; Guerra, C.; Pucciarelli, A.; Amato, M.R.; Riegler, G.; et al. Congruency of Genetic Predisposition to Lactase Persistence and Lactose Breath Test. Nutrients 2019, 11, 1383. [Google Scholar] [CrossRef] [PubMed]
- Högenauer, C.; Hammer, H.F.; Mellitzer, K.; Renner, W.; Krejs, G.J.; Toplak, H. Evaluation of a new DNA test compared with the lactose hydrogen breath test for the diagnosis of lactase non-persistence. Eur. J. Gastroenterol. Hepatol. 2005, 17, 371–376. [Google Scholar] [CrossRef]
- Nagy, D.; Bogácsi-Szabó, E.; Várkonyi, Á.; Csányi, B.; Czibula, Á.; Bede, O.; Tari, B.; Raskó, I. Prevalence of adult-type hypolactasia as diagnosed with genetic and lactose hydrogen breath tests in Hungarians. Eur. J. Clin. Nutr. 2009, 63, 909–912. [Google Scholar] [CrossRef]
- Hyams, J.S.; Di Lorenzo, C.; Spas, M.; Shulman, R.J.; Staiano, A.; van Tilburg, M. Functional Disorders: Children and Adolescent. Gastroenterology 2016, 150, 1456–1468.e2. [Google Scholar] [CrossRef]
- Munns, C.F.; Shaw, N.; Kiely, M.; Specker, B.L.; Thacher, T.D.; Ozono, K.; Michigami, T.; Tiosano, D.; Mughal, M.Z.; Mäkitie, O.; et al. Global Consensus Recommendations on Prevention and Management of Nutritional Rickets. J. Clin. Endocrinol. Metab. 2016, 101, 394–415. [Google Scholar] [CrossRef]
- WHO Multicentre Growth Reference Study Group; Onis, M. WHO Child Growth Standards based on length/height, weight and age. Acta Paediatr. 2007, 95, 76–85. [Google Scholar] [CrossRef]
- Nutritional Assessment Tool of the Spanish Society of Gastroenterology, Hepatology, and Nutrition. Available online: https://www.seghnp.org/nutricional/ (accessed on 15 May 2020).
- Posovszky, C.; Roesler, V.; Becker, S.; Iven, E.; Hudert, C.; Ebinger, F.; Calvano, C.; Warschburger, P. Roles of Lactose and Fructose Malabsorption and Dietary Outcomes in Children Presenting with Chronic Abdominal Pain. Nutrients 2019, 11, 3063. [Google Scholar] [CrossRef]
- Leis, R.; Tojo, R.; Pavón, P.; Douwes, A. Prevalence of Lactose Malabsorption in Galicia. J. Pediatr. Gastroenterol. Nutr. 1997, 25, 296–300. [Google Scholar] [CrossRef] [PubMed]
- Cristofori, F.; Fontana, C.; Magistà, A.; Capriati, T.; Indrio, F.; Castellaneta, S.; Cavallo, L.; Francavilla, R. Increased prevalence of celiac disease among pediatric patients with irritable bowel syndrome: A 6-year prospective cohort study. JAMA Pediatr. 2014, 168, 555. [Google Scholar] [CrossRef] [PubMed]
- Pensabene, L.; Salvatore, S.; D’Auria, E.; Parisi, F.; Concolino, D.; Borrelli, O.; Thapar, N.; Staiano, A.; Vandenplas, Y.; Saps, M. Cow’s Milk Protein Allergy in Infancy: A Risk Factor for Functional Gastrointestinal Disorders in Children? Nutrients 2018, 10, 1716. [Google Scholar] [CrossRef] [PubMed]
- Valitutti, F.; Fasano, A. Breaking Down Barriers: How Understanding Celiac Disease Pathogenesis Informed the Development of Novel Treatments. Dig. Dis. Sci. 2019, 64, 1748–1758. [Google Scholar] [CrossRef] [PubMed]
- Fassio, F.; Facioni, M.S.; Guagnini, F. Lactose Maldigestion, Malabsorption, and Intolerance: A Comprehensive Review with a Focus on Current Management and Future Perspectives. Nutrients 2018, 10, 1599. [Google Scholar] [CrossRef]
- Hammer, H.F.; Hammer, J.; Fox, M. Mistakes in the management of carbohydrate intolerance and how to avoid them. UEG Educ. 2019, 19, 9–14. [Google Scholar]
- Schirru, E.; Corona, V.; Usai-Satta, P.; Scarpa, M.; Cucca, F.; De Virgiliis, S.; Rossino, R.; Frau, F.; Macis, M.D.; Jores, R.-D.; et al. Decline of Lactase Activity and C/T-13910 Variant in Sardinian Childhood. J. Pediatr. Gastroenterol. Nutr. 2007, 45, 503–506. [Google Scholar] [CrossRef]
- Poulter, M.; Hollox, E.J.; Harvey, C.B.; Mulcare, C.; Peuhkuri, K.; Kajander, K.; Sarner, M.; Korpela, R.; Swallow, D.M. The causal element for the lactase persistence/non-persistence polymorphism is located in a 1 Mb region of linkage disequilibrium in Europeans. Ann. Hum. Genet. 2003, 67, 298–311. [Google Scholar] [CrossRef]
- Zhu, Y.; Zheng, X.; Cong, Y.; Chu, H.; Fried, M.; Dai, N.; Fox, M. Bloating and Distention in Irritable Bowel Syndrome: The Role of Gas Production and Visceral Sensation After Lactose Ingestion in a Population With Lactase Deficiency. Am. J. Gastroenterol. 2013, 108, 1516–1525. [Google Scholar] [CrossRef]
- Peuhkuri, K.; Vapaatalo, H.; Nevala, R.; Korpela, R. Influence of the pharmacological modification of gastric emptying on lactose digestion and gastrointestinal symptoms. Aliment. Pharmacol. Ther. 1999, 13, 81–86. [Google Scholar] [CrossRef]
- Labayen, I.; Forga, L.; Gonzalez, A.; Lenoir-Wijnkoop, I.; Nutr, R.; Martinez, J.A. Relationship between lactose digestion, gastrointestinal transit time and symptoms in lactose malabsorbers after dairy consumption. Aliment. Pharmacol. Ther. 2001, 15, 543–549. [Google Scholar] [CrossRef] [PubMed]
- Blekhman, R.; Goodrich, J.K.; Huang, K.; Sun, Q.; Bukowski, R.; Bell, J.T.; Spector, T.D.; Keinan, A.; Ley, R.E.; Gevers, D.; et al. Host genetic variation impacts microbiome composition across human body sites. Genome Biol. 2015, 16, 191. [Google Scholar] [CrossRef] [PubMed]
- Leis, R.; De Castro, M.J.; De Lamas, C.; Picáns, R.; Couce, M.-L. Effects of Prebiotic and Probiotic Supplementation on Lactase Deficiency and Lactose Intolerance: A Systematic Review of Controlled Trials. Nutrients 2020, 12, 1487. [Google Scholar] [CrossRef] [PubMed]
- Almon, R.; Sjöström, M.; Nilsson, T.K. Lactase non-persistence as a determinant of milk avoidance and calcium intake in children and adolescents. J. Nutr. Sci. 2013, 2, 1–5. [Google Scholar] [CrossRef]
- Alharbi, O.; El-Sohemy, A. Lactose Intolerance (LCT -13910C>T) Genotype Is Associated with Plasma 25-Hydroxyvitamin D Concentrations in Caucasians: A Mendelian Randomization Study. J. Nutr. 2017, 147, 1063–1069. [Google Scholar] [CrossRef]
- López-Sobaler, A.M.; Aparicio, A.; Rodríguez, L.G.G.; Cuadrado-Soto, E.; Rubio, J.; Marcos, V.; Sanchidrián, R.; Santos, S.; Pérez-Farinós, N.; Re, M.; et al. Adequacy of Usual Vitamin and Mineral Intake in Spanish Children and Adolescents: ENALIA Study. Nutrients 2017, 9, 131. [Google Scholar] [CrossRef]
- Madrigal, C.; Soto-Méndez, M.J.; Hernández-Ruiz, A.; Valero, T.; Ávila, J.M.; Lara-Villoslada, F.; Leis, R.; de Victoria, E.M.; Moreno, J.M.; Ortega, O.M.; et al. Dietary and Lifestyle Patterns in the Spanish Pediatric Population (One to > 10 Years Old): Design, Protocol, and Methodology of the EsNuPI Study. Nutrients 2019, 11, 3050. [Google Scholar] [CrossRef]
- EFSA Panel on Dietetic Products, Nutrition and Allergies (NDA). Scientific Opinion on nutrient requirements and dietary intakes of infants and young children in the European Union. EFSA J. 2013, 11, 3408. [Google Scholar]
- De Lamas, C.; De Castro, M.J.; Gil-Campos, M.; Gil, Á.; Couce, M.L.; Leis, R. Effects of Dairy Product Consumption on Height and Bone Mineral Content in Children: A Systematic Review of Controlled Trials. Adv. Nutr. 2019, 10, S88–S96. [Google Scholar] [CrossRef]


| Subjects (n = 493) | Age Groups | p | |||
|---|---|---|---|---|---|
| ≤5 years (n = 50) | 6–11 years (n = 326) | ≥12 years (n = 117) | |||
| Age (mean ± SD), y | 8.8 ± 3.3 | 3.4 ± 0.9 | 7.9 ± 1.9 | 13.4 ± 1.31 | |
| Anthropometric characteristics | |||||
| BMI (kg/m2) | 17.86 ± 3.56 | 15.51 ± 1.57 | 17.16 ± 3.01 | 20.62 ± 3.99 | <2.2 × 10⁻¹⁶ |
| BMI z-score | 0.28 ± 1.21 | 0.12 ± 1.12 | 0.32 ± 1.23 | 0.26 ± 1.20 | 0.446 |
| Underweight | 64 [12.9%] | 8 [16%] | 40 [12.2%] | 17 [14.5%] | |
| Normal weight | 297 [60.2%] | 32 [64%] | 196 [60%] | 69 [58.9%] | 0.983 |
| Overweight | 64 [12.7%] | 5 [10%] | 44 [13.4%] | 15 [12.8%] | |
| Obesity | 68 [13.7%] | 5 [10%] | 47 [14.4%] | 16 [13.6%] | |
| Family history of LI | 0.996 | ||||
| Total | 52 [10.5%] | 1 [2%] | 32 [9.8%] | 19 [16.2%] | |
| Father | 21 [4.2%] | 1 [2%] | 15 [4.6%] | 5 [4.2%] | |
| Mother | 19 [3.8%] | 0 | 12 [3.6%] | 7 [5.9%] | |
| Sibling | 12 [2.4%] | 0 | 5 [1.5%] | 7 [5.9%] | |
| Previous symptoms | |||||
| Abdominal pain | 277 [56.1%] | 18 [36%] | 194 [59.5%] | 65 [55.5%] | 0.008 |
| Diarrhea | 87 [17.6%] | 11 [22%] | 59 [18%] | 17 [14.5%] | 0.477 |
| Nausea | 34 [6.8%] | 0 | 20 [6.1%] | 14 [11.9%] | 0.009 |
| Vomiting | 57 [11.5%] | 2 [4%] | 43 [13.1%] | 12 [10.2%] | 0.147 |
| Headache | 19 [3.8%] | 0 | 13 [3.9%] | 6 [5.1%] | 0.313 |
| C/T-13910 genotype | |||||
| CC | 227 [46.04%] | 12 [24%] | 148 [45.3%] | 67 [57.2%] | 0.002 |
| CT | 195 [39.5%] | 30 [60%] | 127 [38.9%] | 38 [32.4%] | |
| TT | 71 [14.4%] | 8 [16%] | 51 [15.6%] | 12 [10.2%] | |
| C allele frequency | 65.80% | 54% | 64.80% | 73.50% | |
| T allele frequency | 34.10% | 46% | 35.10% | 26.40% | |
| HBT findings | |||||
| Lactose absorption | 280 [56.7%] | 42 [84%] | 188 [57.6%] | 50 [42.7%] | 1.47 × 10⁻⁵ |
| Poor lactose absorption | 34 [6.8%] | 4 [8%] | 21 [6.4%] | 9 [7.6%] | |
| Lactose malabsorption | 179 [36.3%] | 4 [8%] | 117 [35.8%] | 58 [49.5%] | |
| Lactose tolerance | 288 [58.4%] | 36 [72%] | 198 [60.7%] | 54 [46.1%] | 0.003 |
| Lactose intolerance | 205 [41.5%] | 14 [28%] | 128 [39.3%] | 63 [53.8%] | |
| Peak H2 (ppm) | 36.21 ± 48.1 | 9.56 ± 14.98 | 35.07 ± 44.1 | 50.79 ± 61.20 | <0.001 |
| Time to peak H2 (min) | 88.72 ± 70.61 | 71.4 ± 75.18 | 87.97 ± 72 | 98.20 ± 63.34 | <0.070 |
| H2 increase (ppm) | 31.87 ± 47.56 | 6.18 ± 14.55 | 30.66 ± 43.53 | 46.23 ± 60.81 | <0.001 |
| Malabsorption | Tolerance | Intolerance | p4 | |||||||||||||
|---|---|---|---|---|---|---|---|---|---|---|---|---|---|---|---|---|
| HBT | Total | ≤5 years | 6–11 years | ≥12 years | p1 | Total | ≤5 years | 6–11 years | ≥12 years | p2 | Total | ≤5 years | 6–11 years | ≥12 years | p3 | |
| (n = 179) | (n = 4) | (n = 117) | (n = 58) | (n = 288) | (n = 36) | (n = 198) | (n = 54) | (n = 205) | (n = 14) | (n = 128) | (n = 63) | |||||
| Peak H2 (ppm) | 87.19 ± 46.9 | 53.25 ± 18.5 | 84.73 ± 38.4 | 94.56 ± 0.9 | 0.583 | 23.04 ± 36.5 | 10.44 ± 15.6 | 21.02 ± 33.7 | 38.85 ± 49.5 | 0.042 | 54.72 ± 55.8 | 7.28 ± 13.4 | 56.80 ± 49.3 | 61.03 ± 68.3 | <0.001 | <0.001 |
| Time to peak H2 | ||||||||||||||||
| (Mean ± SD, min) | 134.41 ± 39.7 | 165 ± 17.3 | 135.38 ± 40.4 | 130.34 ± 38.7 | 0.736 | 78.22 ± 72.8 | 75 ± 75.04 | 75.90 ± 7 | 88.88 ± 62.7 | 0.005 | 103.46 ± 64.7 | 62.14 ± 77.5 | 106.64 ± 62.9 | 106.19 ± 63.2 | 0.449 | 1.02 × 10−02 |
| 0 min | 0 | 0 | 0 | 0 | 96 [33.3%] | 15 [41.6%] | 72 [36.3%] | 9 [16.6%] | 37 [18%] | 8 [57.1%] | 19 [14.8%] | 10 [15.8%] | ||||
| 30 min | 1 [0.5%] | 0 | 1 [0.8%] | 0 | 40 [13.8%] | 2 [5.5%] | 29 [14.6%] | 9 [16.6%] | 12 [5.8%] | 0 | 9 [7%] | 3 [4.7%] | ||||
| 60 min | 16 [8.9%] | 0 | 11 [9.4%] | 5 [8.7%] | 15 [5.2%] | 2 [5.5%] | 8 [4%] | 5 [9.2%] | 17 [3.4%] | 0 | 11 [8.5%] | 6 [9.5%] | ||||
| 90 min | 27 [15%] | 0 | 16 [13.6%] | 11 [18.9%] | 19 [6.5%] | 2 [5.5%] | 12 [6%] | 5 [9.2%] | 25 [12.1%] | 1 [7.1%] | 15 [11.7%] | 9 [14.2%] | ||||
| 120 min | 40 [22.3%] | 0 | 24 [20.5%] | 16 [27.5%] | 27 [9.3%] | 4 [11.1%] | 10 [5%] | 13 [24%] | 29 [14.1%] | 1 [7.1%] | 20 [15.6%] | 8 [12.6%] | ||||
| 150 min | 43 [24%] | 2 [50%] | 29 [24.7%] | 11 [18.9%] | 30 [10.4%] | 4 [11.1%] | 22 [11.1%] | 4 [7.4%] | 40 [19.5%] | 2 [14.2%] | 25 [19.5%] | 13 [20.6%] | ||||
| 180 min | 53 [29.6%] | 2 [50%] | 36 [30.7%] | 15 [25.9%] | 61 [21.1%] | 7 [19.4%] | 45 [22.7%] | 9 [16.6%] | 45 [21.9%] | 2 [14.2%] | 29 [22.6%] | 14 [22.2%] | ||||
| H2 increase | ||||||||||||||||
| (Mean ± SD, ppm) | 82.64 ± 46.3 | 50.05 ± 19 | 80.29 ± 37.4 | 89.60 ± 60.9 | 0.623 | 18.85 ± 35.7 | 6.88 ± 15.6 | 16.91 ± 32.9 | 33.92 ± 48.7 | 0.025 | 50.17 ± 55.1 | 4.35 ± 11.6 | 51.92 ± 49.1 | 56.79 ± 68.1 | <0.001 | <0.001 |
| ≤10 ppm | 0 | 0 | 0 | 0 | 202 [70%] | 30 [83.3%] | 144 [73%] | 28 [51.8%] | 80 [39%] | 13 [92.8%] | 45 [35.1%] | 22 [34.9%] | ||||
| 10–20 pm | 19 [10.6%] | 0 | 0 | 0 | 23 [7.9%] | 3 [8.3%] | 14 [7%] | 6 [11.1%] | 13 [6.3%] | 0 | 7 [5.4%] | 5 [7.9%] | ||||
| 20–30 pm | 14 [7.8%] | 0 | 14 [11.9%] | 5 [8.7%] | 7 [2.4%] | 0 | 6 [3%] | 1 [1.8%] | 8 [3.9%] | 0 | 5 [3.9%] | 2 [3.1%] | ||||
| 30–40 pm | 10 [5.5%] | 1 [25%] | 10 [8.5%] | 5 [8.7%] | 7 [2.4%] | 1 [2.7%] | 4 [2%] | 2 [3.7%] | 7 [3.4%] | 0 | 5 [3.9%] | 3 [4.7%] | ||||
| 40–50 ppm | 14 [7.8%] | 2 [50%] | 2 [1.7%] | 6 [10.3%] | 4 [1.3%] | 1 [2.7%] | 1 [0.5%] | 2 [3.7%] | 6 [2.9%] | 1 [7.1%] | 1 [0.7%] | 4 [6.3%] | ||||
| 50–100 ppm | 80 [44.6%] | 1 [25%] | 63 [53.8%] | 29 [50%] | 32 [11.1%] | 1 [2.7%] | 19 [9.5%] | 12 [22.2%] | 62 [30.2%] | 0 | 44 [34.3%] | 18 [28.5%] | ||||
| >100 ppm | 42 [23.4%] | 0 | 30 [25.6%] | 13 [22.1%] | 12 [4.1%] | 0 | 10 [5%] | 3 [5.5%] | 29 [14.1%] | 0 | 20 [15.6%] | 9 [14.2%] | ||||
| Symptoms | ||||||||||||||||
| Abdominal pain | 96 [53.6%] | 1 [25%] | 59 [50.4%] | 36 [62%] | 0.196 | — | — | — | — | 165 [80.4%] | 10 [71.4%] | 101 [78.9%] | 54 [85.7%] | 0.340 | ||
| Flatulence | 28 [15.6%] | 1 [25%] | 22 [18.8%] | 5 [8.7%] | 0.125 | — | — | — | — | 58 [28.2%] | 6 [42.8%] | 35 [27.3%] | 17 [26.9%] | 0.455 | ||
| Diarrhea | 36 [20.1%] | 4 [100%] | 28 [23.9%] | 8 [13.7%] | 0.173 | — | — | — | — | 49 [23.9%] | 3 [21.4%] | 35 [27.3%] | 11 [17.4%] | 0.308 | ||
| Nausea | 16 [8.9%] | 1 [25%] | 10 [8.5%] | 5 [8.7%] | 1 | — | — | — | — | 4 [13.6%] | 1 [7.1%] | 15 [11.7%] | 12 [19%] | 0.359 | ||
| Vomiting | 3 [16.7%] | 4 [100%] | 2 [1.7%] | 1 [1.7%] | 1 | — | — | — | — | 4 [1.9%] | 0 | 3 [2.3%] | 1 [1.5%] | 1 | ||
| Symptoms (n) | ||||||||||||||||
| Mean ± SD | 1.03 ± 0.9 | 0.75 ± 1.5 | 1.08 ± 1.03 | 0.96 ± 0.8 | 0.651 | — | 1.52 ± 0.6 | 1.42 ± 0.7 | 1.53 ± 0.7 | 1.53 ± 0.59 | 0.593 | |||||
| 1 symptom | 61 [34%] | 1 [25%] | 39 [33.3%] | 22 [37.9%] | — | — | — | — | 117 [57%] | 10 [71.4%] | 75 [58.5%] | 32 [50.7%] | <0.001 | |||
| 2 symptoms | 39 [21.7%] | 0 | 25 [21.3%] | 14 [24.1%] | — | — | — | — | 70 [59.8%] | 2 [14.2%] | 40 [31.2%] | 28 [44.4%] | 1.02 × 10+03 | |||
| 3 symptoms | 14 [7.8%] | 3 [75%] | 11 [9.4%] | 2 [3.4%] | — | — | — | — | 17 [8.2%] | 2 [14.2%] | 12 [9.3%] | 3 [4.7%] | <0.001 | |||
| ≥3 symptoms | 1 [0.5%] | 0 | 1 [0.8%] | 0 | — | — | — | 1 [0.4%] | 0 | 1 [0.7%] | 0 | |||||
| HBT | CT-13910 Polymorphism | p4 | ||||||||||||||
|---|---|---|---|---|---|---|---|---|---|---|---|---|---|---|---|---|
| CC | CT | TT | ||||||||||||||
| Total | ≤5 years | 6−11 years | ≥12 years | p1 | Total | ≤5 years | 6−11 years | ≥12 years | p2 | Total | ≤5 years | 6−11 years | ≥12 years | p3 | ||
| (n = 227) | (n = 12) | (n = 148) | (n = 67) | (n = 195) | (n = 30) | (n = 127) | (n = 38) | (n = 71) | (n = 8) | (n = 51) | (n = 12) | |||||
| Absorption | 38 [16.7%] | 7 [58.3%] | 24 [16.2%] | 7 [10.4%] | 177 [90.7%] | 28 [93.3%] | 116 [91.3%] | 33 [86.8%] | 65 [91.6%] | 7 [87.5%] | 48 [94.1%] | 10 [83.3%] | <2.22 × 10⁻¹⁶ | |||
| Poor absorption | 18 [7.9%] | 2 [16.6%] | 12 [8.1%] | 4 [5.9%] | 0.001 | 11 [5.6%] | 1 [3.3%] | 7 [5.5%] | 3 [7.8%] | 0.850 | 5 [7%] | 1 [12.5%] | 2 [3.9%] | 2 [16.6%] | 0.412 | |
| Malabsorption | 171 [75.4%] | 3 [25%] | 112 [75.6%] | 56 [83.5%] | 7 [3.7%] | 1 [3.3%] | 4 [3.1%] | 2 [5.2%] | 1 [1.4%] | 0 | 1 [1.9%] | 0 | ||||
| Tolerance | 100 [44%] | 11 [91.6%] | 64 [43.4%] | 25 [37.3%] | 145 [74.3} | 20 [66.6%] | 103 [81.1%] | 22 [57.8%] | 43 [60.5%] | 5 [62.5%] | 31 [60.7%] | 7 [58.3%] | 1 | 2.26 × 10−09 | ||
| Intolerance | 127 [56%] | 1 [8.3%] | 84 [56.7%] | 42 [62.6%] | 0.002 | 50 [25.7%] | 10 [33.3%] | 24 [18.8%] | 16 [42.1%] | 0.009 | 28 [39.5%] | 3 [37.5%] | 20 [39.2%] | 5 [41.6%] | ||
| Total (n = 120) | Age Groups | p1 | Tolerance (n = 56) | Intolerance (n = 64) | p2 | |||
|---|---|---|---|---|---|---|---|---|
| ≤5 years (n = 6) | 6–11 years (n = 71) | ≥12 years (n = 43) | ||||||
| G/A-22018 polymorphism | <2.2 × 10⁻¹⁶ | 0.002 | ||||||
| GG | 84 [70%] | 1 [16.6%] | 47 [66.1%] | 36 [83.7%] | 31 [55.3%] | 53 [82.8%] | ||
| GA | 29 [24.1%] | 4 [66.6%] | 19 [26.7%] | 6 [13.9%] | 21 [37.5%] | 8 [12.5%] | ||
| AA | 7 [5.8%] | 1 [16.6%] | 5 [7%] | 1 [2.3%] | 4 [7.1%] | 3 [4.6%] | ||
| G allele frequency [%] | 82% | 50% | 79.50% | 90.60% | 74.10% | 89% | ||
| A allele frequency [%] | 18% | 50% | 20.50% | 9.40% | 25.90% | 11% | ||
| Number of dairy servings/week | ||||||||
| Mean ± SD | 12.89 ± 4.89 | 11.63 ± 3.14 | 12.87 ± 5.13 | 12.25 ± 4.71 | 0.46 | 13.35 ± 4.92 | 11.92 ± 4.80 | 0.165 |
| <7 | 10 [8.3%] | 0 | 6 [8.4%] | 5 [11.6%] | 3 [5.36%] | 8 [12.5%] | ||
| 7 | 8 [6.6%] | 1 [16.6%] | 5 [7%] | 2 [4.6%] | 4 [7.14%] | 4 [6.25%] | ||
| 7–10 | 16 [13.3%] | 3 [50%] | 6 [8.4%] | 9 [20.9%] | 7 [12.5%] | 9 [14.07%] | ||
| 11–14 | 40 [33.3%] | 2 [33.3%] | 25 [35.2%] | 12 [27.9%] | 20 [35.71%] | 20 [31.26%] | ||
| 14–17 | 31 [25.8%] | 0 | 21 [29.5%] | 9 [20.9%] | 11 [19.64%] | 22 [34.38%] | ||
| >17 | 14 [11.6%] | 0 | 8 [11.2%] | 6 [13.9%] | 11 [19.64%] | 1 [1.56%] | ||
| Number of milk servings/week | ||||||||
| 0 | 13 [10.8%] | 0 | 9 [12.6%] | 4 [9.4%] | 0.643 | 5 [8.93%] | 8 [12.5%] | 0.501 |
| 1–2 | 6 [5%] | 0 | 5 [7.2%] | 1 [2.3%] | 3 [5.36%] | 3 [4.69%] | ||
| 3–4 | 7 [5.8%] | 0 | 1 [1.4%] | 6 [13.9%] | 3 [5.36%] | 4 [6.26%] | ||
| 5–7 | 94 [78.4%] | 6 [100%] | 56 [78.8%] | 32 [74.4%] | 45 [80.36%] | 49 [76.56%] | ||
| Number of yogurt servings/week | ||||||||
| 0 | 19 [15.8%] | 1 [16.6%] | 11 [15.4%] | 7 [16.2%] | 0.213 | 8 [14.29%] | 11 [17.19%] | 0.238 |
| 1–2 | 15 [12.6%] | 0 | 8 [11.3%] | 7 [16.2%] | 5 [8.93%] | 10 [15.63%] | ||
| 3–4 | 30 [25%] | 3 [50%] | 15 [21.1%] | 12 [27.9%] | 15 [26.78%] | 15 [23.44%] | ||
| 5–7 | 56 [46.6%] | 2 [33.3%] | 37 [52.2%] | 17 [39.5%] | 28 [50%] | 28 [43.75%] | ||
| Number of cheese servings/week | ||||||||
| 0 | 34 [28.3%] | 4 [66.6%] | 18 [25.4%] | 12 [28.1%] | 0.872 | 17 [30.36%] | 17 [26.56%] | 0.317 |
| 1–2 | 37 [30.8%] | 2 [33.6%] | 24 [33.8%] | 11 [25.5%] | 12 [21.43%] | 25 [39.06%] | ||
| 3–4 | 23 [19.1%] | 0 | 12 [16.9%] | 11 [25.5%] | 13 [23.22%] | 10 [15.63%] | ||
| 5–7 | 26 [21.6%] | 0 | 17 [23.9%] | 9 [20.9%] | 14 [25%] | 12 [18.75%] | ||
| Estimated weekly milk intake | ||||||||
| Mean ± SD | 2604.58 ± 1477.60 | 2154.16 ± 579.56 | 2585.71 ± 1488.12 | 2698.25 ± 1554.54 | 0.972 | 2771.42 ± 1545.62 | 2458.51 ± 1411.40 | 0.459 |
| ≤500 mL | 10 [8.3%] | 0 | 7 [9.8%] | 3 [6.9%] | 3 [5.36%] | 7 [10.93%] | ||
| 500–1000 mL | 10 [8.3%] | 0 | 6 [8.4%] | 4 [9.3%] | 6 [10.72%] | 4 [6.25%] | ||
| 1000–2000 mL | 23 [19.1%] | 1 [16.6%] | 12 [16.9%] | 10 [23.2%] | 9 [16.08%] | 14 [21.87%] | ||
| 2000–3000 mL | 36 [30%] | 5 [83.3%] | 22 [30.9%] | 9 [20.9%] | 16 [25.59%] | 20 [31.24%] | ||
| 3000–4000 mL | 21 [17.5%] | 0 | 12 [16.9%] | 9 [20.9%] | 9 [16.08%] | 12 [18.75%] | ||
| 4000–5000 mL | 11 [9.1%] | 0 | 8 [11.2%] | 3 [6.9%] | 7 [12.53%] | 4 [6.26%] | ||
| >5000 mL | 9 [7.5%] | 0 | 4 [5.6%] | 5 [11.6%] | 6 [10.72%] | 3 [4.68%] | ||
| Phosphocalcic metabolism | ||||||||
| Calcium (mg/dL) | 9.79 ± 0.28 | 9.73 ± 0.23 | 9.82 ± 0.28 | 9.74 ± 0.27 | 0.401 | 9.81 ± 0.26 | 9.77 ± 0.29 | 0.308 |
| Phosphorous (mg/dL) | 4.77 ± 0.55 | 4.93 ± 0.46 | 4.88 ± 0.41 | 4.56 ± 0.70 | 0.001 | 4.82 ± 0.54 | 4.72 ± 0.55 | 0.317 |
| PTH (pg/mL) | 40.09 ± 16.64 | 39.83 ± 21.02 | 37.11 ± 14.03 | 45.04 ± 21.02 | 0.086 | 38.79 ± 14.38 | 41.23 ± 18.44 | 0.596 |
| 25-OH vitamin D (ng/mL) | 15.11 ± 6.24 | 15.16 ± 6.30 | 15.35 ± 6.70 | 14.72 ± 5.51 | 0.545 | 15.39 ± 6.21 | 14.87 ± 6.30 | 0.954 |
| Calcitriol (pg/mL) | 56.15 ± 15.60 | 61 ± 14.54 | 53.88 ± 13.03 | 61 ± 14.54 | 0.167 | 60.12 ± 16.53 | 52.67 ± 13.96 | 0.011 |
© 2020 by the authors. Licensee MDPI, Basel, Switzerland. This article is an open access article distributed under the terms and conditions of the Creative Commons Attribution (CC BY) license (http://creativecommons.org/licenses/by/4.0/).
Share and Cite
Couce, M.L.; Sánchez-Pintos, P.; González-Vioque, E.; Leis, R. Clinical Utility of LCT Genotyping in Children with Suspected Functional Gastrointestinal Disorder. Nutrients 2020, 12, 3017. https://doi.org/10.3390/nu12103017
Couce ML, Sánchez-Pintos P, González-Vioque E, Leis R. Clinical Utility of LCT Genotyping in Children with Suspected Functional Gastrointestinal Disorder. Nutrients. 2020; 12(10):3017. https://doi.org/10.3390/nu12103017
Chicago/Turabian StyleCouce, María L., Paula Sánchez-Pintos, Emiliano González-Vioque, and Rosaura Leis. 2020. "Clinical Utility of LCT Genotyping in Children with Suspected Functional Gastrointestinal Disorder" Nutrients 12, no. 10: 3017. https://doi.org/10.3390/nu12103017
APA StyleCouce, M. L., Sánchez-Pintos, P., González-Vioque, E., & Leis, R. (2020). Clinical Utility of LCT Genotyping in Children with Suspected Functional Gastrointestinal Disorder. Nutrients, 12(10), 3017. https://doi.org/10.3390/nu12103017